Impact Factor
- Issue 14; 2026
- Issue 13; 2026
- Issue 12; 2026
- Issue 11; 2026
- Issue 10; 2026
- Volume 16; 2026
- Advance Articles
- Past Issues
- Cover Images
- Cover Suggestion
- Index & Coverage
- Special Issues
Introduction
Materials and Methods
Results
Discussion
Conclusions
Supplementary Material
Acknowledgements
References
International Journal of Biological Sciences
International Journal of Medical Sciences
 Global reach, higher impact

Theranostics 2015; 5(9):919-930. doi:10.7150/thno.11863 This issue Cite
Research Paper
Single Cell Assay for Molecular Diagnostics and Medicine: Monitoring Intracellular Concentrations of Macromolecules by Two-photon Fluorescence Lifetime Imaging
Artem Pliss1, Xiao Peng2, Lixin Liu1,3, Andrey Kuzmin1, Yan Wang1, Junle Qu2 ![]() , Yuee Li1,4, Paras N Prasad1,5
, Yuee Li1,4, Paras N Prasad1,5 ![]()
1. Institute for Lasers, Photonics and Biophotonics and the Department of Chemistry, University at Buffalo, the State University of New York, Buffalo, NY 14260, USA
2. College of Optoelectronic Engineering, Shenzhen University, Key Laboratory of Optoelectronic Devices and Systems of Ministry of Education and Guangdong Province, Shenzhen, Guangdong, China 518060
3. School of Physics and Optoelectronic Engineering, Xidian University, Xi'an, Shaanxi, China 710071
4. School of information science and engineering, Lanzhou University, Lanzhou, Gansu, China, 730000
5. Department of Chemistry, Korea University, Seoul 136-701, Korea
Received 2015-2-11; Accepted 2015-4-3; Published 2015-5-15
Abstract

Molecular organization of a cell is dynamically transformed along the course of cellular physiological processes, pathologic developments or derived from interactions with drugs. The capability to measure and monitor concentrations of macromolecules in a single cell would greatly enhance studies of cellular processes in heterogeneous populations. In this communication, we introduce and experimentally validate a bio-analytical single-cell assay, wherein the overall concentration of macromolecules is estimated in specific subcellular domains, such as structure-function compartments of the cell nucleus as well as in nucleoplasm. We describe quantitative mapping of local biomolecular concentrations, either intrinsic relating to the functional and physiological state of a cell, or altered by a therapeutic drug action, using two-photon excited fluorescence lifetime imaging (FLIM). The proposed assay utilizes a correlation between the fluorescence lifetime of fluorophore and the refractive index of its microenvironment varying due to changes in the concentrations of macromolecules, mainly proteins. Two-photon excitation in Near-Infra Red biological transparency window reduced the photo-toxicity in live cells, as compared with a conventional single-photon approach. Using this new assay, we estimated average concentrations of proteins in the compartments of nuclear speckles and in the nucleoplasm at ~150 mg/ml, and in the nucleolus at ~284 mg/ml. Furthermore, we show a profound influence of pharmaceutical inhibitors of RNA synthesis on intracellular protein density. The approach proposed here will significantly advance theranostics, and studies of drug-cell interactions at the single-cell level, aiding development of personal molecular medicine.
Keywords: Fluorescence lifetime imaging (FLIM), two-photon excited fluorescence, macromolecular crowding, protein concentration, nuclear organization, nucleoplasm, nucleolus, nuclear speckles.
Introduction
One of the most intriguing problems in the post-genomic biomedical research is why the cells with identical genomes, demonstrate profound differences in metabolism, kinetics of individual biochemical processes and response to drug treatment. Therefore, a rapidly developing area of personal molecular medicine requires capability of comprehensive analysis and precise monitoring of cellular molecular organization and drug-cell interactions at the level of single cells and specific organelles.
It becomes increasingly recognized that numerous molecular processes inside live cells are governed by Brownian motion, wherein thousands of types of soluble macromolecules chaotically move and collide, and wherein specific molecular interactions are strictly probabilistic. At the same time, in the complex live cell environment, all biochemical reactions occur at significantly different pace than reactions in test-tubes. In this regards, it was shown that the rate of molecular diffusion, and thus probability of specific molecular interactions, correlate with concentration of all macromolecular species present within a cell. In this phenomenon, known as “macromolecular crowding”, the volume collectively occupied by all the cellular macromolecules is excluded from the volume where other molecules can diffuse and interact. Such a volume reduction, leads to an increase of effective concentration for interacting macromolecules and fundamentally changes kinetics and physical chemistry of macromolecular processes in the cell [1, 2].
The impact of macromolecular crowding on cellular molecular organization has been thoroughly studied using experimental, theoretical and computational approaches for several decades [3, 4]. Especially complex role of macromolecular crowding is played in eukaryotic cells, which are subdivided on multiple organelles with unique molecular environment. For example, modulation of molecular density in mitochondria was shown to regulate rates of metabolic processes in this organelle [5].
Furthermore, characterization of the local molecular density is especially important in studies of the eukaryotic cell nucleus - the largest cellular organelle, which harbors the genome and accommodates a multitude of essential molecular functions. Volume of the cell nucleus is highly compartmentalized, wherein numerous molecular processes occur within the specialized structure-function compartments. The nuclear compartments, also dubbed as “nuclear organelles”, represent agglomerates of complex macromolecules, which unlike organelles in the cytoplasm are not confined by any membranes, and dynamically interchange their molecular content with the surrounding nucleoplasm [6]. Although the molecular profiling of nuclear compartments has been actively pursued for several decades, leading to the discovery of specific biochemical processes [7] and modeling of molecular interactions at various crowding conditions [1, 3], our ability to analyze the physico-chemical properties of sub-nuclear sites lags behind. Estimated intranuclear concentrations of protein macromolecular complexes vary broadly depending on experimental methodology and type of studied cells. Obtained in different studies protein concentrations range between ~100 mg/ml in nucleoplasm, ~150 -160 mg/ml in the nuclear speckles, ~150-300 mg/ml in nucleolus [8-12] and 150-400 mg/ml in condensed chromatin [10, 13]. Recently, average concentration of macromolecules in the cell nucleus was estimated at 170-400 mg/ml [14], and reviewed in [15]. In addition to this disparity in reported concentrations, little is known about how the intranuclear concentrations of proteins correlate with the physiological state of a cell and whether they can significantly change along the cell development, although such information would have a fundamental significance. As an example, changes in the macromolecular concentration in the compartments accommodating splicing of pre-mRNA sequences (e.g. nuclear speckles) would influence expression rates for multiple genes, triggering corresponding changes in cellular homeostasis, viability and functions.
In the context of biomedicine, another important problem which has not been solved yet, is whether certain macromolecular concentrations in both cytoplasmic and nuclear organelles can serve as quantitative hallmarks of pathologic cellular transformations, such as cancer, although such link is hypothesized [16]. In this regards, a number of characteristic changes in the morphology of nuclear compartments, developing during the malignant transformations, have been identified and even utilized as prognostic markers [17-19]. However, we do not know whether changes in the morphology of nuclear compartments are accompanied with any changes in local molecular density, which limits the analysis of molecular processes at pathologic cellular states. Furthermore, in pharmaceutical field, the ability to monitor concentrations of macromolecules in the cells and subcellular domains would facilitate organelle-specific drug design [20].
Up to date, several approaches aimed at characterization of molecular density in the nuclear structures have been developed. One of them involves cell fractionation and isolation of the nuclear compartments [21], which on one hand provides for an all-inclusive biochemical characterization of nuclear structures, but on another cannot be used for assessment of live cells. In addition, isolation of nuclear compartments is cumbersome and prone to artifacts procedure, where the local molecular content cannot be fully preserved. Another common approach involves motion tracking of fluorescence reporters in the nuclear compartments of live cells [22, 23]. However, while this approach is valuable for comparative evaluation of the molecular permeability and different nuclear sites, it does not provide any direct information on the local concentrations of biomolecules.
More recently, the vibrational Raman spectroscopy technique was employed for the selective detection and concentration measurements of proteins, RNA, DNA and other types of biomolecules in the nuclear compartments [8, 10-12]. Albeit this approach is accurate and could be readily utilized in live cell studies, it typically does not allow for data acquisition in more than a single site in the cell nucleus at a time. Besides, determination of concentration values from the vibrational spectra requires time consuming data processing, which further limits the applications of this technique.
One of the most promising approaches for biomolecular concentration studies involves measurements of local refractive indexes (RI) in the nuclear compartments. In the biological cells, RIs are chiefly defined by the local concentrations of macromolecules, mainly proteins and ribonucleoproteins, while contributions of small organic and inorganic molecules are not substantial. Using the interferometry microscopy, the RI in the nuclear compartments of amphibian cells were measured, which enabled the estimation of local concentrations of proteins in these nuclear sites [9]. However, this RI measurement technique required an isolation of the nuclear compartments, which, inherently, cannot be applied for studies of physiological processes in live cells [9].
Recently, a novel tomographic phase microscopy was developed for measurements of RI in live cells [24]. However, this advanced microscopy method is dependent on the availability of sophisticated optical instrumentation and has not been validated for studies of microscopic subcellular sites, with the exception of nucleolus, the largest nuclear compartment with the highest RI [24].
Fluorescence lifetime imaging (FLIM), which maps fluorophore excited-state lifetimes within microscopic images [25], is an alternative and efficient technique for precise RI measurement in live cells. It is important to emphasize that fluorescence lifetime does not depend on photobleaching, light scattering and fluctuation of excitation light intensity. Therefore FLIM is more robust than fluorescence intensity based measurements and allows performing accurate cellular microenvironment analysis [26]. Combined with two-photon excitation fluorescence microscopy, FLIM has all inherent advantages of two-photon excited fluorescence, including high 3D resolution, reduced photodamage, enhanced penetration depth and high signal-to-noise ratio [27].
FLIM probing of molecular concentrations is based on an inverse quadratic relation between the fluorescence lifetime of a fluorophore and the local RI [28]. Specifically, the fluorescence lifetime (τ) is determined as a function of radiative and nonradiative pathways of fluorophore transition from excited to the ground level, as described by the equation: 1/τ = kr + knr; where kr and knr are the radiative and nonradiative decay rates, respectively. The kr is known as a function of the RI. The relation between fluorescence lifetime, (τ) and the RI in the fluorophore's vicinity, (n), is described by the Strickler-Berg equation.
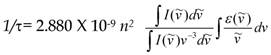
where (I) is the fluorescence emission intensity, ( ) is the extinction coefficient, and (
 ) is the wavenumber [29]. As follows from the equation, the fluorescence lifetime of a fluorophore is inversely dependent on the square of RI of the medium, which is the only known factor in a cellular environment changing the fluorescence lifetime in the absence of energy transfer. This dependence has been well validated both, by theoretical modeling and experimental measurements on fluorophores solutions [28, 30, 31]. Furthermore, FLIM approach has been utilized for probing of RIs in both fixed and live cells [32-34]. Nevertheless, to our knowledge, FLIM has never been utilized for measurements and monitoring of macromolecular concentrations in cell interior.
In the present communication, we describe and apply an efficient and facile FLIM-based technique for the measurement of protein concentrations in the cell in real-time. We determined protein concentration values in specific compartments of the cell nucleus, namely the nucleolus and the nuclear speckles. We also show that concentrations of proteins in subcellular domains are not static, but dynamically changing over the time. Treatment of the cells with common anti-cancer drug actinomycin D triggers drastic change in the macromolecular profiles of compartments of the cell nucleus. The approach proposed here provides computational biology and biophotonics tools for research in molecular theranostics.
Materials and Methods
Cell Culture, Transfection and Drug treatment
HeLa cells were grown in glass-bottom dishes (Mattek, Ashland, USA) and cultured in Advanced DMEM (Invitrogen, Carlsbad, USA), supplemented with 2.5% fetal calf serum (Sigma-Aldrich, St. Louis, USA) at 37 °C in a humidified atmosphere containing 5% CO2.
For fluorescence imaging of nucleolus and nuclear speckles cells were transfected with plasmids encoding for fibrillarin-GFP or ASF/SF2-GFP, respectively. In some experiments cells were transfected with histone H2B-GFP, as indicated.
The transfection of H2B-GFP, Fibrillarin-EGFP and ASF/SF2 -EGFP (Addgene, Cambridge, USA), was performed with 2 μg/ml of each type of plasmid per 35 mm dish, using Fugene 6 transfection reagent (Roche, Indianapolis, USA) according to manufacturer instructions. The fluorescence lifetime measurements were performed within 24-48 hours after the start of transfection. For inhibition of RNA synthesis cells were treated with 10 μg/ml actinomycin D (Sigma Aldrich, St Louis, USA) for up to 3 h, and for selective inhibition of RNA polymerase II cells were treated with 50 µg/ml 5,6-dichloro-1-beta-D-ribofuranosylbenzimidazole (DRB) (Sigma Aldrich, St Louis, USA) for up to 6 h.
For calibration of the fluorescence lifetime of GFP, and RI of the medium, cells were fixed in 4% formaldehyde in PBS for 10 minutes and immersed in solutions of glycerol with known RI (Sigma Aldrich, St Louis, USA).
FLIM imaging was performed under the physiological conditions, using a microscopy stage incubator.
For FLIM data acquisition, morphologically representative cells exhibiting moderate fluorescence signal were selected. Data for each experiment presented in the study was averaged from 15 cells or more.
Two-photon FLIM Microscopy
A Leica TCS SP2-AOBS Spectral Confocal Scanner mounted on a Leica DM IRE2 inverted fluorescent microscope was used for all imaging, spectral analyses, and other microscopic measurements. This microscope is equipped with a mode-locked Ti:Sapphire ultrafast laser (Chameleon from Coherent Inc., tunable from 690 to 1020 nm, 140 fs pulse width, 80 MHz repetition rate) for multiphoton excitation. The power under the microscope was controlled using neutral density filters and was maintained at ~10 mW for two-photon excitation fluorescence imaging. A 63× oil immersion objective (HCX PL APO CS 63× Oil/ NA 1.40) was used for all imaging studies. For FLIM measurements, time-correlated single-photon counting (TCSPC) technique was used with a Becker & Hickl SPC-830 unit. A Hamamatsu H7422 PMT was attached to the X1 port (an external port adapter in the Leica TCS-SP2 system for an external detector) through which the fluorescence signals were sent to the SPC-830 unit.
To obtain fluorescence lifetime images of cells expressing GFP, the 920nm ultrashort pulse laser was focused onto samples for scanning point-by-point within the chosen areas. This excitation wavelength is within the biological transparency window and we observed no measurable photo-toxicity in the studied cells. An IR-cut filter E700 SP (Chroma) and a customized band-pass filter HQ550/80 (Chroma) were used in front of the detector to specifically acquire GFP signals. All images were acquired at 128 × 128 pixels and the integration time for a single image was usually less than 2 minutes. The instrument response function IRF was generated using second-harmonic generation (SHG) from urea crystals. The obtained lifetime data was then analyzed by iterative reconvolution with the IRF using SPC-Image (Becker & Hickl) software. By using this software, the fluorescence decay values for each pixel in selected image areas were obtained. The instrument response function of our setup is demonstrated on the Supplementary Figure S1.
Calibration of Fluorescence Lifetime in Solutions with Different RI
As follows from the Strickler-Berg equation fluorescence lifetime of fluorophore inversely depends on the local RI. This inverse correlation between τ and RI was verified on our setup by FLIM measurements on Rhodamine 6G, which is a standard FLIM reporter, diluted in different glycerol concentrations (Supplementary Figure S2a). We also documented shortening of fluorescence lifetime of YOYO- DNA complex, when RI of the solution was increased by adding bovine serum albumin (Supplementary Figure S2b). Next, we calibrated this correlation for GFP to enable measurements of RI by the FLIM approach. In these experiments, the cells were transfected with a histone H2B-GFP construct. In our experimental procedure, cells expressing H2B-GFP were fixed in 4% PFA/PBS for 10 min, permeabilized in 0.2% glycerol for 5 min and immersed in either PBS, or 25%, 50% 75% solutions of glycerol in PBS with known RI. Measurements were averaged for each experiment and statistically analyzed by using a one-way ANOVA.
Calculation of Protein Concentrations
The cellular RI is mostly determined by protein macromolecules, including protein complexes with nucleic acids and lipids, while contributions of other organic and non-organic molecules are not significant [35]. Concentrations of proteins in nucleoplasm, nuclear speckles and nucleolus were calculated from the known RI, using earlier described approach [9]. Briefly, RI of an aqueous protein solution and the concentration of dissolved proteins are linked with the equation no = nw + αC, where no is the RI of the solution, nw is the RI of the solvent, C (g/cm3) is the concentration of proteins in the solution and α is the refractive index increment of the solute, which determines the change of no with change of C. Hence, C = (no - nw)/ α.
In our approximation, for the nw parameter, we selected RI of the serum-free cell culture medium (~1.336). For α we utilized 0.19 which is a refractive increment for “average” cellular protein or ribonucleoprotein [35]. To simplify data presentation, the calculated concentration values were converted from g/cm3 to mg/ml.
Results
Correlation among fluorescence lifetime of GFP, refractive index of a medium and local concentration of proteins in the cell
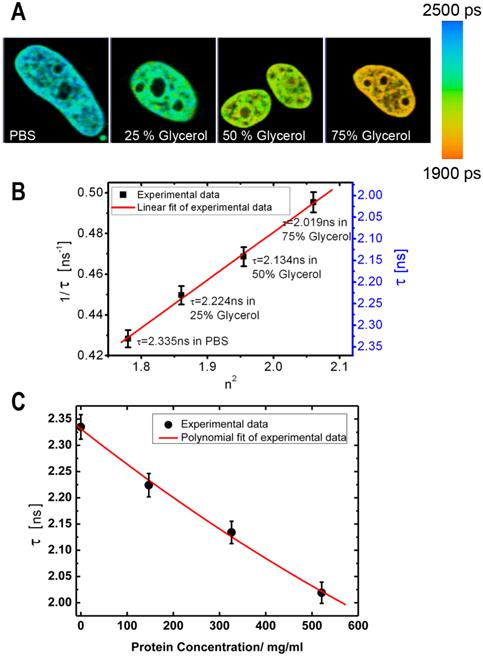
In our initial experiments we performed a calibration of fluorescence lifetime of GFP in buffers with different RI. The calibration was performed using cells expressing the histone H2B-GFP protein; we selected this protein for it relatively uniform distribution pattern, which facilitates the analysis of fluorescence lifetime across the cell nucleus. The cells were fixed and placed into series of concentrations of glycerol to increase the RI in the immediate environment of H2B-GFP. Then, the lifetime data for GFP in solutions with different RI were acquired. As demonstrated by FLIM images at Figure 1A, an increase of RI of glycerol media leads to a reduction in the fluorescence lifetime of H2B-GFP, which is consistent with previous findings of others and our group [32, 34]. To enable a simple matching of the fluorescence lifetime of GFP and RI of the media, we plotted the FLIM data onto a correlation chart (Fig. 1B). Using the approach of Handwerger et al., [9], we calculated the concentrations of proteins corresponding to each measured RI, as described in the Methods. Finally, the dependence between the fluorescence lifetime and sought concentration of proteins was plotted on the chart (Fig.1C).
Dependence of fluorescence lifetime on refractive index: (A) Fluorescence lifetime images of H2B-GFP in the cells, which were immersed into PBS or glycerol solutions of different concentration. From left to right: PBS, Glycerol 25%, Glycerol 50%, Glycerol 75% (% by weight). (B) Chart shows an inverse correlation between the square of the refractive index (n) and the fluorescence lifetime of GFP (τ) - (1/τ on the left and τ on the right Y axis). (C) Chart presents the dependence between the fluorescence lifetime of GFP and the estimated concentration of proteins. Error bars show the standard deviations.
Mapping of concentrations of macromolecules in nucleoplasm and in nuclear compartments
We validated the FLIM technique for monitoring of macromolecular concentrations in the cell nucleus on examples of two well-studied types of nuclear compartments: (i) the nucleolus, which is the site of ribosome biogenesis [36] and (ii) the nuclear speckles, which are the sites for storage and modifications of mRNA synthesis/processing machinery and for pre-mRNA splicing [6, 37]. Cells, transfected with either fibrillarin-GFP or ASF/SF2-GFP for visualization of nucleoli and nuclear speckles, respectively, were processed for imaging. FLIM images were generated and the fluorescence lifetime values for these proteins were analyzed. In our approach, first, we measured the fluorescence lifetime of GFP fusions; next using a calibration chart in Figure 1B we determined the RI in the subcellular environment of this fluorophore, and then we calculated the concentrations of protein macromolecules, which correspond to the measured RI values (Fig. 1C).
Fluorescence imaging of fibrillarin- and ASF/SF2- GFP fusions, demonstrated distinctive for these proteins accumulations in the nucleolus or the nuclear speckles, respectively. At the same time a significant fraction of these proteins was present in the nucleoplasm, outside of their nuclear compartments [22, 23]. Using these proteins as fluorescence lifetime probes, we observed considerable cell-to-cell variations in the intracellular concentrations of macromolecules.
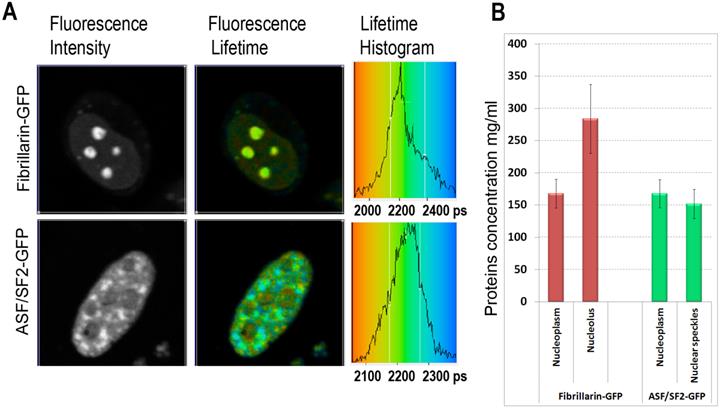
We found that the ASF/SF2-GFP molecules have approximately the same fluorescence lifetime, both in the nucleoplasm and in the nuclear speckles. The measurements in different cells were ranging from ~2180 to ~2250 picoseconds (Fig. 2A), which correspond to protein concentrations of ~230 mg/ml and 120 mg/ml in these regions of the cell nucleus, according to our calibration (Fig. 1C). The average protein concentration was ~168 mg/ml in the nucleoplasm and ~152 mg/ml inside the nuclear speckles; however this difference was not statistically significant. In contrast to ASF/SF2, which had relatively uniform fluorescence lifetime values across the cell nucleus, we found that the lifetime of fibrillarin-GFP strongly depends on its intranuclear location. In the nucleoplasm, the fluorescence lifetime for this protein was ranging from ~2180 ps to ~2270 ps (RI equivalent of 230 mg/ml and 90 mg/ml, respectively), which was close to data obtained with ASF/SF2-GFP. At the same time, fluorescence lifetime of fibrillarin-GFP was significantly shorter inside the nucleolus measuring 2110 ps to 2190 ps, which represents protein concentrations of 354 mg/ml and 217 mg/ml, respectively. The average fluorescence lifetime of fibrillarin-GFP in nucleolus was 2150 ps, which corresponds to ~284 mg/ml of protein concentration (Fig. 2B).
Mapping of the intracellular protein concentrations by using FLIM approach: (A) Fluorescence intensity images, fluorescence lifetime images, and corresponding lifetime histograms of fibrillarin-GFP and ASF/SF2-GFP (in picoseconds). (B) Estimated average protein concentration for the nucleolus, nuclear speckles and the nucleoplasm. Error bars show the standard deviations.
Monitoring of macromolecular concentrations in the same nuclear compartments
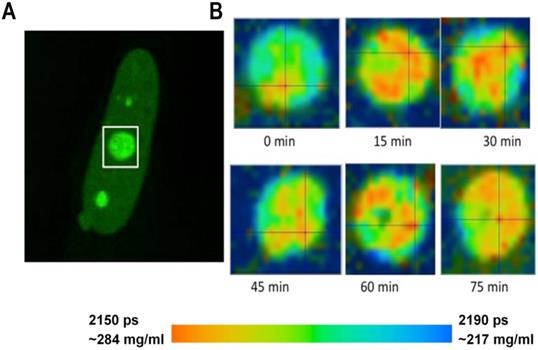
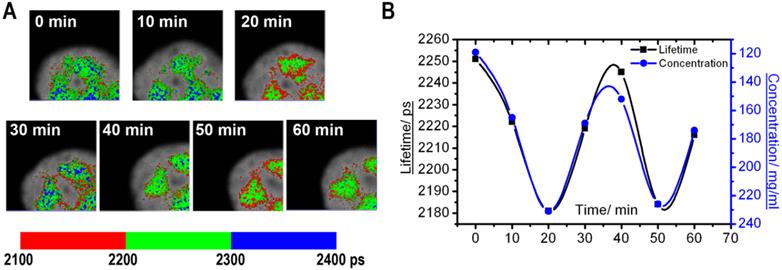
FLIM imaging has shown that the fluorescence lifetimes and the corresponding concentrations of proteins were relatively uniform in the nuclear speckles. At the same time, in the nucleolus, we could frequently distinguish sub-domains with different RI, evidently reflecting a higher-order heterogeneous molecular structure of this nuclear domain [38]. To explore how the molecular structure of nucleolus may change in time, we performed a number of time-lapse studies wherein the FLIM data were sequentially acquired from the same cell with 10-20 min intervals. In cells expressing fibrillarin-GFP, our data has revealed that the intranucleolar distribution of proteins is highly dynamic. The fluorescence lifetime values indicated that the molecular density in various nucleolar domains changed considerably over time. An example of dynamic changes in distribution of proteins in the nucleolus is shown in Figure 3. We observed that concentration of proteins in different parts of the nucleolus changes by several tens of milligrams at subsequent FLIM image acquisitions.
Monitoring of the fluorescence lifetime of Fibrillarin-GFP: (A) Intensity image of fibrillarin-GFP expressing cell. Nucleolus in white rectangle was acquired every 15 min. (B) Time sequenced FLIM images of nucleolus. A color-coded image demonstrates changing distribution of fluorescence lifetime values and corresponding concentrations of nucleolar proteins at each time point.
A different type of molecular dynamics was found in the nuclear speckles. In these nuclear domains, the molecular concentration appeared more homogeneous than in the nucleolus. At the same time, the average fluorescence lifetime periodically fluctuated. These changes were synchronous for different nuclear speckles located in the same cell nucleus (Fig. 4). Overall, our time-lapse experiments revealed that the fluorescence lifetime within the same nuclear domain is not static, but is dynamically changed over the time, which indicates that nuclear compartments undergo through constant changes in concentration of macromolecules.
Monitoring of the fluorescence lifetime of ASF/SF2-GFP: (A) A high magnification of nuclear speckles is shown. Same cell area was scanned with 10 min intervals, and the FLIM images were generated. (B) Charts demonstrate changes in average fluorescence lifetime (black) and corresponding protein concentrations (blue) in the nuclear speckles shown at (A).
Drug-induced changes in global proteins distribution
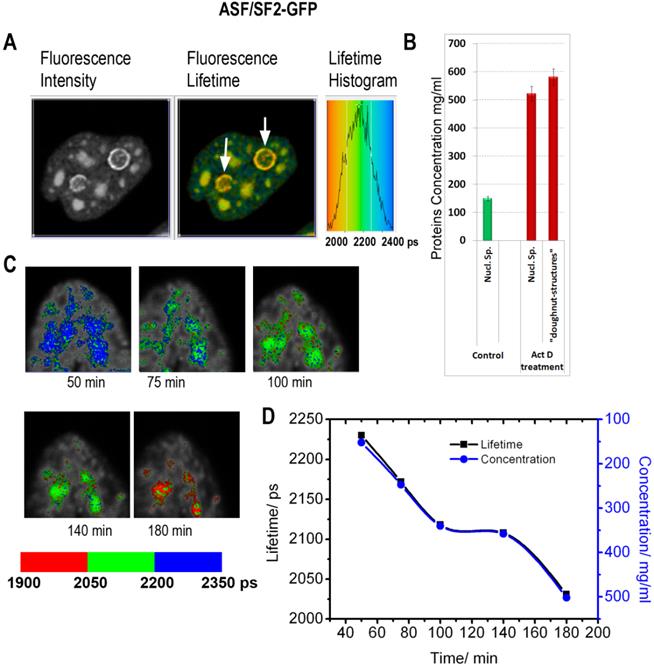
Cells treated with inhibitors of RNA synthesis exhibit profound changes in the morphology of the nuclear speckles and the nucleolus. Here we utilized FLIM approach, to investigate whether the drug-induced morphological transformations are accompanied with the changes in local macromolecular concentrations. In the first series of experiments, the cells expressing ASF/SF2-GFP were incubated with actinomycin D, which is a known cancer drug, intercalating into the DNA and inhibiting RNA synthesis by all three classes of RNA polymerase. Consistent with previous reports, monitoring of ASF/SF2-GFP signal revealed an enlargement of the nuclear speckles and emergence of doughnut-shaped structures in vicinity to nucleolus, in response to actinomycin D treatment [37].
The fluorescence lifetime values indicate that the drug treatment leads to a substantial increase in the protein molecular density in the nuclear speckles from ~150 mg/ml found in non-treated cells to an average ~525 mg/ml following the actinomycin D treatment (Fig. 5). Furthermore, the doughnut-shaped structures in the treated cells were found to accommodate very high concentrations of proteins at nearly ~600 mg/ml. This concentration range is not expected for soluble proteins, however, protein clustering is known during the drug-induced apoptosis development [39]. Thus, emergence of highly concentrated agglomerates of proteins, likely represents a hallmark of apoptotic cells.
Inhibition of RNA synthesis by actinomycin D induces changes in subnuclear protein density: (A) The fluorescence intensity image, the fluorescence lifetime image and the fluorescence lifetime histogram are shown for the cell expressing ASF/SF2-GFP and treated by actinomycin D for 3h. White arrows point to doughnut-shaped structures, which emerge in response to the drug treatment. (B) Averaged protein concentrations in the nuclear speckles before the drug treatment and in drug-treated cells (both in nuclear speckles and in the doughnut-shaped structures). Error bars show the standard deviations. (C) FLIM monitoring of the nuclear speckles in a course of actinomycin D treatment. (D) Dynamic changes of fluorescence lifetime values (black) and corresponding concentrations of proteins (blue) in the nuclear speckles during actinomycin D treatment. The plot is generated from data shown in (C).
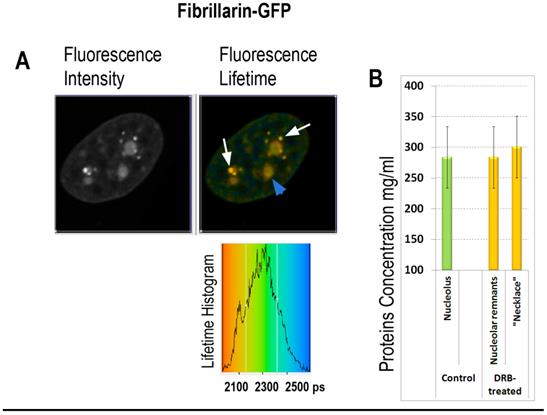
In the second group of experiments the influence of 5,6-dichloro-1-beta-D-ribofuranosylbenzimidazole (DRB) was investigated. This drug inhibits pre-mRNA synthesis by RNA polymerase II, and induces reorganization of nucleolus, wherein DNA with ribosomal genes unwinds from nucleoli into necklace-beads like structure. Strikingly, in DRB treated cells, synthesis of ribosomal RNA continues in the “beads” of “necklace” [40]. Our FLIM data shows roughly the same fluorescence lifetime values in remnants of the nucleoli of and in necklace-like structures of DRB- treated cells as in the nucleoli untreated cells (2150 and 2140 picoseconds respectively), roughly corresponding to 280-290 mg/ml of proteins concentration (Fig. 6). These data suggest that RI of nucleolus is dependent on synthesis of ribosomal RNA, while selective inhibition of mRNA synthesis by DRB has no significant effect on molecular density of nucleolus during first hours of drug treatment.
FLIM imaging of fibrillarin-GFP in the DRB treated cell: (A) Fibrillarin-GFP: the fluorescence intensity image, the fluorescence lifetime image and the fluorescence lifetime histogram are shown. Fibrillarin GFP is accumulated in the necklace beads-like structures (indicated by white arrows) and in the nucleolar remnants (indicated by blue arrowhead). (B) Averaged fluorescence lifetimes in the nucleoli and in the bead-like structures before and after the DRB treatment, as indicated.
Discussion
Essential biochemical activities in the cell rely on purely stochastic processes, such as Brownian diffusion and random interactions of biomolecules [41]. At the same time, all molecular reactions in the cell are strongly affected by the local concentrations of macromolecules (i.e. macromolecular crowding phenomenon), which represents one of the fundamental regulatory mechanisms in the cell [4]. However, although the probing of macromolecular concentrations in specific cellular structures can significantly advance studies of cellular regulation, identify real-time markers of cellular heterogeneity and enable new type of molecular diagnostic of cellular state, such capabilities in current technology are very limited.
This communication employs a FLIM approach to determine and monitor local concentrations of macromolecules in live cells. An important benefit of this technique is a high efficiency, wherein concentration values in the cells can be obtained within only several minutes. This is an inherent advantage of FLIM as compared to vibrational spectroscopy, another approach which is utilized for this task in live cells [8, 10-12, 39]. Our study demonstrated that this new FLIM approach is capable of monitoring an overall concentration of proteins in individual nuclear compartments, as well as in the surrounding nucleoplasm, - a protoplasm of the cell nucleus.
The obtained results in previous studies demonstrated that macromolecular concentrations broadly vary between ~75 and ~450 mg/ml [3, 10, 14, 42]. The average concentrations of proteins, obtained in the present study for the nucleoplasm, the compartment of nuclear speckles, and the nucleolus (Fig. 2), and are within the previously established range of values.
Earlier, our estimations using vibrational Raman spectroscopy [8, 10-12, 39] demonstrated the overall protein concentration of ~115 mg/ml for nuclear speckles and ~150 mg/ml for nucleolus. The nucleolar composition was also enriched with ~30-40 mg/ml of RNA [8, 11, 12], ~10 mg/ml of lipids and trace amounts of DNA. A larger proteins concentration in nucleolus, obtained by FLIM (~284 mg/ml), can be derived from several factors. Raman spectroscopy measurements rely on a concentration calibration procedure, in which intensities of spectral Raman bands obtained for a selected model protein, such as bovine serum albumin, are used as the concentration standard for all nucleolar proteins. At the same time, mismatches inherently existing between any model protein and native nucleolar proteins would influence the concentration estimation. On the other hand, the FLIM measurement technique has its own limitations. In particular, conversion of RI to protein concentration depends on the refractive increment value used. We utilized a generally accepted refractive increment of ~0.19, although this value may be different for averaged nucleolar proteins. In addition, the nucleolus is known to contain a pool of lipids [8, 11, 12], which generally exhibit higher RI than proteins, and thus may bias the FLIM-based measurements of macromolecular concentrations.
It is useful to compare our data with that of classical refractometry study of the cell nuclear compartments by the group of Joseph Gall. In that study, nuclear domains were isolated from amphibian oocytes and concentrations of proteins of 106, 162 and 215 mg/ml in the nucleoplasm, nuclear speckles and nucleolus respectively, were reported [9], which is close to our results for human cells (Fig 2). Some data differences can be attributed both to variations presumably existing between different cell lineages and different methodologies.
An important advantage of the FLIM approach is the ability to monitor changes in macromolecular concentrations over time, unachievable by conventional refractometry techniques. Moreover, two-photon excitation used in our FLIM imaging significantly reduces the cellular photodamage as compared to a single-photon FLIM, which is valuable in time sequenced studies of live cells. Using FLIM technique, we have observed dynamic changes of concentrations of macromolecules in the nucleoli and in the nuclear speckles (Fig. 3 and Fig. 4). We believe that such changes can reflect the dynamics of gene expression. It has been postulated in the systems biology field, that gene expression is a fundamentally stochastic process, wherein global rates of RNA production in the cell are stochastically changed, together with the abundance of participating molecules (e.g. nucleotides, RNA polymerases, transcription factors, etc.) [41]. In this regards, fluctuations of macromolecular concentrations in the nucleolus (Fig. 3) may directly reflect changes of RNA synthesis levels and ribosome assembly in this nuclear compartment. At the same time, nuclear speckles are predominantly associated with splicing of mRNA and storage/modifications of macromolecular complexes involved in the pre-mRNA synthesis machinery. Hence, periodical fluctuations of macromolecular concentrations shown in Fig. 3 may influence the rates of these global cellular processes.
An important outcome of our study is documentation of significant cell-to-cell variations in the macromolecular concentrations in nucleoplasm, nucleoli and the nuclear speckles (Fig. 2), which is also consistent with our previous study using Raman spectrometry [11]. Considering the correlation between the macromolecular concentration and kinetics of molecular interactions, known as a macromolecular crowding effect, such concentration variations clearly signify cell-to-cell differences in the rates of molecular processes associated with distinct nuclear compartments.
In the study of drug-cell interactions we have chosen common anti-cancer drug actinomycin D and DRB. These drugs differ in the molecular mechanism of action. Actinomycin D intercalates into DNA and causes irreversible changes in levels of RNA synthesis, leading to cell death [43]. In comparison, DRB influences selectively activity of RNA polymerase II, whereas the synthesis by RNA polymerase I and -III remains unaltered and its action is reversible, upon removal of DRB [40]. In classical cell biology, transformations of cell nuclear architecture in response to inhibition of RNA polymerase II activity by DRB and actinomycin D have been extensively studied. Actinomycin D is well known to induce enlargement of the nuclear speckles and redistribution of many components of nuclear speckles to the “doughnut-shaped” structures around the nucleolus [37]. At the same time despite extensive morphological studies, comprehensive characterization of molecular changes in the cellular structure has not been accomplished yet. The FLIM technique uniquely provides quantitative characterization of the intracellular molecular environment during these transformations. We found that the “doughnut-shaped” structures contain proteins in concentrations up to 600 mg/ml (Fig. 5). These concentrations may exceed proteins solubility and are indicative of precipitation process. We suggest that such high concentrations in drug-treated cells could be hallmarks of irreversible changes in cellular organizations, leading to cell death. Remarkably, the FLIM approach may enable for early detection of the drug effect, before any characteristic changes in the morphology of actinomycin D treated cells became apparent (Fig. 5). Such sensitivity is valuable for monitoring of the drug effect on the cell. Current technology is limited in identification of subtle changes in the cellular metabolism at early stages of the drug treatment. The FLIM approach overcomes this limitation.
Furthermore, probing of macromolecular concentrations by the FLIM technique is independent of cell morphology, which enables reliable control of organelles function. In the DRB treated cells, we found that despite significant transformations of cellular structure (Fig. 6), this drug does not cause emergence of protein agglomerates, which is consistent with reversible nature of DRB action [44]. Remarkably, concentration of proteins in disintegrated nucleoli of the treated cells did not significantly change.
In conclusion, our study suggests that concentrations of macromolecules in distinct organelles can serve as real-time indicators of cellular heterogeneity and for monitoring of cellular transformations during disease development or drug action, thus enabling new type of molecular diagnostic of cellular state.
Conclusions
In this communication, we introduce and experimentally validate a new type of bioanalytical single-cell assay, wherein the overall concentration of cellular macromolecules is estimated in specific structure-function compartments of the cell nucleus as well as in nucleoplasm. Mapping of local biomolecular concentrations is performed via measurements of fluorescence lifetime of fluorophores, applying a two-photon excited fluorescence lifetime imaging (FLIM) technique. Using the new assay, we estimated concentrations of proteins in nucleolus and nuclear speckles at ~ 284 and ~150 mg/ml in average. We found that concentrations of biomolecules periodically fluctuate in time indicating changes in the kinetics of biochemical reactions. We also report significant changes in protein concentration values in response to the actinomycin D drug treatment, apparently resulting from emergence of intracellular protein precipitations.
The proposed single-cell FLIM assay can enable rapid and noninvasive analysis of cell-to-cell variations and cell-function related classification of the cellular heterogeneity. As such, our approach can contribute to interdisciplinary research on the interface between medicine, cell physiology and systems biology. We believe that our approach will be a valuable tool for studies of drug-cell interactions, at the single-cell level, enabling early detection and novel categorization of cellular response to drug treatment and supporting development of personal molecular medicine.
Supplementary Material
Figures S1-S2.
Acknowledgements
Project has been partially supported by the National Basic Research Program of China (Grant No. 2015CB352005), National Natural Science Foundation of China (61378091, 11204226, and 61405123), Natural Science Foundation of Shaanxi Province (2014JM8324) and China Scholarship Council.
Competing Interests
The authors have declared that no competing interest exists.
References
1. Zhou HX, Rivas GN, Minton AP. Macromolecular crowding and confinement: Biochemical, biophysical, and potential physiological consequences. Annual Review of Biophysics. 2008;37:375-97
2. Matera AG, Izaguire-Sierra M, Praveen K, Rajendra TK. Nuclear Bodies: Random Aggregates of Sticky Proteins or Crucibles of Macromolecular Assembly? Dev Cell. 2009;17:639-47
3. Ellis RJ. Macromolecular crowding: an important but neglected aspect of the intracellular environment (vol 11, pg 114, 2001). Curr Opin Struc Biol. 2001;11:500
4. Mourao MA, Hakim JB, Schnell S. Connecting the Dots: The Effects of Macromolecular Crowding on Cell Physiology. Biophys J. 2014;107:2761-6
5. Scalettar BA, Abney JR, Hackenbrock CR. Dynamics, Structure, and Function Are Coupled in the Mitochondrial Matrix. P Natl Acad Sci USA. 1991;88:8057-61
6. Spector DL. SnapShot: Cellular bodies. Cell. 2006;127:1071
7. Zimber A, Nguyen QD, Gespach C. Nuclear bodies and compartments: Functional roles and cellular signalling in health and disease. Cell Signal. 2004;16:1085-104
8. Pliss A, Kuzmin AN, Kachynski AV, Jiang HB, Hu ZX, Ren Y. et al. Nucleolar Molecular Signature of Pluripotent Stem Cells. Anal Chem. 2013;85:3545-52
9. Handwerger KE, Cordero JA, Gall JG. Cajal bodies, nucleoli, and speckles in the Xenopus oocyte nucleus have a low-density, sponge-like structure. Mol Biol Cell. 2005;16:202-11
10. Pliss A, Kuzmin AN, Kachynski AV, Prasad PN. Nonlinear Optical Imaging and Raman Microspectrometry of the Cell Nucleus throughout the Cell Cycle. Biophys J. 2010;99:3483-91
11. Kuzmin AN, Pliss A, Kachynski AV. Biomolecular component analysis of cultured cell nucleoli by Raman microspectrometry. J Raman Spectrosc. 2013;44:198-204
12. Kuzmin AN, Pliss A, Prasad PN. Changes in Biomolecular Profile in a Single Nucleolus during Cell Fixation. Anal Chem. 2014;86:10909-16
13. Bohrmann B, Haider M, Kellenberger E. Concentration Evaluation of Chromatin in Unstained Resin-Embedded Sections by Means of Low-Dose Ratio-Contrast Imaging in Stem. Ultramicroscopy. 1993;49:235-51
14. Nolin F, Michel J, Wortham L, Tchelidze P, Balossier G, Banchet V. et al. Changes to cellular water and element content induced by nucleolar stress: investigation by a cryo-correlative nano-imaging approach. Cell Mol Life Sci. 2013;70:2383-94
15. Hancock R. The Crowded Nucleus. Int Rev Cel Mol Bio. 2014;307:15-26
16. Matsuda H, Putzel GG, Backman V, Szleifer I. Macromolecular Crowding as a Regulator of Gene Transcription. Biophys J. 2014;106:1801-10
17. Salomoni P, Pandolfi PP. The role of PML in tumor suppression. Cell. 2002;108:165-70
18. Zaidi SK, Young DW, Javed A, Pratap J, Montecino M, van Wijnen A. et al. Nuclear microenvironments in biological control and cancer. Nat Rev Cancer. 2007;7:454-63
19. Fischer AH, Bardarov S, Jiang Z. Molecular aspects of diagnostic nucleolar and nuclear envelope changes in prostate cancer. J Cell Biochem. 2004;91:170-84
20. Weissig V, D'Souza GGM. Organelle-specific pharmaceutical nanotechnology. Hoboken, NJ: Wiley. 2010
21. Andersen JS, Lam YW, Leung AKL, Ong SE, Lyon CE, Lamond AI. et al. Nucleolar proteome dynamics. Nature. 2005;433:77-83
22. Phair RD, Misteli T. High mobility of proteins in the mammalian cell nucleus. Nature. 2000;404:604
23. Grunwald D, Martin RM, Buschmann V, Bazett-Jones DP, Leonhardt H, Kubitscheck U. et al. Probing intranuclear environments at the single-molecule level. Biophys J. 2008;94:2847-58
24. Choi W, Fang-Yen C, Badizadegan K, Oh S, Lue N, Dasari RR. et al. Tomographic phase microscopy. Nat Methods. 2007;4:717-9
25. van Munster EB, Gadella TWJ. Fluorescence lifetime imaging microscopy (FLIM). Adv Biochem Eng Biot. 2005;95:143-75
26. Wallrabe H, Periasamy A. Imaging protein molecules using FRET and FLIM microscopy. Curr Opin Biotech. 2005;16:19-27
27. Denk W, Strickler JH, Webb WW. Two-photon laser scanning fluorescence microscopy. Science. 1990;248:73-6
28. Suhling K, Siegel J, Phillips D, French PMW, Leveque-Fort S, Webb SED. et al. Imaging the environment of green fluorescent protein. Biophys J. 2002;83:3589-95
29. Strickler SJ, Berg RA. Relationship between Absorption Intensity and Fluorescence Lifetime of Molecules. The Journal of Chemical Physics. 1962;37:814-22
30. Toptygin D. Effects of the solvent refractive index and its dispersion on the radiative decay rate and extinction coefficient of a fluorescent solute. J Fluoresc. 2003;13:201-19
31. Suhling K, Davis DM, Phillips D. The influence of solvent viscosity on the fluorescence decay and time-resolved anisotropy of green fluorescent protein. J Fluoresc. 2002;12:91-5
32. Tregidgo C, Levitt JA, Suhling K. Effect of refractive index on the fluorescence lifetime of green fluorescent protein. J Biomed Opt. 2008:13
33. van Manen HJ, Verkuijlen P, Wittendorp P, Subramaniam V, van den Berg TK, Roos D. et al. Refractive index sensing of green fluorescent proteins in living cells using fluorescence lifetime imaging microscopy. Biophys J. 2008;94:L67-L9
34. Pliss A, Zhao LL, Ohulchanskyy TY, Qu JL, Prasad PN. Fluorescence Lifetime of Fluorescent Proteins as an Intracellular Environment Probe Sensing the Cell Cycle Progression. Acs Chem Biol. 2012;7:1385-92
35. Zhao HY, Brown PH, Schuckt P. On the Distribution of Protein Refractive Index Increments. Biophys J. 2011;100:2309-17
36. Raska I, Shaw PJ, Cmarko D. Structure and function of the nucleolus in the spotlight. Curr Opin Cell Biol. 2006;18:325-34
37. Lamond AI, Spector DL. Nuclear speckles: A model for nuclear organelles. Nat Rev Mol Cell Bio. 2003;4:605-12
38. Raska I, Shaw PJ, Cmarko D. New insights into nucleolar architecture and activity. Int Rev Cytol. 2006;255:177
39. Pliss A, Kuzmin AN, Kachynski AV, Prasad PN. Biophotonic probing of macromolecular transformations during apoptosis. P Natl Acad Sci USA. 2010;107:12771-6
40. Bensaude O. Inhibiting eukaryotic transcription: Which compound to choose? How to evaluate its activity? Transcription. 2011;2:103-8
41. Raj A, van Oudenaarden A. Nature, Nurture, or Chance: Stochastic Gene Expression and Its Consequences. Cell. 2008;135:216-26
42. Hancock R. A role for macromolecular crowding effects in the assembly and function of compartments in the nucleus. J Struct Biol. 2004;146:281-90
43. Perry RP, Kelley DE. Inhibition of Rna Synthesis by Actinomycin-D - Characteristic Dose-Response of Different Rna Species. J Cell Physiol. 1970;76:127
44. Zandomeni R, Mittleman B, Bunick D, Ackerman S, Weinmann R. Mechanism of Action of Dichloro-Beta-D-Ribofuranosylbenzimidazole - Effect on Invitro Transcription. P Natl Acad Sci-Biol. 1982;79:3167-70
Author contact
![]() Corresponding author: pnprasadedu and: jlqu70com
Corresponding author: pnprasadedu and: jlqu70com