Impact Factor
 Global reach, higher impact
Theranostics 2017; 7(1):144-152. doi:10.7150/thno.15987 This issue Cite
Research Paper
Microbubble gas volume: A unifying dose parameter in blood-brain barrier opening by focused ultrasound
Kang-Ho Song1,2, Alexander C. Fan1,2, Joshua J. Hinkle2, Joshua Newman2, Mark A. Borden1 ![]() , Brandon K. Harvey2
, Brandon K. Harvey2 ![]()
1. Department of Mechanical Engineering, University of Colorado, Boulder, CO 80309.
2. Intramural Research Program, National Institute on Drug Abuse, Baltimore, Maryland, 21224.
Received 2016-4-27; Accepted 2016-8-18; Published 2017-1-1
Abstract

Focused ultrasound with microbubbles is being developed to transiently, locally and noninvasively open the blood-brain barrier (BBB) for improved pharmaceutical delivery. Prior work has demonstrated that, for a given concentration dose, microbubble size affects both the intravascular circulation persistence and extent of BBB opening. When matched to gas volume dose, however, the circulation half-life was found to be independent of microbubble size. In order to determine whether this holds true for BBB opening as well, we independently measured the effects of microbubble size (2 vs. 6 µm diameter) and concentration, covering a range of overlapping gas volume doses (1-40 µL/kg). We first demonstrated precise targeting and a linear dose-response of Evans Blue dye extravasation to the rat striatum for a set of constant microbubble and ultrasound parameters. We found that dye extravasation increased linearly with gas volume dose, with data points from both microbubble sizes collapsing to a single line. A linear trend was observed for both the initial sonication (R2=0.90) and a second sonication on the contralateral side (R2=0.68). Based on these results, we conclude that microbubble gas volume dose, not size, determines the extent of BBB opening by focused ultrasound (1 MHz, ~0.5 MPa at the focus). This result may simplify planning for focused ultrasound treatments by constraining the protocol to a single microbubble parameter - gas volume dose - which gives equivalent results for varying size distributions. Finally, using optimal parameters determined for Evan Blue, we demonstrated gene delivery and expression using a viral vector, dsAAV1-CMV-EGFP, one week after BBB disruption, which allowed us to qualitatively evaluate neuronal health.
Keywords: ultrasound contrast agent, drug delivery, gene therapy, pharmacokinetics.
Introduction
The blood brain barrier (BBB) is an obstacle in the treatment of neurological diseases and disorders owing to the impermeability of the tight-junction-rich brain vasculature to hydrophilic molecules larger than ~400 Da. Surgical approaches with syringe needles are highly invasive, and chemical agents used to breach the BBB may induce off-target effects. Intravenously delivered ligand-receptor based delivery schemes are attractive due to their targeting potential, but such vehicles are limited in their specificity, affinity and overall ability to deliver sufficient quantities of therapeutic agent through active transport mechanisms (1). BBB disruption using intravenously administered microbubbles stimulated with focused ultrasound (FUS) is an attractive noninvasive approach for permeabilizing the BBB due to its transient effect on vasculature (2-4), as well as its ability to target specific brain regions utilizing stereotaxic coordinates (5) and image guidance (6). Of particular interest, FUS-targeted gene delivery to the brain has been demonstrated with intravenously injected microbubbles and adeno-associated viral vectors (7-11). These studies indicate that FUS with microbubbles may be an excellent tool to deliver nucleic acids for research and treatment of neurological diseases and disorders, such as Parkinson's disease. The goal of the present study was to further develop the technique for gene delivery to the rat striatum.
Exploration of the effects of BBB disruption parameters has primarily focused on acoustic parameters, such as frequency, amplitude, pulse length and pulse repetition frequency (5,12-16). A few studies have also examined microbubble parameters, such as size and concentration. As expected, the extent of BBB disruption was shown to increase with microbubble concentration (17,18). When matched for concentration, larger microbubbles were shown to increase the extent of BBB opening compared to smaller microbubbles (5,13,16).
The effect of microbubble size has also investigated for persistence in circulation in vivo (19). When matched for concentration, 6-μm diameter bubbles circulated over tenfold longer than 2-µm bubbles. The larger microbubbles were also much more echogenic for ultrasound imaging. However, when matched for gas volume dose (using 27-fold more 2-µm bubbles than 6-µm bubbles), the half-life was equivalent.
To our knowledge, the effect of gas volume dose on BBB opening, determined by independently changing both microbubble size and concentration, had not been investigated. It was therefore unclear whether molecular delivery will scale with microbubble diameter, even at the same volume dose, owing to different acoustic activity and microbubble-endothelium interactions. Our study was designed to address this knowledge gap.
To independently examine the effects of microbubble size and volume, we performed BBB permeabilization studies in rats using two size-isolated microbubble formulations (2- and 6-µm diameter). We used a concentration range with overlapping volume doses (1-40 µL/kg) for both sizes, and utilized a reference dose of 20 µL/kg, which was similar to conditions previously used to successfully promote BBB permeabilization (16). The left and right striata of the rat brain were selected as BBB disruption targets, as these regions are well-defined, large anatomical structures in the brain, and are common targets for evaluating therapeutics in rodent models of Parkinson's disease (20). To characterize microbubble persistence under multi-site BBB disruption, the left striatum was sonicated immediately after the right striatum, following a single injection of microbubbles and Evans Blue dye. Lastly, we demonstrated the ability to deliver a biologically relevant agent, a double-stranded adeno-associated virus (dsAAV1-CMV-eGFP), and qualitatively evaluate neuronal health one week after sonication.
Material and Methods
Materials
Size-isolated cationic microbubbles (MB) were obtained from Advanced Microbubble Laboratories (Boulder, CO, USA) with the following diameters: 2-, 6-µm; and shell composition: 70 mol% 1,2-distearoyl-sn-glycero-3-phosphocholine (DSPC), 20 mol% 1,2-distearoyl-3-trimethylammonium-propane (DSTAP) and 10 mol% 1,2-distearoyl-sn-glycero-3-phosphoethanolamine-N-[(polyethylene glycol)-2000] (DSPE-PEG-2K). Cationic microbubbles have been shown to enhance microbubble-endothelium surface interactions compared to neutral microbubbles (21), and demonstrated less adherence to leukocytes in a classical ischemia-reperfusion damage model (22). Microbubble size and concentration were measured using a Z2 Coulter counter (Beckman Coulter, Sharon Hill, PA). Evans Blue (EB) powder (Sigma Aldrich, St. Louis, MO) was solubilized in phosphate buffered saline (PBS, pH 7.4, Thermo Fisher Scientific, Waltham, MA). For EB concentration vs. intensity measurements, microbubbles and saline (0.9% NaCl) were mixed to generate 4 mL/kg total injection volumes containing 1, 2 or 4 wt% EB and 4×108 MB/kg bodyweight. For microbubble concentration vs. intensity measurements, 4×10⁸, 2×10⁹ and 4×109 MB/kg of 2-µm MB, or 4×10⁷, 2×10⁸ and 4×108 MB/kg of 6-µm MB were mixed with 4 mL/kg of 2 wt% EB solution.
BBB disruption
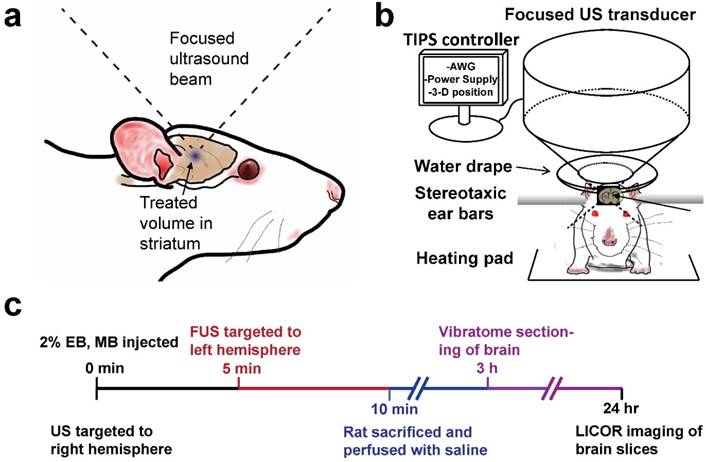
In vivo BBB disruptions were conducted using a Therapy Imaging Probe System (TIPS) focused ultrasound transducer and controller (Philips, Briarcliff, NY). Thirty-three adult male Sprague Dawley Rats weighing 300-400 g and 13-15 weeks of age were utilized for this study in accordance with National Institutes of Health Animal Care Guidelines. Figure 1 illustrates the BBB disruption setup and the experimental timeline used for all studies unless otherwise noted. Rats were anesthetized with isoflurane and placed on a heated stereotaxic platform. A centimeter-long incision was made along the sagittal suture starting at lambda and used as a window to align the ultrasound transducer to bregma. The incision was then pushed back from the bregma, exposing uninterrupted scalp to the sonicating transducer, which was then coated in ultrasound gel. A water-filled drape was mated to the scalp, and the transducer was targeted to a depth of 6 mm under the skull surface. The transducer was moved 0.5 mm anterior and 3 mm lateral to bregma using a motorized stage, and the MB/EB cocktail was subsequently injected via a tail vein catheter. The right striatum was sonicated with a focused annular piezoelectric array at a setting of 1 MHz center frequency, 1 MPa peak negative pressure (PNP, estimated target-site PNP ~0.5 MPa as indicated by the manufacturer), 100 Hz pulse repetition frequency and 10% duty cycle. After five minutes, the transducer was moved laterally 6 mm (-3 mm relative to midline) to the left striatum, which was then treated for another five minutes.
Experimental setup. a) Diagram of focused ultrasound application to the rat brain through intact skull and scalp. b) Transcranial BBB disruption layout with the Philips Therapy-Imaging Probe System. c) Timeline of BBB disruption, perfusion and post-processing steps.
Analysis of BBB Opening
Immediately after BBB disruption, rats were deeply anesthetized with isoflurane and transcardially perfused with heparinized saline. Five 400-µm thick brain slices spanning the striatum were made using a Vibratome (Leica, Buffalo Grove, IL). Brain slices were placed in 4% paraformaldehyde solution and allowed to fix overnight. Twenty-four hours after BBB disruption, slices were imaged using the 700nm channel of a flatbed near infrared (NIR) Odyssey scanner (Li-Cor, Lincoln, NE) at 42-µm resolution, 0.5 intensity.
Raw images of five brain slices from each specimen were obtained from the Odyssey scanner, stacked and overlaid into one image utilizing ImageJ software (NIH, Bethesda, MD) for image analysis. The slice measured to display the highest fluorescence intensity was considered to be the “center” slice (slice 3). Integrated fluorescence intensity from equally sized ROIs was determined to represent the total EB fluorescence from one brain (n = 3 per condition). Statistical analysis such as mean, standard deviation, one or two-way ANOVA and linear regressions were conducted in Graphpad Prism v6.0 (La Jolla, CA).
Viral Transduction
Tail vein injections of dsAAV1-CMV-eGFP (produced by the NIDA Optogenetics and Transgenic Technology Core, Baltimore MD, 50 µL, 3.38×10¹² vg) and 2×108 MB/kg were conducted before a unilateral sonication (1 MHz, 1 MPa, 5 min) targeted to the right striatum. One week after sonication, rats were perfused with saline followed by 4% paraformaldehyde, and brains were extracted and fixed in paraformaldehyde, then placed in a sucrose gradient of 18 and 30% for two days before cryopreservation. Coronal cryosections were taken at 30 µm thickness, and were washed in PBS. Sections were transferred into PBS with 4% goat serum and 0.3% Triton X-100 for one hour before being incubated with mouse anti-NeuN (1:1000, Millipore, Billerica, MA) primary antibodies at 4 °C overnight. Sections were then washed with PBS and incubated with goat anti-mouse Alexa Fluor 568 (1:500, Invitrogen, Carlsbad, CA) for one hour at room temperature. Sections were then washed in PBS and incubated for fifteen minutes with 4',6-diamidino-2-phenylindole (DAPI, 1:3000, Invitrogen, Carlsbad, CA). Stained sections were mounted on glass slides and imaged with a Nikon Eclipse E800 with a C2 head (Melville NY).
Results
Characterization of size-isolated microbubbles
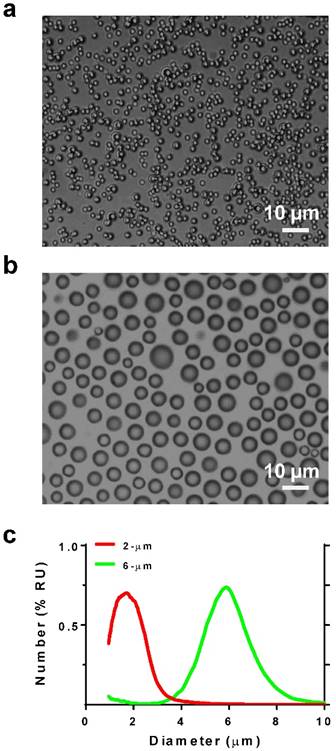
Microbubble size distribution was confirmed by microscopy and measured by a Coulter counter (Fig. 2). The two size-isolated lipid microbubble formulations had median diameters of 1.7 and 5.7 µm and mean diameters of 1.7 and 5.8 µm, respectively. The size distributions exhibited minimal overlap. These two microbubble formulations are heretofore referred to as 2 and 6 μm.
Microbubble size characterization. Photomicrographs of a) 2- and b) 6-µm diameter microbubbles. c) Size distribution plots by number %.
Qualitative analysis of BBB disruption
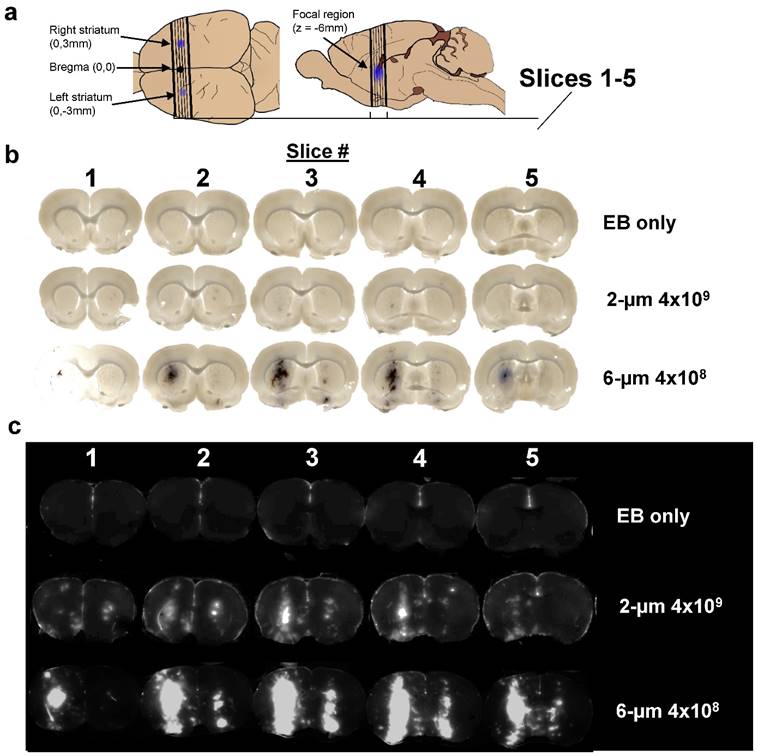
After a single intravenous injection of the MB/EB cocktail, the right striatum was sonicated for 5 min, and then the left striatum was sonicated for another 5 min. Brightfield and NIR fluorescence scanned images of slices taken from the targeted striatal regions demonstrated consistent targeting of EB to the center of the striatum on both right (0-5 min BBB disruption) and left (5-10 min) hemispheres of the brain, with less EB present in the left (contralateral) hemisphere (Fig. 3). Extravasated EB and red blood cells were visible in the focal region, with diffuse EB surrounding the focal region. NIR images of these brain slices indicated the presence of EB in larger regions surrounding the focal region.
Imaging results. a) Location of sections used to measure Evans Blue permeabilization within left and right striatum, and brain slices analyzed for LICOR measurements. b) Brightfield microscopy and c) NIR images of three representative brains out of 11 discrete conditions (n = 3 per condition) of 2% EB, no-microbubbles “EB only”; 2% EB, 2-µm, 4×109 MB/kg dose; and 4% EB, 6-µm 4×109 MB/kg dose.
Evans Blue (EB) dose response
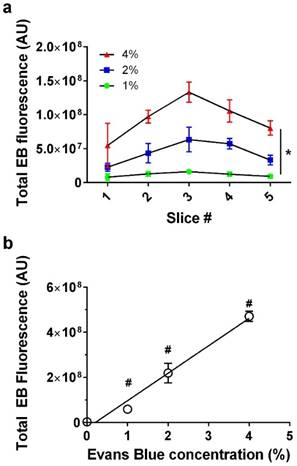
We next examined whether EB exhibited a linear dose-response at constant BBB disruption parameters. When plotted as a function of slice number, EB fluorescence was verified to follow a consistent trend representative of our slice selection method, exhibiting peak intensity at the third (middle) slice across all EB concentrations (Fig. 4a). EB concentrations of 0, 1, 2 and 4 wt% positively correlated with increasing fluorescence intensity values (n = 3) in slice #3 (Fig. 4b). As expected, the correlation was linear (fluorescence intensity = 1.22×10⁸ × [EB] - 2.53×10⁷, R2 = 0.97). All subsequent experiments used 2% EB w/v, and the EB signal intensity values fell within the range of the EB dose-response curve.
Evans Blue dose effect. a) Fluorescence intensity per slice for 0, 1, 2 and 4% Evans Blue, 6-µm microbubble (4×108 MB/kg) treated brain slices showed a significant effect for slice # and EB% (*p<0.0001 two-way ANOVA). b) Injected Evans Blue concentration vs. total fluorescence intensity from five sonoporated brain slices (n=3, p<0.0001, one-way ANOVA; #p<0.001 compared to other groups except 1% was not significantly different than 0, Tukey's multiple comparisons test). Line of best fit was obtained through linear regression (R2=0.97) with EB concentration vs. fluorescence represented as Y=1.22×10⁸×X-2.53×10⁷, (R2=0.97).
Effect of MB size, concentration and gas volume on BBB disruption
Our data showed a linear trend between microbubble number dose and EB fluorescence for each microbubble size (Fig. 5a). Control injections with 2 wt% EB and without microbubbles yielded a very small value for the NIR fluorescence intensity (1.1×10⁷ ± 0.16×10⁷ AU; n = 3). The 2-µm microbubbles showed a linear trend with a relatively small slope (fluorescence intensity = 0.02×[MB-number] + 1.36×10⁷, R2 = 0.78). Under the same FUS conditions, 6-µm microbubbles also followed a linear trend with a thirty-fold greater slope (fluorescence intensity = 0.49×[MB-number] + 3.65×10⁷, R2 = 0.86).
Microbubble dose effect. a) Total fluorescence intensity for 2% EB, 2-µm treated brains at number concentrations of 0, 4×10⁸, 2×10⁹ and 4×109 MB/kg (red; n=3) and 6-µm at number concentrations of 4×10⁷, 2×10⁸ and 4×108 MB/kg (green; n =3). Best fit trend lines determined by linear regression analysis (black lines) for 2-µm (Y=0.02*X+1.36×10⁷; R2=0.78) and 6-µm (Y=0.49*X+3.65×10⁷; R2=0.86). For both 2- and 6-µm bubbles, a significant increase in total EB fluorescence was observed with number concentration (*p<0.001). b) Total microbubble gas volume vs. total EB fluorescence after the first 5 min of BBB disruption (solid circles; right striatum) and subsequent 5 min (empty circles; left striatum) following a single microbubble injection. Lines of best fit for microbubble volume dose vs. EB fluorescence for 0-5 min BBB disruption (Y=5.5×10⁶×X+2.22×10⁷; R2=0.90) and 5-10 min BBB disruption (Y=1.13×10⁷×X+1.6×10⁶; R2=0.68). The slope for 0-5 min BBB disruption response was significantly greater than 5-10 min BBB disruption (*p<0.0001).
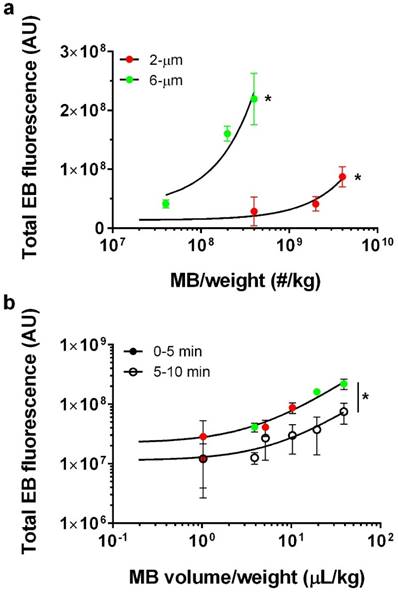
We next examined the effect of gas volume dose, which was taken as the product of the average microbubble volume (using the mean microbubble diameter) and number (determined by the number concentration and injection volume). When the data is cast as the microbubble gas volume dose, a linear dose-response was observed for both the right (initial BBB disruption, 0-5 min) and left (second BBB disruption, 5-10 min) hemispheres (Fig. 5b). Interestingly, both microbubble sizes collapsed to a single line when represented as volume dose, for both the right and left striata. As expected, the linear fit showed a three-fold greater slope for the right hemisphere (fluorescence intensity = 5.5×10⁶×[MB-volume] + 2.22×10⁷, R2 = 0.90) compared to the contralateral hemisphere (fluorescence intensity = 1.13×10⁶×[MB-volume] + 1.6×10⁷, R2 = 0.68).
Viral Transduction
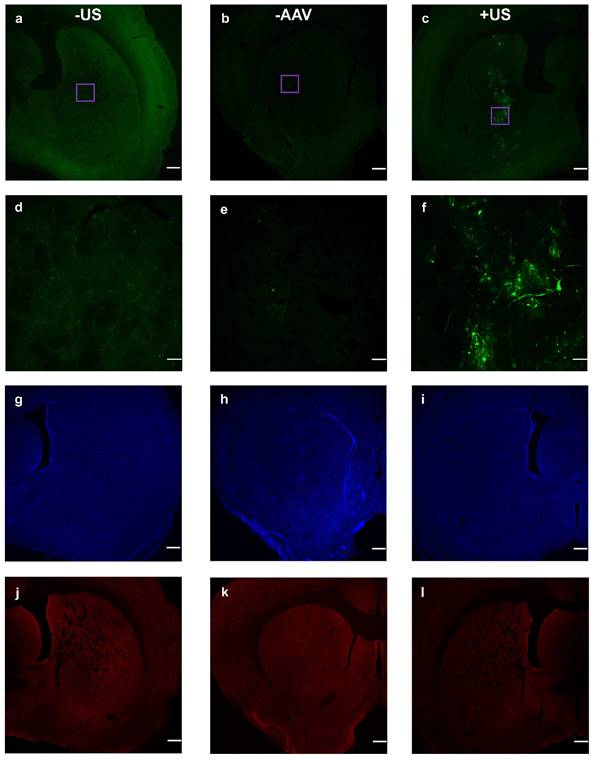
Finally, we examined viral transduction with our benchmark volume, 20 µL of 6-µm (2×108 MB/kg) and dsAAV1-CMV-eGFP (Fig. 6). This microbubble volume balanced efficient permeabilization with minimal hemorrhage. Considerable transfection was observed, but only within the sonicated region (Fig. 6c). Microscopy images of the nuclear stain DAPI and the neuron immunological stain NeuN revealed no noticeable neuronal cellular loss within the targeted region of the striatum (Figs. 6i,l).
Co-injected dsAAV1-CMV-EGFP transduction of brain cells, and macrophage response 1 week after BBB disruption. Non-sonicated striatum (+AAV +MB -US) is represented in a, d, g and j; no-AAV striatum (-AAV +MB +US) is represented in b, e, h and k; while sonicated AAV-treated striatum (+AAV +MB +US) is represented in c, f, i and l. EGFP expression over 2x (a, b, c; scale bar: 500µm) and 20x (d, e, f; scale bar: 50µm) magnification. DAPI nuclear staining (g, h , i), and NeuN staining (j, k, l) of neurons.
Discussion
The primary goal of this study was to identify the effects of microbubble size, concentration and gas volume on the extent of trans-BBB molecular delivery with focused ultrasound in the rat striatum. The linear dose-response for EB concentration and consistent spatial targeting to the striatum provided confidence that our methodology had sufficient accuracy and precision. In line with past studies, we saw that increasing microbubble size at a fixed concentration increased BBB opening efficiency, with 6-µm diameter microbubbles producing over ten-fold greater EB fluorescence than their 2-µm counterparts. However, when plotting EB fluorescence against the total gas volume dose of microbubbles injected, we observed a linear relationship with both sizes collapsing to a single line for each of the initial and contralateral treatments. This result demonstrates that size and concentration can be merged into single parameter, volume dose, to optimize BBB opening efficiency. This surprising result may be explained from the standpoint of pharmacokinetics, where it was previously demonstrated that at matched volume dose 2- and 6-µm bubbles exhibit essentially the same half-life for in vivo ultrasound contrast persistence in mice (19). We therefore suggest that for these cationic lipid-shelled microbubbles and acoustic parameters, BBB opening depends primarily on the microbubble persistence in the circulation. This may in part explain why microbubbles with longer acyl-chain lipids, which were shown to circulate longer (23), also demonstrated greater trans-BBB delivery (24).
Microbubble surface area is another important consideration. The microbubble surface may be used to load drugs and genes (25,26), but it may also stimulate an immune response (27). Thus, for drug delivery applications involving microbubble loading, it may be advantageous to use smaller microbubbles. At the same volume dose, the 2-µm diameter bubbles provide nine-fold more surface area than their 6-µm counterparts. On the other hand, when avoidance of complement activation and immune stimulation takes priority, then 6-µm diameter microbubbles may be preferable.
A secondary goal of this study was to develop highly reproducible FUS-mediated BBB disruptions to the striata of adult rats, without the use of skull removal or even thinning. The location of the striatum was precisely identified utilizing cranial landmarks and without the use of MRI: a similar procedure to stereotaxic intracranial injections. Measuring total integrated fluorescence intensity from freshly acquired brain slices yielded remarkably consistent fluorescence intensity across all specimens resulting from identical BBB disruption conditions (Fig. 4a). While it possible that acoustic reflections and standing waves may have been present, the lack of extravasated Evans Blue outside the focal zone suggests that acoustic interference did not contribute significantly to BBB permeabilization. One limitation of our study was the measurement of relative permeabilization efficiencies through infrared fluorescence, as opposed to absolute quantities of extravasated Evans Blue. However, the linear EB dose-response curve provides confidence in the comparisons. With further development of the procedure presented here, future studies may be able to measure the percent uptake of drug delivered to the striatum.
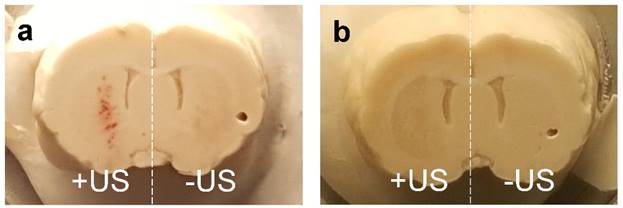
Safety is a topic of interest due to the translational nature of BBB disruption studies. In our Evans Blue experiments, limited hemorrhaging was observed immediately after BBB disruption at higher microbubble volume doses, but was not present a week after BBB disruption in AAV experiments (Fig. 7). The incidence of hemorrhage suggested that inertial cavitation may have occurred, and indeed inertial cavitation was reported for these microbubble sizes under similar acoustic forcing (13). We therefore caution that the trends observed here may not necessarily hold for alternative ultrasound parameters. Importantly, robust transduction of neuronal cells was observed by an AAV vector with no noticeable neuronal loss as indicated by NeuN staining. Further studies in the field of FUS-mediated gene and drug delivery to the brain are needed to optimize the parameters of MB volume dose, gene/drug delivery and tissue viability. The current study indicates that MB volume dose should be starting point in this optimization process.
Comparison of extravasated blood in brains sonoporated with 6-µm MB at 2×108 MB/kg concentration a) 24 hours after treatment, and b) one week after treatment.
Conclusion
We demonstrate a novel and precise method of measuring relative BBB permeabilization utilizing NIR scanning of rat brains following FUS treatment with microbubbles. Our study independently examined on the effects of microbubble size (2 vs. 6 µm diameter) and concentration (107 to 1010 kg-1) on the extent of molecular dye extravasation into the striatum. Surprisingly, our results demonstrate that the extent of BBB opening increases linearly with gas volume dose, with both sizes of microbubbles collapsing to a single curve. We conclude that volume dose, not size, is the relevant parameter for optimizing focused ultrasound BBB disruption, as it has been shown previously to dictate the pharmacokinetics of ultrasound contrast.
Acknowledgements
This work was supported by the University of Colorado Boulder and the Intramural Research Program at the National Institute on Drug Abuse. We would like to thank Mr. Pyry Koivula, Julie Necarsulmer and Dr. Yajun Zhang for lending their expertise in animal procedures, and Dr. Leslie Whitaker for assistance with vibratome preparation of brain slices.
Competing Interests
The authors have declared that no competing interest exists.
References
1. Pardridge WM, Boado RJ. Reengineering biopharmaceuticals for targeted delivery across the blood-brain barrier. Methods Enzymol. 2012;503:269-92
2. Konofagou EE. Optimization of the Ultrasound-Induced Blood-Brain Barrier Opening. Theranostics. 2012;2(12):1223-37
3. Aryal M, Arvanitis CD, Alexander PM, McDannold N. Ultrasound-mediated blood-brain barrier disruption for targeted drug delivery in the central nervous system. Adv Drug Deliv Rev. 2014Jun;72:94-109
4. Poon C, McMahon D, Hynynen K. Noninvasive and targeted delivery of therapeutics to the brain using focused ultrasound. Neuropharmacology. 2016 Feb 18
5. Choi JJ, Feshitan JA, Baseri B, Shougang Wang, Yao-Sheng Tung, Borden MA. et al. Microbubble-Size Dependence of Focused Ultrasound-Induced Blood-Brain Barrier Opening in Mice In Vivo. IEEE Trans Biomed Eng. 2010Jan;57(1):145-54
6. McDannold N, Vykhodtseva N, Raymond S, Jolesz FA, Hynynen K. MRI-guided targeted blood-brain barrier disruption with focused ultrasound: histological findings in rabbits. Ultrasound Med Biol. 2005Nov;31(11):1527-37
7. Thévenot E, Jordão JF, O'Reilly MA, Markham K, Weng Y-Q, Foust KD. et al. Targeted delivery of self-complementary adeno-associated virus serotype 9 to the brain, using magnetic resonance imaging-guided focused ultrasound. Hum Gene Ther. 2012Nov;23(11):1144-55
8. Alonso A, Reinz E, Leuchs B, Kleinschmidt J, Fatar M, Geers B. et al. Focal Delivery of AAV2/1-transgenes Into the Rat Brain by Localized Ultrasound-induced BBB Opening. Mol Ther Nucleic Acids. 2013;2:e73
9. Hsu P-H, Wei K-C, Huang C-Y, Wen C-J, Yen T-C, Liu C-L. et al. Noninvasive and targeted gene delivery into the brain using microbubble-facilitated focused ultrasound. PloS One. 2013;8(2):e57682
10. Wang S, Olumolade OO, Sun T, Samiotaki G, Konofagou EE. Noninvasive, neuron-specific gene therapy can be facilitated by focused ultrasound and recombinant adeno-associated virus. Gene Ther. 2015;22(1):104-110
11. Mead BP, Mastorakos P, Suk JS, Klibanov AL, Hanes J, Price RJ. Targeted gene transfer to the brain via the delivery of brain-penetrating DNA nanoparticles with focused ultrasound. J Control Release Off J Control Release Soc. 2016Feb10;223:109-17
12. Tung Y-S, Choi JJ, Baseri B, Konofagou EE. Identifying the inertial cavitation threshold and skull effects in a vessel phantom using focused ultrasound and microbubbles. Ultrasound Med Biol. 2010May;36(5):840-52
13. Tung Y-S, Vlachos F, Feshitan JA, Borden MA, Konofagou EE. The mechanism of interaction between focused ultrasound and microbubbles in blood-brain barrier opening in mice. J Acoust Soc Am. 2011Nov;130(5):3059-67
14. Choi JJ, Selert K, Gao Z, Samiotaki G, Baseri B, Konofagou EE. Noninvasive and localized blood-brain barrier disruption using focused ultrasound can be achieved at short pulse lengths and low pulse repetition frequencies. J Cereb Blood Flow Metab Off J Int Soc Cereb Blood Flow Metab. 2011Feb;31(2):725-37
15. Samiotaki G, Konofagou EE. Dependence of the reversibility of focused- ultrasound-induced blood-brain barrier opening on pressure and pulse length in vivo. IEEE Trans Ultrason Ferroelectr Freq Control. 2013Nov;60(11):2257-65
16. Wang S, Samiotaki G, Olumolade O, Feshitan JA, Konofagou EE. Microbubble Type and Distribution Dependence of Focused Ultrasound-Induced Blood-Brain Barrier Opening. Ultrasound Med Biol. 2014Jan;40(1):130-7
17. Yang F-Y, Fu W-M, Chen W-S, Yeh W-L, Lin W-L. Quantitative evaluation of the use of microbubbles with transcranial focused ultrasound on blood-brain-barrier disruption. Ultrason Sonochem. 2008Apr;15(4):636-43
18. Yang F-Y, Chen C-C, Kao Y-H, Chen C-L, Ko C-E, Horng S-C. et al. Evaluation of Dose Distribution of Molecular Delivery After Blood-Brain Barrier Disruption by Focused Ultrasound with Treatment Planning. Ultrasound Med Biol. 2013Apr;39(4):620-7
19. Sirsi S, Feshitan J, Kwan J, Homma S, Borden M. Effect of microbubble size on fundamental mode high frequency ultrasound imaging in mice. Ultrasound Med Biol. 2010;36(6):935-948
20. Calabresi P, Di Filippo M, Gallina A, Wang Y, Stankowski JN, Picconi B. et al. New synaptic and molecular targets for neuroprotection in Parkinson's disease. Mov Disord Off J Mov Disord Soc. 2013Jan;28(1):51-60
21. Sirsi SR, Hernandez SL, Zielinski L, Blomback H, Koubaa A, Synder M. et al. Polyplex-microbubble hybrids for ultrasound-guided plasmid DNA delivery to solid tumors. J Controlled Release. 2012Jan;157(2):224-34
22. Lindner JR, Coggins MP, Kaul S, Klibanov AL, Brandenburger GH, Ley K. Microbubble persistence in the microcirculation during ischemia/reperfusion and inflammation is caused by integrin-and complement-mediated adherence to activated leukocytes. Circulation. 2000;101(6):668-675
23. Garg S, Thomas AA, Borden MA. The effect of lipid monolayer in-plane rigidity on in vivo microbubble circulation persistence. Biomaterials. 2013Sep;34(28):6862-70
24. Wu S-Y, Chen CC, Tung Y-S, Olumolade OO, Konofagou EE. Effects of the microbubble shell physicochemical properties on ultrasound-mediated drug delivery to the brain. J Control Release Off J Control Release Soc. 2015Aug28;212:30-40
25. Sirsi SR, Borden MA. Advances in ultrasound mediated gene therapy using microbubble contrast agents. Theranostics. 2012;2(12):1208-22
26. Sirsi S, Borden M. State-of-the-Art Materials for Ultrasound-Triggered Drug Delivery. Adv Drug Deliv Rev. 2014Jun15;0:3-14
27. Chen CC, Borden MA. The Role of Poly(ethylene glycol) Brush Architecture in Complement Activation on Targeted Microbubble Surfaces. Biomaterials. 2011Sep;32(27):6579-87
Author contact
![]() Corresponding authors: Mark A Borden, PhD., Department of Mechanical Engineering, University of Colorado, 1111 Engineering Drive, Boulder, CO 80309-0427. Phone: 303.492.7750; Fax: 303.492.3498; Email: mark.bordenedu or Brandon K. Harvey, Ph.D., Director, Optogenetics and Transgenic Technology Core, Associate Scientist, Glia-Neuron Interactions Unit, National Institute on Drug Abuse, Biomedical Research Building, Suite 200, Room 06A729, 251 Bayview Blvd, Baltimore, MD 21224. Phone: 443-740-2590 (office); Email: bharveynih.gov.
Corresponding authors: Mark A Borden, PhD., Department of Mechanical Engineering, University of Colorado, 1111 Engineering Drive, Boulder, CO 80309-0427. Phone: 303.492.7750; Fax: 303.492.3498; Email: mark.bordenedu or Brandon K. Harvey, Ph.D., Director, Optogenetics and Transgenic Technology Core, Associate Scientist, Glia-Neuron Interactions Unit, National Institute on Drug Abuse, Biomedical Research Building, Suite 200, Room 06A729, 251 Bayview Blvd, Baltimore, MD 21224. Phone: 443-740-2590 (office); Email: bharveynih.gov.