Impact Factor
- Issue 13; 2026
- Issue 12; 2026
- Issue 11; 2026
- Issue 10; 2026
- Issue 9; 2026
- Volume 16; 2026
- Advance Articles
- Past Issues
- Cover Images
- Cover Suggestion
- Index & Coverage
- Special Issues
Introduction
Results
Discussion
Conclusion
Supplementary Material
Abbreviations
Acknowledgements
References
International Journal of Biological Sciences
International Journal of Medical Sciences
 Global reach, higher impact

Theranostics 2017; 7(1):213-227. doi:10.7150/thno.16044 This issue Cite
Research Paper
Genome-Wide lncRNA Microarray Profiling Identifies Novel Circulating lncRNAs for Detection of Gastric Cancer
Kecheng Zhang1*, Hongzhi Shi2*, Hongqing Xi1*, Xiaosong Wu1, Jianxin Cui1, Yunhe Gao1, Wenquan Liang1, Chong Hu1, Yi Liu1, Jiyang Li1, Ning Wang1, Bo Wei1 ![]() , Lin Chen1
, Lin Chen1 ![]()
1. Department of General Surgery & Institute of General Surgery, Chinese People's Liberation Army General Hospital, Fuxing Road 28, Beijing 100853, P.R. China;
2. Department of General Surgery, General Hospital of Armed Police Force, Yongding Road 69, Beijing 100039, P.R. China.
*Contributed equally to this work.
Received 2016-5-3; Accepted 2016-8-29; Published 2017-1-1
Abstract

Long non-coding RNAs (lncRNAs) can serve as blood-based biomarkers for cancer detection. To identify novel lncRNA biomarkers for gastric cancer (GC), we conducted, for the first time, genome-wide lncRNA screening analysis in two sets of samples: five paired preoperative and postoperative day 14 plasma samples from GC patients, and tissue samples from tumor and adjacent normal tissues. Candidate tumor-related lncRNAs were then quantitated and evaluated in three independent phases comprising 321 participants. The expression levels of lncRNAs were also measured in GC cell lines and the corresponding culture medium. Biomarker panels, lncRNA-based Index I and carcinoembryonic antigen (CEA)-based Index II, were constructed using logistic regression, and their diagnostic performance compared. Fagan's nomogram was plotted to facilitate clinical application. As a result, we identified five novel plasma lncRNAs (TINCR, CCAT2, AOC4P, BANCR and LINC00857), which, when combined in the lncRNA-based Index I, outperformed the CEA-based Index II (P < 0.001) and could distinguish GC patients from healthy controls with an area under the receiver-operating curve (AUC) of 0.91 (95% confidence interval (CI): 0.88-0.95). The lncRNA-based index decreased significantly by postoperative day 14 (P = 0.016), indicating its ability to monitor tumor dynamics. High values of the lncRNA-based index were correlated with tumor size (P = 0.036), depth of invasion (P = 0.025), lymphatic metastasis (P = 0.012) and more advanced tumor stages (P = 0.003). The lncRNA-based index was also able to discriminate GC patients from precancerous individuals and patients with gastrointestinal stromal tumor with AUC values of 0.82 (95% CI: 0.71-0.92) and 0.80 (95% CI: 0.68-0.91), respectively. Taken together, our findings demonstrate that this panel of five plasma lncRNAs could serve as a set of novel diagnostic biomarkers for GC detection.
Keywords: circulating lncRNAs, gastric cancer, diagnosis, microarray, nomogram.
Introduction
Gastric cancer (GC) represents a major health burden worldwide, with the highest incidence rate in Eastern Asia [1]. In China, GC was the second most prevalent cancer and the second cause of cancer-related deaths with an estimate of 679,100 new cases and 498,000 deaths in 2015 [2]. No typical signs indicative of GC present until the cancer is advanced [3], leading to a poor prognosis with a 5-year survival of only 25% [4]. Thus, there is an unmet need to develop a rational approach for early detection of GC, which would greatly facilitate early intervention. Undoubtedly, blood-based tumor biomarkers provide an easily accessible and noninvasive way to detect GC. In current clinical practice, the most widely used are serum tumor markers, including carcinoembryonic antigen (CEA), carbohydrate antigen (CA) 19-9, CA72-4 and CA125. However, these markers have been shown to be far from clinically satisfactory for GC detection, with low sensitivity and specificity, even if they are used in combination [5, 6]. Development of reliable biomarkers for GC detection with high accuracy should be a priority.
Long non-coding RNAs (lncRNAs), a class of transcripts more than 200 nucleotides in length without protein-coding ability, have been reported to play key roles in gene regulation, thereby influencing several facets of cellular homeostasis, including proliferation, apoptosis, metastasis and genomic stability [7]. Interestingly, lncRNAs are usually expressed in a highly tissue- and cell type-specific manner [8, 9]. More importantly, tumor-derived lncRNAs can be detected in several biological fluids, including urine and blood. These features make lncRNAs ideal noninvasive biomarkers for cancer diagnosis and prognosis. For example, lncRNA PCA3 has been demonstrated to be a more sensitive and specific biomarker of prostate cancer in urine than the currently widely used serum prostate-specific antigen (PSA) [10]. Similarly, the hepatocellular carcinoma upregulated lncRNA HULC is overexpressed in hepatocellular carcinomas and can be detected in blood by conventional polymerase chain reaction (PCR) methods [11]. Recently, Tong and colleagues reported that the plasma tumor-derived lncRNA, POU3F3, remains stable after being subjected to acid or base digestion and can serve as a biomarker for the diagnosis of esophageal squamous cell carcinoma [12]. Circulating lncRNAs have also shown their prognostic potential in GC [13].
With regard to GC, limited studies have investigated the diagnostic role of circulating lncRNAs [14-17]. Notably, Dong and colleagues have recently described a serum-based three-lncRNA biomarker panel that could be suitable for distinguishing patients from healthy controls [18]. Despite the relatively high diagnostic accuracy of circulating lncRNAs reported in these studies, there are several limitations that must be considered. First, all of these studies have investigated preselected lncRNAs based on previous reports, leaving the majority of lncRNAs unexplored. Genome-wide microarray analysis might be a superior way to identify circulating lncRNAs with higher diagnostic ability. Second, the fact that hemolysis of blood samples can alter the concentration of circulating non-coding RNAs cannot be ignored [19]. Possible ways to minimize the effects of this must be considered, including standardizing sample processing [20], investigating the association between circulating lncRNAs and blood cell count, and taking into account the level of hemoglobin as a marker of hemolysis [21, 22]. Third, few studies simultaneously compared the diagnostic performance of circulating lncRNAs with that of current serum biomarkers used in a clinical setting.
In the present study, with the aim of searching for novel circulating lncRNA biomarkers for GC detection and exploring their dynamic changes perioperatively, plasma samples from 162 GC patients, including 72 paired cases after gastrectomy, as well as 28 patients with precancerous lesions (Prec), 21 with gastrointestinal stromal tumors (GIST), and 110 normal controls, were collected and screened by genome-wide profiling microarray followed by qRT-PCR analysis. The expression levels of candidate lncRNAs were also measured in paired tumor tissues and cell lines. The diagnostic potential of circulating lncRNAs was compared with that of currently widely used serum markers.
Methods
Sample collection, plasma preparation and study design
The study was conducted in accordance with the Reporting Recommendations for Tumor Marker Prognostic Studies (REMARK) guidelines [23] and was approved by the Chinese People's Liberation Army General Hospital Research Ethics Committee. All the samples were collected from People's Liberation Army General Hospital (PLAGH, Beijing, China). Between January 2014 and March 2015, 167 preoperative blood samples of GC patients and 110 blood samples from healthy controls were collected. Healthy controls were a group of patients presenting with benign disease such as hernia who had no evidence of stomach disease or other malignancy. None of the GC patients had received chemotherapy or radiotherapy prior to blood sampling. Among these GC patients, 72 cases with blood samples on postoperative day (POD) 14 were available. We also collected 20 paired GC tissues with matched adjacent normal tissues. All of the GC patients were identified pathologically and were staged according to the third edition of the Japanese Classification of Gastric Carcinoma [24]. Additionally, a group of 28 samples from patients with Prec were added, including 19 chronic gastritis cases and nine peptic ulcer cases. A cohort of blood samples from 21 patients with gastrointestinal stromal tumor (GIST) was also included.
Blood sampling was standardized. All blood samples were collected the day after admission under fasting conditions. After discarding the first couple of ml of blood to remove potential tissue and cellular contaminants from the puncture site [20], up to 5 ml of blood was collected from each subject in a K2-EDTA plasma tube and was processed, within 4 h from collection, at the Clinical Specimen Bank of PLAGH. A centrifugation protocol (2000 g for 10 min at 4 °C, 12,000 g for 10 min at 4 °C) was used to thoroughly remove cellular nucleic acids and to obtain cellular-component-free plasma. Samples were assessed for hemolysis by spectrophotometric analysis as previously described [21, 22] and those with A414 reading exceeding 0.2 were then excluded. After separation, plasma samples were transferred to RNase/DNase-free tubes and stored at -80°C awaiting total RNA extraction.
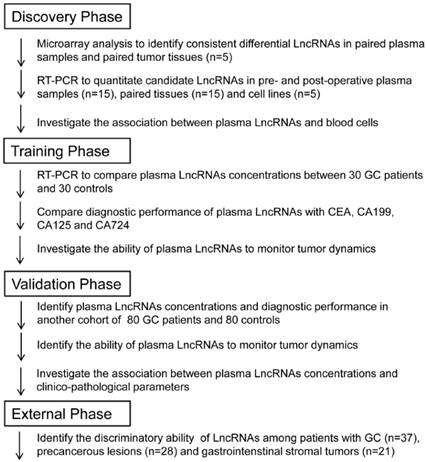
A multi-phase, case-control study was conducted to identify a panel of plasma lncRNA biomarkers for gastric cancer. The workflow chart of the study is shown in Figure 1. The whole study comprised four phases: discovery phase, training phase, validation phase and external phase. Briefly, in the discovery phase, genome-wide lncRNA profiling analysis was conducted between five paired preoperative and POD 14 blood samples from GC patients, and between paired tumor and adjacent normal tissues, to identify consistently upregulated and tumor-related lncRNAs. Then, candidate lncRNAs were analyzed in tissue and plasma samples in another cohort of 15 GC patients, and also in cell lines, by qRT-PCR. In the training phase, we first confirmed that expression of candidate lncRNAs was upregulated in plasma samples, and then constructed lncRNA-based and CEA-based diagnostic indices. A comparison between these two indices was conducted. In the validation phase, we evaluated the diagnostic performance of the lncRNA-based index in another independent cohort of 80 GC patients and 80 healthy controls. The ability of the lncRNA-based index to monitor tumor dynamics was also investigated. Finally, in the external phase, the discriminatory ability of the validated lncRNA-based index was explored between 37 GC patients, 28 Prec individuals and 21 GIST cases.
Overview of the study design.
Cell culture
The human GC cell lines HGC27, AGS, SGC-7901 and MGC803 were purchased from the Chinese Academy of Sciences Committee on Type Culture Collection cell bank (Shanghai, China). The immortalized human gastric epithelial cell line, GES-1, was obtained from the Institute of General Surgery of PLAGH. All cell lines were cultured in RPMI-1640 medium supplemented with 10% fetal bovine serum (Gibco, NY, USA) and 1% penicillin-streptomycin in a humidified incubator at 37 °C in 5% CO2. SGC-7901 and GES-1 cells were cultured and the culture media was collected at 0, 24 and 48 h after the initial seeding of cells in 10-cm dishes. The processing of conditioned medium was the same as that described for plasma collection.
RNA extraction
RNA extraction from tissues and cultured cells was performed using Trizol reagent (Invitrogen, Carlsbad, CA, USA) according to the manufacturer's instructions. For total RNA isolated from plasma or cell culture medium, 1.2 ml Trizol LS Reagent (Invitrogen) was mixed with 400 μl liquid sample. After vortex mixing for 30 s and then standing for 5 min, 320 μl chloroform was added. The Trizol-chloroform mixture was vortex-mixed for 15 s and then centrifuged at 12,000 × g for 15 min at 4 °C. The upper aqueous phase was transferred to a fresh tube. Finally, RNA was extracted following the manufacturer's instructions.
LncRNA microarray analysis
The LncRNA Human Gene Expression Microarray V4.0 (CapitalBio Corp, Beijing, China) containing approximately 40,000 human lncRNAs was used. In brief, double-stranded cDNAs (containing a T7 RNA polymerase promoter sequence) were synthesized from 300 ng total RNA using the CbcScript reverse transcriptase with cDNA synthesis system according to the manufacturer's protocol (CapitalBio). Then, the dsDNA products were purified using the PCR NucleoSpin Extract II Kit (MN) and eluted with 30 μl elution buffer. Complementary RNA was synthesized from the eluted dsDNA products using a T7 Enzyme Mix at 37 °C for 14 h and was purified using the RNA Clean-up Kit (MN). Amplified RNA (2 μg) was mixed with 4 μg random primer, denatured at 65 °C for 5 min, and cooled on ice. Then, 5 μl of 4 × first-strand buffer, 2 μl of 0.1 M DTT, and 1.5 μl CbcScript II reverse transcriptase were added. The mixtures were incubated at 25 °C for 10 min, then at 37 °C for 90 min. The cDNA products were purified using a PCR NucleoSpin Extract II Kit (MN) and vacuum evaporated to 14 μl. The cDNA was mixed with 4 μg random primer, heated to 95 °C for 3 min, and snap cooled on ice for 5 min. Then, 5 μl Klenow buffer, dNTP, and Cy5-dCTP or Cy3-dCTP (GE Healthcare) were added to final concentrations of 240 M dATP, 240 M dGTP, 240 M dTTP, 120 M dCTP, and 40 M Cy-dCTP. Next, 1.2 μl Klenow enzyme was added, and the reaction was performed at 37 °C for 90 min. Labeled cDNA was purified with a PCR NucleoSpin Extract II Kit (MN) and resuspended in elution buffer.
Array hybridization was performed in a CapitalBio BioMixerTM II Hybridization Station overnight at a rotation speed of 8 rpm and a temperature of 42 °C and washed with two consecutive solutions (0.2% SDS, 2 × SSC at 42 °C for 5 min, and 0.2 × SSC for 5 min at room temperature).
Slides were scanned on an Agilent microarray scanner (model G2565CA). The microarray image information was converted into spot intensity values using Feature Extraction Software Rev. 10.7 (Agilent Technologies, CA, USA). The signal after background subtraction was exported directly into GeneSpring software (Agilent Technologies) for quartile normalization and further data analysis. We selected differentially expressed lncRNAs according to the following criteria: fold change > 2 and P < 0.05. Hierarchical clustering analysis was employed on differentially expressed lncRNAs between GC and matched groups discovered by microarray analysis. A Venn diagram was used to identify the number of identical differentially expressed lncRNAs from the two sets of microarray profiles.
Quantitative real-time PCR (qRT-PCR)
In qRT-PCR, the reverse transcription (RT) reactions were carried out with SuperScript III Reverse Transcriptase (Invitrogen) according to the manufacturer's instructions, using around 3 μg total RNA. Quantitative PCR reactions were then performed in 10 μl on an ABI 7900 system. The reactions were incubated at 95 °C for 5 min, followed by 40 cycles of 95 °C for 15 s, and 60 °C for 40 s. All quantitative PCR reactions were performed in triplicate. For tissues and cell lines, the Ct value of each candidate lncRNA was then normalized to the expression value of GAPDH, while for liquid samples, lncRNAs were normalized to the expression levels of β-actin as previously described [11, 18, 25]. Relative expression levels of the lncRNAs were calculated using 2-∆∆Ct. The sequences of primers used for qRT-PCR of the lncRNAs are listed in Supplementary Material Table S1.
Serum CA19-9, CA72-4, CA125 and CEA determination
Concentrations of CA19-9, CA72-4, CA125 and CEA were quantitatively measured preoperatively using an Architect i2000 Immunology Analyzer (Abbott Diagnostics, USA). Cut-off values of 37 U/ml, 10 U/ml, 35 U/ml and 5 μg/l were used for CA19-9, CA72-4, CA125 and CEA, respectively. All tumor marker assays were performed at PLAGH according to the manufacturer's protocols. The laboratory personnel were blinded to the clinical information. Commercial reference control sera (Abbott Inc.) were used for quality control and calibration.
Statistical analysis
The Mann-Whitney U test was used for the analysis of differential lncRNA expression between GC and controls, and the Wilcoxon signed rank test was employed for the paired samples. Discrete variables were compared by contingency table analysis of the χ2 test. Receiver-operating characteristic (ROC) curves and the area under the ROC curve (AUC) were used to assess the diagnostic performance of selected biomarkers. Comparison of the AUC from different diagnostic markers was performed via a nonparametric approach [26]. The optimal cut-off point was determined using Youden's index. Using the binary status of enrolled participants (patients or controls) as the dependent variable, the regression coefficient for each lncRNA was estimated by a univariate logistic regression model, and was used as the weighting to construct the diagnostic index. The diagnostic index developed in the training phase was also directly applied to the validation phase to evaluate the clinical utility of the identified lncRNAs individually or in combination. Fagan's nomogram was constructed to help clinicians use diagnostic test results to estimate a patient's probability of having a disease. Statistical analysis was performed with SPSS (Version 22.0, IBM, USA) and presented graphically in GraphPad Prism 5.0. A P-value of 0.05 was considered to be statistically significant.
Results
Characteristics of enrolled participants
A total of 321 participants, including 162 patients with GC, 110 healthy controls, 28 patients with precancerous lesions and 21 with GIST, were enrolled in the study, as shown in Table 1.
Characteristics of participants enrolled in this study.
| Discovery phase, N, % | Training phase, N, % | Validation phase, N, % | External phase, N, % | ||||||||
|---|---|---|---|---|---|---|---|---|---|---|---|
| GC (N=15) | GC (N=30) | Controls (N=30) | P value | GC (N=80) | Controls (N=80) | P value | GC (N=37) | Prec (N=28) | GIST (N=21) | P value | |
| Age, y | 60.21 ± 10.32 | 59.23 ± 12.38 | 53.47 ± 10.55 | 0.057 | 61.57 ± 14.53 | 57.51 ± 11.79 | 0.054 | 59.78 ± 8.47 | 52.13 ± 7.96 | 55.47 ± 6.32 | < 0.001 |
| BMI, kg/m2 | 24.18 ± 4.56 | 25.74 ± 6.32 | 27.88 ± 7.21 | 0.226 | 24.77 ± 9.89 | 25.83 ± 8.31 | 0.464 | 22.19 ± 5.63 | 23.55 ± 4.37 | 24.13 ± 4.62 | 0.316 |
| Gender M/F | 9 (60.0)/6 (40.0) | 21 (70.0)/9 (30.0) | 17 (56.7)/13 (43.3) | 0.284 | 63 (78.8)/17 (21.2) | 52 (65.0)/28 (35.0) | 0.053 | 23 (62.2)/14 (37.8) | 17 (60.7)/11 (39.3) | 15 (71.4)/6 (28.6) | 0.709 |
| Smoking status | 0.299 | 0.348 | < 0.001 | ||||||||
| Ever/current | 8 (53.3) | 17 (56.7) | 11 (36.7) | 51 (63.8) | 48 (60.0) | 21 (56.8) | 13 (46.4) | 11 (52.4) | |||
| Never | 4 (26.7) | 9 (30.0) | 13 (43.3) | 22 (27.5) | 19 (23.8) | 15 (40.5) | 12 (42.9) | 9 (42.8) | |||
| Unknown | 3 (20.0) | 4 (13.3) | 6 (20.0) | 7 (8.7) | 13 (16.2) | 1 (2.7) | 3 (10.7) | 1 (4.8) | |||
| Drinking status | 0.088 | 0.153 | < 0.001 | ||||||||
| Ever/current | 6 (40.0) | 22 (73.3) | 15 (50.0) | 47 (58.7) | 56 (70.0) | 26 (70.3) | 19 (67.9) | 15 (71.4) | |||
| Never | 3 (20.0) | 6 (20.0) | 14 (46.7) | 29 (36.3) | 18 (22.5) | 10 (27.0) | 7 (25.0) | 5 (23.8) | |||
| Unknown | 6 (40.0) | 2 (6.7) | 1 (3.3) | 4 (5.0) | 6 (7.5) | 1 (2.7) | 2 (7.1) | 1 (4.8) | |||
| Cancer stage | |||||||||||
| I | 0 | 4 (13.3) | 11 (13.7) | 6 (16.2) | 9 (42.9) | ||||||
| II | 7 (46.7) | 6 (20.0) | 32 (40.0) | 14 (37.8) | 12 (57.1) | ||||||
| III | 8 (53.3) | 19 (63.3) | 35 (43.8) | 17 (46.0) | |||||||
| IV | 0 | 1 (3.4) | 2 (2.5) | 0 | |||||||
| CA19-9 P/N | 2 (13.3)/13 (86.7) | 5 (16.7)/25 (83.3) | 0 (0.0)/30 (100.0) | 0.052# | 23 (28.8)/57 (71.2) | 3 (3.8)/77 (96.2) | < 0.001# | 7 (18.9)/30 (81.1) | 1 (3.6)/27 (96.4) | 2 (9.5)/19 (90.5) | 0.152 |
| CA72-4 P/N | 1 (6.7)/14 (93.3) | 3 (10.0)/27 (90.0) | 1 (3.3)/29 (96.7) | 0.612 | 9 (11.2)/71 (88.8) | 5 (6.2)/75 (93.8) | 0.263 | 4 (10.8)/33 (89.2) | 3 (10.7)/25 (89.3) | 5 (23.8)/16 (76.2) | 0.325 |
| CA125 P/N | 3 (20.0)/12 (80.0) | 9 (30.0)/21 (70.0) | 2 (6.7)/28 (93.3) | 0.042# | 19 (23.8)/61 (76.2) | 6 (7.5)/74 (92.5) | 0.005 | 11 (29.7)/26 (70.3) | 9 (32.1)/19 (67.9) | 11 (52.4)/10 (47.6) | 0.196 |
| CEA P/N | 1 (6.7)/14 (93.3) | 4 (13.3)/26 (86.7) | 1 (3.3)/29 (96.7) | 0.353# | 12 (15.0)/68 (85.0) | 9 (11.2)/71 (88.8) | 0.483 | 8 (21.6)/29 (78.4) | 3 (10.7)/25 (89.3) | 4 (19.0)/17 (81.0) | 0.505 |
BMI, body mass index; M/F, male/female; P/N, positive/negative; Prec, precancerous lesions; GIST, gastrointestinal stromal tumor; # Fisher's exact test.
No significant difference was observed in the distribution of age, body mass index (BMI), gender, smoking and drinking status among the GC patients and healthy controls in the training and validation phase (all P-values > 0.05). However, because of restrictions in the sampling of patients with precancerous lesions and with GIST, there were significant differences in age, smoking status and drinking status (all P-values < 0.001) between these three groups in the external phase. The true positive rate of clinically widely used tumor markers in groups of patients with GC, i.e., CA19-9, CA72-4, CA125 and CEA, ranged from 10.0% to 30.0%, which was consistent with previous studies [5, 18].
Discovery phase: Microarray profiling identifies differentially expressed lncRNAs between GC patients and controls
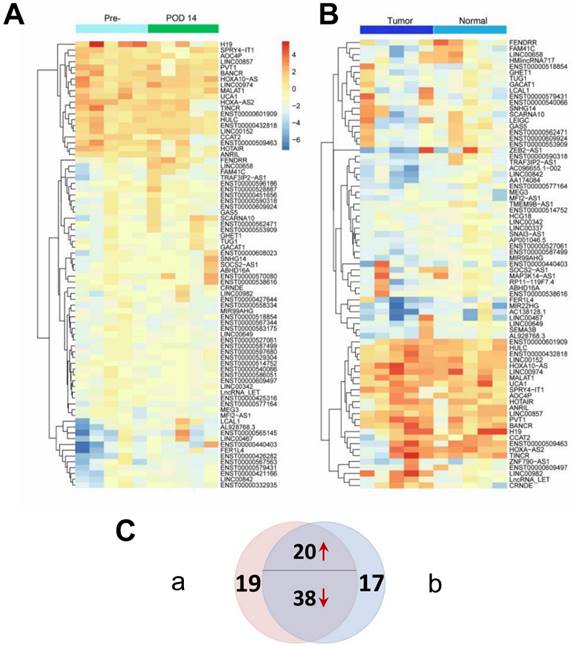
Genome-wide profiles were produced for both paired tissue samples and patient/control plasma samples to identify candidate tumor-derived lncRNAs. Two heatmaps as illustrated in Figure 2 were constructed to show differentially expressed lncRNAs (P < 0.05 and fold change > 2) between the matched groups from the microarray analyses. Figure 2A shows that 77 differentially expressed lncRNAs were identified between preoperative and POD 14 plasma samples, while Figure 2B shows that 75 differentially expressed lncRNAs were identified between tumor and adjacent normal tissues. The Venn diagram (Figure 2C) shows that 58 of the differentially expressed lncRNAs were identified in both sets (Supplementary Material: Table S2). Among these 58 dysregulated lncRNAs, 20 were upregulated in preoperative plasma and tumor tissues and were therefore considered to be candidate tumor-derived lncRNAs and subjected to subsequent analysis. To identify novel biomarkers, three lncRNAs that have previously been reported as diagnostic markers for GC (H19, LINC00152 and UCA1) were excluded from further investigations [14, 16, 27]. Thus, a total of 17 candidate lncRNAs were studied in the following steps.
Differentially expressed lncRNAs (P < 0.05 and fold change > 2) from two sets of genome-wide lncRNA microarray profiles. (A) Heatmap result of microarray analysis of five paired preoperative and postoperative day 14 plasma samples. (B) Heatmap result of microarray analysis of five paired tumor and adjacent normal tissue samples. Samples are shown in columns and lncRNAs in rows. (C) Venn diagram indicating that 20 lncRNAs are consistently upregulated and 38 downregulated in both microarray analyses.
Five novel candidate GC-associated lncRNAs are confirmed in plasma, tissues and cell lines by qRT-PCR
To confirm the elevated expression of the 17 candidate lncRNAs, we measured their expression levels by qRT-PCR in 15 pre- and postoperative plasma samples from patients who underwent gastrectomy. As shown in Figure 3A, seven lncRNAs (ANRIL, TINCR, CCAT2, AOC4P, BANCR, LINC00857 and LINC00974) changed significantly postoperatively (all P-values < 0.05). Notably, the expression levels of ANRIL increased postoperatively, in contrast to the other lncRNAs that tended to decrease postoperatively. Consistent with our results, a number of the lncRNAs that did not significantly change after gastrectomy in the present study, including HOTAIR, MALAT1 and PVT1, have previously been reported to be unsuitable as tumor markers for GC [15, 18].
Identifying candidate tumor-derived lncRNAs in the discovery phase. (A) Comparison of the preoperative and postoperative expression levels of consistently upregulated lncRNAs (n=15). (B) Comparison of the levels of consistently upregulated lncRNAs in paired tumor and adjacent normal tissues (n=15). The horizontal line in the middle of each box indicates the median, whereas the top and bottom borders of the box mark the 95th and 5th percentiles, respectively. (C) Quantitative real-time polymerase chain reaction (qPCR) was used to measure lncRNA expression in four gastric cancer cell lines (HGC27, AGS, SGC-7901 and MGC803) and the human gastric epithelial cell line (GES-1). The Wilcoxon signed rank test was used for the paired samples. *P < 0.05.
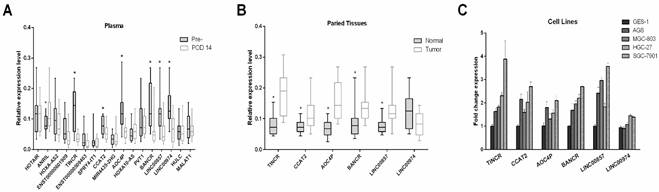
Because the expression pattern of ANRIL in microarray analysis and qRT-PCR analysis was not consistent with the presence or absence of GC, we excluded it in the following steps and quantitated the remaining six candidate lncRNAs in paired tissue samples. As illustrated in Figure 3B, five (TINCR, CCAT2, AOC4P, BANCR and LINC00857) of the six lncRNAs were significantly upregulated in tumor tissues compared with adjacent normal tissues, whereas no significant difference was observed in the expression levels of LINC00974 between tumor and normal tissues.
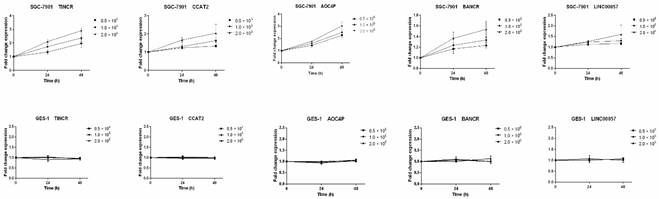
We also measured the expression levels of these six lncRNAs in four gastric cancer cell lines (HGC27, AGS, SGC-7901 and MGC803) and one human gastric epithelial cell line (GES-1). Compared with GES-1, an approximately two-fold upregulated expression could be observed in GC cell lines for the lncRNAs TINCR, CCAT2, AOC4P, BANCR and LINC00857 (Figure 3C). Previous studies have also shown upregulated expression of TINCR and BANCR in GC tissues and cell lines [28-30], consistent with our results. However, the expression levels of LINC00974 were comparable between the GC cell lines and the normal gastric epithelial cell line. Thus five lncRNAs (TINCR, CCAT2, AOC4P, BANCR and LINC00857) were identified as potential markers for GC diagnosis in the initial discovery phase. In addition, because SGC-7901 had the most upregulated expression levels of these lncRNAs while GES-1 had the lowest abundance, we measured their levels in the culture medium to determine whether these lncRNAs were secreted. We found that the levels of these five lncRNAs in the medium of SGC-7901, but not of GES-1, increased with increasing cell count (0.5-2 × 10⁶ cells per well) and incubation time (24 and 48 h) (Figure 4), confirming their tumor-derived origin and suggesting that they were indeed able to be secreted from the cell.
Expression of the five identified lncRNAs in culture medium of gastric cancer cell lines (SGC-7901) and the human gastric epithelial cell line (GES-1). Data presented as relative fold change.
To avoid the impact of blood cells on the expression of plasma lncRNAs, we investigated the association of plasma lncRNA levels with blood cell counts, including white blood cells (WBCs), red blood cells (RBCs), platelets (PLTs) and hemoglobin (Hb). However, none of the five lncRNAs showed a linear association with any blood cell counts (Supplementary Material: Figure S1). These results provide further indirect support for the tumor-derived origin of lncRNAs.
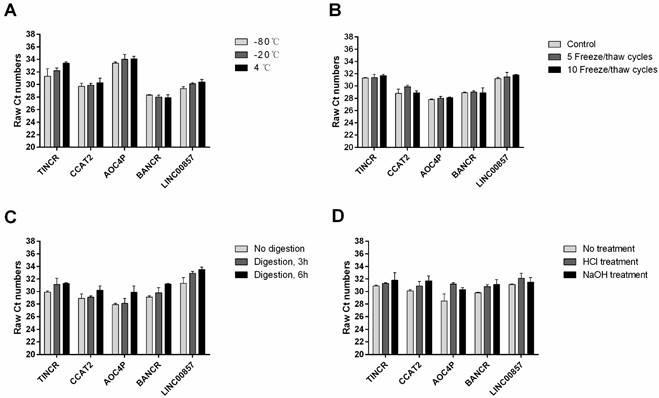
Stability of plasma lncRNAs under different conditions
A previous study has shown that plasma lncRNAs are resistant to RNase A digestion in esophageal carcinoma [12]. To test the stability of these five plasma lncRNAs in gastric cancer, we subjected the plasma samples to extreme conditions such as incubation at different temperature for 3 h, repeated freeze-thaw cycles, RNase A digestion for 3 h and 6 h, and low/high pH. Interestingly, such treatment has little or no impact on the concentrations of these plasma lncRNAs (Figure 5).
Stability of plasma lncRNAs under extreme conditions: incubation at different temperature for 3 h (A); repeated freeze-thaw cycles (B); RNase A digestion for 3 h and 6 h (C); and low/high pH (D).
Training phase: Expression levels of a panel of plasma lncRNAs are able to accurately diagnose GC
To investigate the diagnostic ability of the five lncRNAs (TINCR, CCAT2, AOC4P, BANCR and LINC00857) identified in the discovery phase, we determined the plasma expression level of these potential tumor markers in a cohort of 30 patients and 30 controls. As shown in Figure S2 (Supplementary Material), these five lncRNAs showed significantly upregulated expression in GC patients compared with healthy controls, with AUC values ranging from 0.66 to 0.82. The detailed sensitivity and specificity of each individual lncRNA are summarized in Table S3 (Supplementary Material). The optimal cut-off values for each lncRNA were determined using Youden's index. As shown in Table S3, with the cut-off value 11.0 × 10⁻², plasma lncRNA BANCR displayed the best diagnostic performance and the values for sensitivity and specificity were 0.73 (95% CI: 0.54-0.88) and 0.87 (95% CI: 0.69-0.96), respectively.
We also investigated the diagnostic roles of CEA, CA125, CA19-9 and CA72-4 for GC detection. The AUC values of these clinically widely used markers ranged from 0.51tab to 0.69 and the ROC curves are illustrated in Figure S3 (Supplementary Material). Among these four markers, Table S3 shows that CA125 yielded the optimal diagnostic ability with a sensitivity of 0.30 (95% CI: 0.15-0.49) and a specificity of 0.93 (95% CI: 0.78-0.99).
By using a logistic regression model, we calculated the regression coefficients of each lncRNA and the widely-used biomarkers (CEA, CA125, CA19-9 and CA72-4) individually, and constructed combined lncRNA-based Index I and CEA-based Index II using the regression coefficients as the weights. Interestingly, both of these combined indices outperformed the individual lncRNAs or carbohydrate antigens (CAs) with regard to GC detection (Table 2). Next, we plotted the ROC curves (Figure 6A) and compared the values of AUC using a nonparametric approach [26]. Index I showed significantly higher AUC values than Index II (P = 0.003) and exhibited the greatest diagnostic performance with an AUC value of 0.93 (95% CI: 0.87-0.99), suggesting that a combination of these five lncRNAs could accurately distinguish patients with GC from healthy controls.
Performance of lncRNA-based Index I and CEA-based Index II in the differential diagnosis of gastric cancer from healthy controls and patients with precancerous lesions and GIST.
| Cutoff | Sensitivity (95% CI) | Specificity (95% CI) | AUC (95% CI) | True positive | True negative | False positive | False negative | |
|---|---|---|---|---|---|---|---|---|
| Training phase | ||||||||
| Index I | 7.0 | 0.83 (0.65-0.94) | 0.90 (0.73-0.98) | 0.93 (0.87-0.99) | 25 | 27 | 3 | 5 |
| Index II | 29.9 | 0.57 (0.37-0.75) | 0.83 (0.65-0.94) | 0.71 (0.58-0.84) | 17 | 25 | 5 | 13 |
| Validation phase | ||||||||
| Index I | 7.0 | 0.81 (0.71-0.89) | 0.86 (0.77-0.93) | 0.90 (0.86-0.95) | 65 | 69 | 11 | 15 |
| Index II | 29.9 | 0.48 (0.36-0.59) | 0.88 (0.78-0.94) | 0.69 (0.61-0.78) | 38 | 70 | 10 | 42 |
| Combination phase | ||||||||
| Index I | 7.0 | 0.82 (0.73-0.89) | 0.87 (0.80-0.93) | 0.91 (0.88-0.95) | 90 | 96 | 14 | 20 |
| Index II | 29.9 | 0.50 (0.40-0.60) | 0.86 (0.79-0.92) | 0.70 (0.63-0.77) | 55 | 95 | 15 | 55 |
| Diagnostic performance of Index I in external phase | ||||||||
| Prec | 7.0 | 0.68 (0.50-0.82) | 0.89 (0.72-0.98) | 0.82 (0.71-0.92) | 25 | 25 | 3 | 12 |
| GIST | 7.0 | 0.68 (0.50-0.82) | 0.86 (0.64-0.97) | 0.80 (0.68-0.91) | 25 | 18 | 3 | 12 |
Evaluation of the diagnostic performance of lncRNA-based Index I and CEA-based Index II in the training phase. (A) Receiver-operating characteristic curve (ROC) for Index I and Index II and their corresponding area under the curve (AUC) values. (B) Perioperative changes for Index I. (C) Perioperative changes for Index II. The Wilcoxon signed rank test was used for the paired samples.
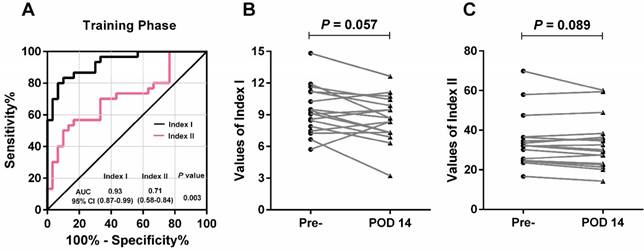
Among the 30 patients in the training phase, 17 had blood sampled postoperatively. We investigated whether the two indices decreased after removal of the tumor and could thus be used to monitor tumor dynamics. As illustrated in Figure 6B and 6C, no significant difference was observed between pre- and postoperative expression regarding the two indices (P = 0.057 and P = 0.089); however, the lncRNA-based Index I showed a trend toward decreasing levels with a marginal P-value of 0.057.
Validation phase: Expression levels of a panel of plasma lncRNAs can accurately diagnose GC in a combined dataset and correlate with degree of pathology
We further analyzed the levels of plasma lncRNAs in an independent cohort of 80 patients with GC and 80 healthy controls. First, the diagnostic performance of individual lncRNAs and individual CAs was explored. Similar to the results in the training phase, the diagnostic ability of any individual lncRNA or CA was not clinically satisfactory, with maximum AUC values of 0.81 and 0.61 for lncRNAs and CAs, respectively (Supplementary Material: Figures S4 and S5). Table S4 (Supplementary Material) shows the detailed sensitivity and specificity of lncRNAs and CAs at the cut-off values determined in the training phase.
Concordant with the results in the training phase, lncRNA-based Index I yielded the greatest diagnostic performance with an AUC value of 0.90 (95% CI: 0.86-0.95) (Table 2). Furthermore, there was a significant difference between the AUC values of lncRNA-based Index I and CEA-based Index II (Figure 7A; P < 0.001).
Evaluation of the diagnostic performance of lncRNA-based Index I and CEA-based Index II in the validation phase. (A) Receiver-operating characteristic curve (ROC) for Index I and Index II and their corresponding area under the curve (AUC) values. (B) Perioperative changes for Index I. (C) Perioperative changes for Index II. The Wilcoxon signed rank test was used for the paired samples.
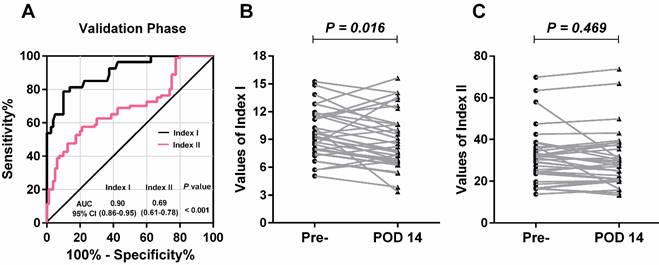
Among these 80 GC patients, postoperative blood samples were available for 35. The value of the lncRNA-based Index I decreased significantly after gastrectomy (Figure 7B; P = 0.016), whereas the value of the CEA-based Index II did not (Figure 7C; P = 0.469), indicating that Index I could be used to monitor tumor dynamics. We combined all the participants in the training phase and validation phase, and the ROC curves are shown in Figure 8. These show that Index I outperformed Index II in terms of GC diagnosis, yielding an AUC value of 0.91 (95% CI: 0.88-0.95) (P < 0.001).
Receiver-operating characteristic curve (ROC) for lncRNA-based Index I and CEA-based Index II and their corresponding area under the curve (AUC) values in the combination phase.
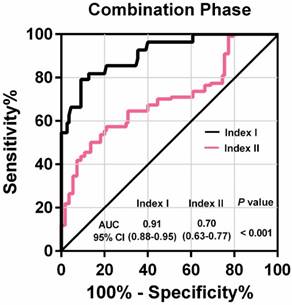
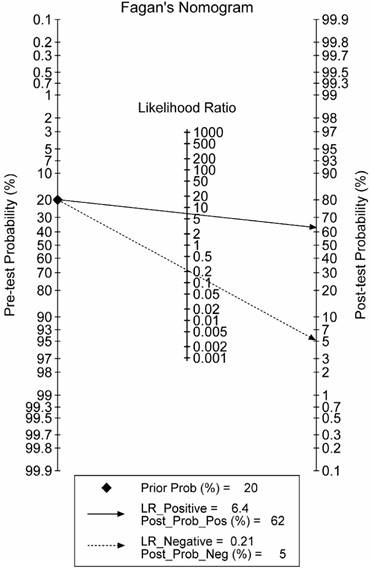
The combination phase demonstrated that lncRNA-based Index I could detect GC with a value of 0.82 (95% CI: 0.73-0.89) for sensitivity and 0.87 (95% CI: 0.80-0.93) for specificity. To make this information clinically useful, we constructed a Fagan's nomogram to help clinicians use the test results to estimate a patient's probability of having GC (Figure 9). We set the pre-test probability at a hypothetical value of 20%, which meant the patients had a 20% possibility of having GC. A line drawn from this point through the likelihood ratio (LR) of the lncRNA-based test intersects with the post-probability, which supplied the patient's chance of having GC after the test results are known. The positive and negative LRs of the lncRNA-based test were 6.5 and 0.21, respectively. As shown in Figure 9, with the presumed pre-test probability of 20%, the probability that a patient has GC would rise to 62% if the patient had a positive lncRNA-based test result. Conversely, the probability of having GC would decrease to 5% if the patient had a negative lncRNA-based test result. These data suggest that an lncRNA-based test could provide clinically useful information.
Fagan's nomogram for the calculation of the probability that an individual has gastric cancer based on the lncRNA-based diagnostic test.
To investigate Index-I-related clinicopathological factors, we pooled GC patients from the discovery, training and validation phases, and divided them into high and low levels of lncRNA-based Index I using the median level of the index as a cut-off. As shown in Table 3, the higher-level lncRNA-based index was significantly correlated with larger tumor size (P = 0.036), depth of invasion (P = 0.025), lymphatic metastasis (P = 0.012) and more advanced tumor stages (P = 0.003).
Correlation between levels of lncRNA-based Index I and clinicopathological characteristics of patients with GC from the discovery, training and validation phases.
| Variables | lncRNA-based Index I | P value | |
|---|---|---|---|
| High levels (N, %) | Low levels (N, %) | ||
| Age, y | 0.393 | ||
| ≥ 55 | 37 (58.7) | 41 (66.1) | |
| ˂ 55 | 26 (41.3) | 21 (33.9) | |
| Gender | 0.091 | ||
| Male | 51 (81.0) | 42 (67.7) | |
| Female | 12 (29.0) | 20 (32.3) | |
| Size | 0.036 | ||
| ≥ 5 cm | 45 (71.4) | 33 (53.2) | |
| ˂ 5 cm | 18 (28.6) | 29 (46.8) | |
| Differentiation | 0.290 | ||
| Well/moderate | 25 (39.7) | 19 (30.6) | |
| Poor/undifferentiated | 38 (61.3) | 43 (69.4) | |
| Depth of invasion | 0.025 | ||
| T1/2 | 26 (41.3) | 38 (61.3) | |
| T3/4 | 37 (58.7) | 24 (38.7) | |
| Lymphatic metastasis | 0.012 | ||
| Positive | 48 (76.2) | 34 (54.8) | |
| Negative | 15 (23.8) | 28 (45.2) | |
| Distant metastasis | 1.000# | ||
| Positive | 2 (3.2) | 1 (1.6) | |
| Negative | 61 (96.8) | 61 (98.4) | |
| pTNM stage | 0.003 | ||
| I/II | 22 (34.9) | 38 (61.3) | |
| III/IV | 41 (65.1) | 24 (38.7) | |
# Fisher's exact test.
External phase: Expression levels of a panel of plasma lncRNAs can distinguish GC from related diseases
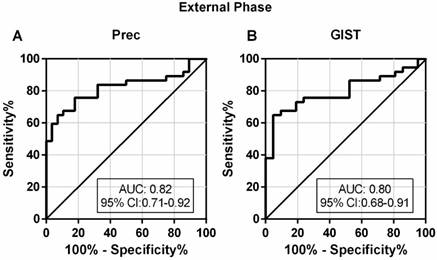
A good diagnostic test should not only be able to distinguish patients from healthy controls, but also to differentially diagnose patients with similar symptoms. To investigate the discriminatory ability of lncRNA-based Index I in patients with GC and with other diseases, we determined the diagnostic performance of Index I in a separate cohort of 37 patients with GC, 28 Prec individuals and 21 GIST cases. The sensitivity and specificity of Index I to distinguish GC from Prec were 0.68 (95% CI: 0.50-0.82) and 0.89 (95% CI: 0.72-0.98), respectively, and the sensitivity and specificity to distinguish GC from GIST were 0.68 (95% CI: 0.50-0.82) and 0.86 (95% CI: 0.64-0.97), respectively (Table 2). The ROC curves are illustrated in Figure 10.
Evaluation of the diagnostic performance of lncRNA-based Index I in the external phase. (A) The ability of the lncRNA-based panel to differentiate patients with GC and individuals with precancerous lesions (Prec). (B) The ability of the lncRNA-based panel to differentiate patients with GC and individuals with gastrointestinal stromal tumor (GIST).
Discussion
The discovery of lncRNAs not only contributes to elucidating the molecular mechanism of carcinogenesis, but also provides a new class of molecules with the potential for use as noninvasive diagnostic biomarkers [31]. There are several advantages to employing lncRNAs as tumor biomarkers. First, lncRNAs can be readily detected in biological fluids, including plasma [15], serum [18], gastric juice [32] and urine [33]. For example, lncRNA PCA3, a specific biomarker in the urine, has been approved by the Food and Drug Administration (FDA) for prostate cancer diagnosis [33]. Second, in contrast to clinically widely used CAs, lncRNAs function pathologically during cancer progression and their expression level may be a better indicator for cancer dynamics. Third, lncRNAs can be characterized by tissue-specific expression patterns, which can facilitate accurate classification of tumor type [7].
Emerging studies have investigated the diagnostic potential of circulating lncRNAs for cancer detection. A serum-based five-lncRNA signature was reported to be able to discriminate patients with clear cell renal cell carcinomas from healthy controls, with an AUC value of 0.9 [34]. For gastric cancer, Dong et al demonstrated that a serum three-lncRNA panel can serve as a diagnostic set of biomarkers [18]. A recent study has also reported that detection of lncRNA H19 in the plasma could be used to detect gastric cancer with a sensitivity of 82.9% and a specificity of 72.9% [14]. However, these studies focused on the diagnostic potential of preselected lncRNAs based on previous literature, leaving the majority of lncRNAs unexplored.
Unlike previous studies [14, 18, 32], we conducted the first genome-wide lncRNA screening strategy in two sets of samples: five paired preoperative and POD 14 plasma samples; and tissue samples from tumor and adjacent normal tissues. As a result, we identified five novel consistently upregulated tumor-related lncRNAs (TINCR, CCAT2, AOC4P, BANCR and LINC00857) in the discovery phase, which were confirmed in the independent cohort of the subsequent training phase. In this phase, all five of these plasma lncRNAs showed differential expression between patients and controls. The ROC plots illustrated that the combined use of these five plasma lncRNAs yielded better diagnostic performance than the use of lncRNAs individually, with an AUC value of 0.93 (95% CI: 0.87-0.99). Moreover, the combined lncRNA-based Index I significantly outperformed the combined CEA-based Index II, which only had an AUC value of 0.71 (95% CI: 0.58-0.84). Next, in the validation phase we observed similar results in another independent cohort of participants. Notably, Index I showed the greatest diagnostic performance in distinguishing GC patients from healthy controls, with an AUC value of 0.91 (95% CI: 0.88-0.95) in the combination phase (Table 2; Figure 8). The AUC provides a global estimate of diagnostic performance. According to the suggested guidelines for interpretation of AUC values [35], Index I had high diagnostic accuracy (AUC > 0.9) for GC detection and significantly outperformed Index II (P < 0.001). Compared indirectly with reported data in previous studies [14, 16], the AUC value of Index I was also relatively higher than others. Generally, a positive LR > 5.0 is considered clinically useful [36, 37]. The positive LR of the lncRNA-based test was 6.5, and the Fagan's nomogram we constructed (Figure 9) facilitates the interpretation of these data into clinically useful information. Because we initially confirmed that the five lncRNAs were tumor-derived, we reasoned that the level of Index I would decrease after removal of the tumor. Consistent with our prediction, we found the value of Index I did indeed significantly decrease after gastrectomy (Figure 7B), indicating that it could be used to monitor tumor dynamics.
With the aim of identifying Index-I-related clinicopathological factors, we found that high levels of Index I were correlated with tumor size, depth of invasion, lymphatic metastasis and advanced tumor stage (Table 3). Large tumor size and advanced stage mean more cancer cells, as well as more potential tumor-derived lncRNAs secreted into the bloodstream. These results corresponded well with our in vitro experiments, which showed that lncRNA levels in the medium of SGC-7901 increased with increasing cell count while lncRNA levels remained almost unchanged in the medium of GES-1. Similar to our results, other recent studies have also reported tumor stage-associated and secreted lncRNAs [12, 32].
Interestingly, the present study indicates that these secreted lncRNAs can remain stable in circulation even when subjected to harsh conditions such as extreme pH and RNase A digestion. The release of non-coding RNAs into the blood is thought to be associated with apoptosis and necrosis of tumor cells from the tumor microenvironment and is also the result of secretion. These non-coding RNAs are incorporated within exosomes and microvesicles, and so are protected from the RNase digestion that occurs in bodily fluids, which might account for the stability of lncRNAs in the blood [7]. Little is known about the functional role of circulating lncRNAs in carcinogenesis. Kogure and colleagues have reported that extracellular vesicle-mediated transfer of lncRNAs such as TUC339, secreted by tumor cells, can modulate their environment and promote hepatocellular cancer growth [38]. A recent study has also shown that exosome-incorporated lncRNAs in circulation promote sunitinib resistance in renal cancer [39]. These observations are of critical importance because they not only shed new light on the intercellular role of circulating lncRNAs as signal mediators but also provide us with the possibility of developing therapeutic strategies based on circulating lncRNAs.
Understanding the molecular function of lncRNAs in carcinogenesis would promote their clinical application. Of the five lncRNAs (TINCR, CCAT2, AOC4P, BANCR and LINC00857) we identified in the present study, TINCR, CCAT2 and BANCR have previously been reported to be upregulated in gastric cancer, consistent with our results [28, 30, 40]. TINCR, upregulated by nuclear transcription factor SP1, can modulate cell proliferation and apoptosis by influencing KLF2 mRNA stability and expression in gastric cancer, and could serve as a potential therapeutic target [28]. The lncRNA CCAT2 has been shown to be correlated with lymph node and distant metastases, and could predict patients' progression-free and overall survival [40]. BANCR has also been reported as an unfavorable prognostic biomarker and could regulate cell growth and apoptosis of gastric cancer cells through affecting the expression level of NF-ĸB1 [29, 30]. The other two lncRNAs, AOC4P and LINC00857, have not been investigated in gastric cancer, but have been explored with respect to other tumors. AOC4P, also known as UPAT, was needed for the survival and tumorigenicity of colorectal cancer cells through regulating protein ubiquitination and degradation [41], and could also inhibit epithelial-mesenchymal transition in hepatocellular carcinoma [42]. LINC00857, which was upregulated in lung cancer, was predictive of poor patient survival and promoted tumor progression via cell cycle regulation [43]. The functional and mechanistic aspects of these aberrantly expressed lncRNAs in gastric cancer need further in-depth investigation. Specifically, it would be interesting to unveil whether these circulating lncRNAs could spread signals intercellularly and cause deleterious effects at a distance.
The strengths of our study are: the relatively large number of participants enrolled; genome-wide lncRNA profiling conducted for the first time in tissue and plasma samples followed by three phases of individual quantitation; identification of a novel lncRNA-based index; and construction of a clinically useful Fagan's nomogram. Despite the relatively high diagnostic performance of the lncRNA-based index, one limitation of our study should be taken into consideration. Because of the limited number of patients with early gastric cancer (EGC) (most of the GC patients in China are locally advanced), we did not evaluate the diagnostic ability of the lncRNA-based index in cohorts comprising only EGC patients. It has previously been shown that early detection and treatment of gastric cancer results in a 5-year survival rate estimated at 90% [44], which is much better than that for locally advanced GC. Therefore, ongoing work is focused on determining whether our panel of lncRNAs will be effective in diagnosing EGC.
Conclusion
We applied a systematic strategy to identify a novel lncRNA-based panel that had the ability to distinguish patients with gastric cancer from healthy controls and Prec individuals. Although our findings are preliminary, we have laid the foundation for applying this lncRNA-based panel to clinical practice. Further studies focusing on the prognostic value of circulating lncRNAs for predicting patients' survival will provide important advances to the management of gastric cancer.
Supplementary Material
Supplementary figures and tables.
Abbreviations
lncRNAs: long non-coding RNAs; GC: gastric cancer; EGC: early gastric cancer; CI: confidence interval; CEA: carcinoembryonic antigen; CAs: carbohydrate antigens; Prec: precancerous lesions; POD 14: postoperative day 14; GIST: gastrointestinal stromal tumor; qRT-PCR: quantitative real-time PCR; RT: reverse transcription; ROC: receiver-operating characteristic curve; AUC: area under the ROC curve; WBC: white blood cell; RBC: red blood cell; PLT: platelet; Hb: hemoglobin; LR: likelihood ratio; FDA: Food and Drug Administration.
Acknowledgements
This work was funded partly by the National Nature Science Foundation of China (No. 81272698, 81672319, 81602507), the Major State Basic Research Development Program of China (2014CBA02002), the National Key Research and Development Plan (No. 2016YFC0905302), the Beijing Municipal Science and Technology Plan projects (Z161100000516237), and the Beijing Municipal Science & Technology Commission (D131100005313010). Data available on request.
Competing Interests
The authors have declared that no competing interest exists.
References
1. Torre LA, Bray F, Siegel RL. et al. Global cancer statistics, 2012. CA Cancer J Clin. 2015;65:87-108
2. Chen W, Zheng R, Baade PD. et al. Cancer statistics in China, 2015. CA Cancer J Clin. 2016;66:115-132
3. Hartgrink HH, Jansen EP, van Grieken NC. et al. Gastric cancer. Lancet. 2009;374:477-490
4. Kunz PL, Gubens M, Fisher GA. et al. Long-term survivors of gastric cancer: a California population-based study. J Clin Oncol. 2012;30:3507-3515
5. Yang AP, Liu J, Lei HY. et al. CA72-4 combined with CEA, CA125 and CAl9-9 improves the sensitivity for the early diagnosis of gastric cancer. Clin Chim Acta. 2014;437:183-186
6. Ychou M, Duffour J, Kramar A. et al. Clinical significance and prognostic value of CA72-4 compared with CEA and CA19-9 in patients with gastric cancer. Dis Markers. 2000;16:105-110
7. Huarte M. The emerging role of lncRNAs in cancer. Nat Med. 2015;21:1253-1261
8. Iyer MK, Niknafs YS, Malik R. et al. The landscape of long noncoding RNAs in the human transcriptome. Nat Genet. 2015;47:199-208
9. Cabili MN, Trapnell C, Goff L. et al. Integrative annotation of human large intergenic noncoding RNAs reveals global properties and specific subclasses. Genes Dev. 2011;25:1915-1927
10. Lee GL, Dobi A, Srivastava S. Prostate cancer: diagnostic performance of the PCA3 urine test. Nat Rev Urol. 2011;8:123-124
11. Panzitt K, Tschernatsch MM, Guelly C. et al. Characterization of HULC, a novel gene with striking up-regulation in hepatocellular carcinoma, as noncoding RNA. Gastroenterology. 2007;132:330-342
12. Tong YS, Wang XW, Zhou XL. et al. Identification of the long non-coding RNA POU3F3 in plasma as a novel biomarker for diagnosis of esophageal squamous cell carcinoma. Mol Cancer. 2015;14:3
13. Jin C, Shi W, Wang F. et al. Long non-coding RNA HULC as a novel serum biomarker for diagnosis and prognosis prediction of gastric cancer. Oncotarget. 2016 [Epub ahead of print]
14. Zhou X, Yin C, Dang Y. et al. Identification of the long non-coding RNA H19 in plasma as a novel biomarker for diagnosis of gastric cancer. Sci Rep. 2015;5:11516
15. Arita T, Ichikawa D, Konishi H. et al. Circulating long non-coding RNAs in plasma of patients with gastric cancer. Anticancer Res. 2013;33:3185-3193
16. Li Q, Shao Y, Zhang X. et al. Plasma long noncoding RNA protected by exosomes as a potential stable biomarker for gastric cancer. Tumour Biol. 2015;36:2007-2012
17. Liu Z, Shao Y, Tan L. et al. Clinical significance of the low expression of FER1L4 in gastric cancer patients. Tumour Biol. 2014;35:9613-9617
18. Dong L, Qi P, Xu MD. et al. Circulating CUDR, LSINCT-5 and PTENP1 long noncoding RNAs in sera distinguish patients with gastric cancer from healthy controls. Int J Cancer. 2015;137:1128-1135
19. Pritchard CC, Kroh E, Wood B. et al. Blood cell origin of circulating microRNAs: a cautionary note for cancer biomarker studies. Cancer Prev Res (Phila). 2012;5:492-497
20. Witwer KW, Buzas EI, Bemis LT. et al. Standardization of sample collection, isolation and analysis methods in extracellular vesicle research. J Extracell Vesicles. 2013:2
21. Kirschner MB, Kao SC, Edelman JJ. et al. Haemolysis during sample preparation alters microRNA content of plasma. PLoS One. 2011;6:e24145
22. Zhang KC, Xi HQ, Cui JX. et al. Hemolysis-free plasma miR-214 as novel biomarker of gastric cancer and is correlated with distant metastasis. Am J Cancer Res. 2015;5:821-829
23. McShane LM, Hayes DF. Publication of tumor marker research results: the necessity for complete and transparent reporting. J Clin Oncol. 2012;30:4223-4232
24. Sano T, Aiko T. New Japanese classifications and treatment guidelines for gastric cancer: revision concepts and major revised points. Gastric Cancer. 2011;14:97-100
25. Cai Y, Yang Y, Chen X. et al. Circulating 'lncRNA OTTHUMT00000387022' from monocytes as a novel biomarker for coronary artery disease. Cardiovasc Res. 2016 [Epub ahead of print]
26. DeLong ER, DeLong DM, Clarke-Pearson DL. Comparing the areas under two or more correlated receiver operating characteristic curves: a nonparametric approach. Biometrics. 1988;44:837-845
27. Zheng Q, Wu F, Dai WY. et al. Aberrant expression of UCA1 in gastric cancer and its clinical significance. Clin Transl Oncol. 2015;17:640-646
28. Xu TP, Liu XX, Xia R. et al. SP1-induced upregulation of the long noncoding RNA TINCR regulates cell proliferation and apoptosis by affecting KLF2 mRNA stability in gastric cancer. Oncogene. 2015;34:5648-5661
29. Zhang ZX, Liu ZQ, Jiang B. et al. BRAF activated non-coding RNA (BANCR) promoting gastric cancer cells proliferation via regulation of NF-kappaB1. Biochem Biophys Res Commun. 2015;465:225-231
30. Li L, Zhang L, Zhang Y. et al. Increased expression of LncRNA BANCR is associated with clinical progression and poor prognosis in gastric cancer. Biomed Pharmacother. 2015;72:109-112
31. Sanchez Y, Huarte M. Long non-coding RNAs: challenges for diagnosis and therapies. Nucleic Acid Ther. 2013;23:15-20
32. Yuan CL, Li H, Zhu L. et al. Aberrant expression of long noncoding RNA PVT1 and its diagnostic and prognostic significance in patients with gastric cancer. Neoplasma. 2016;63:442-449
33. Schmitt AM, Chang HY. Long Noncoding RNAs in Cancer Pathways. Cancer Cell. 2016;29:452-463
34. Wu Y, Wang YQ, Weng WW. et al. A serum-circulating long noncoding RNA signature can discriminate between patients with clear cell renal cell carcinoma and healthy controls. Oncogenesis. 2016;5:e192
35. Swets JA. Measuring the accuracy of diagnostic systems. Science. 1988;240:1285-1293
36. Jaeschke R, Guyatt GH, Sackett DL. Users' guides to the medical literature. III. How to use an article about a diagnostic test. B. What are the results and will they help me in caring for my patients? The Evidence-Based Medicine Working Group. JAMA. 1994;271:703-707
37. Zhang K, Cui J, Xi H. et al. Serum HER2 Is a Potential Surrogate for Tissue HER2 Status in Gastric Cancer: A Systematic Review and Meta-Analysis. PLoS One. 2015;10:e0136322
38. Kogure T, Yan IK, Lin WL. et al. Extracellular Vesicle-Mediated Transfer of a Novel Long Noncoding RNA TUC339: A Mechanism of Intercellular Signaling in Human Hepatocellular Cancer. Genes Cancer. 2013;4:261-272
39. Qu L, Ding J, Chen C. et al. Exosome-Transmitted lncARSR Promotes Sunitinib Resistance in Renal Cancer by Acting as a Competing Endogenous RNA. Cancer Cell. 2016;29:653-668
40. Wang CY, Hua L, Yao KH. et al. Long non-coding RNA CCAT2 is up-regulated in gastric cancer and associated with poor prognosis. Int J Clin Exp Pathol. 2015;8:779-785
41. Taniue K, Kurimoto A, Sugimasa H. et al. Long noncoding RNA UPAT promotes colon tumorigenesis by inhibiting degradation of UHRF1. Proc Natl Acad Sci U S A. 2016;113:1273-1278
42. Wang TH, Lin YS, Chen Y. et al. Long non-coding RNA AOC4P suppresses hepatocellular carcinoma metastasis by enhancing vimentin degradation and inhibiting epithelial-mesenchymal transition. Oncotarget. 2015;6:23342-23357
43. Wang L, He Y, Liu W. et al. Non-coding RNA LINC00857 is predictive of poor patient survival and promotes tumor progression via cell cycle regulation in lung cancer. Oncotarget. 2016;7:11487-11499
44. Ahn HS, Lee HJ, Yoo MW. et al. Changes in clinicopathological features and survival after gastrectomy for gastric cancer over a 20-year period. Br J Surg. 2011;98:255-260
Author contact
![]() Corresponding authors: Lin Chen; Bo Wei E-mail: chenlinbj301com or chenlincom.cn or weibobj301com Tel: +86-10-66938128 Fax: +86-10-68181689.
Corresponding authors: Lin Chen; Bo Wei E-mail: chenlinbj301com or chenlincom.cn or weibobj301com Tel: +86-10-66938128 Fax: +86-10-68181689.