Impact Factor
- Issue 14; 2026
- Issue 13; 2026
- Issue 12; 2026
- Issue 11; 2026
- Issue 10; 2026
- Volume 16; 2026
- Advance Articles
- Past Issues
- Cover Images
- Cover Suggestion
- Index & Coverage
- Special Issues
Introduction
Results
Discussion
Materials and methods
Supplementary Material
Acknowledgements
References
International Journal of Biological Sciences
International Journal of Medical Sciences
 Global reach, higher impact

Theranostics 2017; 7(4):1036-1046. doi:10.7150/thno.18005 This issue Cite
Research Paper
Cysteine transporter SLC3A1 promotes breast cancer tumorigenesis
Yang Jiang1,2*, Yuan Cao1*, Yongbin Wang1*, Wei Li3, Xinyi Liu1, Yixuan Lv1, Xiaoling Li4, Jun Mi1 ![]()
1. Key Laboratory of Cell Differentiation and Apoptosis of Chinese Ministry of Education, Shanghai Jiao Tong University School of Medicine
280 South Choongqing Rd., Shanghai 200025, China
2. Institute of Cancer Stem Cell, Dalian Medical University
9. West South-Lvshun Rd., Dalian, Liaoning 116044, China
3. 1st affiliated hospital of Soochow University
188 Shizi Rd. Suzhou, Jiangsu 215006, China
4. NIEHS, National Institute of Health
111 T W Alexander Dr., Rall Building, Research Triangle Prk, NC 27709, USA.
* These authors contribute equally to this study.
Received 2016-10-19; Accepted 2017-1-17; Published 2017-2-26
Abstract

Cysteine is an essential amino acid for infants, aged people as well as patients with metabolic disorders. Although the thiol group of cysteine side chain is active in oxidative reactions, the role of cysteine in cancer remains largely unknown. Here, we report that the expression level of the solute carrier family 3, member 1 (SLC3A1), the cysteine carrier, tightly correlated with clinical stages and patients' survival. Elevated SLC3A1 expression accelerated the cysteine uptake and the accumulation of reductive glutathione (GSH), leading to reduced reactive oxygen species (ROS). ROS increased the stability and activity of PP2Ac, resulting in decreased AKT activity. Hence, SLC3A1 activated the AKT signaling through inhibiting PP2A phosphatase activity. Consistently, overexpression of SLC3A1 enhanced tumorigenesis of breast cancer cells, whereas blocking SLC3A1 either with specific siRNA or SLC3A1 specific inhibitor sulfasalazine suppressed tumor growth and also abolished dietary NAC-promoted tumor growth. Collectively, our data demonstrate that SLC3A1 promotes cysteine uptake and determines cellular response to antioxidant N-acetylcysteine, suggesting SLC3A1 is a potential therapeutic target for breast cancer.
Keywords: solute carrier SLC3A1, breast cancer, ROS, cysteine, PDK1
Introduction
A hallmark of cancer cells is the presence of elevated reactive oxygen species (ROS). Moderate ROS stimulates the phosphorylation of mitogen-activated protein kinase (MAPK) and extracellular signal-regulated kinase (ERK), expression of cyclin D1, hypoxia inducible factor-1 stability and the activation of JUN N-terminal kinase (JNK) (1-3). ROS also directly inhibits the activity of tumor suppressors including phosphatase and tensin homolog (PTEN) and protein tyrosine phosphatases (PTPs) due to the presence of the redox-sensitive cysteine residues in their catalytic center (4, 5). Although moderate ROS promotes tumor growth and metastasis, excessive ROS induces apoptosis.
NADPH and GSH are main electron donors to reduce excessive ROS. There are three metabolic pathways to generate NADPH: 1) the pentose phosphate pathway, 2) through the conversion of pyruvate to malate by malic enzymes and 3) through the conversion of isocitrate to α-ketoglutarate by isocitrate dehydrogenases (6). Electron donors and antioxidant enzymes, such as manganese superoxide dismutases (SOD), glutathione peroxidases (GPx) and thiol-disulfide oxidoreductases, are upregulated in response to elevated ROS (6, 7). Furthermore, NRF2 (nuclear factor, erythroid 2 like 2) directly increases the transcription of all NADPH-generating enzymes by modulating glucose and glutamine metabolism (8).
GSH is produced by recycling or de novo synthesis. Synthesis of GSH occurs via a two-step ATP-requiring enzymatic process. The first step is catalyzed by glutamate- cysteine ligase (GCL), which is composed of catalytic and modifier subunits (GCLC and GCLM). This step conjugates cysteine with glutamate, generating γ-glutamylcysteine.
The second step is catalyzed by GSH synthase, which adds glycine to γ-glutamylcysteine to form γ-glutamylcysteinylglycine or GSH, which exerts a negative feedback inhibition on GCL. The inactivation of tumor-specific metabolic enzyme PKM2 by high level of ROS leads to the diversion of metabolites towards NADPH generation and subsequent GSH regeneration (9). Serine is a metabolic precursor of glycine, and glycine is used by glutathione synthetase for the second step of de novo GSH synthesis. Therefore, the phosphoglycerate dehydrogenase (PHGDH) - driven serine biosynthesis is another important metabolic pathway to yield GSH (10) (11).
Thus, cysteine as well as glutamate and glycine are critical substrates for synthesis of glutathione (GSH). Among these three amino acids, glutamate and glycine are most elevated intermediate metabolites in cancer cells (12), while cysteine is derived normally from the diet and protein breakdown. Therefore, we speculate the uptake of cysteine is elevated in response to excessive ROS in cancer cells.
The uptake of cysteine mainly depends on heterodimeric amino acid transporters (HATs) present on the cytoplasma membrane, consisting a heavy chain SLC3 (solute carrier 3) and a light chain SLC7. The heavy chain SLC3 is essential for plasma membrane localization and the light chain stabilization. Two heavy chains, SLC3A1 and SLC3A2 have been identified. SLC3A2 interacts with most the light chain whereas SLC3A1 has been known to form a heterodimer only with SLC7A9, a family member of light chain (13, 14). The SLC3A1 protein is mainly expressed in the apical plasma membrane in the epithelial cells of intestinal mucosa and the renal proximal tubule (15-17). Mutations and deletions of this gene are associated with cystinuria (18, 19). However, the role of SLC3A1 in cancer remains largely unknown.
In this study, we found that SLC3A1 expression was upregulated in breast cancer cells, and promoted tumorigenesis of breast cancer cells. Moreover, we found ROS increased stability and activity of PP2Ac (protein serine/threonine phosphatase 2A catalytic subunit), which was distinct from PTPs that was inactivated by ROS.
Results
Expression levels of SLC3A1 are correlated with breast cancer progression
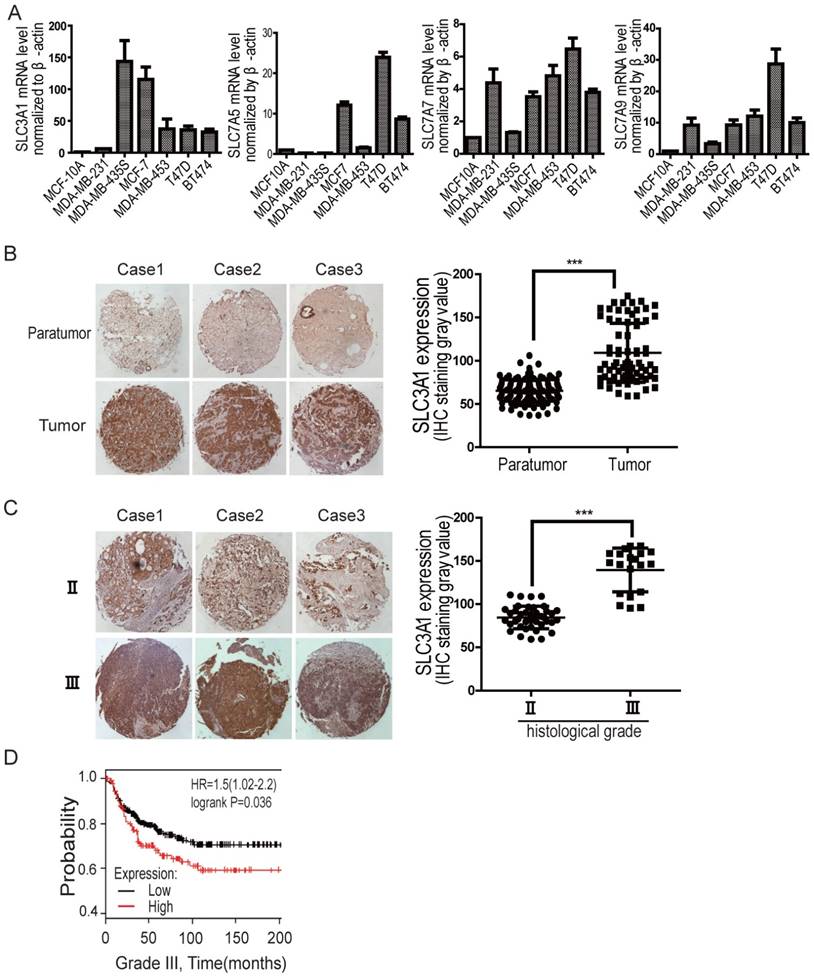
We have previously shown that SLC3A1, the heavy chain of the heterodimeric cysteine transporters, was highly upregulated in various breast cancer cell lines, compared to the expression of ASCTs (neutral amino acid transporter), the additional cysteine transporters, such as ASCT1-3 (Figure S1A). To determine whether cysteine promotion of breast cancer tumorigenesis depends on SLC3A1, its expression was further analyzed by quantitative PCR in various breast cancer cell lines. As shown in Figure 1A, although the expression of light chains, such as SLC7A5, SLC7A7 and SLC7A9, increased to some extent (2 times to 28 times) in some of breast cancer cell lines comparing to normal breast epitheliam, SLC3A1 expression is highly upregulated in most breast cancer lines, 30 times more than that in normal breast epithelium. Our immunohistochemistry data also showed that SLC3A1 was highly expressed in breast cancers compared to peritumoral tissues (Figure 1B); and closely correlated with clinical stages of breast cancers (Figure 1C). Nonimmune IgG was considered as negative control (Figure S1B). Also, the Kaplan-Meier survival analysis showed all histological grades of breast cancer patients with higher SLC3A1 expression had a worse prognosis than those with lower SLC3A1 expression (p < 0.05, Figure 1D, S1C & S1D), suggesting that the cysteine transporter SLC3A1 promote breast cancer progression.
The expression level of SLC3A1 is correlated with breast cancer progression. A. Expression analysis of cysteine transporter genes by qPCR in breast cancer cell lines. B. Immunohistochemistry analysis on tissue array of clinical breast cancers vs peritumoral tissues. The graphic presents the levels of SLC3A1 expression, which were analyzed by the densitometry method (***: P < 0.001). C. Immunohistochemistry analysis on tissue array of breast cancers at different clinical stages. The graphic presents the levels of SLC3A1 expression, analyzed by the densitometry method (***: P < 0.001). D. Kaplan-Meier analysis of breast cancer patients with low level (259 cases) vs high level (132 cases) of SLC3A1 expression.
SLC3A1 promotes tumorigenesis of breast cancer cells
To investigate whether SLC3A1 potentiates breast cancer progression, the SLC3A1 were overexpressed in breast cancer MDA-MB-231 cells with low level of endogenous SLC3A1 or knocked-down in breast cancer MDA-MB-453 cells with high level of endogenous SLC3A1 (Figure 2A). Our data showed that SLC3A1 overexpression promoted the growth of MDA-MB-231 cells while SLC3A1knockdown attenuated the growth of MDA-MB-453 cells (Figure 2B). Consistent with this observation, the overexpression of SLC3A1 accelerated cell proliferation, which was evident by an increase in the BrdU incorporation, and the subpopulation of cells in the S phase; conversely, the knockdown of SLC3A1 decreased both cell proliferation and the subpopulation of cells in the S phase (Figure S2A & S2B). Thus, the most significant findings were that the overexpression of SLC3A1 significantly increased the colony numbers of breast cancer cell while SLC3A1 knockdown reduced these colonies (Figure 2C); suggesting SLC3A1 promotes tumorigenesis of breast cancer cells.
SLC3A1 promotes tumorigenesis of breast cancer cells. A. SLC3A1 expression analysis of breast cancer cell lines. B. SLC3A1 overexpression increases MDA-MB-231 cell growth (*: P < 0.05); SLC3A1 knockdown decreases MDA-MB-453 cell growth (*: P < 0.05). The left pictures were representative cell photos at the indicated time points, the right histograms were quantitative results. C. SLC3A1 promotes the colony formation of breast cancer cells (**: P < 0.01; *: P <0.05). D. SLC3A1 overexpression promotes breast cancer cell tumorigenesis in xenograft mouse model. Blue is the control, Red is the overexpression group. E. SLC3A1 knockdown attenuates MDA-MB-453 cells tumorigenesis. Blue is control.
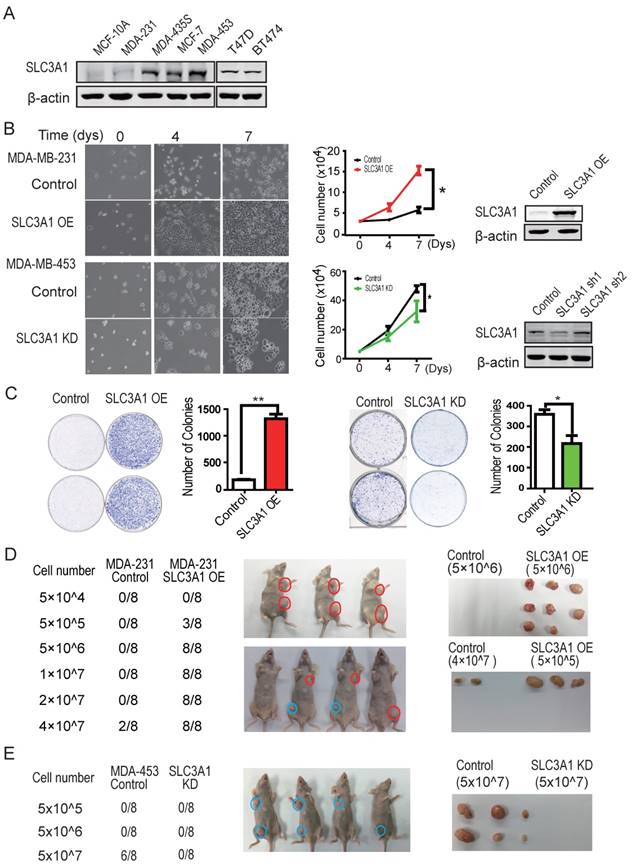
The role of SLC3A1 in tumorigenesis of breast cancer cells was confirmed by injecting MDA-MB-231 cells overexpressing SLC3A1 or MDA-MB-453 depleted of SLC3A1 into the armpits of nude mice as indicated by the schematic drawing (Figure S2C). As shown in Figure 2D, three weeks after injection, MDA-MB-231 cells expressing SLC3A1 formed tumors (3 in 8 injections) at the cell density of 5 x 10⁵ while control MDA-MB-231 cells developed tumors (2 in 8 injections) only at the cell density of 4 x 10⁷. In contrast, SLC3A1 knockdown significantly suppressed tumor formation of MDA-MB-453 cells (5 in 8 injections vs 0 in 8 injections at cell numbers of 5 x 10⁷) (Figure 2E). These observations suggested that SLC3A1 significantly promotes breast cancer cell tumorigenesis and growth.
SLC3A1 decreases ROS level by elevating cysteine uptake
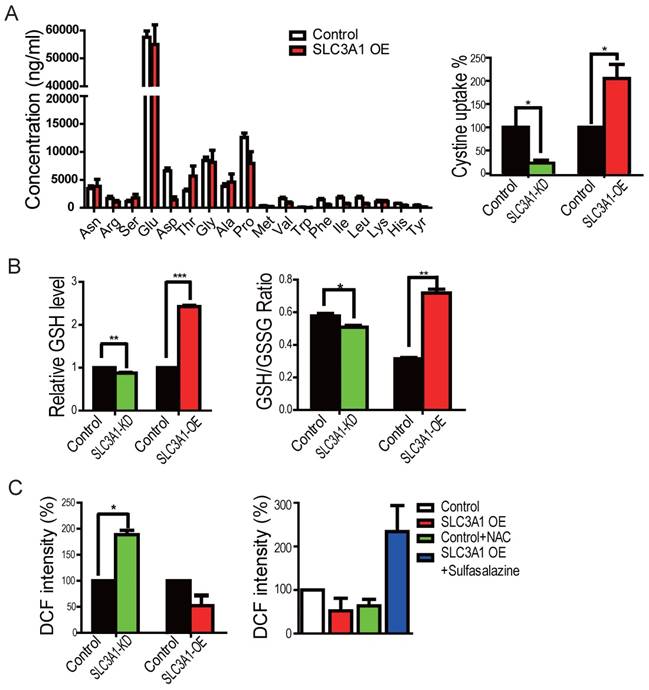
We first employed the mass-spectrometry analysis for the cellular metabolites to determine whether SLC3A1 promotes tumorigenesis through enhancing cysteine uptake in breast cancer cells overexpressing SLC3A1. However, the GS/MS analysis was unable to detect cysteine due to its instability (Figure 3A). We, therefore, used the homocysteine ELISA assay to determine the uptake of cysteine by breast cancer cells. As is shown in Figure 3A, SLC3A1 knockdown reduced while its overexpression increased cysteine uptake. To determine whether SLC3A1 modulated the cellular redox homeostasis, the levels of ROS and GSH were detected in breast cancer cells overexpressing SLC3A1 or depleted of SLC3A1. Overexpression of SLC3A1 increased the level of reductive glutathione GSH and the ratio of GSH to GSSH while SLC3A1 knockdown reduced the concentration of GSH and the ratio of GSH to GSSH (Figure 3B). As expected, the level of ROS was decreased or increased in cells expressing SLC3A1 or devoid of SLC3A1, respectively (Figure 3C). To further confirm the effect of SLC3A1 on ROS levels, cells expressing SLC3A1 were treated with the cysteine transporter inhibitor Sulfasalazine (20). As Figure 3C displays, sulfasalazine significantly increased cellular ROS level. These observations suggested that SLC3A1 down- regulates ROS level through an increase in cysteine uptake.
SLC3A1 decreased ROS level by elevating cysteine uptake. A. SLC3A1 increases Cysteine uptake. The cellular concentration of amino acid except cysteine was analyzed by GC-MS. Cysteine uptake was analyzed using the Homocysteine ELISA Kit. The cysteine concentration in control cells was 17.56 mg/L. B. SLC3A1 increases the content of reductive GSH and the ratio of GSH to GSSH. C. SLC3A1 increases the cellular ROS level. The Sulfasalazine was used a SLC3A1 inhibitor. NAC: N-acetylcysteine.
SLC3A1 promotes AKT activation through suppressing PP2A activity
We explored the mechanism underlying breast cancer cell tumorigenesis promoted by cysteine, by examining the phosphorylation and/or total protein levels of potential targets of ROS in cells expressing SLC3A1 or depleted of SLC3A1. As shown in Figure 4A, SLC3A1 significantly and specifically activated AKT. To validate the effect of SLC3A1 on AKT activation, the time course and dose response experiments were performed. Figures 4B & S3A show that AKT activation, evident by its phosphorylation, gradually increased with an increase in the SLC3A1 amount or in time post-transfection. MDA-MB-231 cells expressing SLC3A1 were treated with H2 O2 to determine whether ROS mediated SLC3A1 activation of AKT. The concentration and the time of treatment of MDA-MB-231 cells with H2 O2 were established by the dose response and the time course experiments, respectively (Figure S3B). The MDA-MB-231 cells without treatment or treated with NAC were considered as controls. As Figure 4C shows, H2 O2 abolished the SLC3A1-induced AKT activation while NAC did not have additional effects on the AKT activation compared to MDA-MB-231 cells expressing SLC3A1. Without SLC3A1 overexpression, NAC only had limited effect on AKT activation, indicating that the cysteine transporter SLC3A1 was essential for the cysteine-induced AKT activation and determined tumor response to NAC.
SLC3A1 promoted AKT activation by suppressing PP2A activity. A. Screening for potential molecule(s) mediating SLC3A1 regulation of tumor growth and progression. B. AKT activation induced by SLC3A1. The plasmid expressing SLC3A1 were transfected into 293T cells at the indicated concentrations. C. SLC3A1-triggered AKT activation abolished by H2 O2. D. PP2Ac but not PDK1 was regulated by cellular ROS level. E. PP2Ac was increased in breast cancer MDA-MB-453 cells depleted of SLC3A1. F. Inhibition of PP2A enhances AKT activation. The final concentration of okadaic acid was 1nM. G. SLC3A1 promotes oncogene expression through AKT-β-catenin pathway. H. ROS increases PP2Ac stability and activity through cysteine oxidation. The PP2Ac proteins for activity assay were purified from 293T cells treated with or without H2 O2. The yellow marked residues are conserved substrate binding motif of protein tyrosine phosphatases. The red marked residues are a speculated ROS reaction motif. CHX (cycloheximide): a protein synthesis inhibitor.
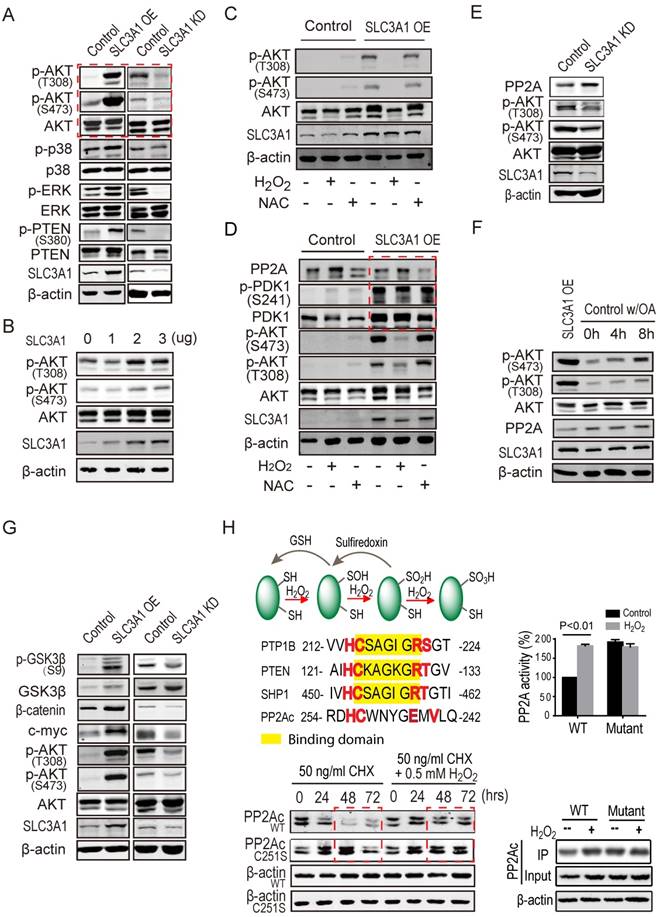
It is widely accepted that inhibition of phosphatases is regulated by oxidation of redox- sensitive cysteine residues (21). To explore the mechanism underlying the activation of AKT by cysteine, the expression and/or activation of both of the upstream kinase PDK1 and potential phosphatases of AKT were analyzed in MDA-MB-231 cells. As shown in Figure S3C, SLC3A1 overexpression activated PDK1 while reducing the protein level of phosphatase PP2Ac, the catalytic subunit of PP2A. To further confirm whether PDK1 mediated cysteine-activated AKT signaling, MDA-MB-231 cells expressing SLC3A1 were treated with H2 O2. Our data revealed that SLC3A1 overexpression activated PDK1 but this activation was not influenced by the H2O2 treatment and did not affect redox- regulated AKT signaling (Figure 4D), suggesting redox-regulated AKT activation was not dependent on PDK1. Furthermore, PP2Ac was detected in cells depleted of SLC3A1. As displayed in Figure 4E, SLC3A1 knockdown increased PP2Ac protein level and decreased AKT activity. MDA-MB-231 cells were treated with the PP2A inhibitor okadaic acid (OA) to verify if PP2A regulated AKT activation. Figure 4F shows that OA treatment increased AKT activity as is reflected by its phosphorylation at S473. The AKT activity was proportional to the increase in the dose of OA suggesting that PP2A regulated AKT activity.
We analyzed the molecular determinants downstream of AKT signaling in cells expressing SLC3A1 or depleted of SLC3A1 to determine the role of SLC3A1/AKT signaling in tumorigenesis, Figure 4G shows that SLC3A1 overexpression promoted the β-catenin accumulation and the expression of one of its target genes, c-myc, which is an important oncogene driving tumorigenesis. These observations suggest that the SLC3A1 promotes breast cancer cell tumorigenesis through AKT/GSK3β/β-catenin pathway.
The half-life and the activity of PP2Ac protein were analyzed in 293T cells to examine whether these parameters were affected by ROS. As shown in Figure 4H, the H2 O2 treatment increased the PP2Ac stability from 24 hours to 72 hours; the PP2A activity was also increased. Once the Cys251 of PP2Ac was mutated to serine, the half-life of PP2Ac was prolonged and the PP2A activity was elevated compared to wild type PP2Ac. However, the H2O2 treatment did not affect the stability and activity of mutant PP2Ac (Figure 4H).
Inhibition of SLC3A1 suppresses formation and progression of breast cancer
The tumor formation ability of breast cancer cells treated with SLC3A1 inhibitor sulfasazine (20) (22) was analyzed to establish whether inhibition of SLC3A1 would impede tumorigenesis. The dose and the treatment time with sulfasazine were determined by the dose response and the time course experiments in MDA-MB-231 cells. As shown in Figure 5A, SLC3A1 promoted the growth of MDA-MB-231 cancer cells which was significantly inhibited by 1 mM SASP, particularly in the cells overexpressing SLC3A1. The tumor formation ability was determined in the MDA-MB-231 cells expressing SLC3A1 after 24 hours pretreatment with the 1mM of SASP. As Figure 5B shows, the pre-treatment of cells with SASP before injection significantly impaired tumor formation of the MDA-MB-231 cells expressing SLC3A1 compared to the control group (5 tumors in 8 injections vs. 7 tumors in 8 injections). Furthermore, pre- treatment with SASP also reduced tumor volume (Figure 5B).
Inhibition of SLC3A1 suppresses breast cancer tumorigenesis. A. Determination of dose and treating time of sulfasalazine (SASP) on breast cancer cell. MDA-MB-231 cells were treated for 4 days at the indicated doses in the dose response experiment or treated with 1 mM of SASP for the indicated time points. B. Pre-treatment with SLC3A1 inhibitor attenuated tumor initiation and tumor growth of breast cancer. Tumors in blue circles but not in red circles were inoculated with MDA- MB-231 cells pre-treated with SLC3A1 inhibitor sulfasalazine. C. SLC3A1 inhibitor sulfasalazine suppressed tumor growth. SASP: Sulfasalazine, 16 mg/Kg/Day for 10 days. NAC: N-acetylcysteine, 1g/L in drinker water. D. The working model for SLC3A1 determination of cysteine promotion of breast cancer tumorigenesis. Cys: cysteine; ROS: reactive oxidative species; PP2A: protein serine/threonne phosphatase 2A.
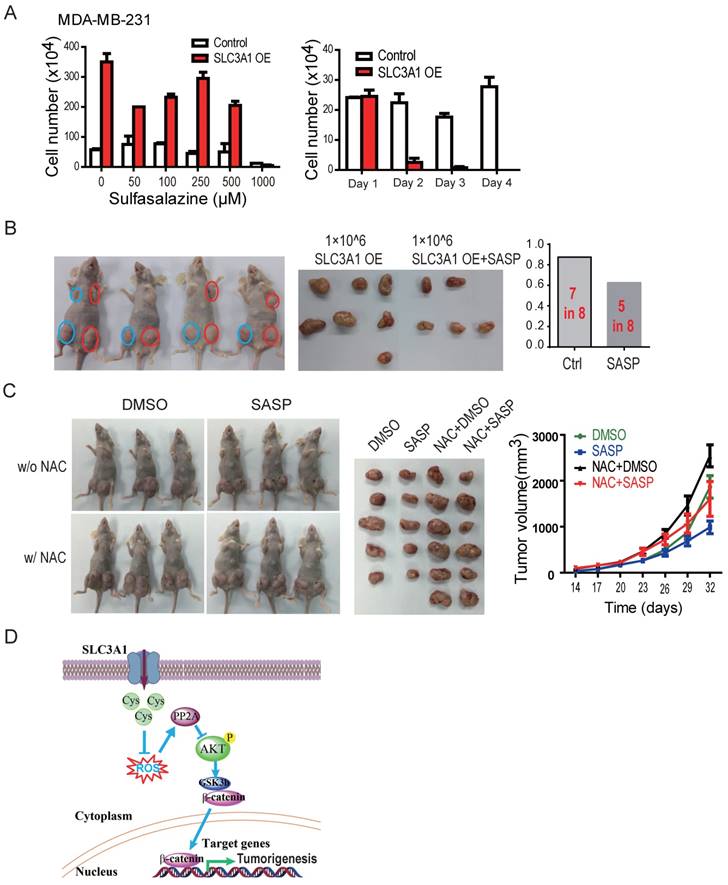
To further confirm whether SASP could suppress tumor growth in vivo, MDA-MB-453 cells xenografted tumors were treated with SASP locally, NAC in diet, or SASP plus NAC. As shown in Figure 5C, compared to the control group, the NAC alone promoted tumor growth (tumors in the 3rd column vs. tumors in the 1st column) and the SASP alone suppressed the tumor growth (tumors in the 2nd column vs. tumors in the 1st column). More importantly, the SASP treatment impaired the NAC-promoted tumor growth in vivo (tumors in the 4th column vs. tumors in the 3rd column), suggesting SLC3A1 is a potential target for breast cancer therapy.
Discussion
The concept that antioxidants can help fight cancer was well accepted in the general population and supported by some scientific studies (23-28). However, the therapeutic outcomes of tumor treatment with antioxidants are still controversial. These conflicting outcomes of antioxidants may be explained by the multiple roles ROS plays during the evolution of cancer. A recent study reported that supplementing the diet with the antioxidants N-acetylcysteine (NAC) markedly increases tumor progression and reduces survival in transgenic lung cancer mouse model (29). In this regard, our recent study demonstrated that the SLC3A1 is a critical subunit for cysteine uptake by the cells, and that the tumor promoting effect of NAC is determined by the cysteine transporter, SLC3A1, located on the plasma membrane of tumour cells.
ROS was speculated to inactivate PP2A through sulfenylation of the cysteine residue in the conserved motif which is similar to that present in protein tyrosine phosphatases (PTPs) (30, 31). ROS reacts with low pKa protein thiols, such as those on cysteine to form sulfenic acid (-SOH) (32). PTPs with the conserved motif HC(X)5 RS/T are inactivated by the ROS-catalyzed sulfenylation since binding of PTPs to their substrates is interrupted by this modification in their binding motif (Figure 4H). In contrast to PTPs, our data have demonstrated that ROS-catalyzed oxidation increased the stability and activity of PP2A. The motif of HC(X)4 EXV in PP2Ac, similar to the HC(X)5RS/T motif of PTPs, creates a unique environment for the catalytic cysteine residue (21). However, their roles are different in that the sulfenylation of cysteine 251 in the HC(X)4 EXV motif upregulates the stability and activity of phosphatase PP2Ac.This controversial role of sulfenylation could be due to the structure difference between two types of phosphatases. Unlike PTPs, PP2A is a holoenzyme, its substrate binding site is on the regulatory subunit while its sulfenylation motif is on the catalytic subunit. It is conceivable that the sulfenylation of PP2Ac does not affect the activity of PP2A as was confirmed by our data.
Our data demonstrate that tumorigenesis of breast cancer cells promoted by cysteine is dependent on the up-regulation of SLC3A1. Cysteine decreased the stability and activity of PP2Ac through reducing ROS level and activated AKT/GSK3β/β-catenin signaling (Figure 5D). Our findings support the conclusion that SLC3A1-mediated increase of cysteine uptake promotes tumorigenesis of breast cancer cells, and determines breast cancer cell response to antioxidant N-acetylcysteine. Thus, SLC3A1 can serve as a potential target for breast cancer therapy.
Materials and methods
Reagents and antibodies
The PP2A inhibitor Okadaic acid (OA) (Sigma, America) was dissolved in cultured medium with DMSO. The source for antibodies used for immunoblotting (IB) were as follows: Akt, phospho-Akt, phospho-GSK-3β, β- catenin (Cell Signaling Technology, MA, USA), GSK-3β (Epitomics, CA, USA), PP2A (ABclonal), SLC3A1 (ProteinTech), and β- actin (Santa Cruz Biotechnology, CA, USA).
Cell culture
293T cells and human breast cancer cells were cultured in DMEM (Invitrogen, Grand Island, NY, USA) supplemented with 10% fetal bovine serum (FBS; PAA, Australia).
Western Blotting
The cells were placed on ice and washed with ice-cold PBS. Total protein extract was prepared with the appropriate amount of RIPA lysis buffer (25 mM Tris-HCl at pH 7.5, 2 mM EDTA, 25 mM NaF and 1% Triton X-100) containing 1 X protease inhibitor mixture (Roche Inc., CH, Switzerland) and 1 X PMSF. The proteins were resolved on 7-15% SDS-polyacrylamide gels and transferred by electroblotting to nitrocellulose membranes (Bio-Rad Inc., CA, USA). The membranes were blocked with 5% nonfat dry milk in TBST (the mixture of tris-buffered saline and Tween 20) for 1 hour. Proteins of interest were detected with specific antibodies, blots were scanned using an Odyssey infrared imaging system (LI-COR), and proteins were quantitatively analyzed using the Odyssey software.
Establishment of stable cell lines expressing SLC3A1 or depleted of SLC3A1
Short-hairpin sequences targeting human SLC3A1 (NM_000341.3) were synthesized (Sangon Biotech) and separately inserted into miRzip lentiviral vector (Open Biosystems, Lafayette, CO). Lentiviruses knocking down SLC3A1 were generated in 293T cells by the co-transfection of vector containing shRNA sequence, pVSVg, pRSV-Rev, and pMDL (g/p) for 72 hours. Lentiviruses expressing SLC3A1 were generated in a 3 - plasmids packaging system, including psPAX2 and PMD2G. Viruses were collected from the supernatant of transfected 293T cells 3 days after transfection.
Cysteine uptake assay
The uptake of cysteine was analyzed by the Human Homocysteine (HCY) ELISA Kit. Briefly, 5 × 10⁵ cells were cultured in six-well plates for 24 h, followed by co-culture in 2 ml medium with or without cysteine for additional 12h. After completely washing, a biotin- conjugated antibody specific for HCY was added to the wells, and a colorimetric method was applied.
Mass spectrometry analysis of metabolites
The cellular contents of amino acids were analyzed by GC-MS as previously described (33). 5X10⁶ cells were harvested and suspended in chloroform-methanol-water (2:1:1, v/v/v). The derivatized sample was injected into a Shimadzu QP 2010 GC tandem quadrupole MS (Kyoto, Japan). The GC separation was performed on an Agilent DB-5 MS fused silica capillary column (30 m × 0.25 mm × 0.25 μm). The column temperature was 70 °C for the first 3 min and then increased 5 °C/min to 310 °C for 5 min. The injection temperature was set as 300 °C, and the injection volume was 1 μL with a 10:1 split ratio. Helium (99.9995%, China) was applied as a carrier gas. The column flow was 1.2 mL/min, and the column was equipped with a linear velocity control. The mass spectra scanning scope was set to 33-600 m/z in the full scan mode with a scan speed of 5 scans s-1 and a solvent cut time of 5.6 min based on the retention time of the pyridine solvent. The temperatures of the interface and the ion source were adjusted to 280 and 240 °C, respectively. The detector voltage was maintained at 1.2 kV, and the electron impact (EI) model was selected to achieve ionization of the metabolites at 70 eV.
Reactive oxygen species and glutathione detection
The 2,7-Dichlorodihydrofluorescein diacetate (DCFH-DA, Sigma) was used as a cellular ROS indicator. The DCFH-DA was transformed into 2,7-dichlorodihydrofluorescein (DCFH) by the esterases, which could be further oxidized to a highly fluorescent compound 2,7-dichlorofluorescein (DCF) by ROS. Cells were co-cultured with the 10 µM of DCFH-DA for 20 minutes, and analyzed by flow cytometry. The intensity of DCF represented intracellular ROS levels. GSH and GSSG Levels were measured using a GSH and GSSG Assay Kit (Beyotime, China) according to the manufacturer's protocol.
Analysis of PP2Ac modification, stability and activity
To analyze the modification of PP2Ac, the mass spectrometry analysis was performed on PP2Ac purified from MDA-MB-231 cells. For the stability assay, the protein levels of PP2Ac were analyzed in MDA-MB-231 cells treated with 50 ug/ml of cycloheximide and 0.2 mM of H2 O2 for the indicated times (24, 48, 72 hours). The cells without H2 O2 treatment were considered as control.
PP2A phosphatase activity was analyzed by the release of 32P phosphate from phosphorylase as previously described (34). PP2A purified from MDA-MB-231 cells was incubated with 15 µM phosphorylase A in 20 mM MOPS, pH 7.4, 50 mM NaCl, 1 mM MgCl2, 1% (v/v) 2-mercaptoethanol, 1 mM dithiothreitol, 10% glycerol, and 0.1 mg/mL of BSA in a total volume of 40 µL for 15 min at 30 °C. The reaction was terminated by addition of 60 µL of 1% bovine serum albumin and 300 µL of 15% (w/v) trichloroacetic acid and was incubated on ice for 10 min. After centrifugation at 15,000g for 10 min, the supernatant (300 µL) was analyzed for 32P release by liquid scintillation counting.
Xenografted mouse Tumors
Six-week-old female BALB/c nude mice were obtained from a Shanghai animal laboratory. The animals were handled according to the protocol approved by the Institutional Animal Care and Use Committee of Shanghai Jiao Tong University School of Medicine. The Control MDA-MB-231 cells or MDA-MB-231 cells expressing SLC3A1 OE at the indicated cell numbers were injected subcutaneously into mouse mammary fat pads. The MDA-MB-453 cells were mixed with Matrigel before injection.
Statistical analysis
The data were presented as the means ± SD. All data were representative of at least three independent experiments. The differences between groups were assessed by Student's t test; all presented differences were p < 0.05 unless otherwise stated.
Supplementary Material
Supplementary figures.
Acknowledgements
We are grateful to Dr. Zhaoyuan Hou and Dr. Xuemei Tong (Shanghai Jiao Tong University School of Medicine) for valuable discussions. This study was supported by grants from the National Program on Key Basic Research Project (973 Program) (2012CB910102), the Shanghai Committee of Science and Technology (11DZ2260200), and the National Science Foundation of China (81372194) (81572300) to Dr. Mi.
Author contribution
J.Y., Y. C., Y.W. and Y.X. performed most of the experiments; W.L. and Y.L. performed some of the experiments; X.L. analyzed the profiling data; X.L. provided reagents and revised the paper; J. M. designed the project and wrote the article; all authors reviewed the manuscript.
Competing Interests
The authors have declared that no competing interest exists.
References
1. Trachootham D, Alexandre J, Huang P. Targeting cancer cells by ROS-mediated mechanisms: a radical therapeutic approach? Nat Rev Drug Discov. 2009;8:579-91
2. Gao P, Zhang H, Dinavahi R. et al. HIF-dependent antitumorigenic effect of antioxidants in vivo. Cancer Cell. 2007;12:230-8
3. Ranjan P, Anathy V, Burch PM. et al. Redox-dependent expression of cyclin D1 and cell proliferation by Nox1 in mouse lung epithelial cells. Antioxid Redox Signal. 2006;8:1447-59
4. Leslie NR, Bennett D, Lindsay YE. et al. Redox regulation of PI 3-kinase signalling via inactivation of PTEN. The EMBO journal. 2003;22:5501-10
5. Xu D, Rovira II, Finkel T. Oxidants painting the cysteine chapel: redox regulation of PTPs. Dev Cell. 2002;2:251-2
6. Gorrini C, Harris IS, Mak TW. Modulation of oxidative stress as an anticancer strategy. Nat Rev Drug Discov. 2013;12:931-47
7. Chen Y, Zhang H, Zhou HJ. et al. Mitochondrial Redox Signaling and Tumor Progression. Cancers (Basel). 2016:8
8. Mitsuishi Y, Taguchi K, Kawatani Y. et al. Nrf2 redirects glucose and glutamine into anabolic pathways in metabolic reprogramming. Cancer Cell. 2012;22:66-79
9. Anastasiou D, Poulogiannis G, Asara JM. et al. Inhibition of pyruvate kinase M2 by reactive oxygen species contributes to cellular antioxidant responses. Science. 2011;334:1278-83
10. Locasale JW, Grassian AR, Melman T. et al. Phosphoglycerate dehydrogenase diverts glycolytic flux and contributes to oncogenesis. Nat Genet. 2011;43:869-74
11. Possemato R, Marks KM, Shaul YD. et al. Functional genomics reveal that the serine synthesis pathway is essential in breast cancer. Nature. 2011;476:346-50
12. Jain M, Nilsson R, Sharma S. et al. Metabolite profiling identifies a key role for glycine in rapid cancer cell proliferation. Science. 2012;336:1040-4
13. Nagamori S, Wiriyasermkul P, Guarch ME. et al. Novel cystine transporter in renal proximal tubule identified as a missing partner of cystinuria-related plasma membrane protein rBAT/SLC3A1. Proc Natl Acad Sci U S A. 2016;113:775-80
14. Palacin M, Kanai Y. The ancillary proteins of HATs: SLC3 family of amino acid transporters. Pflugers Arch. 2004;447:490-4
15. Furriols M, Chillaron J, Mora C. et al. rBAT, related to L-cysteine transport, is localized to the microvilli of proximal straight tubules, and its expression is regulated in kidney by development. J Biol Chem. 1993;268:27060-8
16. Pickel VM, Nirenberg MJ, Chan J. et al. Ultrastructural localization of a neutral and basic amino acid transporter in rat kidney and intestine. Proc Natl Acad Sci U S A. 1993;90:7779-83
17. Kanai Y, Stelzner MG, Lee WS. et al. Expression of mRNA (D2) encoding a protein involved in amino acid transport in S3 proximal tubule. Am J Physiol. 1992;263:F1087-92
18. Bertran J, Werner A, Moore ML. et al. Expression cloning of a cDNA from rabbit kidney cortex that induces a single transport system for cystine and dibasic and neutral amino acids. Proc Natl Acad Sci U S A. 1992;89:5601-5
19. Tate CG, Muiry JA, Henderson PJ. Mapping, cloning, expression, and sequencing of the rhaT gene, which encodes a novel L-rhamnose-H+ transport protein in Salmonella typhimurium and Escherichia coli. J Biol Chem. 1992;267:6923-32
20. Gout PW, Buckley AR, Simms CR. et al. Sulfasalazine, a potent suppressor of lymphoma growth by inhibition of the x(c)- cystine transporter: a new action for an old drug. Leukemia. 2001;15:1633-40
21. Meng TC, Fukada T, Tonks NK. Reversible oxidation and inactivation of protein tyrosine phosphatases in vivo. Mol Cell. 2002;9:387-99
22. Sleire L, Skeie BS, Netland IA. et al. Drug repurposing: sulfasalazine sensitizes gliomas to gamma knife radiosurgery by blocking cystine uptake through system Xc-, leading to glutathione depletion. Oncogene. 2015;34:5951-9
23. Blot WJ, Li JY, Taylor PR. et al. Nutrition intervention trials in Linxian, China: supplementation with specific vitamin/mineral combinations, cancer incidence, and disease- specific mortality in the general population. Journal of the National Cancer Institute. 1993;85:1483-92
24. The effect of vitamin E and beta carotene on the incidence of lung cancer and other cancers in male smokers. The Alpha-Tocopherol, Beta Carotene Cancer Prevention Study Group. N Engl J Med. 1994;330:1029-35
25. van Zandwijk N, Dalesio O, Pastorino U. et al. EUROSCAN, a randomized trial of vitamin A and N-acetylcysteine in patients with head and neck cancer or lung cancer. For the EUropean Organization for Research and Treatment of Cancer Head and Neck and Lung Cancer Cooperative Groups. Journal of the National Cancer Institute. 2000;92:977-86
26. Bjelakovic G, Nikolova D, Gluud LL. et al. Mortality in randomized trials of antioxidant supplements for primary and secondary prevention: systematic review and meta-analysis. Jama. 2007;297:842-57
27. Klein EA, Thompson IM Jr, Tangen CM. et al. Vitamin E and the risk of prostate cancer: the Selenium and Vitamin E Cancer Prevention Trial (SELECT). Jama. 2011;306:1549-56
28. Watson J. Oxidants, antioxidants and the current incurability of metastatic cancers. Open Biol. 2013;3:120144
29. Sayin VI, Ibrahim MX, Larsson E. et al. Antioxidants accelerate lung cancer progression in mice. Sci Transl Med. 2014;6:221ra15
30. Clerkin JS, Naughton R, Quiney C. et al. Mechanisms of ROS modulated cell survival during carcinogenesis. Cancer letters. 2008;266:30-6
31. Brown DI, Griendling KK. Regulation of signal transduction by reactive oxygen species in the cardiovascular system. Circ Res. 2015;116:531-49
32. Manevich Y, Feinstein SI, Fisher AB. Activation of the antioxidant enzyme 1-CYS peroxiredoxin requires glutathionylation mediated by heterodimerization with pi GST. Proc Natl Acad Sci U S A. 2004;101:3780-5
33. Chan EC, Koh PK, Mal M. et al. Metabolic profiling of human colorectal cancer using high- resolution magic angle spinning nuclear magnetic resonance (HR-MAS NMR) spectroscopy and gas chromatography mass spectrometry (GC/MS). Journal of proteome research. 2009;8:352-61
34. Shenolikar S, Ingebritsen TS. Protein (serine and threonine) phosphate phosphatases. Methods Enzymol. 1984;107:102-29
Author contact
![]() Corresponding author: Jun Mi, Key Laboratory of Cell Differentiation and Apoptosis of Chinese Ministry of Education, Shanghai Jiao Tong University School of Medicine; 280 South Choongqing Rd., Shanghai 200025, China; E-mail: jmeiedu.cn.
Corresponding author: Jun Mi, Key Laboratory of Cell Differentiation and Apoptosis of Chinese Ministry of Education, Shanghai Jiao Tong University School of Medicine; 280 South Choongqing Rd., Shanghai 200025, China; E-mail: jmeiedu.cn.