Impact Factor
- Issue 14; 2026
- Issue 13; 2026
- Issue 12; 2026
- Issue 11; 2026
- Issue 10; 2026
- Volume 16; 2026
- Advance Articles
- Past Issues
- Cover Images
- Cover Suggestion
- Index & Coverage
- Special Issues
Introduction
Materials and Methods
Results
Discussion and Conclusion
Abbreviations
Acknowledgements
Supplementary Material
References
International Journal of Biological Sciences
International Journal of Medical Sciences
 Global reach, higher impact

Theranostics 2017; 7(19):4710-4721. doi:10.7150/thno.20440 This issue Cite
Research Paper
Precisely Enumerating Circulating Tumor Cells Utilizing a Multi-Functional Microfluidic Chip and Unique Image Interpretation Algorithm
Mingxing Zhou1, 2*, Hui Zheng1*, Zhaoba Wang2*, Ren Li1, Xiaoran Liu3, Weikai Zhang1, Zihua Wang1, Huiping Li3 ![]() , Zewen Wei1
, Zewen Wei1 ![]() , Zhiyuan Hu1, 4, 5
, Zhiyuan Hu1, 4, 5 ![]()
1. CAS Key Laboratory of Standardization and Measurement for Nanotechnology, CAS Key Laboratory for Biomedical Effects of Nanomaterials and Nanosafety, CAS Center for Excellence in Nanoscience, National Center for Nanoscience and Technology of China, Beijing 100190, China;
2. School of Information and Communication Engineering, North University of China, Taiyuan 030051, China;
3. Key Laboratory of Carcinogenesis and Translational Research (Ministry of Education), Department of Breast Oncology, Peking University Cancer Hospital & Institute, Beijing 100142, China;
4. Sino-Danish College, University of Chinese Academy of Sciences, Beijing 100049, China;
5. Yangtze River Delta Academy of Nanotechnology and Industry Development Research, Jiaxing 314000, China.
* These authors contributed equally to this work.
Received 2017-4-6; Accepted 2017-9-6; Published 2017-10-17
Abstract

Enumerating circulating tumor cells (CTCs) has been demonstrably useful in cancer treatment. Although there are several approaches that have proved effective in isolating CTC-like cells, the crucial identification of CTCs continues to rely on the manual interpretation of immunofluorescence images of all cells that have been isolated. This procedure is time consuming and more importantly, CTC identification relies on subjective criteria that may differ between examiners. In this study, we describe the design, testing, and verification of a microfluidic platform that provides accurate and automated CTC enumeration using a common objective criterion.
Methods: The platform consists of a multi-functional microfluidic chip and a unique image processing algorithm. The microfluidic chip integrates blood filtering, cell isolation, and single cell positioning to ensure minimal cell loss, efficient cell isolation, and fixed arraying of single cells to facilitate downstream image processing. By taking advantage of the microfluidic chip design to reduce calculation loads and eliminate measurement errors, our specially designed algorithm has the capability of rapidly interpreting hundreds of images to provide accurate CTC counts.
Results: Following intensive optimization of the microfluidic chip, the image processing algorithm, and their collaboration, we verified the complete platform by enumerating CTCs from six clinical blood samples of patients with breast cancer. Compared to tube-based CTC isolation and manual CTC identification, our platform had better accuracy and reduced the time needed from sample loading to result review by 50%.
Conclusion: This automated CTC enumeration platform demonstrates not only a sound strategy in integrating a specially designed multi-functional microfluidic chip with a unique image processing algorithm for robust, accurate, and “hands-free” CTC enumeration, but may also lead to its use as a novel in vitro diagnostic device used in clinics and laboratories as readily as a routine blood test.
Keywords: circulating tumor cells, microfluidic chip, breast cancer, automated cell enumeration.
Introduction
The enumeration of circulating tumor cells (CTCs) has been related to cancer progression and metastasis development [1-3]. Findings from clinical studies indicate that monitoring CTC numbers could be conducive for the early diagnosis [4, 5], prognostic prediction [6], and drug performance assessment [7, 8] of cancer. To enumerate CTCs, CTC-like cells are first isolated from blood, and then these cells are further characterized to accurately determine the number of CTCs. Currently, a variety of strategies have demonstrated their effectiveness towards isolating CTC-like cells. Different kinds of epithelial cell adhesion molecule (EpCAM) targeted immunomagnetic microbeads are most commonly used to isolate EpCAM-expressing cells [9]. In addition, differences in geometric dimensions [3, 10, 11] and electrical characteristics [12] have been used to discriminate and isolate CTC-like cells from normal cells. Presently, CTC-isolating methods based on immunomagnetic microbeads have proven effective and practical; for instance, the CellSearchTM system had been approved by the United States Food and Drug Administration (FDA) for breast, colon, and prostate cancer [13]. Despite this progress, the specificity of existing CTC isolation methods remains unsatisfactory. To isolate a single CTC, dozens, hundreds, or even thousands of non-CTC cells (mostly white blood cells) would be captured simultaneously [4, 5], a process that makes the identification of CTCs from non-CTC cells critical for accurate CTC enumeration. In contrast to the diversity of CTC isolation strategies, almost all methods for CTC identification are based on immunofluorescent staining. As long as the specificity and the consistency of the antibodies used are verified, immunofluorescence identification is considered reliable; however, the accuracy of immunofluorescence identification is premised on the consistency of imaging parameters for all fluorescence images, which is not easy to acquire because cells are randomly distributed. More importantly, manual interpretation of fluorescence images with diverse subjective criteria of different examiners compromises the reliability of immunofluorescence-based CTC enumeration.
Emerging microfluidic technologies have advanced CTC enumeration by improving both CTC isolation and analysis [14]. By utilizing specifically designed microstructures, microfluidic chips exhibit remarkable capabilities for precisely controlling cell movement [4, 15, 16], and with the application of magnetic fields [5, 17] and/or electric fields [3, 18, 19], microfluidic chips can also control the surrounding cell environment. Both of these features result in a markedly improved CTC isolation efficiency. Moreover, by integrating distinct functions, microfluidic chips are capable of considerably more than isolating CTCs. Cell analysis [20], cell behavior monitoring [21], and sequencing of DNA [22] or RNA [23] have all been demonstrated on isolated CTCs in microfluidic chips, even at the single cell level [24].
Despite advances in CTC enumeration, with or without the use of microfluidic chips, two issues remain to be addressed before CTC enumeration can be widely accepted for routine use in clinical practices. First, CTC enumeration processes remain time and labor costly. Second, and more importantly, cell identification still depends on the subjective interpretation of fluorescence images of dozens, hundreds, or even thousands of CTC-like cells. Obviously, different examiners with different judgement criteria intrinsically compromise the reliability and repeatability of CTC enumeration, factors which are crucial for clinical applications. For comparison, to provide accurate and reliable results, most routine blood test devices are automated and do not rely on subjective interpretation. For example, the Cell-Dyn3200TM (Abbott Diagnostics) enumerates blood cells. Using a 2 mL blood sample, it takes less than one hour to provide results [25] in the form of exact numbers, rather than images that need further interpretation.
To address these issues, this study presents a platform for CTC enumeration that consists of a multi-functional microfluidic chip, an automated imaging device, and software for image processing. The microfluidic chip comprehensively performs blood filtering, cell isolation, and positioning at the single cell level. Automated fluorescence image acquisition and processing replaces subjective manual interpretation using an objective criterion. After optimizing operation of the complete platform, we evaluated its performance with six clinical blood samples. Our results demonstrate that the platform has improved efficiency, accuracy, and more importantly, consistency in CTC enumeration compared to conventional approaches.
Materials and Methods
Materials, cells, and blood samples
Dulbecco's Modified Eagle Medium (DMEM), fetal bovine serum (FBS), penicillin-streptomycin, and trypsin were purchased from Life Technologies (USA), and phosphate-buffered saline (PBS) pH 7.4 was purchased from Sigma-Aldrich (USA). Cytokeratin 19 monoclonal antibodies conjugated with fluorescein isothiocyanate (FITC) (anti-CK19-FITC, catalog # ab87014) and CD45 monoclonal antibodies conjugated with phycoerythrin (PE) (anti-CD45-PE, catalog # 251341) were both purchased from Abcam (USA). The DNA-staining dye, 4',6-diamidino-2-phenylindole (DAPI) was purchased from Sigma-Aldrich and immunomagnetic beads (200 nm in diameter, Lot No: GT10060-0617) were purchased from Ademtech (France). Four-inch silicon wafers [10 cm in diameter] were purchased from Xilika (China), and polydimethylsiloxane (PDMS) was obtained from Dow Corning (USA).
For microfluidic chip characterization and optimization, SKBR-3 and HEK-293T cells were cultured in DMEM supplemented with 10% FBS and 50 µg/mL penicillin and streptomycin. Cells were incubated at 37 °C in a 5% CO2 humidified atmosphere.
Our study received Institutional Review Board approval from the Beijing Cancer Hospital and informed consent was obtained from patients with cancer prior to clinical blood sample collection. Peripheral blood samples (2 mL) were collected in vacutainer tubes containing the anticoagulant ethylenediaminetetraacetic acid (EDTA) and processed within 24 h.
Experimental protocols
First, cultured cells or blood samples (2 mL) were added in a 15 mL centrifuge tube and incubated with 10 µL of immunomagnetic beads (approximately 5.5 × 10¹¹ beads/mL) for 1 h at room temperature.
To characterize the blood filtering segment of the chip, following incubation the pre-treated blood sample was diluted to 5 mL with PBS, which was pumped into the chip at a flow rate of 120 µL/min. The channel was then rinsed using 1 mL PBS and cells were fixed at room temperature with 10 µL paraformaldehyde (PFA, 4%) for 15 min before consecutive staining with 10 µL DAPI for 15 min followed by 10 µL anti-CK19-FITC for 40 min, and 10 µL anti-CD45-PE for 40 min in the dark. Finally, the entire filtering segment was fluorescently imaged to analyze blood impurities.
To characterize the cell isolating segment, SKBR-3 and HEK-293 cells were mixed at a ratio of 1:100 and pre-incubated with immunomagnetic beads. The cell mixture was pumped into the chip at a rate of 120 µL/min during which a magnet was placed beneath the cell isolating channel. Next, DAPI and anti-CK19-FITC were pumped into the channel to stain isolated cells before the entire segment was fluorescently imaged for further cell identification and counting. Cell isolation efficiency was defined as the ratio between the number of isolated to the total number of pumped SKBR-3 cells.
To characterize the single cell positioning segment of the chip, we pumped 100 μL of SKBR-3 cell solution (104 cells/mL) into the channel at 40 µL/min. Following cell positioning, cells were stained using 10 μL DAPI and fluorescently imaged using the 10× lens of an Axio Imager A2 (Carl Zeiss, Germany) for further cell identification and counting. Single cell positioning efficiency was calculating by dividing the number of captured cells by the total number of pumped cells.
To evaluate automated CTC enumeration, 2 mL of whole blood from a patient with cancer was incubated with immunomagnetic beads conjugated with an EpCAM antibody for 1 h at room temperature and then diluted to 5 mL. Next, by controlling the valves, the diluted blood was pumped into the integrated chip from the blood filtering segment to the cell isolation segment with a flow rate of 120 µL/min. EpCAM-expressing cells were isolated using a magnetic field applied by an external magnet. Next, 1 mL PBS was immediately pumped into the chip to rinse the channel, the magnet was removed, and the valves were adjusted to allow isolated cells to transfer from the isolation segment to the single cell positioning segment by pumping PBS (40 µL/min) into the cell isolating segment. After cells were positioned in the cell positioning segment, 10 µL PFA (4%) was used to fix the positioned cells at room temperature for 10 min. Cells were then stained with DAPI for 10 min in the dark followed by sealing using a glycine solution (10% goat serum and 0.3 M glycine) for 1 h. Next, anti-CD45-PE and anti-CK19-FITC antibodies were simultaneously introduced into the chip and incubated with the positioned cells for 45 min in the dark. Using a microscope with an automated stage, 192 fluorescence images were automatically acquired (10× lens, Axio Imager A2, Carl Zeiss, Germany) within 5 min to obtain full coverage of the whole cell positioning area. Finally, all 192 images were analyzed by our software to acquire accurate CTC numbers. No stitching was used while analyzing images.
For tube-based CTC enumeration [26], 2 mL of whole blood from a patient with cancer was directly incubated with immunomagnetic beads conjugated with EpCAM antibody for 1 h in a 15 mL centrifugal tube. The tube was placed on a magnetic shelf with a mechanical horizontal rotator to enrich for EpCAM-positive cells after the addition of 5 mL PBS. Thirty minutes later, the supernatant was removed and 5 mL PBS was added to re-suspend the enriched cells. The enrichment process was repeated 3 times, after which 200 µL PFA (4%) was added to the tube for 15 min to fix the enriched cells followed by cell staining with DAPI for 15 min in the dark. Cells were treated with 400 µL glycine solution for 1 h followed by a 1 h incubation with 20 µL anti-CD45-PE and a 30 min incubation with 200 µL anti-CK19-FITC. Following immunostaining, enriched cells were re-suspended with PBS and transferred from the centrifugal tube to a glass slide for manual cell imaging (10× lens, Axio Imager A2, Carl Zeiss, Germany) and identification. All procedures were performed manually at room temperature.
Chip microstructures were imaged by scanning electron microscope (SEM). To obtain clear images, we sputtered thin gold film onto the chip surface using an ion sputter E1010 (Hitachi, Japan) for 30 s before scanning the chip with an S-4800 SEM/Horiba EDS (Hitachi) using a vacuum voltage of 10 kV.
Image processing
The algorithm processes the image using several steps. For each area, four images (bright field, DAPI, CK19-FITC, and CD45-PE) were analyzed. All four images were transferred to a greyscale image prior to further analyses. Using this greyscale image, we could clearly identify the position and outline of cells (V-shaped structures in bright field and cell nuclei in the DAPI image). First, the exact positions of V-shaped structures in the chip were determined by processing the bright field image; the non-structure areas of all four images were excluded to reduce calculation loads. Next, the DAPI image was analyzed whereby the area, the length / width ratio, and the circularity of DAPI-positive regions were calculated to exclude non-cell regions. Finally, both the CK19-FITC and CD45-PE images were analyzed in parallel to enumerate DAPI+/CK19+/CD45- cells in the area, which are considered CTCs.
Data analysis
While optimizing the microfluidic chip with SKBR-3 and HEK-293T cells, NIH (National Institutes of Health) recommended ImageJ software was used to enumerate cells from fluorescence images. The number of isolated SKBR-3 cells was acquired from counting cells appearing in blue (DAPI nuclear staining) and green (anti-CK19-FITC) from fluorescence images. All data in this study are expressed as the mean ± standard deviation (SD) from three independent assays.
Results
From a clinical point of view, an ideal CTC enumeration technology should achieve the following: i) the results should be accurate and, more importantly, objective which means that CTC enumeration should not be subjectively influenced by various criteria and diverse examiners; and ii) enumeration should be automated such as that found with other blood testing equipment found in a clinical or laboratory setting. To fulfill these requirements, we specially designed a multi-functional microchip to realize the target of “blood in, cell images out” as well as improve the accuracy of both CTC isolation and identification. We also designed a unique image interpretation algorithm and corresponding software with a user-friendly interface to fully realize automated cell image interpretation for CTC enumeration.
A multi-functional chip for precise and automatic CTC enumeration
As shown in Figure 1A, functionally the Precise and Automatic CTC Enumeration (PACE)-chip consists of three different segments: the blood filtering segment, the cell isolating segment, and the cell positioning segment. To process CTC enumeration, blood was first diluted and incubated with immunomagnetic microbeads that recognize EpCAM-positive cells. The treated blood was then pumped into the blood filtering segment (Figure 1A, shown in green) that contains 1500 micro-pillars designed to filter blood impurities larger than 32 µm. By switching the on-chip valves (parameters are shown in Supplementary Figure S1), filtered blood was transferred to the cell isolating segment (Figure 1A, shown in yellow) in which EpCAM-positive cells were trapped by an externally applied magnetic field. The microfluidic channel in this segment was specially designed to gradually widen to optimize cell isolation efficiency and eliminate possible channel blockage. After isolating EpCAM-positive cells and washing to discard other cells, the magnetic field was removed and the isolated cells were released and pumped into the cell positioning segment (Figure 1A, shown in blue), which contains 6000 V-shaped microstructures. Each V-shaped microstructure was designed to trap a single cell. After all EpCAM-positive cells were positioned in the microstructures, two different antibodies were pumped into the channel for immunofluorescent-tagging and identification of CTCs from the isolated EpCAM-positive cell population.
The integrated microfluidic design of the PACE-chip. (A) Schematic view of the PACE-chip that consists of three functional segments: blood filtering (enlarged on the top-right to show the micro-pillars), cell isolation (enlarged on the bottom-right to show the isolation process for EpCAM-positive cell selection), and cell positioning (enlarged on the middle-right to show the V-shaped microstructure array). (B) The fabrication process of the PACE-chip. (C) Photomicrographs of the silicon portion of the PACE-chip with detailed SEM images of the micro-pillars (top-right) and the V-shaped microstructures (bottom-right). Scale bars: 100 µm.
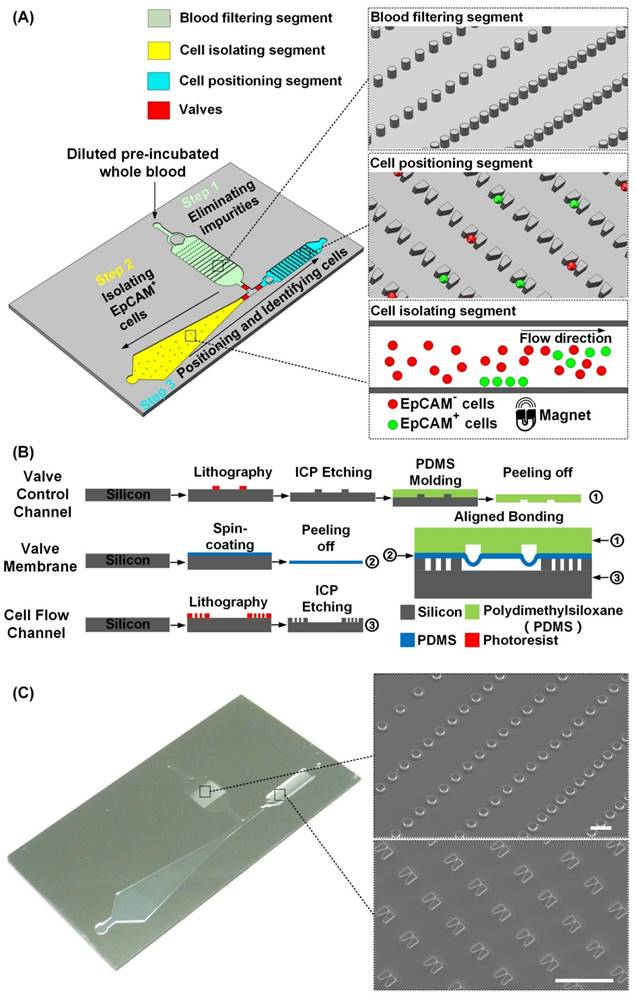
Figure 1B shows the fabrication process of the PACE-chip. To enable ready integration of the three functional segments, a simple chip structure consisting of three layers (a valve control layer, a valve membrane, and a cell flow channel) was designed. PDMS was selected as the material for the valve control layer and the valve membrane because of its transparency and flexibility. The cell flow channel and the microstructures were made by silicon because silicon-based microfabrication fulfilled the size requirement of the PACE-chip. To fabricate the valve control channel, a four-inch silicon wafer was dry etched to form the mold for PDMS molding. The valve membrane was simply formed by spin-coating a thin PDMS layer and peeling it off. The silicon microstructures in the cell flow channel were fabricated by inductively coupled plasma (ICP) etching. Finally, the PACE-chip was finished by aligning and bonding the three layers.
Figure 1C shows an image of the PACE-chip and detailed SEM images of the micro-pillars in the blood filtering segment and the V-shaped microstructures found in the cell positioning segment. The entire chip is 3 cm in width and 5 cm in length. The depth of all flow channels is 20 µm and the valve membrane is 30 µm thick. The flow channel of the blood filtering segment is 6 mm in width and 9 mm in length, and contains 1500 micro-pillars. The micro-pillars are 20 µm in height and 40 µm in diameter, and the distance between adjacent pillars varies to adapt to a range of diverse impurity sizes. The flow channel of the cell isolating segment gradually widens from a minimum width of 2.5 mm to a maximum width of 8.5 mm, and the length of the channel is 25 mm. For the cell positioning segment, the channel is 2.6 mm in width and 13.5 mm in length. 6000 V-shaped microstructures are arrayed in the channel to position single cells, and each microstructure is specially designed to ensure single cell isolation. Each V-shaped structure has a height of 20 µm, the wider opening is 15 µm and the narrower opening is 3 µm. Adjacent V-shaped microstructures are spaced 40 µm apart by row and 35 µm apart by column. For the flow speeds used in this study (120 µL/min in the blood filtering segment and the cell isolating segment, and 40 µL/min in the cell positioning segment), the Reynolds numbers are 0.667, 0.723, and 0.513, respectively.
Chip characterization
To realize the aim of “blood in, images out”, the PACE-chip was custom designed to sequentially perform blood filtering, cell isolation, and single cell positioning without the need to transfer cells between on-chip and off-chip. To ensure collaboration among different functional segments as well as optimal chip performance, we extensively characterized chip parameters and optimized operational procedures.
Blood impurities need to be filtered before further processing or it may result in either channel blockage or significantly interfere with the fluorescent identification of isolated CTCs. Because CTCs are very rare in blood, it is important for blood filtering to occur on-chip, thereby avoiding possible cell loss when transferring blood from on-chip to off-chip. A simple micro-pillar array was designed to filter impurities; however, to adapt to a diverse range of impurity dimensions, we used progressively narrower spaces between adjacent pillars along the chip segment (100 µm, 50 µm, and 32 µm). Because of this blood-filtering segment, the PACE-chip eliminates over 95% of impurities larger than 100 µm (Supplementary Figure S2).
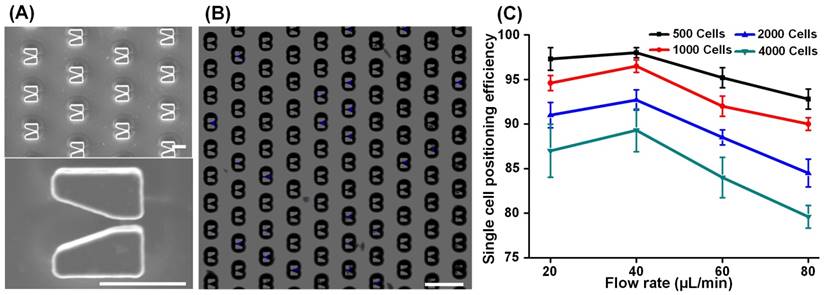
When filtered blood was forced to flow through a thin channel (20 µm in height) in the cell isolating segment, all cells were exposed to a consistent magnetic field that enabled the capture of cells bound to magnetic beads. As previous studies have described [18], introducing a simple thin microfluidic channel ensures that each cell receives practically the same magnetic field strength resulting in an improved isolation efficiency compared to tube-based (manual) cell isolation. In this study, the magnetic field strength was 370 mT (as shown in Supplementary Figure S3). However, during processing of clinical samples, we found that because of the heterogeneity of human blood cells, there were remarkable differences in the amount of expressed EpCAM found among EpCAM-positive cells. Under this circumstance, if a rectangle-shaped fluidic channel was used, all the cells would have the same flow velocity and corresponding drag force. Thus, those cells bound to fewer magnetic beads may escape from the isolating channel, while those cells bound to an excessive number of magnetic beads may be immobilized rapidly and aggregate in a small region, which very likely would jam the channel. To address this issue, we designed a gradually widening flow channel in which the cell flow velocity and drag force applied on the cell were progressively reduced (refer to Supplementary Figure S4 for calculations). Therefore, cells bound to fewer magnetic beads were immobilized in the wider part of the channel, while those bound to more magnetic beads were captured in the narrower portion. By adjusting the dimensions of the channel, EpCAM-positive cells are distributed evenly across the flow channel (as imaged and quantitatively demonstrated in Supplementary Figure S5). As a result, neither cell aggregation nor channel blockage was observed. We then evaluated cell isolation efficiency by quantitatively analyzing fluorescence images of captured cells (Figure 2A). Compared to tube-based isolation (Figure 2B), we found that the specially designed microfluidic channel chip significantly improved capturing efficiency over 50%. We also investigated the relationship between isolation efficiency and cell flow velocity (Figure 2B). We found that isolation efficiency slowly declined from 90% to 80% as the flow velocity increased from 40 to 120 µL/min and then dramatically dropped to 55% once the flow velocity reached 150 µL/min. To achieve a balance between cell isolation speed and efficiency, we took 120 µL/min as the flow velocity in further studies.
Isolation of EpCAM-positive cells. SKBR-3 cells (EpCAM-positive) and HEK-293T cells (EpCAM-negative) were first mixed in a ratio of 1:100 and then pumped into the microchannel. Some cells were captured in the microfluidic channel by an externally applied magnetic field. All captured cells were fluorescently stained and imaged. (A) DAPI (shown in blue) indicates cell nuclei while immunostaining with a CK19-FITC antibody (shown in green) indicates EpCAM-expressing SKBR-3 cells. Scale bars: 100 µm. (B) The relationships between cell isolation efficiency, cell flow velocity, and cell number. Cell isolation efficiency was defined as the ratio between the number of cells with blue staining and green fluorescence compared to the total number of injected SKBR-3 cells. Data are expressed as the mean ± SD from three independent assays. The number of cells in the x-axis represents the number of isolated SKBR-3 cells.

Following capture of EpCAM-positive cells, we removed the magnetic field and reversed the flow direction to transfer the cells from the cell isolation segment to the cell positioning segment. 6000 V-shaped silicon microstructures are arrayed in the microfluidic channel for single cell positioning, SEM images of which are shown in Figure 3A. In addition to capturing and isolating single cells, the V-shaped microstructures played another key role by providing an accurate dimensional reference for the algorithm used to enumerate CTCs. By adjusting the spatial distribution of the array (described in Supplementary Figure S6), we achieved ideal single cell positioning such that all cells were captured in the center of the microstructures and that no cell was excluded (Figure 3B). Using SKBR-3 cells to mimic EpCAM-positive cells in blood, we next studied the relationships between single cell positioning efficiency, cell flow velocity, and cell number (Figure 3C). Because of the fixed number (6000) of V-shaped structures, single cell positioning efficiency dropped as the number of cells increased from 500 to 4000. In addition, we found that cell positioning efficiency reached its maximal peak value at a flow velocity of 40 µL/min then dramatically dropped at higher flows. These results demonstrate that the chip has a cell positioning efficiency greater than 95% when processing < 1000 cells at a time, a threshold that is more than sufficient for CTC isolation from 2 mL of blood.
Single cell positioning. (A) SEM images of the cell positioning structure array (top) and an enlarged image (bottom) of a V-shaped microstructure. Scale bars: 20 µm. (B) DAPI-stained cells (appearing as blue) captured in the V-shaped microstructures. Scale bar: 100 µm. (C) The relationships between cell positioning efficiency, cell flow velocity, and cell number. Cell positioning efficiency was defined as the ratio between the number of cells positioned in V-shaped microstructures and the total number of injected cells. Data are expressed as the mean ± SD from three independent assays.
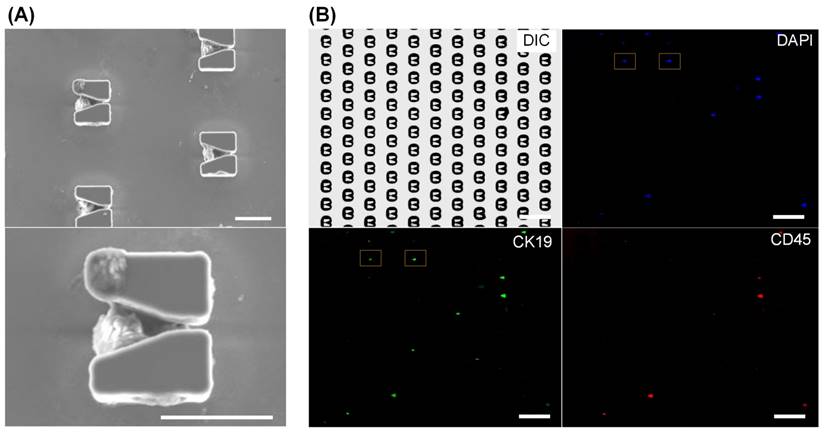
Finally we verified chip functions and optimized operational parameters using blood samples. Before processing patient samples, we tested the cell isolation efficiency by respectively spiking 100 SKBR-3 and MCF-7 cells into 1 mL blood from a healthy donor. The cell isolation efficiencies of SKBR-3 and MCF-7 cells are 80% and 76%, respectively (detailed in Supplementary Figure S7). Then, using the PACE-chip, we successfully captured approximately 300 EpCAM-positive cells from a 2 mL blood sample and successfully positioned them in the V-shaped microstructures. As shown in the SEM images in Figure 4A and 4B, each V-shaped micro-structure trapped a single cell. Cell distribution in the cell positioning array is shown in Figure 4B. No cell was found outside of the V-shaped microstructures. Using immunofluorescent labelling, we differentiated CTCs from other cells, and as shown in Figure 4B, all cells were stained by DAPI (shown in blue), while white blood cells and CTCs were tagged using anti-CD45 antibodies labelled with PE (shown in red) and anti-CK19 antibodies labelled with FITC (shown in green). The blood sample used for testing was from a 55 year old female patient with Stage IIIc breast cancer (Figure 4). CK19 is widely accepted to label breast cancer cells [27-29]. However, to ensure the necessary accuracy for CTC enumeration, the specificities of the CK19 and CD45 antibodies needs to be determined prior to their use with clinical samples. First, from our evaluation of the specificities of these antibodies, we found that CK19 is suitable for the identification of breast cancer cells (Supplementary Figure S8), and second, we demonstrated that the probability of the CK19 antibody to misrecognize leukocytes (30%) is higher than that of the CD45 antibody to misrecognize SKBR-3 cells (< 5%) (Supplementary Figure S9). Therefore, those cells exhibiting both CK19+ and CD45+ should be considered CTC-negative. Taken together, our findings demonstrate the effectiveness of the PACE-chip in CTC isolation and identification.
Immunofluorescent identification of CTCs from a clinical blood sample. (A) SEM images of EpCAM-positive cells from a blood sample positioned in V-shaped microstructures. Scale bars: 20 µm. (B) To identify CTCs, all cells were stained by DAPI for nuclei identification (blue), a CK19-FITC antibody was used to identify cancer cells (green), and a CD45-PE antibody was used to discriminate white blood cells (red). Scale bars: 100 µm. Identified CTCs, which appear as blue and green but not red, are marked by yellow boxes
Computer-aided automatic CTC enumeration from clinical blood samples
As demonstrated in other clinically accepted blood-analysis devices [25], a feasible and robust approach to avoid subjective analysis is to introduce computer-aided automatic image processing, which treats all data using a common objective criterion. Unfortunately, significant challenges remain in directly applying computer image processing with existing microfluidic chips. First, in addition to captured cells, there will be chaff, including leftover magnetic beads or cell debris, that may interfere with image interpretation, thereby making the processing of hundreds or even thousands of images too computationally intensive for normal computers. Second, with existing chip designs it is necessary to individually adjust the focus length for each image because captured cells are randomly distributed. Thus, during a lengthy period of manual imaging of the whole chip, which could be over 7 h, the fluorescence strength of stained cells will be remarkably weakened, or even photobleached (Supplementary Figure S10). Under these circumstances, it is impossible to achieve an accurate CTC enumeration.
The V-shaped microstructure array is designed to facilitate automated imaging and computer-aided image interpretation. By forcing all cells into a thin layer, we can use a single focus length to image the entire chip area, and thus, avoid the need to adjust the focus length for each image, which is a time-consuming process. Further, when computationally processing the fluorescence images, only the areas of the V-shaped structures are processed, which significantly reduces the amount of processing by 92.4%. In addition, the V-shaped structure can be used as a dimensional reference to differentiate between intact cells and cell debris, which reduces the confounding effects of chaff, and eliminates measurement errors in image processing.
To identify CTCs, the entire cell positioning area was fluorescently imaged with 192 images in only 5 min. As shown in Figure 5A, we used our custom-coded software to process all of the images rapidly and accurately. At the start of the analysis, and making best use of their fixed profile to reduce the amount of processing necessary, all V-shaped microstructures were recognized as a valid area for further analysis, while all other areas were excluded. Next, all DAPI-positive regions (appearing as blue) were fetched to determine real cells. As an improved alternative to manual interpretation using subjective criteria, we used three objective criteria to discriminate genuine cells. First, we calculated the area of DAPI positive regions to exclude those regions that were significantly larger or smaller than the predicted size of a regular cell. Second, we calculated the length / width ratio and circularity of DAPI positive regions to exclude cell debris and other sources of interfering background. Because the V-shaped microstructures have accurately known dimensions and appearance in each image, we used them as internal references to eliminate measurement errors caused by microscopy and image processing. After confirming all DAPI-positive cells, we repeated the determination for CK19-FITC (appearing as green) and CD45-PE (appearing as red). The criterion for the existence of either CK19-FITC or CD45-PE was set as:
Computer-aided image processing. (A) Flowchart of the image processing algorithm. (B) The user interface on a WindowsTM operating system.
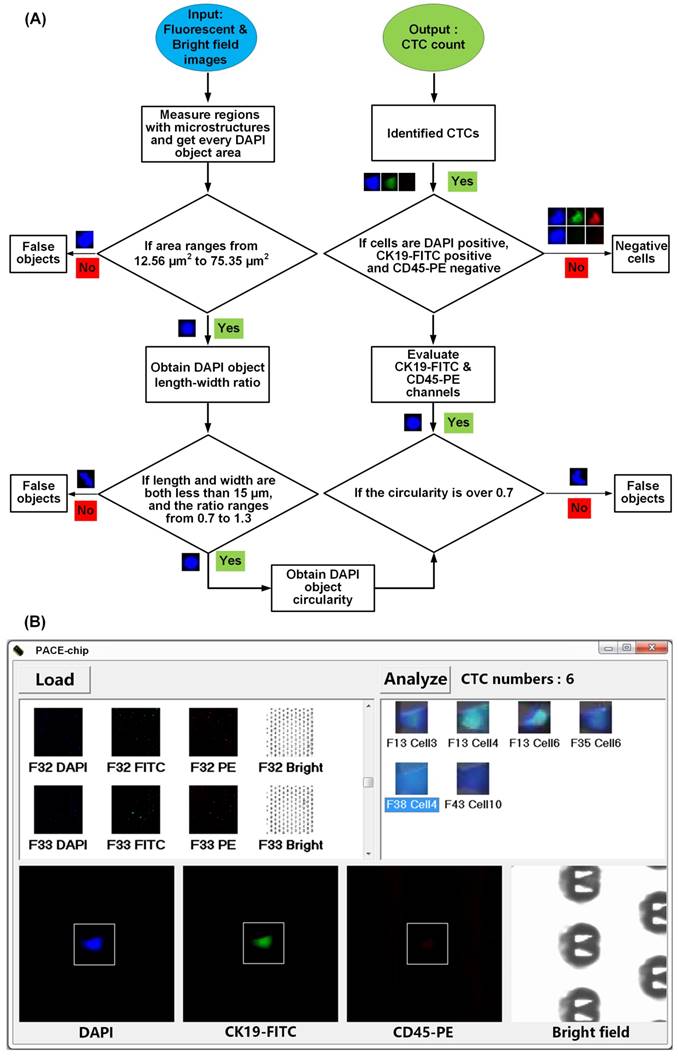
0.4 < DAPI area (nuclear area) / CK19 or CD 45 area (total cell area) < 0.9
Finally, cells that were CD45-PE-positive and CD19-FITC-negative were classified as white blood cells, while cells that were CD45-PE-negative and DAPI/CK19-FITC-positive, which indicate cancer cells, were identified as CTCs. Figure 5B shows the user-friendly interface that provides the final enumeration result as well as the images of all CTCs for manual inspection, if further review is necessary.
After optimizing our microfluidic chip and software as well as their integration into a single platform, we enumerated CTCs from clinical blood samples of female patients with breast cancer (invasive ductal carcinoma). Details regarding the patients and health donors are listed in Supplementary Table S11. Using 4 mL of blood from each patient, 2 mL was used for automated CTC isolation and enumeration while the remaining 2 mL was processed using tube-based enumeration, and we compared the results on-chip to traditional tube-based CTC isolation and manual identification. As detailed in Table 1, we found that our new platform generally detected more CTCs from blood of our patients using 50% less time. For all patients and healthy donor, fewer than 350 single cells were trapped in V-shaped structures. More importantly, apart from pre-incubation with the magnetic beads that was done off-chip, all other operations including blood filtering, cell isolation, imaging, and CTC identification, were performed automatically using our platform and required minimal user involvement. Simply put, the user injects the pre-treated blood sample into the chip, allows the automated hands-free process to run, and receives the CTC counts, and if necessary, can review any of the CTC images (as shown in Supplementary Figure S12 in which we manually double-checked the images of all six patient samples and confirmed the existence of intact cells by high-resolution scanning electron microscopy images). Similar to examiners or users of common blood testing equipment found in a clinical setting, a single user could run several CTC enumerations in parallel performing more than one set of runs a day.
Comparison between the PACE-chip and tube-based CTC enumeration using clinical breast cancer samples.
| Patient 1 | Patient 2 | Patient 3 | Patient 4 | Patient 5 | Patient 6 | Healthy donor 1 | Healthy donor 2 | |
|---|---|---|---|---|---|---|---|---|
| Manual enumeration | 15 CTCsa 7.8 hrsb | 2 CTCsa 7.5 hrsb | 6 CTCsa 7.6 hrsb | 17 CTCsa 7.8 hrsb | 2 CTCsa 7.5 hrsb | 3 CTCsa 7.5 hrsb | 0 CTCsa 7.5 hrsb | 0 CTCsa 7.5 hrsb |
| PACE-Chip | 17 CTCsa 333 cellsc 3.5 hrsb | 4 CTCsa 246 cellsc 3.5 hrsb | 7 CTCsa 253 cellsc 3.5 hrsb | 20 CTCsa 283 cellsc 3.5 hrsb | 2 CTCsa 262 cellsc 3.5 hrsb | 6 CTCsa 344 cellsc 3.5 hrsb | 0 CTCsa 224 cellsc 3.5 hrsb | 0 CTCsa 275 cellsc 3.5 hrsb |
aNumber of CTCs; bProcessing time; cNumber of trapped single cells.
Discussion and Conclusion
The methods that underlie our PACE-chip, namely, immunomagnetic bead-based EpCAM-positive cell isolation and immunofluorescence-based CTC identification (EpCAM+/CK+/CD45-), have been robustly validated and clinically demonstrated for use in neoplasm staging [30], early diagnosis [31], and prognostic evaluation [32]. However, previous CTC enumeration devices including the commercially available Cell SearchTM system and many other microfluidic chip-based prototypes rely on manually interpreting cell images for CTC enumeration. Clearly, an automatic method that utilizes a common objective standard to enumerate CTCs will not only markedly improve counting accuracy by eliminating inherent deviations caused from using diverse subjective standards from different examiners, but also increase processing efficiency and hands-free operation by introducing automated operation. Intrinsically, clinically approved devices for patient testing must be accurate, consistent, and ideally, enable ease-of-use. However, to our knowledge, no automated CTC enumeration system has been reported that eliminates manual examination and identification of CTCs, which may be because of inherent limitations with current cell image processing algorithms used with existing CTC isolation devices.
Our study advances the field with the development and verification of a new CTC enumeration platform in which a novel multi-functional chip and a unique imaging processing algorithm were specially designed to ensure accurate CTC enumeration using a common objective criterion as well as reduce the user's workload by providing fully automated processing. This new platform has the following prominent features: i) By specially designing the cell positioning structures to provide a regular array of single cells, our microfluidic chip not only significantly reduces the calculation load of image processing, which enables our algorithm to be used by normal computers, but also provides positional and dimensional references for more accurate CTC identification; ii) With the exception of a simple pre-incubation step, our chip is hands-free for performing all procedures regarding cell manipulation, avoiding the risk of cell loss, and realizing our aim of “blood in, images out”; and iii) By introducing fully automated operation, our platform significantly decreases the time needed for CTC enumeration and improves user throughput, enabling the processing of several samples at a time. Our automated and accurate CTC enumeration system was verified using six clinical blood samples from patients with breast cancer. These findings not only demonstrated that our design robustly identified more CTCs in significantly less time compared to conventional tube-based isolation and manual image interpretation, but also provided direct evidence for the identification of CTCs from patients with breast cancer using a CK19 antibody, which has been widely used to label breast cancer cells [29]. By replacing CK19 with other specific antibodies, such as CK8 for bladder tumors [33], CK18 for liver tumors [34], and CK20 for colorectal tumors [35]), the PACE-chip has the potential to readily provide CTC enumeration for many types of cancer.
To conclude, by specially designing and verifying a multi-functional microfluidic chip and unique cell image interpretation algorithm, this study technically demonstrates a platform for reliable, robust, and accurate CTC enumeration that may be as readily used as a routine blood test in clinics and laboratories worldwide.
Abbreviations
CTCs: circulating tumor cells; DAPI: 4',6-diamidino-2-phenylindole; DMEM: Dulbecco's Modified Eagle Medium; EDTA: ethylenediaminetetraacetic acid; EpCAM: epithelial cell adhesion molecule; FBS: fetal bovine serum; FDA: Food and Drug Administration; FITC: fluorescein isothiocyanate; ICP: inductively coupled plasma; PACE-chip: Precise and Automatic CTC Enumeration chip; PBS: phosphate-buffered saline; PDMS: polydimethylsiloxane; PE: phycoerythrin; PFA: paraformaldehyde; SD: standard deviation; SEM: scanning electron microscope. ER: estrogen receptor; PR: progesterone receptor; HER2: human epidermal growth factor receptor 2.
Acknowledgements
This work was supported by the National Natural Science Foundation of China (No. 31270875, 31470049, 31400702, and 61204118) and the National High-Tech R&D Program of China (No. 2015AA0201771 and 2015AA020408).
Supplementary Material
Supplementary figures.
Competing Interests
The authors have declared that no competing interest exists.
References
1. Aceto N, Bardia A, Miyamoto DT, Donaldson MC, Wittner BS, Spencer JA. et al. Circulating tumor cell clusters are oligoclonal precursors of breast cancer metastasis. Cell. 2014;158:1110-22
2. Bottos A, Hynes NE. Cancer: staying together on the road to metastasis. Nature. 2014;514:309-10
3. Qian W, Zhang Y, Chen W. Capturing cancer: emerging microfluidic technologies for the capture and characterization of circulating tumor cells. Small. 2015;11:3850-72
4. Hyun KA, Kwon K, Han H, Kim SI, Jung HI. Microfluidic flow fractionation device for label-free isolation of circulating tumor cells (CTCs) from breast cancer patients. Biosens Bioelectron. 2013;40:206-12
5. Ozkumur E, Shah AM, Ciciliano JC, Emmink BL, Miyamoto DT, Brachtel E. et al. Inertial focusing for tumor antigen-dependent and -independent sorting of rare circulating tumor cells. Sci Transl Med. 2013;5:179ra47
6. Miyamoto DT, Sequist LV, Lee RJ. Circulating tumour cells-monitoring treatment response in prostate cancer. Nat Rev Clin Oncol. 2014;11:401-12
7. Toss A, Mu Z, Fernandez S, Cristofanilli M. CTC enumeration and characterization: moving toward personalized medicine. Ann Transl Med. 2014;2:108
8. van de Stolpe A, Pantel K, Sleijfer S, Terstappen LW, den Toonder JM. Circulating tumor cell isolation and diagnostics: toward routine clinical use. Cancer Res. 2011;71:5955-60
9. Hyun KA, Jung HI. Advances and critical concerns with the microfluidic enrichments of circulating tumor cells. Lab Chip. 2014;14:45-56
10. Huang T, Jia CP, Jun Y, Sun WJ, Wang WT, Zhang HL. et al. Highly sensitive enumeration of circulating tumor cells in lung cancer patients using a size-based filtration microfluidic chip. Biosens Bioelectron. 2014;51:213-8
11. Warkiani ME, Khoo BL, Wu L, Tay AKP, Bhagat AAS, Han J. et al. Ultra-fast, label-free isolation of circulating tumor cells from blood using spiral microfluidics. Nat Protocols. 2016;11:134-48
12. Alix-Panabieres C, Pantel K. Challenges in circulating tumour cell research. Nat Rev Cancer. 2014;14:623-31
13. Arya SK, Lim B, Rahman AR. Enrichment, detection and clinical significance of circulating tumor cells. Lab Chip. 2013;13:1995-2027
14. Deng Y, Zhang Y, Sun S, Wang Z, Wang M, Yu B. et al. An integrated microfluidic chip system for single-cell secretion profiling of rare circulating tumor cells. Scientific Reports. 2014;4:7499
15. Augustsson P, Karlsen JT, Su HW, Bruus H, Voldman J. Iso-acoustic focusing of cells for size-insensitive acousto-mechanical phenotyping. Nat Commun. 2016;7:11556
16. Hyun KA, Lee TY, Lee SH, Jung HI. Two-stage microfluidic chip for selective isolation of circulating tumor cells (CTCs). Biosens Bioelectron. 2015;67:86-92
17. Chang CL, Huang W, Jalal SI, Chan BD, Mahmood A, Shahda S. et al. Circulating tumor cell detection using a parallel flow micro-aperture chip system. Lab Chip. 2015;15:1677-88
18. Huang SB, Wu MH, Lin YH, Hsieh CH, Yang CL, Lin HC. et al. High-purity and label-free isolation of circulating tumor cells (CTCs) in a microfluidic platform by using optically-induced-dielectrophoretic (ODEP) force. Lab Chip. 2013;13:1371-83
19. Morimoto A, Mogami T, Watanabe M, Iijima K, Akiyama Y, Katayama K. et al. High-density dielectrophoretic microwell array for detection, capture, and single-cell analysis of rare tumor cells in peripheral blood. PloS One. 2015;10:e0130418
20. Stott SL, Lee RJ, Nagrath S, Yu M, Miyamoto DT, Ulkus L. et al. Isolation and characterization of circulating tumor cells from patients with localized and metastatic prostate cancer. Sci Transl Med. 2010;2:25ra3
21. Yu M, Bardia A, Aceto N, Bersani F, Madden MW, Donaldson MC. et al. Cancer therapy. Ex vivo culture of circulating breast tumor cells for individualized testing of drug susceptibility. Science. 2014;345:216-20
22. Lohr JG, Adalsteinsson VA, Cibulskis K, Choudhury AD, Rosenberg M, Cruz-Gordillo P. et al. Whole-exome sequencing of circulating tumor cells provides a window into metastatic prostate cancer. Nat Biotechnol. 2014;32:479-84
23. Sarioglu AF, Aceto N, Kojic N, Donaldson MC, Zeinali M, Hamza B. et al. A microfluidic device for label-free, physical capture of circulating tumor cell clusters. Nat Methods. 2015;12:685-91
24. Issadore D, Chung J, Shao H, Liong M, Ghazani AA, Castro CM. et al. Ultrasensitive clinical enumeration of rare cells ex vivo using a micro-hall detector. Sci Transl Med. 2012;4:141ra92
25. Ho CK, Choi SW, Siu PM, Benzie IF. Cryopreservation and storage effects on cell numbers and DNA damage in human lymphocytes. Biopreserv Biobank. 2011;9:343-7
26. Bai L, Du Y, Peng J, Liu Y, Wang Y, Yang Y. et al. Peptide-based isolation of circulating tumor cells by magnetic nanoparticles. J Mater Chem B. 2014;2:4080-8
27. Zhao S, Yang H, Zhang M, Zhang D, Liu Y, Liu Y. et al. Circulating tumor cells (CTCs) detected by triple-marker EpCAM, CK19, and hMAM RT-PCR and their relation to clinical outcome in metastatic breast cancer patients. Cell Biochem Biophys. 2013;65:263-73
28. Pantel K, Alix-Panabieres C. The clinical significance of circulating tumor cells. Nat Clin Prac Oncol. 2007;4:62-3
29. Ross JS, Slodkowska EA. Circulating and disseminated tumor cells in the management of breast cancer. Am J Clin Pathol. 2009;132:237-45
30. Davis JW. Circulating tumor cell assays for the prognosis of prostate and colon cancers. Expert Opin Med Diagn. 2009;3:293-301
31. Couraud S, Milleron B. Lung cancer screening: what is new since the NLST results? Curr Pulmonol Rep. 2016;5:130-9
32. Cristofanilli M, Budd GT, Ellis MJ, Stopeck A, Matera J, Miller MC. et al. Circulating tumor cells, disease progression, and survival in metastatic breast cancer. New Engl J Med. 2004;351:781-91
33. Al-Ahmadie HA, Iyer G. New molecular markers with diagnostic and prognostic values in bladder cancer. In: (ed.) Magi-Galluzzi C, Przybycin CG. Genitourinary Pathology. New York: Springer New York. 2015:235-46
34. Ma S, Chan KW, Hu L, Lee TKW, Wo JYH, Ng IOL. et al. Identification and characterization of tumorigenic liver cancer stem/progenitor cells. Gastroenterology. 2007;132:2542-56
35. Hundt S, Haug U, Brenner H. Blood markers for early detection of colorectal cancer: a systematic review. Cancer Epidemiol Biomarkers Prev. 2007;16:1935-53
Author contact
![]() Corresponding authors: Zhiyuan Hu (huzycn), Huiping Li (huipingli2012com) or Zewen Wei (weizwcn)
Corresponding authors: Zhiyuan Hu (huzycn), Huiping Li (huipingli2012com) or Zewen Wei (weizwcn)