Impact Factor
- Issue 14; 2026
- Issue 13; 2026
- Issue 12; 2026
- Issue 11; 2026
- Issue 10; 2026
- Volume 16; 2026
- Advance Articles
- Past Issues
- Cover Images
- Cover Suggestion
- Index & Coverage
- Special Issues
Introduction
Materials & Methods
Results
Discussion
Abbreviations
Supplementary Material
Acknowledgements
References
International Journal of Biological Sciences
International Journal of Medical Sciences
 Global reach, higher impact

Theranostics 2017; 7(19):4722-4734. doi:10.7150/thno.21527 This issue Cite
Research Paper
Optimizing fresh specimen staining for rapid identification of tumor biomarkers during surgery
Connor W. Barth1, Jasmin M. Schaefer1, Vincent M. Rossi4, Scott C. Davis4 ![]() , Summer L. Gibbs1,2,3
, Summer L. Gibbs1,2,3 ![]()
1. Biomedical Engineering Department,
2. Knight Cancer Institute,
3. OHSU Center for Spatial Systems Biomedicine, Oregon Health & Science University, Portland, OR 97201,
4. Thayer School of Engineering, Dartmouth College, Hanover, NH 03755,
5. Norris Cotton Cancer Center, Dartmouth-Hitchcock Medical Center, 1 Medical Center Drive, Lebanon, NH 03756.
Received 2017-6-19; Accepted 2017-9-18; Published 2017-10-17
Abstract

Rationale: Positive margin status due to incomplete removal of tumor tissue during breast conserving surgery (BCS) is a prevalent diagnosis usually requiring a second surgical procedure. These follow-up procedures increase the risk of morbidity and delay the use of adjuvant therapy; thus, significant efforts are underway to develop new intraoperative strategies for margin assessment to eliminate re-excision procedures. One strategy under development uses topical application of dual probe staining and a fluorescence imaging strategy termed dual probe difference specimen imaging (DDSI). DDSI uses a receptor-targeted fluorescent probe and an untargeted, spectrally-distinct fluorescent companion imaging agent topically applied to fresh resected specimens, where the fluorescence from each probe is imaged and a normalized difference image is computed to identify tumor-target distribution in the specimen margins. While previous reports suggested this approach is a promising new tool for surgical guidance, advancing the approach into the clinic requires methodical protocol optimization and further validation.
Methods: In the present study, we used breast cancer xenografts and receiver operator characteristic (ROC) curve analysis to evaluate a wide range of staining and imaging parameters, and completed a prospective validation study on multiple tumor phenotypes with different target expression. Imaging fluorophore-probe pair, concentration, and incubation times were systematically optimized using n=6 tissue specimen replicates per staining condition. Resulting tumor vs. normal adipose tissue diagnostic performance were reported and staining patterns were validated via receptor specific immunohistochemistry colocalization. Optimal staining conditions were tested in receptor positive and receptor negative cohorts to confirm specificity.
Results: The optimal staining conditions were found to be a one minute stain in a 200 nM probe solution (area under the curve (AUC) = 0.97), where the choice of fluorescent label combination did not significantly affect the diagnostic performance. Using an optimal threshold value determined from ROC curve analysis on a training data set, a prospective study on xenografts resulted in an AUC=0.95 for receptor positive tumors and an AUC = 0.50 for receptor negative (control) tumors, confirming the diagnostic performance of this novel imaging technique.
Conclusions: DDSI provides a robust, molecularly specific imaging methodology for identifying tumor tissue over benign mammary adipose tissue. Using a dual probe imaging strategy, nonspecific accumulation of targeted probe was corrected for and tumor vs. normal tissue diagnostic potential was improved, circumventing difficulties with ex vivo tissue specimen staining and allowing for rapid clinical translation of this promising technology for tumor margin detection during BCS procedures.
Keywords: breast conserving surgery, fluorescence, image-guided surgery, tumor margin assessment, breast cancer, dual probe imaging, dual probe difference specimen imaging
Introduction
Breast conserving surgery (BCS), including partial mastectomy and lumpectomy, remains the most common treatment option for patients with early stage breast cancer and is carried out for 61% of the ~200,000 breast cancer patients diagnosed annually in the United States [1]. However, despite recent technological advances and efforts to improve surgical methods, 20-60% of these patients are left with involved or close surgical margins, determined by pathological assessment following completion of the surgery [1, 2]. Pathological findings of involved or close margins require follow up re-excision surgery within days to weeks of the original excision, resulting in increased risk of morbidity, undue patient stress, increased cost to both the patient and healthcare system, as well as delay of adjuvant therapy, all negatively affecting patient outcomes [2-6]. Technologies currently deployed in the clinic to improve margin detection include frozen section analysis (FSA) [7], touch prep cytology [8], specimen radiography [9], specimen ultrasound [10], and radiofrequency spectroscopy [11]. Each technique has shown improvement in tumor re-excision rates, but sensitivity and specificity performance has been mixed and lengthy tissue processing procedures in some cases limit translation to the clinic [7, 8, 12-20].
It has thus been recognized that rapid, accurate approaches that do not compromise tissue integrity are needed and widespread efforts are underway to develop novel approaches for intra-surgical margin assessment. A multitude of optical techniques are under development for this application [8, 21-35]. These strategies are in various stages of clinical translation where the ability to produce high contrast and high-resolution images have been demonstrated, but requirements of long scan times and in vivo application of exogenous contrast agents diminish clinical viability. While in vivo administration of fluorescent contrast agents is attractive, since it enables imaging guidance within the surgical cavity, the availability of clinically approved contrast agents is limited and securing approval for new agents with appropriate safety profiles is a long and challenging process [36, 37]. Topical application of tumor-specific fluorescent probes is a conceptually simple approach to identify tumor in specimen margins and an appealing alternative to the difficulties of in vivo contrast agent administration. In one iteration of this approach, activatable fluorescent probes were used to detect the presence of tumor-specific enzyme, marking positive tumor margins [38-40]. An orthogonal approach uses fluorescently-labeled tumor targeting moieties (such as antibodies, antibody fragments, peptides, etc.) to rapidly stain, wash and image the excised specimen. In principle, this technique enables rapid tumor-receptor-specific staining of the specimen without compromising follow-up pathology and doesn't require the safety profile of agents administered in vivo.
However, early efforts to deploy this simple strategy produced non-specific uptake of targeted fluorescent probes in normal tissue despite efforts to apply blocking solution prior to staining, particularly in surrounding adipose tissue, a main component of resected breast specimens. Thus, simple, single-agent staining of excised tissue specimens, including tissues from BCS resulted in poor diagnostic performance. To address this, we and others have shown that non-specific uptake can be quantified and removed by including a second non-specific companion imaging probe in the staining solution and that the targeted and untargeted images together improve cancer detection [31-35, 41, 42]. In this paradigm, each probe is labeled with a spectrally-distinct fluorophore, enabling the specific and non-specific probe distribution to be assessed with multi-color imaging. The targeted and untargeted probe pairs are chosen to have similar molecular weights in an attempt to ensure similar tissue transport kinetics of both agents. Therefore, the normalized difference between the targeted and untargeted probes' fluorescence emphasizes the difference between each probe's uptake, enhancing the signal from the tumor biomarker-targeted probe. The resulting image is thus a direct representation of the targeted probe's specific binding to the tumor biomarker. We have termed this approach Dual-Probe Difference Specimen Imaging (DDSI). We previously reported a proof-of-concept study for the DDSI technique using a HER2-targeted probe and a spectrally distinct untargeted probe [41]. While the DDSI technique showed a significant increase in tumor to surrounding adipose tissue contrast and improved diagnostic performance when compared to targeted stain alone, the staining protocol was not optimized for speed and diagnostic accuracy, and many questions remained unanswered. To date, a full investigation of the relevant parameter space, including stain concentration, incubation times, and fluorescent labels has not been reported.
In this study, we explored this parameter space in an effort to optimize the DDSI staining protocol for future clinical translation. Throughout this study, we used receiver operator characteristic (ROC) curve analysis as the metric of evaluation, and acquired confirmatory immunohistochemistry (IHC) and hematoxylin and eosin (H&E) stained microscopy images of tissue samples. In the first set of experiments, we examined the effect of stain concentration and incubation time on the diagnostic performance of HER2-targeted DDSI imaging, with the aim of choosing the condition that provided the highest diagnostic performance in a short time. Next, in an effort to confirm that the reported diagnostic performance was not driven or otherwise affected by the binding behavior of the fluorescent label itself, an underappreciated issue in fluorescence imaging of tissue [43], we examined the effect of switching the fluorescent labels between targeted and untargeted probes. Finally, to evaluate the diagnostic performance in a semi-blinded, pre-clinical study, we used ROC curve analysis on a training data set to define an optimal diagnostic threshold and applied this result prospectively to a data set that included normal tissue, HER2(+) tumors and HER2(-) tumors.
Materials & Methods
General Study Design
The three primary objectives of this study were:
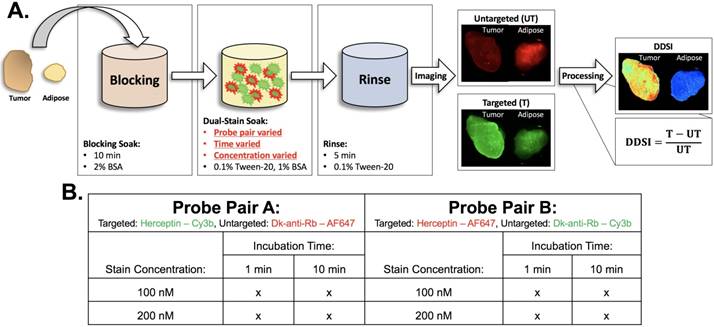
- Identify a tissue staining/washing protocol that provided high diagnostic performance within a clinically relevant time frame that stained the target-of-interest. This was accomplished by repeating DDSI imaging for different staining concentrations and incubation times (100 and 200 nM, 1 and 10 min), where six replicates per condition were completed (Fig. 1).
- Confirm that the fluorophore label did not have a major impact on diagnostic performance. This was accomplished by repeating all staining conditions (100 and 200 nM, 1 and 10 min, 6 replicates per condition), with the fluorescent labels reversed between the targeted and untargeted probes (Fig. 1).
- Determine the diagnostic accuracy of the optimized DDSI method. This was accomplished by selecting the optimal staining condition once parameter optimization studies were completed with 6 replicate tumor and adipose tissue pairs per condition. A diagnostic threshold derived from ROC curve analysis on a training data set was then determined and used on a prospective testing data set that included normal tissue, HER2(+) and HER2(-) tumors. Six replicates per HER2 expression condition were used for the testing data set experiments.
Staining protocol and experimental conditions. (A) Schematic of DDSI staining protocol and imaging approach. The parameters for each step of the staining protocol are listed in their respective boxes. The dual-stain soak experimental parameters that were optimized are highlighted in red. DDSI image processing was performed by subtracting the untargeted image from the targeted image and then dividing by the untargeted image as shown. (B) Table of experimental conditions tested to optimize the staining protocol.
For each replicate, tumor and normal adipose tissues were stained with the DDSI protocol resulting in a total of 60 tissue pairs. Color and fluorescence images were acquired using a custom-built widefield imaging system capable of acquiring co-registered images of each probe's fluorescence. Following DDSI image processing and analysis, each condition's performance was evaluated using ROC curve analysis as assessed through the area under the curve (AUC) to determine tumor vs. normal tissue diagnostic performance. Confirmatory Her2-IHC and H&E were also completed for each sample.
Fluorophores & Antibodies
Alexa Fluor 647 (AF647, Thermo Fisher Scientific, Waltham, MA) and Cy3B (GE Healthcare Life Sciences, Little Chalfont, UK) were used for all fluorescence imaging studies. These fluorophores were selected because they are photostable, have relatively high quantum yields and are readily available. Each fluorophore was purchased in its N-hydroxysuccinimide (NHS) ester form and solubilized in anhydrous DMSO at 10 mM for antibody conjugation reactions. Trastuzumab (Herceptin, Genentech, South San Francisco, CA, molecular weight (MW) = 145.5 kDa) was used as the targeted probe for all studies. Lyophilized Herceptin was made into a stock solution at 2 mg/mL using 1x phosphate buffered saline (1x PBS) at pH 7.4. Donkey anti-rabbit IgG (Jackson ImmunoResearch, West Grove, PA, MW = 150 kDa) was used as the untargeted probe for all studies.
Mice & Cell Lines
The MCF7 parent line and MCF7 cell line transfected with HER2/neu (MCF7-HER2) [44] were grown to 90% confluence and harvested for tumor implantation. 32-38 day old female athymic nude mice (Homozygous 490, Charles Rivers Labs, Wilmington, MA) weighing 19-21 g were used for growth of MCF7-HER2 and MCF7 tumor xenografts. All animal studies were approved by the Institutional Animal Care and Use Committee (IACUC) at Oregon Health and Science University (OHSU).
Tumor Implantation & Growth
Four days prior to MCF7-HER2 implantation, mice were implanted with 0.72 mg/pellet 90 day release 17β-estradiol pellets (Innovative Research of America, Sarasota, FL), explained as follows. One hour prior to pellet implantation, mice were injected intraperitoneally (IP) with 0.05 mg/kg buprenorphine (Reckitt Benckiser Pharmaceuticals Inc., Slough, UK) to mitigate any pain from the procedure. Mice were then anaesthetized with 100 mg/kg ketamine (Hospira Inc., Lake Forest, IL) and 10 mg/kg xylazine (AnaSed, Shenandoah, IA) injected IP. Depth of anesthesia was assessed using the toe pinch method to ensure mice were fully anesthetized prior to any surgical manipulation. In a sterile surgical field, the lateral dorsal neck of the mice was sterilized with povidine-iodine (Purdue Products, Stamford, CT). A small incision (~5 mm) was made on the right side of the neck between the right ear and shoulder using autoclaved instruments and a single 17β-estradiol pellet was placed beneath the skin using a 10-gauge trochar (Innovative Research of America, Sarasota, FL). The incision was sealed with Vetbond™ (3M, St. Paul, MN) and monitored over the next week for healing. Estradiol implantation is necessary for MCF7 cell line tumorigenicity [44].
Four days later, MCF7-HER2 tumors were implanted, detailed as follows. Mice were anaesthetized with 100 mg/kg ketamine and 10 mg/kg xylazine injected IP. The peritoneal region of the animal was sterilized with providine-iodine in a sterile surgical field. A small incision (~3 mm) was made bilaterally adjacent to the inferior nipple on the left and right sides of each mouse. Forceps were used to retract the mammary adipose pad through the incision followed by a 200 µL injection of MCF7-HER2 cell suspension (1x10⁶ cells) into each mammary adipose pad. The injected mammary adipose pad was carefully inserted back through the incision after which the incision was sealed with Vetbond™. All incisions were monitored daily for a week to ensure healing. Mice were monitored weekly for tumor growth and overall health. The tumors were allowed to grow for 4-6 weeks or until tumor diameter reached 1 cm3 as measured by calipers.
The training data set consisted of a cohort of 15 mice implanted with MCF7-HER2 tumors bilaterally for optimization of the dual probe staining concentration and incubation time. Of the 30 total implantation sites, 24 tumors grew, which were bisected and used in the optimization studies. A second cohort of 2 mice were implanted with MCF7-HER2 tumors for a testing set for staining with the selected optimal probe pair, protein concentration and incubation time. Of the 4 total implantation sites, 3 tumors grew, which were bisected and used in the testing set. An additional cohort of 3 mice were implanted with the MCF7 parent cell line bilaterally for a testing set with HER2 negative tumors. Of the 6 total implantation sites, 3 tumors grew, which were bisected and used in the testing set.
Antibody-Fluorophore Conjugations
Each antibody was conjugated to each fluorophore, resulting in the following labeled antibodies: Herceptin-AF647, Herceptin-Cy3B, DkRb-AF647, and DkRb-Cy3B, which were prepared individually as follows. The antibody was buffer exchanged into 1x PBS, pH 8.0 at a concentration of 2.0 mg/mL for Herceptin and 1.3 mg/mL for DkRb. 1.5 µL of the 10 mM fluorophore stock solution in anhydrous DMSO was added to 220 µL of Herceptin and 1 µL of 10 mM fluorophore stock solution in anhydrous DMSO was added to 220 µL of DkRb, resulting in a 5:1 fluorophore to antibody molar ratio in a total volume of 1 mL. The mixture was shaken gently at room temperature for 3 h protected from light. The resulting mixture was concentrated in 10 kDa molecular weight cut off spin filter (MWCO, Amicon® Ultra 0.5 mL 10 kDa, Fisher Scientific, Waltham, MA) into a clean microcentrifuge tube to remove unreacted fluorophore, followed by purification through a 6 kDa MWCO desalting column (Bio-Scale™ Mini Bio-Gel® P-6 5 mL, Bio-Rad, Hercules, CA) using a fast protein liquid chromatography system (FPLC, NGC Quest™ 10 Plus, Bio-Rad, Hercules, CA). The fluorophore to protein ratio for each antibody conjugate was quantified using absorbance spectroscopy (SpectraMax M5 Microplate Reader, Molecular Devices, Sunnyvale, CA). The antibody absorbance was measured at 280 nm (Herceptin extinction coefficient = 225,000 M-1cm-1, Donkey anti-rabbit extinction coefficient = 210,000 M-1cm-1). Cy3B absorbance was measured at 560 nm (Cy3B extinction coefficient = 130,000 M-1cm-1), while AF647 absorbance was measured at 650 nm (AF647 extinction coefficient = 270,000 M-1cm-1). Calibrated absorbance and fluorescence spectra and the Beer-Lambert law were used to determine the concentration of fluorophore and antibody for each conjugate [45]. All fluorophore-to-antibody ratios used in this study were between 3:1 and 4:1.
DDSI staining solution was made by mixing Herceptin-AF647 with DkRb-Cy3B or Herceptin-Cy3B with DkRb-AF647 in a solution containing 1x PBS pH 7.4, 0.1% Tween-20, and 1% bovine serum albumin (BSA). Final antibody solution concentrations and probe mixtures used for DDSI staining studies were as follows: Herceptin-Cy3B + DkRb-AF647 at concentrations of 100 and 200 nM measured by protein concentration and Herceptin-AF647 + DkRb-Cy3B at concentrations of 100 and 200 nM measured by protein concentration.
Tumor Resection & DDSI Staining
MCF7-HER2 tumor bearing mice were euthanized using CO2 asphyxiation followed by cervical dislocation after 4-6 weeks of tumor growth or a maximum tumor size of 1 cm3. Tumors were extracted and bisected prior to DDSI staining, with bisected pairs being used to test different staining conditions. Bisection would not be necessary in clinical use, but was performed in this study in order to test multiple conditions using the same tumor for increased control over potential variation in specimen composition. For each bisected tumor sample, a corresponding mammary adipose sample was extracted from each mouse. MCF7-HER2 tumor and mammary adipose samples were stained and washed together following a previously published procedure (Fig. 1A) [41]. Briefly, tumor and adipose sample pairs were incubated in 1 mL of 2% BSA in PBS blocking solution for 10 min. Then each sample pair was incubated in 1 mL of DDSI staining solution for 1 or 10 min. Specimens were stained with both probes simultaneously to minimize the required staining time, making the technique feasible for integration into routine clinical workflow. Each DDSI stained sample pair was transferred to 50 mL of wash solution composed of 0.1% Tween-20 in PBS and gently agitated for 5 min. Tumor and adipose pairs were immediately transferred to glass slides for imaging with the bisected cut face facing up towards the light source and camera. With two staining solutions at two concentrations (100 and 200 nM) and two incubation times (1 and 10 min) a total of 48 bisected tumor and mammary adipose pairs were collected resulting in n=6 tissue pairs per DDSI staining condition for the optimization studies (Fig. 1B). Following optimization, an additional testing cohort consisting of n=6 MCF7-HER2 and n=6 MCF7 tumor specimens were stained and imaged for validation of DDSI method's diagnostic ability and subsequent immunohistochemical (IHC) analysis, making a total of 60 tissue pairs stained and measured for this study.
DDSI Macroscopic Imaging
Tumor and adipose tissue pair imaging was performed using a custom-built wide field imaging system consisting of a QImaging EXi Blue monochrome camera (Surrey, British Columbia, CA) for fluorescence detection with a removable Bayer filter for collecting co-registered color images [46-48]. A PhotoFluor II light source (89 North, Burlington, VT) was focused onto the field of view (FOV, 34 mm × 45 mm) through a liquid light guide and used unfiltered for white light illumination. For fluorescence excitation of the dual probe stain, the PhotoFluor II was filtered with a 545 nm ± 12.5 nm or 620 nm ± 30 nm bandpass excitation filter for Cy3B or AF647, respectively. The fluence rate for each channel was 12 mW/cm2 and 15 mW/cm2 for the Cy3B and AF647 excitation, respectively. Fluorescence was collected with a 605 nm ± 35 nm or a 700 nm ± 37.5 nm bandpass emission filter for Cy3B or AF647, respectively. All filters were obtained from Chroma Technology (Bellows Falls, VT). In addition to tumor and adipose tissue pairs, an aliquot of each dual probe staining solution in a covered optical well plate (Greiner Bio-One, Monroe, NC) was imaged for normalization between channels and stain concentrations. Camera exposure times ranged from 10-50 ms and 150-500 ms for fluorescence image collection of calibration drop images and tissue specimens, respectively. Image resolution for fluorescence and color images was 70 µm.
DDSI Image Processing
Co-registered images captured of targeted and untargeted fluorescence were processed and used to create DDSI images of each tumor-adipose tissue pair. Image processing was completed using custom-written MatLab Code (MathWorks, Natick, MA). Image processing began by subtracting the median background signal from the entire image in a user selected region of interest (ROI) in which no tissue was present. To account for any fluorescence variance between experiments, the staining solutions for each study were imaged and a user defined ROI was quantified for each probe pair and concentration used for staining. Images from each fluorescence channel were normalized by dividing each pixel by the average intensity value of the ROI representing the DDSI staining solution corresponding to the probe pair and concentration used for staining. A mask was then applied to each normalized image so that only pixels of measurable fluorescence (0.8-1.2x the average pixel value of the area containing tissue) were used in the DDSI image calculation. The DDSI image was then calculated as IDDSI = (ITargeted - IUntargeted) / IUntargeted. Tumor and normal tissue areas were determined via user selected ROIs encompassing the entire tissue area and intersected with the tissue mask for statistical analysis.
Confocal Microscopy
Following macroscopic imaging, representative tumor and adipose tissue pairs were imaged immediately using the Zeiss LSM880 (Carl Zeiss Microscopy GmbH, Jena, Germany) to collect high resolution images of the targeted and untargeted probe fluorescence. Using a plan-apochromatic 20x (NA = 0.8) objective, images were collected with the following settings: laser: 561 nm, 10% transmission (DPSS 561-10, Cy3B); 633 nm, 2% transmission (HeNe633, AF647); beam splitter: MBS 458/514/561/633; filter: 566-628 nm (Cy3B), 638-755 nm (AF647); pixel time: 1.5 μs; average: line 1; master gain: 750 (Cy3B), 700 (AF647); pinhole size: 90 μm; and acquisition area 512 × 512 pixels, 16-bit. Zen imaging software (Zeiss) was used to merge each fluorescence channel image colorimetrically with the red channel representing Cy3B fluorescence and the green channel representing AF647 fluorescence.
IHC Staining & Microscopy
Following imaging, each tumor and adipose tissue pair was flash frozen in optimal cutting temperature (OCT) compound for tissue preservation. To enable IHC staining of each tissue pair, the OCT blocks were thawed and re-embedded in paraffin for sectioning, H&E staining, and HER2 IHC staining. The tissue face imaged for DDSI analysis was placed in the paraffin blocks so that it would be sectioned for staining. All blocks were faced prior to collecting serial sections for H&E and IHC staining, thus the exact tissue face that was imaged for DDSI analysis was not used for IHC staining. However, tissue within a few hundred microns was used for IHC analysis of HER2 expression levels. A different HER2 antibody (1:400, EP1045Y, ab134182, AbCam, Cambridge, MA) targeted to the intracellular domain of HER2 was used for IHC, to ensure staining of all HER2 proteins, even those already stained with Herceptin [49]. After paraffin embedding, H&E, and IHC staining was performed by Oregon Health and Science University's (OHSU) Histology Shared Resources. H&E and IHC slides were imaged using the Zeiss AxioScan.Z1 Microscope (Zeiss). Bright field images were obtained at 10x magnification. Using the ZEN Slide scanner software, the ROI (tumor and mammary adipose) was detected using Automatic Tissue Recognition due to the visibility of the H&E and IHC stains. Six field of views (FOVs) were used to set the focus map. The ROI was then scanned at 10x magnification, acquiring tiles over the entire tissue specimen, which were automatically stitched by the ZEN software to create the final image.
Statistical Analysis
Statistical analysis was performed using MatLab. To determine the tumor-to-normal adipose tissue diagnostic detection ability, ROC curves were generated for the untargeted probe images, targeted probe images, and calculated DDSI images. ROC curves and corresponding AUC measurements were calculated using the perfcurve function in MatLab on a pixel-by-pixel basis with individual pixel values for each tissue type used as the response variable input. Additionally, the optimal tumor vs. normal adipose tissue threshold values were determined using the ROC point generated from the perfcurve function and back calculated to actual pixel value thresholds. Histogram plots of the untargeted probe image, targeted probe image and DDSI image pixel values for tumor and normal adipose pixels were generated and the optimal threshold point determined via ROC curve analysis was plotted. Statistical significance between staining conditions was determined using the method described by Hanley and McNeil [50] with standard error measurements and correlation coefficients for pixel intensity values in each channel used for z-score value calculations. z-score values >2 were considered statistically significant [50]. Sensitivity and specificity measurements were determined for the testing dataset using the optimal threshold value determined from the optimized DDSI staining condition in the training optimization studies.
Results
DDSI Staining Condition Optimization and Qualitative Assessment of HER2 Expression by IHC
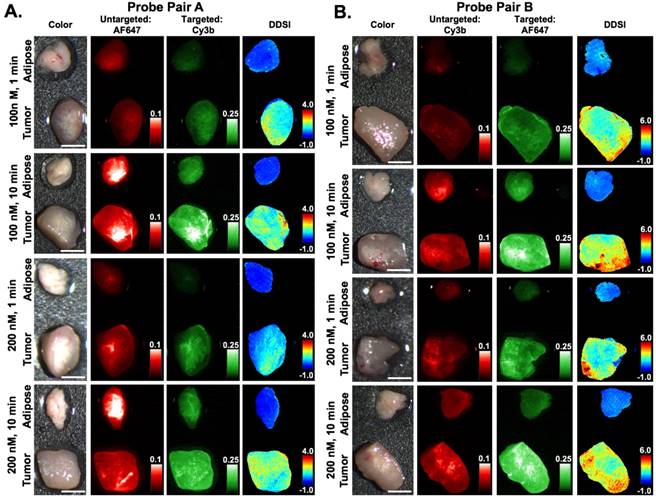
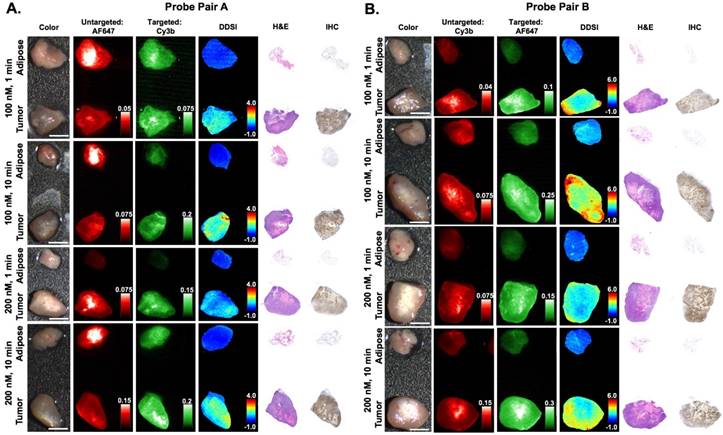
Varied DDSI probe pairs (Herceptin-Cy3B + DkRb-AF647, Herceptin-AF647 + DkRb-Cy3B), stain solution concentrations (100 and 200 nM), and staining incubation times (1 and 10 min) were examined to establish a DDSI staining protocol with speed and accuracy permitting both diagnostic performance and clinical feasibility (Fig. 1B). Qualitatively, DDSI images showed improved tumor-to-adipose tissue contrast when compared to untargeted or targeted probe images across all conditions and probe pairs tested (Fig. 2). Upon comparison, both probe pairs demonstrated the ability to differentiate between tumor and adipose tissues, showing that neither fluorophore label was dominating the tissue biodistribution kinetics of the targeted and untargeted probes [43, 51]. DDSI images also showed more homogeneous intensities across staining conditions and replicates compared to targeted or untargeted single probe images (Fig. 2 & S1). IHC assessment of HER2 staining patterns revealed similar HER2 expression with DDSI staining patterns across probe pairs and staining conditions (Fig. 3). By comparison, HER2 IHC staining patterns were not well aligned with single probe targeted staining patterns, often showing inverse staining patterns. Targeted and untargeted probes routinely showed similar staining pattern to one another, suggesting non-specific uptake dominated the staining pattern. DDSI corrected for the non-specific uptake, yielding staining patterns that were well matched with the ground truth HER2 IHC staining patterns (Fig. 3 & S2).
DDSI staining condition optimization. Representative color, fluorescence, and DDSI images of tumor and adipose tissue pairs following staining using a range of dual-stain soak concentrations and incubation times for (A) probe pair A (Herceptin-Cy3b, DkRb-AF647) and (B) probe pair B (Herceptin-AF647, DkRb-Cy3b). All images are representative of data collected for n=6 tumor and adipose tissue pairs per staining condition. All untargeted and targeted channel images are background corrected, normalized by their exposure time and calibration drop intensity, and displayed on equivalent color scales across staining conditions and probe pairs. DDSI images are displayed with equivalent color scales across staining conditions. Scale bars = 5 mm.
Immunohistochemical analysis and DDSI staining pattern validation. Representative color, fluorescence, DDSI, H&E, and HER2 targeted IHC images of tumor and adipose tissue pairs following staining using a range of dual-stain soak concentrations and incubation times for (A) probe pair A (Herceptin-Cy3b, DkRb-AF647) and (B) probe pair B (Herceptin-AF647, DkRb-Cy3b). All images are representative of data collected for n=6 tumor and adipose tissue pairs per staining condition. All untargeted and targeted channel images are background corrected, normalized by their exposure time and calibration drop intensity. DDSI images are displayed with equivalent color scales across staining conditions. H&E and IHC images were acquired from serial sections of the same tissue face imaged in the whole specimen DDSI images. H&E: hematoxylin and eosin; IHC: immunohistochemistry. Scale bars = 5 mm.
Diagnostic Potential Quantification and Optimal Staining Parameter Selection using Training Tumor Xenograft Cohort
Untargeted, targeted, and DDSI image data was quantified using ROC curve analysis to determine the optimal probe pair and staining conditions. AUC for each ROC curve was calculated to assess the ability to differentiate tumor from adipose tissue for each tested staining condition (Fig. 4A, 4B, & S3). DDSI significantly improved tumor vs. normal adipose tissue AUC values when compared to targeted single probe staining alone across all DDSI probe pairs and tested staining conditions (Fig. 4, Table 1). These results are in agreement with a similar and promising analysis performed in human breast cancer specimens using dual probe ratiometric imaging of SERS nanoparticles to guide tumor margin assessment [52]. The highest three AUC values were generated using the 200 nM, 10 min staining condition for the Herceptin-AF647 + DkRb-Cy3B probe pair (AUC = 0.989), 100 nM, 10 min staining condition for the Herceptin-Cy3B + DkRb-AF647 probe pair (AUC = 0.978), and 200 nM, 1 min staining condition for the Herceptin-AF647 + DkRb-Cy3B probe pair (AUC = 0.974) (Fig. 4A, 4B, & S3).
ROC AUC values and z-statistics for DDSI stain condition optimization.
| Probe Pair A Targeted: Herceptin-Cy3B, Untargeted: Dk-anti-Rb-AF647 | Probe Pair B Targeted: Herceptin-AF647, Untargeted: Dk-anti-Rb-Cy3B | ||||||||||||
|---|---|---|---|---|---|---|---|---|---|---|---|---|---|
| Stain Concentration: | Incubation Time: | Stain Concentration: | Incubation Time: | ||||||||||
| 1 min | 10 min | 1 min | 10 min | ||||||||||
| 100 nM | UT | T | DDSI | UT | T | DDSI | 100 nM | UT | T | DDSI | UT | T | DDSI |
| 0.532 | 0.866 | 0.965 | 0.586 | 0.930 | 0.978 | 0.705 | 0.928 | 0.929 | 0.612 | 0.921 | 0.958 | ||
| z-stat: | 155.7 | z-stat: | 114.6 | z-stat: | 3.1 | z-stat: | 72.1 | ||||||
| 200 nM | UT | T | DDSI | UT | T | DDSI | 200 nM | UT | T | DDSI | UT | T | DDSI |
| 0.488 | 0.880 | 0.973 | 0.491 | 0.844 | 0.906 | 0.715 | 0.962 | 0.974 | 0.736 | 0.977 | 0.989 | ||
| z-stat: | 172.2 | z-stat: | 163.0 | z-stat: | 29.8 | z-stat: | 48.2 | ||||||
*UT: untargeted channel; T: targeted channel; ROC: receiver operator characteristic; AUC: area under curve; z-stat: z-statistic obtained from comparison of targeted vs. DDSI ROC AUC values for each staining condition (z-stat > 2 signifies significantly different AUC values).
ROC curve analysis and optimal DDSI staining condition selection. ROC curves and AUC values for untargeted, targeted, and DDSI images of tumor vs. normal adipose tissue differentiation following staining using a range of dual-stain soak concentrations and incubation times for (A) probe pair A (Herceptin-Cy3b, DkRb-AF647) and (B) probe pair B (Herceptin-AF647, DkRb-Cy3b). (C) Tumor and normal tissue pixel intensity histograms, ROC curves, and AUC values for untargeted, targeted, and DDSI images following staining using probe pair B at 200 nM concentration and 1 min incubation time. Optimal points determined from ROC curve analysis are displayed on each ROC curve and as a vertical line on each pixel value histogram. ROC: receiver operator characteristic; AUC: area under curve; opt pt: optimal point.
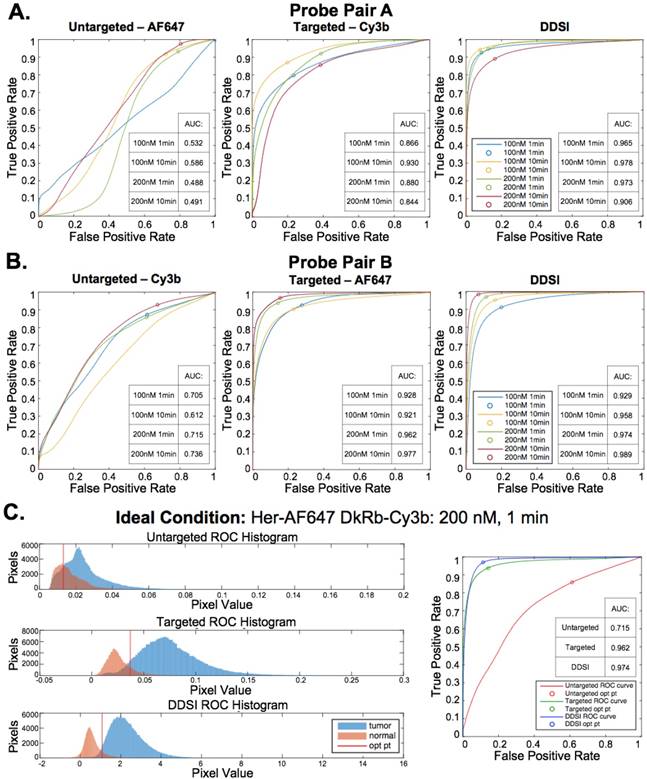
The 200 nM, 1 min staining condition using the Herceptin-AF647 + DkRb-Cy3B probe pair was chosen as the optimal staining condition since its AUC was not appreciably different than the 10 min staining conditions and the 1 min incubation time would be more clinically feasible for margin assessment in the operating room. Histograms of the untargeted, targeted, and DDSI pixel values demonstrated the improved separation of intensity distribution between MCF7-HER2 tumor and normal adipose tissue using the DDSI method compared to the targeted or untargeted probe alone (Fig. 4C). Additionally, a more normal distribution for both tissue types was obtained using DDSI compared to the single probe targeted stain, signifying the improvement in ROC AUC values (Fig. 4C) and intensity normalization between replicates as a result of DDSI (Fig. S1). Additionally, the optimal cutoff values determined using ROC curve analysis were plotted on the untargeted, targeted, and DDSI histograms to demonstrate the ability to perform automated differentiation between tumor and adipose tissue using a single threshold.
Optimal DDSI Method Validation in MCF7-HER2 and MCF7 Testing Tumor Xenograft Cohort
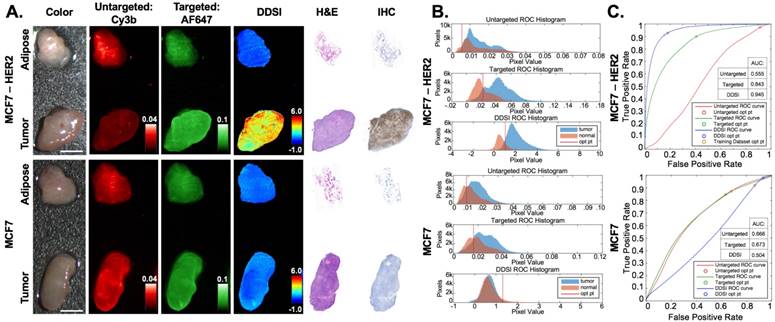
The selected probe pair (Herceptin-AF647 + Dk-Rb-Cy3B) and staining condition (200 nM, 1 min) was applied to a testing MCF7-HER2 (HER2+) paired tumor and normal adipose tissue cohort and to a matched MCF7 (HER2-) tumor and normal adipose tissue cohort for validation of the diagnostic potential of the optimized DDSI staining condition (Fig. 5 & S4). MCF7-HER2 tumors stained using the optimal probe pair and staining conditions demonstrated similar improvements in DDSI tumor vs. normal adipose AUC values when compared to the single probe targeted stain (Targeted AUC = 0.84, DDSI AUC = 0.95, z = 131.0). Additionally, similar optimal cutoff values to the staining condition optimization training MCF7-HER2 tumor cohort were determined for the testing cohort upon ROC curve analysis (Fig 5C). Applying the optimal threshold value determined from the training cohort (Fig. 4C) to the testing cohort (Fig. 5C) provided a sensitivity of 91% and a specificity of 84% for tumor vs. normal tissue differentiation. The MCF7 tumor cohort stained using the selected probe pair and staining conditions demonstrated significantly lower DDSI image intensities and DDSI tumor vs. normal adipose tissue AUC values compared to the MCF7-HER2 tumor cohort. Additionally, the tumor vs. normal adipose tissue AUC value was decreased from 0.67 for the single probe targeted stain to 0.50 for DDSI in the MCF7 tumor line tumor. This was the expected behavior as MCF7 is a HER2 negative cell line that should not generate HER2 specific signal; however, when targeted probe alone was assessed, some nonspecific uptake of HER2 was seen (AUC = 0.67), which was corrected using the DDSI protocol (AUC = 0.50). HER2 targeted IHC completed on the same representative tissue confirmed the expected HER2 overexpression in MCF7-HER2 tumors, which was again closely matched with the DDSI pattern. Furthermore, high resolution images of the targeted probe and IHC staining pattern confirmed the membrane bound fluorescence staining pattern expected from HER2 targeted imaging (Fig. S5). HER2 IHC staining showed minimal HER2 expression in MCF7 parent line tumors, supporting the DDSI AUC of 0.50 between tumor and normal tissues based on HER2 expression (Fig. 5).
HER2(+) and HER2(-) testing cohort for DDSI staining and IHC validation. (A) Representative color, fluorescence, DDSI, H&E, and HER2 targeted IHC images of MCF7-HER2 (HER2+) and MCF7 (HER2-) tumor and adipose tissue pairs following staining using the optimal staining condition (Probe pair B, 200 nM concentration, 1 min incubation time). All images are representative of data collected for n=6 tumor and adipose tissue pairs per tumor cell line. All untargeted and targeted channel images are background corrected, normalized by their exposure time and calibration drop intensity, and displayed on equivalent color scales. DDSI images are displayed with equivalent color scales. H&E and IHC images were acquired from serial sections of the same tissue face imaged in the whole DDSI specimen images. Scale bars = 5 mm. (B) Tumor and normal tissue pixel intensity histograms, (C) ROC curves, and AUC values for untargeted, targeted, and DDSI images corresponding to each cell line. Optimal points determined from ROC analysis are displayed on each ROC curve (blue marker) and as a vertical line on each pixel value histogram. The optimal point determined from the training cohort data is displayed on the MCF7-HER2 tumor specimen ROC curve to demonstrate the diagnostic reproducibility under optimal staining conditions (orange marker). H&E: Hematoxylin & Eosin; IHC: immunohistochemistry; ROC: receiver operator characteristic; AUC: area under curve; opt pt: optimal point.
Discussion
The primary aims of this study were to optimize and validate the DDSI staining technique for improved tumor margin assessment during BCS. Incomplete tumor resection during BCS plagues surgical outcomes, requiring expensive, invasive follow-up surgery, increasing the chances of morbidity, and negatively affecting patient outcomes [2-6]. Contrast guided resection techniques have shown promise for improved margin assessment using molecularly specific probes [53, 54]; however clinical translation of contrast agents for in vivo applications remains challenging. To circumvent these difficulties, staining of the resected tumor specimens has gained in popularity. However non-specific contrast uptake dominates resected specimen staining, significantly decreasing tumor to normal tissue contrast. Using our novel DDSI technique, non-specific uptake can be overcome and excised tumor tissue can be distinguished from normal tissue with high sensitivity and specificity [41].
In the present study, we examined a wide range of staining conditions where probe concentration, staining time and fluorophore were varied from conditions used in the prior proof-of-concept study to identify a suitable protocol for future clinical studies (Fig. 1). We evaluated the diagnostic performance of a single condition, which could both minimize staining time and optimize diagnostic potential. The diagnostic potential was evaluated using a semi-blinded, pre-clinical study through ROC curve analysis on a training data set to define an optimal diagnostic threshold and applied prospectively to a testing data set that included normal tissue, HER2(+) tumors and HER2(-) tumors.
The DDSI staining conditions tested provided a robust and rapid diagnostic technique for intraoperative tumor margin assessment. Across both fluorescent probe pairs and all staining conditions, DDSI showed improved tumor to normal adipose tissue differentiation as compared to targeted probe alone (Fig. 2, Fig. 4A & 4B). The fluorophore labels chosen for this study, AF647 and Cy3B, did not significantly affect DDSI performance, with consistent tumor to normal adipose tissue differentiation across both fluorophore antibody probe pairs. While probe pair B demonstrated an increase in DDSI values compared to probe pair A, this increase occurred in both tumor and normal tissue equally, causing negligible overall change in probe pair B's diagnostic ability over probe pair A (Fig. 2, Fig. 4A & 4B). Additionally, the DDSI protocol normalized tumor HER2 intensities between staining conditions, where intensities were significantly less affected by the varied staining parameters than single targeted probe intensities (Fig. S1). The selected optimal staining condition provided high tumor vs. normal tissue sensitivity (97%) and specificity (89%) determined via retrospective ROC curve analysis with a 1 min incubation in a 200 nM solution of the Herceptin-AF647 + DkRb-Cy3B probe pair (Fig. 4C) decreasing overall staining time and imaging time to a total of 16 min, while improving ability to differentiate between benign and malignant tissues.
Importantly, DDSI staining does not interfere with downstream pathology, enabling utilization of current gold standard diagnostic methods to validate intraoperative observations for first in human clinical trials. As a demonstration, DDSI staining patterns were correlated to HER2 expression using HER2 targeted IHC (Fig. 3). DDSI staining patterns were found to closely align with HER2 expression levels and patterns across staining conditions. By comparison, single probe targeted staining patterns were not well aligned with IHC staining patterns, with higher targeted fluorescence intensities in regions of low HER2 IHC expression (Fig. 3). These results demonstrate that the DDSI method accommodates non-specific uptake of the targeted probe as well as other imaging anomalies inherent to single probe optical imaging such as variations in imaging system illumination power, detector non-uniformities, detector working distance, etc. Thus, DDSI provided the ability to rapidly visualize biomarker-bound fluorescence, enabling specific molecularly-targeted imaging to be completed on resected tissues.
The performance of the selected DDSI protocol was confirmed in an independent testing tumor cohort consisting of HER2+ (MCF7-HER2) and HER2- (MCF7) tumor specimens. The HER2+ testing dataset showed similar diagnostic AUC and optimal cutoff values to the prior HER2+ training dataset, demonstrating the repeatability and robustness of the DDSI staining and analysis method. Applying the optimal threshold calculated from training dataset values, high tumor vs. normal tissue sensitivity (91%) and specificity (84%) was achieved. As expected, the HER2- testing dataset showed lower DDSI signal intensities and AUC values compared to the HER2+ tumor line (Fig. 5). Notably, for HER2- tumor specimens, both targeted and untargeted AUC values were above 0.50, signifying higher uptake in the tumor tissue compared to the normal adipose tissue even though the tissue lacked the HER2 biomarker. DDSI was able to correct for this nonspecific uptake of the targeted stain by the HER2- tumor tissue, bringing the AUC value back down to the expected value of 0.50. These results validate the ability to provide specific molecular imaging on resected tissues with the DDSI technique.
Continued stain protocol development will be necessary to further reduce the overall staining time generating a clinically relevant staining protocol. Total resected specimen staining time could be additionally reduced by optimizing the washing and blocking conditions, which can likely be reduced to <10 min for rapid margin assessment in the operating room. Expanding and screening this technique with a panel of tumor specific biomarkers such as epidermal growth factor receptor (EGFR), estrogen receptor (ER), and progesterone receptor (PgR) for breast cancer, is also needed to utilize DDSI tumor margin assessment on patient specimens with varied tumor subtype, heterogeneous cellular phenotypes and expression patterns, where multiplexed biomarker imaging could be achieved through the addition of other targeted fluorescence channels [55, 56]. This will facilitate translation of the DDSI technique to human specimens excised during BCS for complete validation of this promising technique for margin detection during BCS. Although studies testing mixed tumor and adipose samples are not feasible using xenograft models, DDSI staining on resected human breast tissue samples composed of varying percentages of tumor and adipose mixed tissues will be imperative for validation of the clinical diagnostic performance of the DDSI method.
The animal model system used for this study provided a controlled platform that allowed examination of several different processing conditions and probe pairs; however, as with any translational animal study, the model system has its limitations in recapitulating the challenges in diagnosing human tissue. The small normal tissue volumes and lack of infiltrative tumor growth patterns are relevant limitations of mouse models for this application. However, the dual-probe technique is designed to accommodate/remove the effects of diffusion and other non-specific kinetic behavior regardless of tissue type and structure, and our results suggest that the DDSI parameter is indeed reporting receptor-specific information. These results also provide a robust, evidenced-based protocol for translation to humans. The next phase of development involves validating the optimal stain protocol identified herein on thick slices of discarded human breast specimens from tumor mastectomy patients and then initiating an observational clinical study in the operating room.
In summary, the selected DDSI staining technique showed significant improvement in distinguishing tumor from normal adipose tissue in excised specimens over targeted staining alone. Perturbations in antibody-fluorophore probe pairs had little effect on DDSI performance with consistent tumor vs. normal tissue diagnostic performance across all tested staining conditions. Using antibody based probes and visible fluorophores, the probe penetration and imaging depth are inherently surface weighted and likely limited to a few microns at best. However, according to new consensus criteria for breast cancer margin status, margins are considered to be negative for tumor when there is no tumor at the “ink” or surface of the resected specimen, making the current probe composition viable for clinical translation [57]. DDSI was also demonstrated to be an accurate reporter of tumor specific molecular expression levels of HER2, and provided a validated diagnostic method for intraoperative tumor margin detection with high sensitivity and specificity for BCS. The DDSI framework is generalizable to surgical resection of other cancers, and we are actively studying its application for other indications. With further development and application to a range of cancer biomarkers, this technique could provide the ability to identify diverse cancer phenotypes for improved tumor margin assessment intraoperatively, reducing re-excision rates and improving patient outcomes.
Abbreviations
BCS: breast conserving surgery; DDSI: dual probe difference specimen imaging; ROC: receiver operator characteristic; AUC: area under curve; IHC: immunohistochemistry; H&E: hematoxylin and eosin; NHS: N-hydroxysuccinimide; MCF7-HER2: MCF7 cell line transfected with HER2/neu; IACUC: Institutional Animal Care and Use Committee; OHSU: Oregon Health and Science University; ROI: region of interest; FOV: field of view; UT: untargeted; T: targeted; Opt pt: optimal point.
Supplementary Material
Supplementary figures.
Acknowledgements
We would like to thank Dr. Kimberley Samkoe, Dr. Margaret Folaron and Mr. Rendy Strawbridge for insightful discussions. We would also like to thank Maximus Kullberg at the Rogue Science Labs for the cell lines used in this study. This work was funded by the National Cancer Institute (R01CA188491).
Competing Interests
The authors have declared that no competing interest exists.
References
1. Miller KD, Siegel RL, Lin CC, Mariotto AB, Kramer JL, Rowland JH. et al. Cancer treatment and survivorship statistics, 2016. CA: a cancer journal for clinicians. 2016;66:271-89
2. Jacobs L. Positive margins: the challenge continues for breast surgeons. Annals of surgical oncology. 2008;15:1271-2
3. Waljee JF, Hu ES, Newman LA, Alderman AK. Predictors of re-excision among women undergoing breast-conserving surgery for cancer. Annals of surgical oncology. 2008;15:1297-303
4. Wilke LG, Czechura T, Wang C, Lapin B, Liederbach E, Winchester DP. et al. Repeat surgery after breast conservation for the treatment of stage 0 to II breast carcinoma: a report from the National Cancer Data Base, 2004-2010. JAMA Surg. 2014;149:1296-305
5. Jeevan R, Cromwell DA, Trivella M, Lawrence G, Kearins O, Pereira J. et al. Reoperation rates after breast conserving surgery for breast cancer among women in England: retrospective study of hospital episode statistics. Bmj. 2012;345:e4505
6. Freedman G, Fowble B, Hanlon A, Nicolaou N, Fein D, Hoffman J. et al. Patients with early stage invasive cancer with close or positive margins treated with conservative surgery and radiation have an increased risk of breast recurrence that is delayed by adjuvant systemic therapy. Int J Radiat Oncol Biol Phys. 1999;44:1005-15
7. Jorns JM, Visscher D, Sabel M, Breslin T, Healy P, Daignaut S. et al. Intraoperative frozen section analysis of margins in breast conserving surgery significantly decreases reoperative rates: one-year experience at an ambulatory surgical center. Am J Clin Pathol. 2012;138:657-69
8. Valdes EK, Boolbol SK, Cohen JM, Feldman SM. Intra-operative touch preparation cytology; does it have a role in re-excision lumpectomy? Annals of surgical oncology. 2007;14:1045-50
9. Ihrai T, Quaranta D, Fouche Y, Machiavello JC, Raoust I, Chapellier C. et al. Intraoperative radiological margin assessment in breast-conserving surgery. European journal of surgical oncology: the journal of the European Society of Surgical Oncology and the British Association of Surgical Oncology. 2014;40:449-53
10. Moschetta M, Telegrafo M, Introna T, Coi L, Rella L, Ranieri V. et al. Role of specimen US for predicting resection margin status in breast conserving therapy. Il Giornale di chirurgia. 2015;36:201-4
11. Rivera RJ, Holmes DR, Tafra L. Analysis of the Impact of Intraoperative Margin Assessment with Adjunctive Use of MarginProbe versus Standard of Care on Tissue Volume Removed. Int J Surg Oncol. 2012;2012:868623
12. Singletary SE. Surgical margins in patients with early-stage breast cancer treated with breast conservation therapy. Am J Surg. 2002;184:383-93
13. Esbona K, Li Z, Wilke LG. Intraoperative imprint cytology and frozen section pathology for margin assessment in breast conservation surgery: a systematic review. Annals of surgical oncology. 2012;19:3236-45
14. Riedl O, Fitzal F, Mader N, Dubsky P, Rudas M, Mittlboeck M. et al. Intraoperative frozen section analysis for breast-conserving therapy in 1016 patients with breast cancer. European journal of surgical oncology: the journal of the European Society of Surgical Oncology and the British Association of Surgical Oncology. 2009;35:264-70
15. Saarela AO, Paloneva TK, Rissanen TJ, Kiviniemi HO. Determinants of positive histologic margins and residual tumor after lumpectomy for early breast cancer: a prospective study with special reference to touch preparation cytology. Journal of surgical oncology. 1997;66:248-53
16. Jorns JM, Daignault S, Sabel MS, Wu AJ. Is intraoperative frozen section analysis of reexcision specimens of value in preventing reoperation in breast-conserving therapy? Am J Clin Pathol. 2014;142:601-8
17. Cendan JC, Coco D, Copeland EM 3rd. Accuracy of intraoperative frozen-section analysis of breast cancer lumpectomy-bed margins. Journal of the American College of Surgeons. 2005;201:194-8
18. Osako T, Nishimura R, Nishiyama Y, Okumura Y, Tashima R, Nakano M. et al. Efficacy of intraoperative entire-circumferential frozen section analysis of lumpectomy margins during breast-conserving surgery for breast cancer. Int J Clin Oncol. 2015;20:1093-101
19. Blohmer JU, Tanko J, Kueper J, Gross J, Volker R, Machleidt A. MarginProbe(c) reduces the rate of re-excision following breast conserving surgery for breast cancer. Arch Gynecol Obstet. 2016;294:361-7
20. Gray RJ, Pockaj BA, Garvey E, Blair S. Intraoperative Margin Management in Breast-Conserving Surgery: A Systematic Review of the Literature. Annals of surgical oncology. 2017
21. Giacomelli MG, Sheikine Y, Vardeh H, Connolly JL, Fujimoto JG. Rapid imaging of surgical breast excisions using direct temporal sampling two photon fluorescent lifetime imaging. Biomed Opt Express. 2015;6:4317-25
22. Tao YK, Shen D, Sheikine Y, Ahsen OO, Wang HH, Schmolze DB. et al. Assessment of breast pathologies using nonlinear microscopy. Proceedings of the National Academy of Sciences of the United States of America. 2014;111:15304-9
23. Bydlon TM, Barry WT, Kennedy SA, Brown JQ, Gallagher JE, Wilke LG. et al. Advancing optical imaging for breast margin assessment: an analysis of excisional time, cautery, and patent blue dye on underlying sources of contrast. PloS one. 2012;7:e51418
24. Sharma V, Shivalingaiah S, Peng Y, Euhus D, Gryczynski Z, Liu H. Auto-fluorescence lifetime and light reflectance spectroscopy for breast cancer diagnosis: potential tools for intraoperative margin detection. Biomed Opt Express. 2012;3:1825-40
25. Kong K, Rowlands CJ, Varma S, Perkins W, Leach IH, Koloydenko AA. et al. Diagnosis of tumors during tissue-conserving surgery with integrated autofluorescence and Raman scattering microscopy. Proceedings of the National Academy of Sciences of the United States of America. 2013;110:15189-94
26. Assayag O, Antoine M, Sigal-Zafrani B, Riben M, Harms F, Burcheri A. et al. Large field, high resolution full-field optical coherence tomography: a pre-clinical study of human breast tissue and cancer assessment. Technol Cancer Res Treat. 2014;13:455-68
27. Erickson-Bhatt SJ, Nolan RM, Shemonski ND, Adie SG, Putney J, Darga D. et al. Real-time Imaging of the Resection Bed Using a Handheld Probe to Reduce Incidence of Microscopic Positive Margins in Cancer Surgery. Cancer Res. 2015;75:3706-12
28. Erickson-Bhatt SJ, Roman M, Gonzalez J, Nunez A, Kiszonas R, Lopez-Penalver C. et al. Noninvasive Surface Imaging of Breast Cancer in Humans using a Hand-held Optical Imager. Biomed Phys Eng Express. 2015:1
29. Liu J, Guo W, Tong M. Intraoperative indocyanine green fluorescence guidance for excision of nonpalpable breast cancer. World J Surg Oncol. 2016;14:266
30. Tummers QR, Verbeek FP, Schaafsma BE, Boonstra MC, van der Vorst JR, Liefers GJ. et al. Real-time intraoperative detection of breast cancer using near-infrared fluorescence imaging and Methylene Blue. European journal of surgical oncology: the journal of the European Society of Surgical Oncology and the British Association of Surgical Oncology. 2014;40:850-8
31. Kang S, Wang Y, Reder NP, Liu JT. Multiplexed Molecular Imaging of Biomarker-Targeted SERS Nanoparticles on Fresh Tissue Specimens with Channel-Compressed Spectrometry. PloS one. 2016;11:e0163473
32. Wang Y, Kang S, Doerksen JD, Glaser AK, Liu JT. Surgical Guidance via Multiplexed Molecular Imaging of Fresh Tissues Labeled with SERS-Coded Nanoparticles. IEEE journal of selected topics in quantum electronics: a publication of the IEEE Lasers and Electro-optics Society. 2016:22
33. Wang Y, Kang S, Khan A, Ruttner G, Leigh SY, Murray M. et al. Quantitative molecular phenotyping with topically applied SERS nanoparticles for intraoperative guidance of breast cancer lumpectomy. Sci Rep. 2016;6:21242
34. Wang YW, Doerksen JD, Kang S, Walsh D, Yang Q, Hong D. et al. Multiplexed Molecular Imaging of Fresh Tissue Surfaces Enabled by Convection-Enhanced Topical Staining with SERS-Coded Nanoparticles. Small. 2016;12:5612-21
35. Wang YW, Kang S, Khan A, Bao PQ, Liu JT. In vivo multiplexed molecular imaging of esophageal cancer via spectral endoscopy of topically applied SERS nanoparticles. Biomed Opt Express. 2015;6:3714-23
36. Gibbs SL. Near infrared fluorescence for image-guided surgery. Quantitative imaging in medicine and surgery. 2012;2:177-87
37. Chi C, Du Y, Ye J, Kou D, Qiu J, Wang J. et al. Intraoperative imaging-guided cancer surgery: from current fluorescence molecular imaging methods to future multi-modality imaging technology. Theranostics. 2014;4:1072-84
38. Urano Y, Sakabe M, Kosaka N, Ogawa M, Mitsunaga M, Asanuma D. et al. Rapid cancer detection by topically spraying a gamma-glutamyltranspeptidase-activated fluorescent probe. Sci Transl Med. 2011;3:110ra9
39. Cutter JL, Cohen NT, Wang J, Sloan AE, Cohen AR, Panneerselvam A. et al. Topical application of activity-based probes for visualization of brain tumor tissue. PloS one. 2012;7:e33060
40. Achilefu S. Rapid response activatable molecular probes for intraoperative optical image-guided tumor resection. Hepatology. 2012;56:1170-3
41. Davis SC, Gibbs SL, Gunn JR, Pogue BW. Topical dual-stain difference imaging for rapid intra-operative tumor identification in fresh specimens. Opt Lett. 2013;38:5184-7
42. Sinha L, Wang Y, Yang C, Khan A, Brankov JG, Liu JT. et al. Quantification of the binding potential of cell-surface receptors in fresh excised specimens via dual-probe modeling of SERS nanoparticles. Sci Rep. 2015;5:8582
43. Choi HS, Gibbs SL, Lee JH, Kim SH, Ashitate Y, Liu F. et al. Targeted zwitterionic near-infrared fluorophores for improved optical imaging. Nature biotechnology. 2013;31:148-53
44. Benz CC, Scott GK, Sarup JC, Johnson RM, Tripathy D, Coronado E. et al. Estrogen-dependent, tamoxifen-resistant tumorigenic growth of MCF-7 cells transfected with HER2/neu. Breast Cancer Res Treat. 1992;24:85-95
45. Swinehart DF. The Beer-Lambert Law. Journal of Chemical Education. 1962;39:333
46. Barth CW, Gibbs SL. Visualizing Oxazine 4 nerve-specific fluorescence ex vivo in frozen tissue sections. 2016. p. 96960R-R-8.
47. Barth CW, Gibbs SL. Direct Administration of Nerve-Specific Contrast to Improve Nerve Sparing Radical Prostatectomy. Theranostics. 2017;7:573-93
48. Hackman KM, Doddapaneni BS, Barth CW, Wierzbicki IH, Alani AW, Gibbs SL. Polymeric Micelles as Carriers for Nerve-Highlighting Fluorescent Probe Delivery. Molecular pharmaceutics. 2015
49. Cho HS, Mason K, Ramyar KX, Stanley AM, Gabelli SB, Denney DW Jr. et al. Structure of the extracellular region of HER2 alone and in complex with the Herceptin Fab. Nature. 2003;421:756-60
50. Hanley JA, McNeil BJ. A method of comparing the areas under receiver operating characteristic curves derived from the same cases. Radiology. 1983;148:839-43
51. Choi HS, Nasr K, Alyabyev S, Feith D, Lee JH, Kim SH. et al. Synthesis and in vivo fate of zwitterionic near-infrared fluorophores. Angew Chem Int Ed Engl. 2011;50:6258-63
52. Wang Y, Reder NP, Kang S, Glaser AK, Yang Q, Wall MA. et al. Raman-encoded molecular imaging (REMI) with topically applied SERS nanoparticles for intraoperative guidance of lumpectomy. Cancer Res. 2017
53. van Dam GM, Themelis G, Crane LM, Harlaar NJ, Pleijhuis RG, Kelder W. et al. Intraoperative tumor-specific fluorescence imaging in ovarian cancer by folate receptor-alpha targeting: first in-human results. Nat Med. 2011;17:1315-9
54. Stummer W, Pichlmeier U, Meinel T, Wiestler OD, Zanella F, Reulen HJ. et al. Fluorescence-guided surgery with 5-aminolevulinic acid for resection of malignant glioma: a randomised controlled multicentre phase III trial. Lancet Oncol. 2006;7:392-401
55. Wolff AC, Hammond ME, Hicks DG, Dowsett M, McShane LM, Allison KH. et al. Recommendations for human epidermal growth factor receptor 2 testing in breast cancer: American Society of Clinical Oncology/College of American Pathologists clinical practice guideline update. Arch Pathol Lab Med. 2014;138:241-56
56. Hammond ME, Hayes DF, Dowsett M, Allred DC, Hagerty KL, Badve S. et al. American Society of Clinical Oncology/College of American Pathologists guideline recommendations for immunohistochemical testing of estrogen and progesterone receptors in breast cancer. Arch Pathol Lab Med. 2010;134:907-22
57. Moran MS, Schnitt SJ, Giuliano AE, Harris JR, Khan SA, Horton J. et al. Society of Surgical Oncology-American Society for Radiation Oncology consensus guideline on margins for breast-conserving surgery with whole-breast irradiation in stages I and II invasive breast cancer. Journal of clinical oncology: official journal of the American Society of Clinical Oncology. 2014;32:1507-15
Author contact
![]() Corresponding authors: Scott C. Davis, Ph.D., Thayer School or Engineering, Dartmouth College, Hanover, NH 03755; Email: Scott.C.Davisedu; Phone: 603-646-9684 and Summer L. Gibbs, Ph.D., Oregon Health & Science University, Collaborative Life Sciences Building, 2730 SW Moody Ave, Mail Code: CL3SG, Portland, OR 97201; Email: gibbssedu; Phone: 503-494-8940
Corresponding authors: Scott C. Davis, Ph.D., Thayer School or Engineering, Dartmouth College, Hanover, NH 03755; Email: Scott.C.Davisedu; Phone: 603-646-9684 and Summer L. Gibbs, Ph.D., Oregon Health & Science University, Collaborative Life Sciences Building, 2730 SW Moody Ave, Mail Code: CL3SG, Portland, OR 97201; Email: gibbssedu; Phone: 503-494-8940