Impact Factor
- Issue 13; 2026
- Issue 12; 2026
- Issue 11; 2026
- Issue 10; 2026
- Issue 9; 2026
- Volume 16; 2026
- Advance Articles
- Past Issues
- Cover Images
- Cover Suggestion
- Index & Coverage
- Special Issues
Introduction
Materials and Methods
Results and Discussion
Conclusions
Abbreviations
Supplementary Material
Acknowledgements
References
International Journal of Biological Sciences
International Journal of Medical Sciences
 Global reach, higher impact

Theranostics 2018; 8(2):410-422. doi:10.7150/thno.22226 This issue Cite
Research Paper
Förster Resonance Energy Transfer-Based Dual-Modal Theranostic Nanoprobe for In Situ Visualization of Cancer Photothermal Therapy
Dehong Hu1, Zonghai Sheng1 ![]() , Mingting Zhu1, Xiaobing Wang1, Fei Yan1, Chengbo Liu2, Liang Song2, Ming Qian1, Xin Liu1, Hairong Zheng1
, Mingting Zhu1, Xiaobing Wang1, Fei Yan1, Chengbo Liu2, Liang Song2, Ming Qian1, Xin Liu1, Hairong Zheng1 ![]()
1. Paul C. Lauterbur Research Center for Biomedical Imaging, Institute of Biomedical and Health Engineering, Shenzhen Institutes of Advanced Technology, Chinese Academy of Sciences, Shenzhen 518055, P. R. China;
2. Research Laboratory for Biomedical Optics and Molecular Imaging, Shenzhen Key Laboratory for Molecular Imaging, Institute of Biomedical and Health Engineering, Shenzhen Institutes of Advanced Technology, Chinese Academy of Sciences, Shenzhen 518055, China.
Received 2017-8-4; Accepted 2017-9-8; Published 2018-1-1
Abstract

The visualization of the treatment process in situ could facilitate to accurately monitor cancer photothermal therapy (PTT), and dramatically decrease the risk of thermal damage to normal cells and tissues, which represents a major challenge for cancer precision therapy. Herein, we prepare theranostic nanoprobes (NPs) for Förster resonance energy transfer (FRET)-based dual-modal imaging-guided cancer PTT, and clear visualization of the therapeutic process. The FRET-based theranostic NPs exhibit high FRET efficiency (88.2%), good colloidal stability, and tumor-targeting ability. Tumor tissue and surrounding blood vessels are visualized clearly by FRET-based NIR fluorescence imaging with a high signal-to-background ratio (14.5) and photoacoustic imaging with an excellent resolution at 24 h post injection of NPs. Under the guidance of dual-modal imaging, the NPs-induced photothermal effect selectively destructs cancer cells, simultaneously decreasing the FRET efficiency and leading to fluorescence and photoacoustic signal changes. The sensitive self-feedback process enables the in situ visualization of therapeutic process and precision guidance of in vivo cancer PTT. A high therapeutic efficacy and minimum side effects are achieved in C6 tumor-bearing nude mice, holding great promise for precision therapy and cancer theranostics.
Keywords: theranostics, photothermal therapy, human serum albumin, photoacoustic imaging, Förster resonance energy transfer.
Introduction
Photothermal therapy (PTT), a promising and targeted approach against cancer, has attracted considerable research attention.[1-7] PTT employs photothermal agents to efficiently harvest laser energy and convert it into heat to selectively destruct cancer cells.[8-11] In order to monitor the treatment process, reduce the toxic side effects to normal cells and tissues, and maximize treatment efficacy, in situ visualization of the therapeutic process is of high importance for precision therapy.[12] To date, several imaging methods, including thermal imaging with infrared camera, and magnetic resonance imaging, have been widely applied for the visualization of temperature changes during the therapeutic process [13-16]. These techniques undoubtedly provide more important information for the further optimization of therapeutic protocols and improvement of treatment efficacy. However, the available technologies are highly dependent on the macroscopic temperature distribution of lesion tissue. In cancer PTT with functional nanoagents, photothermal heating is first generated at the microscale, with a slow subsequent spread of the heat. The temperature-feedback processes at the macro scale thus greatly increase the risk of damage to normal cells and tissues through heat conduction [12]. Therefore, the development of a visualization strategy remains a major challenge in situ for the sensitive monitoring of the treatment process and precise reporting of the therapeutic response, below macro scale or even micro scale.
Förster resonance energy transfer (FRET) is an energy exchange process from a donor fluorophore to an acceptor chromophore via non-radiative dipole-dipole coupling [17]. The FRET efficiency strongly depends on the distance and spectral overlap between the donor and nearby acceptor molecules [18]. Comparing with conventional fluorescence imaging techniques, FRET-based imaging has several inherent advantages, including (1) reduced crosstalk between excitation and emission light by large Stokes shifts [19], (2) high accuracy from an intrinsic reference of donor or acceptor fluorophores,[20] and (3) high contrast sensitivity due to an improved signal to background (S/B) ratio.[21] Due to these advantages, FRET-based fluorescence imaging has been applied as nanothermometers for temperature sensing in live cells [22, 23]. Recently, Ng et al. [24] reported bacteriopheophorbide-lipid (energy acceptor) doped porphysomes (energy donor) for in situ monitoring of the structural integrity of the porphysomes themselves. It is claimed that the FRET-based porphysomes are potentially able to guide optimal treatment time of PTT. However, in vivo application of FRET-based fluorescence imaging with high spatial resolution for in situ visualization of cancer PTT remains a challenge [25].
Photoacoustic (PA) imaging employs a pulsed light to excite the imaged object and an ultrasonic transducer to detect the acoustic signal.[26-31] It has high optical contrast and low ultrasonic scattering, leading to multiscale imaging capabilities of high resolution and deep penetration.[32-35] As an alternative and innovative approach, PA imaging of FRET was first reported by Wang et al.,[36-38] who achieved a better performance than fluorescence imaging of FRET, with sub-micron spatial resolution and centimeter scale of penetration depth. During the PA imaging of FRET, the PA signal of FRET pairs increases with decreasing donor fluorescence emission.[37] This opposite process offers a novel opportunity to visualize photothermal ablation using FRET-based NIR fluorescence and PA dual-modal imaging technique. Therefore, it is essential to develop theranostic nanoprobes (NPs) with an efficient energy transfer pair to assess photothermal responses and in situ visualization of cancer PTT, thus improving the therapeutic efficacy.
Herein, we demonstrate a theranostic NP with FRET-based NIR fluorescence and PA dual-modal imaging functions for the observation of cancer PTT in situ. The NP is synthesized via molecular self-assembly and chemical crosslinking method (Figure 1a). Methylene blue (MB) and indocyanine green (ICG), as donor-acceptor pairs, are inserted into the various domains of human serum albumin (HSA) matrix and further cross-linked by glutaraldehyde, leading to the formation of HSA-ICG-MB NPs. The obtained NPs possess several remarkable advantages. First, they have a robust biosafety; ICG and MB are FDA-approved dyes, and HSA is a drug delivery vehicle commonly used in the clinic [39-45]. Second, they provide precision theranostics; HSA-ICG-MB NPs possess dual-modal contrast, efficient photothermal ablation, and FRET-based self-sensing features. Therefore, they can precisely indicate the exact location and timing of HSA-ICG-MB NP delivery, as well as their treatment efficacy and response [46-48]. With the above priorities, the highly well-designed NPs are expected to be subsequently applied for cancer theranostics.
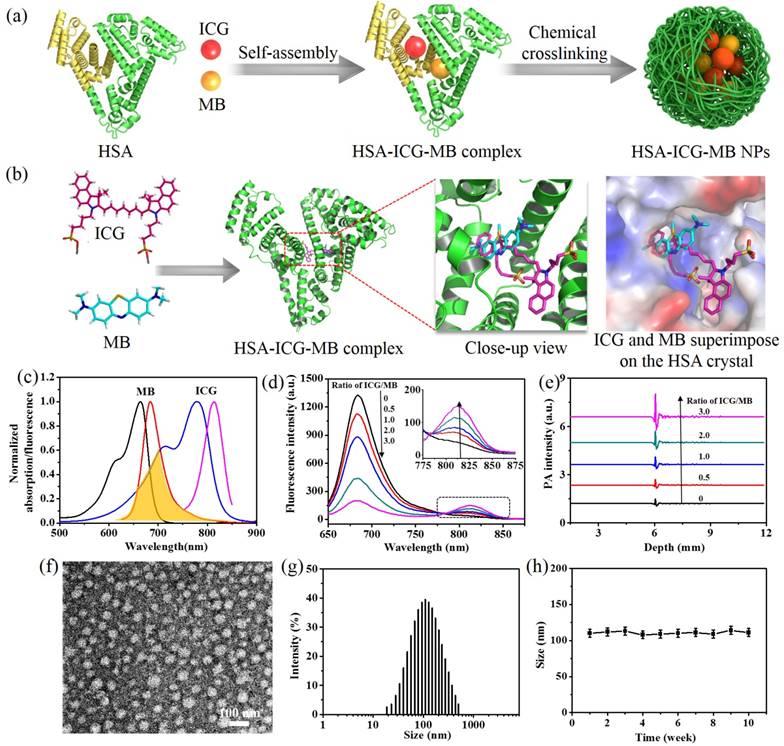
The design and characterization of HSA-ICG-MB NPs. (a) Schematic illustration of the design and preparation of NPs by molecular assembly and chemical crosslinking method. (b) Molecular modeling showing the most favored binding sites of ICG and MB within the HSA matrix. (c) The normalized absorption and fluorescence emission spectra of MB and ICG. Spectra overlay is marked as orange. (d) The fluorescence spectra and (e) PA signals of HSA-ICG-MB complex with different ICG/MB ratios. CMB = 5 µg/mL. Excitation wavelength is 600 nm. (f) TEM image of HSA-ICG-MB NPs, which are negatively stained with 2% phosphotungstic acid. (g) Size distribution of HSA-ICG-MB NPs. (h) Colloidal stability of HSA-ICG-MB NPs in PBS.
Materials and Methods
Materials
HSA, PI, dimethyl sulfoxide, MB, Calcein AM, ICG, 4,6-diamidino-2-phenylindole (DAPI) and 3-(4,5-dimethylthiazol-2-yl)-2,5-diphenyltetrazolium bromide (MTT), were purchased from Sigma Aldrich. PBS (pH 7.4), RPMI 1640 medium, fetal bovine serum, trypsin-EDTA, and penicillin-streptomycin were purchased from Gibco Life Technologies (AG, Switzerland). Ethanol and ethyl acetate were obtained from Sinopharm Chemical Reagent Co., Ltd. An NIR laser source (808 nm) was from Beijing Laserwave Optoelectronics Tech. Co., Ltd.
Characterization
The absorption and fluorescence emission spectra were performed by PerkinElmer Lambda 750 absorption spectrophotometer and fluorescence spectrophotometer (F900, Edinburgh Instruments, Ltd.), respectively. TEM imaging was carried out in a FEI Tecnai G2 F20 S-Twin (FEI, 200 kV, USA). The hydrodynamic diameter of the NPs was determined by a Malvern Zetasizer Nano ZS. In vitro PA measurements were conducted with AR-PAM system [34].
Preparation of HSA-ICG-MB NPs
In a typical synthesis, 80 mg HSA and 3.2 mg MB were firstly dissolved in 2 mL of water. Then, the solution was quickly mixed with 8 mL of ethanol (containing 12.8 mg ICG) under continuous stirring (600 rpm) at room temperature. The obtained HSA-ICG-MB complex was further crosslinked by glutaraldehyde (2%). Finally, the suspension was centrifuged at 20,000 rpm for 30 min at 4 oC to removing the organic solvents, unencapsulated dyes, and excess HSA. The pellet was then resuspended in PBS for further experiments.
Determination of FRET efficacy
The fluorescence spectra of HSA-ICG-MB complex with different ICG/MB ratios were measured with excitation wavelength at 600 nm. CHSA = 125 µg/mL, CMB = 5 µg/mL, CICG = 0, 2.5, 5, 10, 15 µg/mL. The FRET efficacy between ICG and MB in NPs is determined by comparing the changes of MB fluorescence before and after adding ICG acceptor. The quantitative equation is as follows: E = (1-Ib/Ia)×100%, where Ia is the fluorescence intensity of the MB donor in the absence of ICG acceptor, and Ib is the fluorescence in the presence of ICG acceptor.
In vitro release behavior
The release process of ICG and MB from HSA-ICG-MB NPs was investigated using a dialysis method. The prepared NP solution (0.5 mg/mL, 10 mL) was transferred into a dialysis tube (molecular weight cutoff 3500). Then, it was immersed in 50 mL of releasing solution (phosphate buffered saline, pH 7.4), and gently shaken at 37 oC at 100 rpm. At different time intervals, 1 mL of release solution was withdrawn for UV-Vis analysis, and an equal volume of fresh media was added.
In Vitro Cytotoxicity
The mouse brain endothelial cell line bEnd.3 and the C6 rat glioma cell line were cultured in RMPI 1640 cell media. Cells were first seeded into 96-well plates at a density of 1.0 × 10⁴ cells per well. These cells were then incubated with HSA-ICG-MB NPs at various concentrations (0.3, 0.6, 1.2, 2.5, 5, 10 µg/mL) in a humidified incubator at 37 oC with 5% CO2 for 24 h and 48 h respectively. The standard MTT cell viability assay was used to determine the relative cell cytotoxicity of HSA-ICG-MB NPs.
Cellular Uptake of HSA-ICG-MB NPs
For in vitro studies, C6 glioma and bEnd.3 cells (1 × 10⁵ cells) were seeded on eight-well glass-bottomed culture dishes. After 24 h, the cells were incubated for 3 h with HSA-ICG-MB NPs or free ICG at 37 oC before confocal analysis, CICG = 2.5 μg/mL. A laser scanning confocal microscope (Leica TCS SP5) was used to image the cells. Cell nuclei were stained blue with DAPI.
In Vitro Visualization of PTT
For visualization of cellular PTT, C6 glioma cells (1.0 × 10⁵ cells) were seeded on eight-well glass-bottomed culture dishes. After 24 h, the cells were incubated for 3 h with HSA-ICG-MB NPs at 37oC, CICG = 2.5 μg/mL. After being rinsed with PBS, the cells were exposed to NIR laser (808 nm, 1.0 W/cm2) for 0, 2 and 5 min. The macroscopic temperature variation of the wells was detected by thermal imaging. The photothermal responses were assessed by a laser confocal microscope with an excitation wavelength at 633 nm and emission wavelength at 640-690 nm (MB channel) and 690-760 nm (ICG channel).
To evaluate photothermal responses with PA imaging, the C6 glioma cells (100,000) were collected and embedded in agarose after photothermal treatments (808 nm, 1.0 W/cm2, 0-5 min). PA imaging was obtained with a photoacoustic computerized tomography scanner (Endra Nexus 128, Ann Arbor, MI).
In Vitro PTT
C6 glioma cells were seeded in 96-well plates and mixed with various concentrations (0, 0.07, 0.15, 0.3, 0.6, 1.2, 2.5 µg/mL) of HSA-ICG-MB NPs. After 3 h, the plates were rinsed with PBS and immersed in fresh culture medium. Then, the cells were exposed to light at 808 nm wavelength at a power density of 1.0 W/cm2 for 5 min. The standard MTT cell viability assay was used to determine relative cell viabilities.
The cell survival ratio was also studied by Calcein AM and PI co-staining. C6 glioma cells seeded in 96-well plates were mixed with HSA-ICG-MB NPs (CICG = 2.5 μg/mL). After 3 h, the plates were rinsed with PBS and immersed in fresh culture medium. Then, the cells were exposed to the 808 nm light at a power density of 1.0 W/cm2 for 5 min. After another 4 h, the cells were stained with Calcein AM and PI. The cells were then rinsed again with PBS and examined with an inverted microscope (Olympus IX71, JPN).
Animal model
BALB/c athymic nude mice (5-8 weeks old) were obtained from the Beijing Laboratory Animal Research Center. All animal experiment procedures were approved by and performed under the guidelines of the Animal Study Committee of Shenzhen Institutes of Advanced Technology, Chinese Academy of Sciences. 5 × 10⁶ C6 glioma cells were suspended and injected into the back of Balb/c nude mice. Tumor-bearing mice were used for subsequent imaging experiments and PTT when the tumor size reached ~60 mm3.
In Vivo Imaging and Biodistribution Studies
The FRET-based NIR fluorescence imaging studies were performed as the tumor size reached ~60 mm3. HSA-ICG-MB NPs (0.5 mg ICG/kg) were intravenously injected into mice (n = 3), and the fluorescence images were acquired on an IVIS fluorescence imaging system. MB channel with the excitation of 640 nm and emission of 700 nm, ICG channel with the excitation of 710 nm and emission of 800nm, and FRET channel with the excitation of 640 nm and emission of 800 nm. At 24 h post injection of NPs, all mice were euthanized, and tumors, as well as all major organs, were collected for ex vivo imaging. PA imaging in vivo was obtained with a photoacoustic computerized tomography scanner (Endra Nexus 128). ICG PA imaging channel was used with the excitation of 780 nm, and MB imaging channel was obtained with the excitation of 680 nm.
Blood Circulation
To detect the pharmacokinetics of HSA-ICG-MB NPs, the BALB/c mice were randomly divided into 8 groups (n = 5 per group). After injection of NPs, 100 μL of blood samples were drawn from mice NPs at different time points (0, 1, 2, 3, 4, 5, 10, and 24 h), and mixed with 900 μL of lysis buffer. ICG concentration was detected by fluorescence spectroscopy.
In Vivo Visualization of PTT
For in situ visualization of cancer PTT, 9 nude mice bearing C6 tumors at 24 h post injection of NPs (2 mg ICG/kg) were randomly divided into three groups. The imaging scheme is as follows: (1) Thermal imaging with an infrared thermal imaging camera (Ti27, Fluke, USA); (2) FRET-based fluorescence imaging with MB, ICG and FRET channels (IVIS fluorescence imaging system) and (3) PA imaging of FRET with excitation wavelength of 680 nm and 780 nm (Endra Nexus 128), respectively.
In Vivo PTT
For in vivo PTT, 20 mice bearing C6 glioma tumors (tumor size of ∼60 mm3) were randomly divided into four treatment groups: (1) PBS; (2) laser; (3) HSA-ICG-MB NPs (2 mg ICG/kg); and (4) HSA-ICG-MB NPs-laser (2 mg ICG/kg). The tumor sizes and body weights were recorded every 3 days. The tumor volume was calculated using the formula: length×(width)2/2. Following therapy, tumors, as well as all major organs, were collected and sectioned to 8 μm slices for H&E staining and TUNEL assay.
Toxicology Evaluation
2 and 4 mg/kg of NPs were injected into mice (n = 5). Physiological saline treated group was used as control. At 30 days post injection of NPs, the blood from treated mice was collected for blood biochemistry analysis. The major organs of the two treated groups were harvested, and the tissue slices were stained with H&E, and observed on the digital microscope.
Results and Discussion
Design and Characterization of the NPs
Due to the high affinity of ICG/MB to HSA, the two dyes were simultaneously inserted into the subdomain of HSA matrix via highly hydrophobic interactions.[49,50] Molecular docking was performed using AutoDock Vina software in order to visually reveal the binding modes of ICG/MB within HSA. The simulation results indicate that ICG and MB could selectively bind to the subdomain IIA of HSA, and the distance of the two dyes is less than 2 nm (Figure 1b). Additionally, the fluorescence emission spectrum of MB remarkably overlaps with the absorbance spectrum of ICG (Figure 1c). These features would pave the way for the development of an efficient FRET system inside the HSA matrix, where MB and ICG serve as a donor-acceptor pair. As shown in Figure 1d, when the molar ratio of ICG/MB was increased, the fluorescence intensity of the MB donor was considerably quenched, and the fluorescence intensity of the ICG acceptor at 810 nm increased gradually. The FRET efficiency improved dramatically from 0 to 86.8% with an increase in ICG/MB ratio from 0 to 3 (Figure S1). To explore the PA detection of FRET, a 600 nm laser pulse was employed to excite the MB donor, and a megahertz ultrasound transducer was used to detect acoustic signals. The PA signals of the MB donor enhanced significantly with increasing ICG/MB ratio (Figure 1e), while PA signal variations of ICG were not so obvious (Figure S2), indicating that the fluorescence quenching of MB triggers PA signal enhancement of the FRET pair. Subsequently, the HSA-ICG-MB complex with different ICG/MB ratios was further cross-linked by glutaraldehyde, resulting in the formation of HSA-ICG-MB NPs (Table S1). The maximum FRET efficacy of ICG and MB in NPs was measured to be 88.2%, which is similar to that in HSA matrix. The binding ratios of ICG and MB to HSA were measured to be 7:1 and 5:1, respectively. [51]
Transmission electron microscopy (TEM) demonstrates that the main diameter of the optimized HSA-ICG-MB NPs is 75.0 nm, illustrating their well-defined spherical morphology and homogeneous size distribution (Figure 1f). The hydrodynamic diameter of the obtained NPs is ~110.0 nm, as measured by dynamic light scattering (Figure 1g). HSA-ICG-MB NPs demonstrate excellent colloidal stability at 4°C in the dark, and there were no obvious size variations following storage over 10 weeks (Figure 1h), indicating a high colloidal stability. Moreover, the size of the NPs remained unchanged at 37°C for 24 h in PBS, indicating their excellent durability in physiological conditions (Figure S3). The release profiles in vitro of ICG and MB in NPs show a delayed release in phosphate buffered saline (PBS) (Figure S4), serum (Figure S5) and medium solution (Figure S6), demonstrating the strong binding force between ICG/MB and HSA.
Monitoring of the Photothermal Effect of NPs
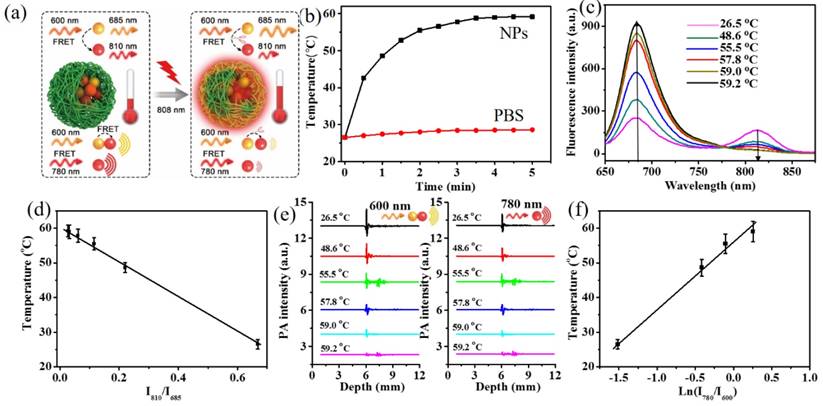
The photothermal effect of HSA-ICG-MB NPs was monitored with FRET-based fluorescence and PA techniques (Figure 2a). Upon NIR laser irradiation (808 nm, 1.0 W/cm2, 5 min), the temperature of the HSA-ICG-MB NPs quickly increased from 26.5oC to 59.2oC, while there was a slight rise from 26.5oC to 28.6oC in the PBS group (Figure 2b). This demonstrates that HSA-ICG-MB NPs are efficient photothermal transducers to produce significant hyperthermia (>42oC).[52] During photothermal heating, the ICG molecules in NPs gradually decompose [53, 54], and their FRET efficiency accordingly decreases, resulting in changes in the fluorescence and PA signals of the donor-acceptor pair. It was observed that with increasing temperature, the fluorescence intensity of ICG (centered at 810 nm) decreased, while MB emission (centered at 685 nm) enhanced correspondingly (Figure 2c). Moreover, the fluorescence intensity ratio of MB to ICG showed a linear relationship with the photothermal temperature from 26.5 oC to 59.2 oC (Figure 2d). The linear equation can be expressed as y = -51.43x + 60.736 (R² = 0.9985), x is the fluorescence intensity ratio (I810/I685) and the detection limit was 0.5 oC (S/N = 3), thus indicating a high sensitivity.[55] Furthermore, the PA signal of the FRET pair simultaneously declined with increasing photothermal temperature (Figure 2e). The temperature plotted against ln(I780/I600) indicates a linear relationship in the detection range from 26.5oC to 59.2oC, with a sensitivity of 0.7 oC (S/N = 3) (Figure 2f). These results demonstrate that the prepared HSA-ICG-MB NPs can efficiently produce hyperthermia with simultaneous sensitive monitoring of the photothermal effect, which lays an important foundation for visualization of cancer PTT.
FRET-based fluorescence and PA techniques for monitoring the photothermal effect of HSA-ICG-MB NPs. (a) Scheme showing the changes of FRET-based fluorescence and PA signals during photothermal heating. (b) Time-dependent temperature elevation of HSA-ICG-MB NPs and PBS upon laser irradiation (808 nm, 1.0 W/cm2, CICG = 0.2 mg/mL). Excitation wavelength is 600 nm. (c) The fluorescence spectra of the HSA-ICG-MB NPs at different photothermal temperatures. (d) A plot of fluorescence intensity ratio (I810/I685) versus temperature to calibrate the thermometric scale for HSA-ICG-MB NPs. (e) The PA signals of MB (600 nm) and ICG (780 nm) channels at different photothermal temperatures. (f) A plot of PA signal ratio (I780/I600) versus photothermal temperature.
FRET-based In Vitro Visualization of PTT
The cell internalization of HSA-ICG-MB NPs in C6 glioma cells and bEnd.3 endothelial cells was assessed through confocal fluorescence microscopy (Figure 3a). The NPs exhibit low cytotoxicity for bEnd.3 cells and C6 cells (Figure S7). After 3 h incubation, a considerable amount of NPs entered the cytoplasm of C6 glioma cells, exhibiting strong red fluorescence with an excitation wavelength at 633 nm and emission wavelength at 690-760 nm (ICG channel). In contrast, a minimal amount of free ICG was observed in C6 glioma cells. This indicates that HSA, as a delivery vehicle, enhances the cellular uptake of NPs.[56,57] When the NPs were incubated with bEnd.3 endothelial cells, only a low fluorescence signal was observed, demonstrating the outstanding tumor-targeting ability of NPs.[53] A possible reason is the presence of overexpressed albumin-binding proteins, such as SPARC (secreted protein, acidic and rich in cysteine) and gp60, in glioma cells. The HSA-ICG-MB NPs binding with these receptors enhanced the cell uptake efficacy of the NPs. [58]
Cellular uptake and therapeutic visualization. (a) Confocal fluorescence images of C6 and bEnd.3 subcellular localization of free ICG and HSA-ICG-MB NPs after 3 h incubation, CICG = 2.5 μg/mL. Blue represents fluorescence of DAPI, and red represents fluorescence of ICG. (b) Confocal fluorescence images of C6 glioma cells upon NIR laser irradiation (808 nm, 1.0 W/cm2, CICG = 2.5 μg/mL). Green, red and blue represent fluorescence of MB, ICG and DAPI, respectively. (c) PA images of phantoms containing C6 glioma cells with photothermal treatments with different times (cell number = 100,000). Green and red represent PA signal of MB and ICG channels, respectively. (d) Fluorescence images of C6 glioma cells after photothermal treatment. Viable cells are stained green with calcein-AM, and the dead/later apoptotic cells are stained red with PI, CICG = 2.5 μg/mL. (e) Quantitative detection of C6 glioma cell viability following PTT. The data are shown as mean ± SD (n = 3).
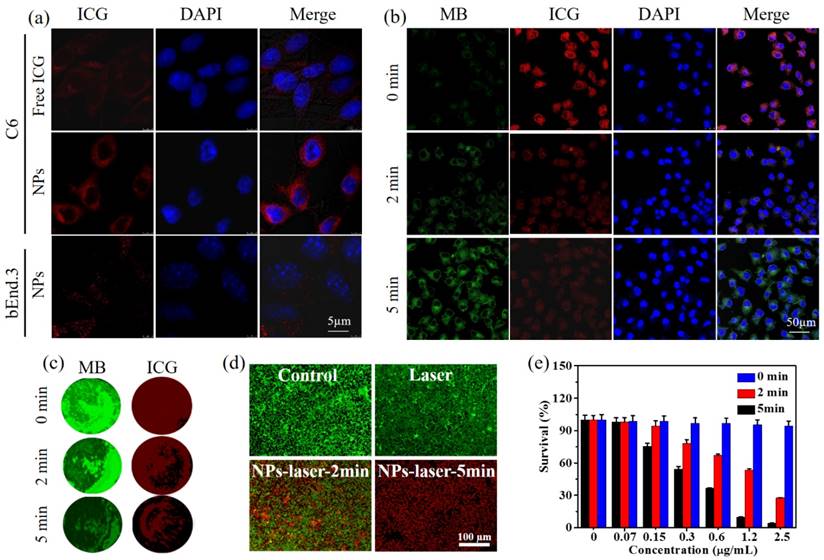
Under 808 nm laser irradiation (1.0 W/cm2, 0-5 min), the temperature of C6 glioma cells incubated with NPs increased from 37.0 oC to 55.2 oC (Figure S8), while laser-treated groups generated almost negligible temperature variation, indicating that the endocytic NPs can efficiently convert light energy to local hyperthermia (> 42.0 oC) for ablation of cancer cells. During the process, the fluorescence signal from MB gradually rose, and the fluorescence emission from ICG decreased monotonically with prolonged irradiation time from 0 to 5 min (Figure 3b). These changes stem from photothermal decomposition of ICG in NPs,[54] decreasing the FRET efficiency. Therefore, FRET-based dual-channel fluorescence imaging can be applied for clear visualization of the cellular therapeutic responses. In addition, to evaluate the PA imaging of FRET in cells, C6 glioma cells (100,000) were collected and embedded in agarose after photothermal treatment (808 nm, 1.0 W/cm2, 0-5 min). PA images of biological phantoms containing C6 glioma cells show that the signals from MB and ICG channels declined with increasing irradiation time (Figure 3c), revealing the potential of PA imaging of FRET at cellular levels. Therefore, the HSA-ICG-MB NPs with good tumor-targeting ability can be applied in the dual-modal visualization of cellular PTT.
In order to qualitatively assess the treatment efficiency, calcein-AM with green fluorescence and propidium iodide (PI) with red fluorescence were used to evaluate live and dead/late apoptotic cells, respectively. The control and laser-treated groups showed a green fluorescence (Figure 3d), indicating that either pure laser irradiation or only NPs is not able to destroy cancer cells. The NP-laser treated group demonstrated a time-dependent treatment process. After 5 min irradiation (808 nm, 1.0 W/cm2), most of the C6 glioma cells were killed, exhibiting an intense red fluorescence. The quantitative results further demonstrate that the NP-mediated PTT efficacy is dependent on NP concentration and irradiation time (Figure 3e). The optimal PTT (2.5 µg/mL, 5 min) was able to induce cell death up to 94.8%, showing high therapeutic efficacy.
In Vivo Dual-Modal Imaging
The feasibility of HSA-ICG-MB NPs for fluorescence and PA dual-modal imaging was investigated in C6 tumor-bearing mice with a tumor volume of ~60 mm3. Under an excitation wavelength of 640 nm and an emission wavelength of 700 nm (MB channel), the tumor site could not be clearly visualized at 24 h post injection due to the high background fluorescence of mice (S/B = 3.7) (Figure 4a). With a red-shift of the emission wavelength from 700 nm to 810 nm, the background fluorescence signal obviously decreased, and the fluorescence intensity in tumor tissue increased gradually over time, reaching a peak at 24 h post injection of the NPs (ICG channel, S/B = 7.6). These results suggest that fluorescence imaging in vivo with a longer emission window is able to significantly reduce the background signal and improve the S/B ratio. At an excitation wavelength of 640 nm and emission wavelength of 800 nm, the fluorescence imaging of FRET is obtained (FRET channel). The tumor could be clearly observed, showing a higher S/B ratio (14.5) than that of MB channel (3.7) and ICG channel (7.6) at 24 h post injection (Figure 4a,c). Therefore, the fluorescence imaging of FRET in vivo with a large Stokes shift and longer emission wavelength inhibits the crosstalk between the excitation and the emission light, decreases the background fluorescence, and improves the S/B ratio, revealing the great potential to clearly visualize cancer PTT. The ex vivo images of major organs and tumor tissue show a large accumulation of NPs in the liver and tumor (Figure 4d and Figure S9), and a small accumulation of ICG molecules released from HSA-ICG-MB NPs in the kidneys, suggesting a general metabolic pathway and high tumor accumulation of NPs. The pharmacokinetic analysis indicates that the blood circulation half-life of NPs is 3.4±0.4 h (Figure S10), revealing the long blood circulation time of HSA-ICG-MB NPs.
In vivo fluorescence and PA dual-modal imaging of nude mice bearing C6 glioma tumors after intravenous injection of HSA-ICG-MB NPs. (a) In vivo fluorescence imaging at different signal channels and time intervals. MB channel with the excitation of 640 nm and emission of 700 nm, ICG channel with the excitation of 710 nm and emission of 800 nm, and FRET channel with the excitation of 640 nm and emission of 800 nm, CICG = 0.5 mg/kg. The black circles point out the tumor sites. (b) PA imaging of the nude mice bearing C6 glioma tumors injected with HSA-ICG-MB NPs at pre, 3, 6, and 24 h post injection, respectively, CICG = 0.5 mg/kg. (c) The fluorescence S/B ratios of different channels. (d) Biodistribution of HSA-ICG-MB NPs in mice determined by mean fluorescence intensity. (e) The mean PA intensity of tumor tissue at pre, 3, 6, and 24 h post injection, respectively. The data are shown as mean ±SD (n = 3).
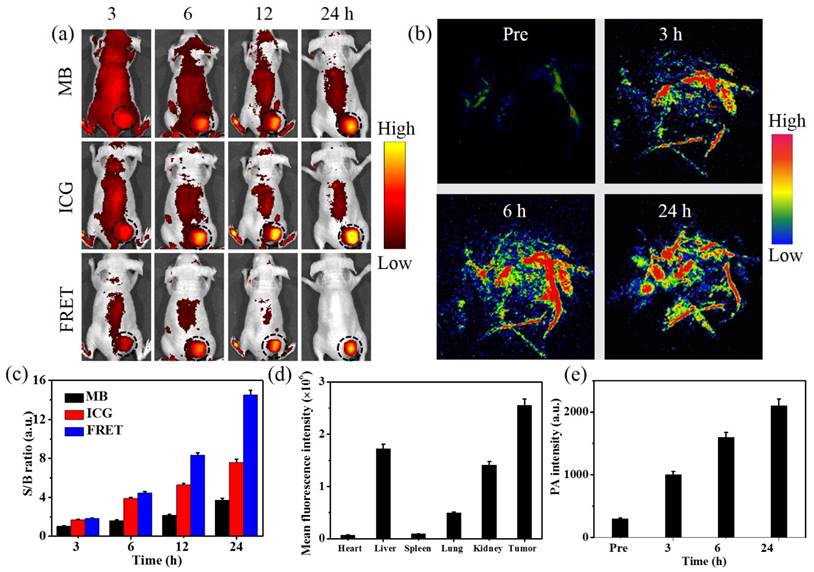
Comparing with fluorescence imaging, PA imaging, as a hybrid modality, could provide a deep imaging depth with high resolution, which is highly useful in the visualization of intratumoral accumulation and distribution of NPs.[59] To avoid the effect of endogenous hemoglobin with high PA contrast (680 nm excitation), in vivo PA imaging of tumor-bearing nude mice was performed with 780 nm plus laser as an excitation wavelength. As shown in Figure 4b, a low PA background signal from endogenous hemoglobin in blood vessels was observed prior to intravenous injection of NPs. At 3 h post injection of NPs, tumor blood vessels become brighter due to the presence of the NPs. With the prolongation of injection time, the PA signal in tumor blood vessels further increased, meanwhile, the surrounding tumor tissue was also clearly observed. This demonstrates that the NPs can easily enter the tumor by diffusion through the disrupted tumor blood vessels due to the enhanced permeability and retention effect and active targeting ability.[58,60,61] Quantitative analysis shows that the PA signal in the tumor area increased steadily over time, reaching a maximum value at 24 h post injection (Figure 4e). Thus, FRET-based fluorescence imaging with high S/B ratio provides a clear process of NP accumulation in tumor, while PA imaging with long excitation wavelength indicates the morphology of intratumoral blood vessels and the dynamic process of NPs entering the tumor, revealing great potential for guiding cancer PTT.
FRET-based In Vivo Visualization of Cancer PTT
The feasibility of FRET-based imaging for in situ visualization of cancer PTT with HSA-ICG-MB NPs was investigated in subcutaneous C6 tumor-bearing mice (Figure 5a, b). Under the guidance of fluorescence and PA dual-modal imaging, the NIR laser (808 nm, 0.8 W/cm2) was precisely focused on the tumor region, and the macroscopic temperature variation in mice was detected by thermal imaging at 24 h post injection of NPs (Figure S11). The tumor treated with laser irradiation showed a moderate increase to 40.2 oC, while the temperature of tumors in the NP-laser-treated group increased rapidly to 56.2 oC (Figure 5c), indirectly revealing a high tumor accumulation and an efficient photothermal conversion of the NPs. To assess the photothermal effect at the microscale, FRET-based in vivo fluorescence and PA dual-modal imaging were performed. As shown in Figure 5a, with increasing photothermal temperature, the fluorescence signal from the MB channel steadily increased in the tumor region. In contrast, the fluorescence intensity of the ICG channel gradually decreased, revealing FRET-based efficient self-feedback capability of HSA-ICG-MB NPs. Moreover, when the FRET-based detection window was applied, the fluorescence signal from the laser irradiated tumor site gradually decreased and almost disappeared after 5 min (Figure 5a). The S/B ratios in the FRET channel were much higher than that of the ICG and MB channels at different time intervals (Figure 5d), indicating a high sensitivity of FRET fluorescence imaging for in situ visualization of cancer PTT.
In vivo FRET-based NIR fluorescence and PA dual-modal imaging for in situ visualization of cancer PTT. (a) Fluorescence and (b) PA imaging of nude mice bearing C6 glioma tumors during PTT at 24 h post injection of HSA-ICG-MB NPs, CICG = 2 mg/kg. The black circles point out the tumor sites. (c) Time-dependent heat generation of tumor tissue upon NIR laser irradiation (808 nm, 0.8 W/cm2). (d) A plot of S/B ratio in the tumor region versus laser irradiation time. (e) The dual-channel mean PA intensity of tumor tissue at 0 and 5 min NIR laser irradiation. The data are shown as mean ±SD (n=3).
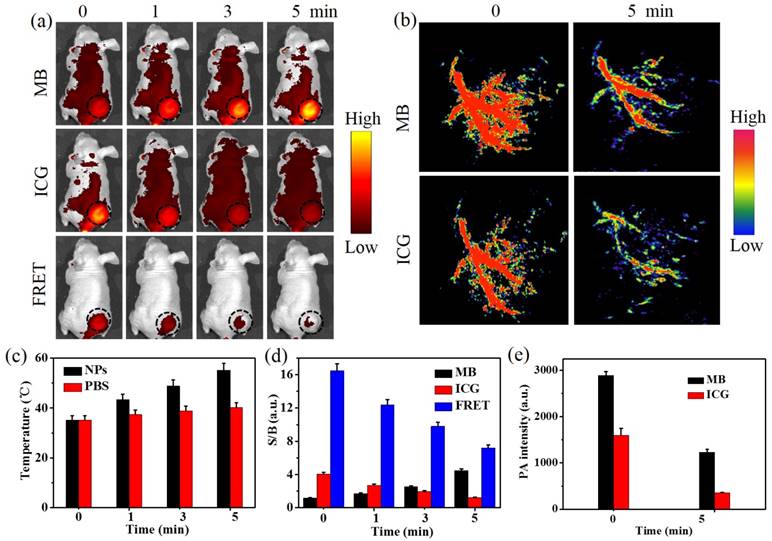
Meanwhile, PA imaging in vivo was employed to monitor the treatment process. 680 nm (MB channel) and 780 nm (ICG channel) pulsed lasers were applied to excite the FRET pair of MB and ICG, respectively (Figure 5b). In the ICG channel, the dendritic intratumoral vessels became indistinct after a photothermal treatment duration of 5 min, further demonstrating that ICG dye in NPs gradually degrades in the tumor region. Thus, the PA signal in the MB channel at the tumor site also decreased, which is in good agreement with the results in vitro. Quantitative results show that the average PA intensity of ICG and MB channels reduced by 78.2% and 57.5% (Figure 5e). This demonstrates that the application of FRET-based self-feedback HSA-ICG-MB NPs for PA imaging of PTT is feasible in tumor-bearing nude mice, which provides a novel imaging modality for in situ visualization of intratumoral changes during photothermal treatment. In future studies, a highly integrated system with imaging, therapy and monitoring features will be designed and set-up for the quantitative the feed-back of temperature in vivo.
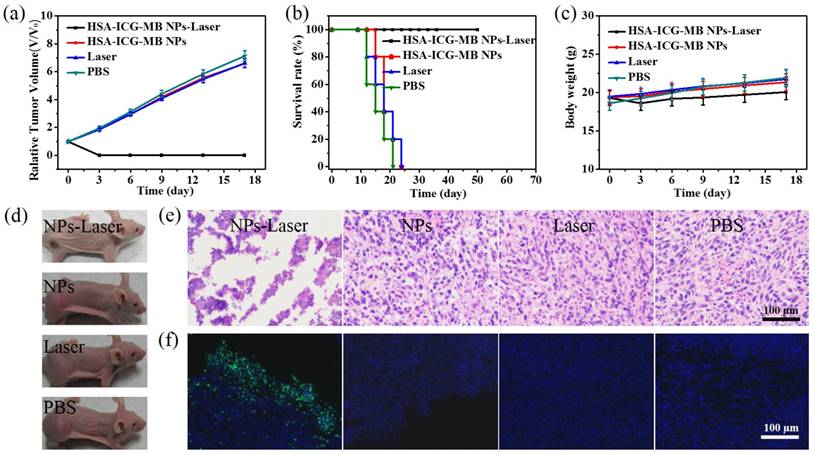
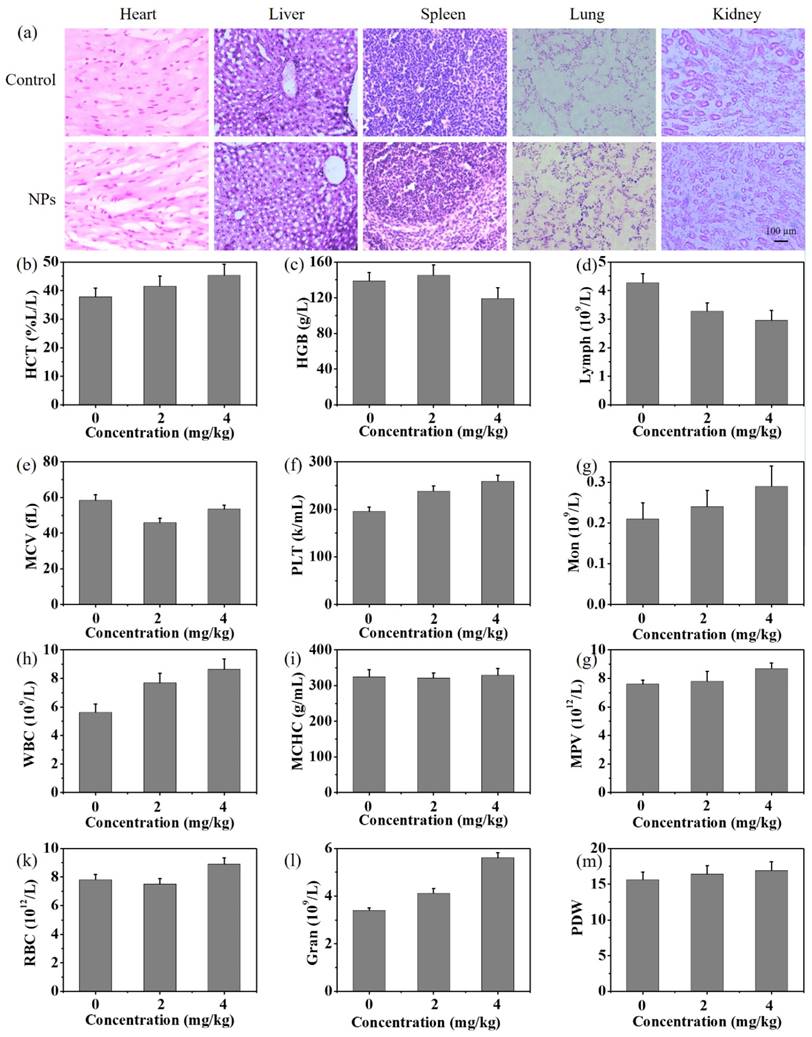
Under the guidance of FRET-based dual-modal imaging, optimized therapeutic protocols with HSA-ICG-MB NPs were conducted for cancer PTT. The tumor region in C6 tumor-bearing nude mice were treated with NIR laser irradiation for 5 min (808 nm, 0.8 W/cm2). The antitumor efficiency was verified by analysis of tumor growth and survival rates of mice (Figure 6a,b). The PBS-, laser-, and NP-treated groups exhibited rapid tumor growth, suggesting that C6 brain tumor growth is not influenced by single NP treatment and pure laser irradiation (Figure 6d, Figure S12). The survival rate was nearly 0% on day 25 post treatment for all three groups. The NPs-laser-treated group exhibited a significant tumor growth suppression, with a 100% survival rate on day 50 and no tumor recurrence. According to hematoxylin and eosin (H&E) staining and TUNEL assay, there was no obvious tumor necrosis observed in PBS-, NP-, and laser-treated groups. In contrast, abundant karyolysis and sporadic necrosis was observed in the NPs-laser-treated group, indicating the typical features of thermal damage (Figure 6e, f). During the treatments, there was almost no obvious change in body weight for C6 tumor-bearing nude mice (Figure 6c). H&E staining images of the major organs, including heart, liver, spleen, lung, and kidney, show negligible damage or inflammation, demonstrating minimal side effects of HSA-ICG-MB NP (Figure 7a). The routine blood analysis illustrates that there were no significant changes in blood panel parameters in the control group and NP-treated group (Figure 7b-m), suggesting low toxicity of NPs under the experimental conditions.
In vivo cancer PTT in xenograft nude mice models with C6 glioma. (a) Tumor growth curves and (b) survival rates of nude mice bearing C6 glioma tumors after different treatments. (c) Body weights of tumor-bearing nude mice with different treatments during the 17 day evaluation period. (d) Representative photos of mice with different treatments. (e) H&E stained images and (f) TUNEL assay of tumor sections collected from different treatment groups 4 h post treatment. Apoptotic cells are labeled with green fluorescence. Blue represents fluorescence of DAPI.
In vivo toxicology studies. (a) H&E staining images of major organs collected from control group and NP-treated group at 30 days post injection of physiological saline and NPs (4 mg/kg). (b-m) Blood analysis of mice 30 days after injection of PBS and NPs with two different doses: (b) hematocrit (HCT), (c) hemoglobin concentration (HGB), (d) lymphocytes (Lymph), (e) mean corpuscular volume (MCV), (f) platelets (PLT), (g) monocyte (Mon), (h) number of white blood cells (WBC), (i) mean corpuscular hemoglobin concentration (MCHC), (g) mean platelet volume (MPV), (k) number of red blood cells (RBC), (l) number of neutrophilic granulocytes (Gran), and (m) platelet distribution width (PDW).
Conclusions
In conclusion, HSA-ICG-MB NPs have been successfully developed for in vivo fluorescence and PA dual-modal imaging, and in situ visualization of therapeutic process based on the FRET mechanism. The unique features of the theranostic NPs include (1) molecular self-assembly and chemical crosslinking method for the controllable preparation of NPs with FDA-approved materials, (2) FRET-based in vivo NIR fluorescence imaging with a high S/B ratio and PA imaging with excellent resolution, and (3) FRET-based in situ visualization of treatment process for precision guidance of cancer PTT. In brief, this study presents a prospective NP system with FRET capability for cancer theranostics. The highly integrated NPs would be expected to facilitate the development of theranostic nanomedicine, holding a great promise for precision therapy and further applications.
Abbreviations
PTT: photothermal therapy; NPs: nanoprobes; FRET: Förster resonance energy transfer; PA: photoacoustic; MB: Methylene blue; ICG: indocyanine green; HSA: human serum albumin; DAPI: 4,6-diamidino-2-phenylindole; MTT: 3-(4,5-dimethylthiazol-2-yl)-2,5-diphenyltetrazolium bromide; TEM: Transmission electron microscopy; PBS: phosphate buffered saline; H&E: hematoxylin and eosin.
Supplementary Material
The FRET efficacy, PA signal, size changes, in vitro release profile, cell viabilities and pharmacokinetics curve of HSA-ICG-MB NPs, ex vivo fluorescence images, infrared thermal images and photographs of mice were shown in Figures S1-S10 and Table S1.
Acknowledgements
The authors gratefully acknowledge support for this research from the Major State Basic Research Development Program of China (973 Program) (2015CB755500), Natural Science Foundation of China (81527901, 81401521, 81571745, 81771906, 11574342), Key Laboratory for Magnetic Resonance and Multimodality Imaging of Guangdong Province (2014B030301013), the Science and Technology Innovation Fund of Shenzhen (JCYJ20170307164159155, JCYJ20150401145529015, JCYJ20160229200902680, JCYJ20160531175040976 and JCYJ20150521144321005), and Guangdong Natural Science Foundation grant (2014B050505013).
Competing Interests
The authors have declared that no competing interest exists.
References
1. Huang X, El-Sayed IH, Qian W, El-Sayed MA. Cancer cell imaging and photothermal therapy in the near-infrared region by using gold nanorods. J Am Chem Soc. 2006;128:2115-2120
2. Yang Z, Song J, Dai Y, Chen J, Wang F, Lin L. et al. Self-assembly of semiconducting-plasmonic gold nanoparticles with enhanced optical property for photoacoustic imaging and photothermal therapy. Theranostics. 2017;7:2177-2185
3. Lal S, Clare SE, Halas NJ. Nanoshell-enhanced photothermal cancer therapy: impending clinical impact. Acc Chem Res. 2008;41:1842-1851
4. Hu D, Zhang J, Gao G, Sheng Z, Cui H, Cai L. Indocyanine green-loaded polydopamine-reduced graphene oxide nanocomposites with amplifying photoacoustic and photothermal effects for cancer theranostics. Theranostics. 2016;6:1043-1052
5. Zhao N, Li J, Zhou Y, Hu Y, Wang R, Ji Z. et al. Hierarchical nanohybrids of gold nanorods and PGMA-based polycations for multifunctional theranostics. Adv. Fun. Mater. 2016;26:5848-5861
6. Song L, Zhao N, Xu FJ, Hydroxyl-rich polycation brushed multifunctional rare-earth-gold core-shell nanorods for versatile therapy platforms. Adv. Fun. Mater. 2017;27:DOI 10.1002/adfm.201701255
7. Zhang Z, Wang L, Wang J, Jiang X, Li X, Hu Z. et al. Mesoporous silica-coated gold nanorods as a light-mediated multifunctional theranostic platform for cancer treatment. Adv. Mater. 2012;24:1418-1423
8. Yang T, Tang Y, Liu L, Lv X, Wang Q, Ke H. et al. Size-dependent Ag2S nanodots for second near-infrared fluorescence/photoacoustics imaging and simultaneous photothermal therapy. ACS Nano. 2017;11:1848-1857
9. Yan F, Duan W, Li Y, Wu H, Zhou Y, Pan M. et al. NIR-laser-controlled drug release from DOX/IR-780-loaded temperature-sensitive-liposomes for chemo-photothermal synergistic tumor therapy. Theranostics. 2016;6:2337-2351
10. Liu J, Zheng X, Yan L, Zhou L, Tian G, Yin W. et al. Bismuth sulfide nanorods as a precision nanomedicine for In Vivo multimodal imaging-guided photothermal therapy of tumor. ACS Nano. 2015;9:696-707
11. Zhao H, Chao Y, Liu J, Huang J, Pan J, Guo W. et al. Polydopamine coated single-walled carbon nanotubes as a versatile platform with radionuclide labeling for multimodal tumor imaging and therapy. Theranostics. 2016;6:1833-1843
12. Zhu X, Feng W, Chang J, Tan YW, Li J, Chen M. et al. Temperature-feedback upconversion nanocomposite for accurate photothermal therapy at facile temperature. Nat Commun. 2016;7:10437
13. Robinson JT, Tabakman SM, Liang Y, Wang H, Casalongue HS, Vinh D. et al. Ultrasmall reduced graphene oxide with high near-infrared absorbance for photothermal therapy. J Am Chem Soc. 2011;133:6825-6831
14. Hirsch LR, Stafford RJ, Bankson JA, Sershen SR, Rivera B, Price RE. et al. Nanoshell-mediated near-infrared thermal therapy of tumours under magnetic resonance guidance. Proc Natl Acad Sci U S A. 2003;100:13549-13554
15. Yang K, Zhang S, Zhang G, Sun X, Lee ST, Liu Z. Graphene in mice: ultrahigh in vivo tumor uptake and efficient photothermal therapy. Nano Lett. 2010;10:3318-3323
16. Seo WS, Lee JH, Sun X, Suzuki Y, Mann D, Liu Z. et al. FeCo/graphitic-shell nanocrystals as advanced magnetic-resonance-imaging and near-infrared agents. Nat Mater. 2006;5:971-976
17. Ye F, Wu C, Jin Y, Chan YH, Zhang X, Chiu DT. Ratiometric temperature sensing with semiconducting polymer dots. J Am Chem Soc. 2011;133:8146-8149
18. Jares-Erijman EA, Jovin TM. FRET imaging. Nat Biotechnol. 2003;21:1387-1395
19. Wagh A, Qian SY, Law B. Development of biocompatible polymeric nanoparticles for in vivo NIR and FRET imaging. Bioconjug Chem. 2012;23:981-992
20. Gravier J, Sancey L, Hirsjärvi S, Rustique E, Passirani C, Benoît JP. et al. FRET imaging approaches for in vitro and in vivo characterization of synthetic lipid nanoparticles. Mol Pharm. 2014;11:3133-3144
21. He X, Wang Y, Wang K, Chen M, Chen S. Fluorescence resonance energy transfer mediated large stokes shifting near-infrared fluorescent silica nanoparticles for in vivo small-animal imaging. Anal Chem. 2012;84:9056-9064
22. Shang L, Stockmar F, Azadfar N, Nienhaus GU. Intracellular thermometry by using fluorescent gold nanoclusters. Angew Chem Int Edit. 2013;52:11154-11157
23. Albers AE, Chan EM, McBride PM, Ajo-Franklin CM, Cohen BE, Helms BA. Dual-emitting quantum dot/quantum rod-based nanothermometers with enhanced response and sensitivity in live cells. J Am Chem Soc. 2012;134:9565-9568
24. Ng KK, Takada M, Jin CC, Zheng G. Self-sensing porphysomes for fluorescence-guided photothermal therapy. Bioconjug Chem. 2015;26:345-351
25. Zhao Y, van Rooy I, Hak S, Fay F, Tang J, Davies Cde L. et al. Near-infrared fluorescence energy transfer imaging of nanoparticle accumulation and dissociation kinetics in tumor-bearing mice. ACS Nano. 2013;7:10362-10370
26. Wang LV, Hu S. Photoacoustic tomography: in vivo imaging from organelles to organs. Science. 2012;335:1458-1462
27. Ntziachristos V, Razansky D. Molecular imaging by means of multispectral optoacoustic tomography (MSOT). Chem Rev. 2010;110:2783-2794
28. Pu K, Shuhendler AJ, Jokerst JV, Mei J, Gambhir SS, Bao Z. et al. Semiconducting polymer nanoparticles as photoacoustic molecular imaging probes in living mice. Nat Nanotechnol. 2014;9:233-239
29. Yin C, Zhen X, Zhao H, Tang Y, Ji Y, Lyu Y. et al. Amphiphilic semiconducting oligomer for near-infrared photoacoustic and fluorescence imaging. ACS Appl Mater Interfaces. 2017;9:12332-12339
30. Jiang Y, Pu K. Advanced photoacoustic imaging applications of near-infrared absorbing organic nanoparticles. Small. 2017;13:DOI 10.1002/smll.201700710
31. Zhang J, Zhen X, Upputuri PK, Pramanik M, Chen P, Pu K. Advanced photoacoustic imaging applications of near-infrared absorbing organic nanoparticles. Adv. Mater. 2017;13:DOI 10.1002/smll.201700710
32. Lyu Y, Zhen X, Miao Y, Pu K. Reaction-based semiconducting polymer nanoprobes for photoacoustic imaging of protein sulfenic acids. ACS Nano. 2017;11:358-367
33. Miao Q, Lyu Y, Ding D, Pu K. Semiconducting oligomer nanoparticles as an activatable photoacoustic probe with amplified brightness for in vivo imaging of pH. Adv Mater. 2016;28:3662-3668
34. Chen J, Liu C, Hu D, Wang F, Wu H, Gong X. et al. Single-layer MoS2 nanosheets with amplified photoacoustic effect for highly sensitive photoacoustic imaging of orthotopic brain tumors. Adv Fun Mater. 2016;26:8715-8725
35. Sheng Z, Song L, Zheng J, Hu D, He M, Zheng M. et al. Protein-assisted fabrication of nano-reduced graphene oxide for combined in vivo photoacoustic imaging and photothermal therapy. Biomaterials. 2013;34:5236-5243
36. Wang Y, Xia J, Wang LV. Deep-tissue photoacoustic tomography of Förster resonance energy transfer. J Biomed Opt. 2013;18:101316
37. Wang Y, Wang LV. Förster resonance energy transfer photoacoustic microscopy. J Biomed Opt. 2012;17:086007
38. Gao L, Zhang C, Li C, Wang LV. Intracellular temperature mapping with fluorescence-assisted photoacoustic-thermometry. Appl Phys Lett. 2013;102:193705
39. Chen Q, Liu Z. Albumin carriers for cancer theranostics: a conventional platform with new promise. Adv Mater. 2016;28:10557-10566
40. Chen Q, Liang C, Wang C, Liu Z. An imagable and photothermal “abraxane-like” nanodrug for combination cancer therapy to treat subcutaneous and metastatic breast tumors. Adv Mater. 2015;27:903-910
41. Chen Q, Wang X, Wang C, Feng L, Li Y, Liu Z. Drug-induced self-assembly of modified albumins as nano-theranostics for tumor-targeted combination therapy. ACS Nano. 2015;9:5223-5233
42. He X, Wu X, Wang K, Shi B, Hai L. Methylene blue-encapsulated phosphonate-terminated silica nanoparticles for simultaneous in vivo imaging and photodynamic therapy. Biomaterials. 2009;30:5601-5609
43. Tardivo JP, Del Giglio A, de Oliveira CS, Gabrielli DS, Junqueira HC, Tada DB. et al. Methylene blue in photodynamic therapy: from basic mechanisms to clinical applications. Photodiagnosis Photodyn Ther. 2005;2:175-191
44. Huang P, Gao Y, Lin J, Hu H, Liao HS, Yan X. et al. Tumor-specific formation of enzyme-instructed supramolecular self-assemblies as cancer theranostics. ACS Nano. 2015;9:9517-9527
45. Hu D, Sheng Z, Gao G, Siu F, Liu C, Wan Q. et al. Activatable albumin-photosensitizer nanoassemblies for triple-modal imaging and thermal-modulated photodynamic therapy of cancer. Biomaterials. 2016;93:10-19
46. Yan F, Wu H, Liu H, Deng Z, Liu H, Duan W. et al. Molecular imaging-guided photothermal/photodynamic therapy against tumor by iRGD-modified indocyanine green nanoparticles. J Control Release. 2016;224:217-228
47. Hannah A, Luke G, Wilson K, Homan K, Emelianov S. Indocyanine green-loaded photoacoustic nanodroplets: dual contrast nanoconstructs for enhanced photoacoustic and ultrasound imaging. ACS Nano. 2014;8:250-259
48. Jing L, Shi J, Fan D, Li Y, Liu R, Dai Z. et al. (177)Lu-labeled cerasomes encapsulating indocyanine green for cancer theranostics. ACS Appl Mater Interfaces. 2015;7:22095-22105
49. He LL, Wang YX, Wu XX, Liu XP, Wang X, Liu B. et al. Enhancement of the binding affinity of methylene blue to site I in human serum albumin by cupric and ferric ions. Luminescence. 2015;30:1380-1388
50. Nairat M, Konar A, Kaniecki M, Lozovoy VV, Dantus M. Investigating the role of human serum albumin protein pocket on the excited state dynamics of indocyanine green using shaped femtosecond laser pulses. Phys Chem Chem Phys. 2015;17:5872-5877
51. Ha T, Enderle T, Ogletree DF, Chemla DS, Selvin PR, Weiss S. Probing the interaction between two single molecules: fluorescence resonance energy transfer between a single donor and a single acceptor. Proc Natl Acad Sci U S A. 1996;93:6264-6268
52. Sheng Z, Hu D, Xue M, He M, Gong P, Cai L. Indocyanine green nanoparticles for theranostics applications. Nano-Micro Lett. 2013;5:145-150
53. Sheng Z, Hu D, Zheng M, Zhao P, Liu H, Gao D. et al. Smart human serum albumin-indocyanine green nanoparticles generated by programmed assembly for dual-modal imaging-guided cancer synergistic phototherapy. ACS Nano. 2014;8:12310-12322
54. Chen J, Sheng Z, Li P, Wu M, Zhang N, Yu XF. et al. Indocyanine green-loaded gold nanostars for sensitive SERS imaging and subcellular monitoring of photothermal therapy. Nanoscale. 2017;9:11888-11901
55. Brites CD, Lima PP, Silva NJ, Millán A, Amaral VS, Palacio F. et al. Thermometry at the nanoscale. Nanoscale. 2012;4:4799-4829
56. Elzoghby AO, Samy WM, Elgindy NA. Albumin-based nanoparticles aspotential controlled release drug delivery systems. J Control Release. 2012;157:168-182
57. Elsadek B, Kratz F. Impact of albumin on drug delivery-new applications on the horizon. J Control Release. 2012;157:4-28
58. Lin T, Zhao P, Jiang Y, Tang Y, Jin H, Pan Z. et al. Blood-brain-barrier-penetrating albumin nanoparticles for biomimetic drug delivery via albumin-binding protein pathways for antiglioma therapy. ACS Nano. 2016;10:9999-10012
59. Kim C, Favazza C, Wang LV. In vivo photoacoustic tomography of chemicals: high-resolution functional and molecular optical imaging at new depths. Chem Rev. 2010;110:2756-2782
60. Chen Q, Liu X, Chen J, Zeng J, Cheng Z, Liu Z. A Self-assembled albumin-based nanoprobe for in vivo ratiometric photoacoustic pH imaging. Adv Mater. 2015;27:6820-6827
61. Song X, Feng L, Liang C, Yang K, Liu Z. Ultrasound triggered tumor oxygenation with oxygen-shuttle nanoperfluorocarbon to overcome hypoxia-associated resistance in cancer therapies. Nano Lett. 2016;16:6145-6153
Author contact
![]() Corresponding authors: Hairong Zheng and Zonghai Sheng E-mail: hr.zhengac.cn; zh.shengac.cn
Corresponding authors: Hairong Zheng and Zonghai Sheng E-mail: hr.zhengac.cn; zh.shengac.cn