Impact Factor
- Issue 13; 2026
- Issue 12; 2026
- Issue 11; 2026
- Issue 10; 2026
- Issue 9; 2026
- Volume 16; 2026
- Advance Articles
- Past Issues
- Cover Images
- Cover Suggestion
- Index & Coverage
- Special Issues
Introduction
Results
Discussion
Materials and methods
Abbreviations
Supplementary Material
Acknowledgements
References
International Journal of Biological Sciences
International Journal of Medical Sciences
 Global reach, higher impact

Theranostics 2018; 8(8):2202-2216. doi:10.7150/thno.24003 This issue Cite
Research Paper
OVOL2 links stemness and metastasis via fine-tuning epithelial-mesenchymal transition in nasopharyngeal carcinoma
Xue-Kang Qi1*, Hui-Qiong Han1,3*, Hao-Jiong Zhang1*, Miao Xu1 ![]() , Lili Li2, Lin Chen1, Tong Xiang1, Qi-Sheng Feng1, Tiebang Kang1, Chao-Nan Qian1, Mu-Yan Cai4, Qian Tao2, Yi-Xin Zeng1
, Lili Li2, Lin Chen1, Tong Xiang1, Qi-Sheng Feng1, Tiebang Kang1, Chao-Nan Qian1, Mu-Yan Cai4, Qian Tao2, Yi-Xin Zeng1 ![]() , Lin Feng1
, Lin Feng1 ![]()
1. Department of Experimental Research, Sun Yat-sen University Cancer Center, State Key Laboratory Oncology in South China, Guangzhou, China
2. Cancer Epigenetics Laboratory, Department of Clinical Oncology, State Key Laboratory of Oncology in South China, Sir YK Pao Center for Cancer, Li Ka Shing Institute of Health Sciences, The Chinese University of Hong Kong, Hong Kong
3. The First Affiliated Hospital of Zhengzhou University, Zhengzhou University, Zhengzhou, China
4. Department of Pathology, Sun Yat-sen University Cancer Center, State Key Laboratory Oncology in South China, Guangzhou, China
*These authors contributed equally to this work.
Received 2017-11-24; Accepted 2018-2-13; Published 2018-3-8
Abstract

Rationale: Metastasis is the leading cause of disease-related death among patients with nasopharyngeal carcinoma (NPC). Mounting evidence suggest that epithelial-mesenchymal transition (EMT) is crucial for cancer cells to acquire metastatic ability. In this study, we aim to clarify the extent to which EMT is involved in various cancer properties and identify novel markers for predicting the prognosis of NPC patients.
Methods: Two cellular models derived from the same NPC cell line with distinct metastasis ability were used for microarray analysis to identify key transcriptional factors that drive metastasis. Cell migration and invasion were analyzed by wound healing and Transwell analysis. Lung metatasis was determined by tail vein injection assay. Cancer stemness was analyzed using colony formation and xenograft assay. The EMT extent was evaluated using immunoblotting, RT-qPCR and immunofluorescence of EMT markers. The value of OVOL2 in prognosis was determined by immunohistochemistry in NPC biopsies.
Results: OVOL2 was the most significantly down-regulated EMT transcription factor (EMT-TF) in cellular models of NPC metatasis. Low levels of OVOL2 were associated with poor overall survival of NPC patients and the reduced expression is partly due to promoter methylation and epithelial dedifferentiation. Knockout of OVOL2 in epithelial-like NPC cells partially activates EMT program and significantly promotes cancer stemness and metastatic phenotypes. Conversely, ectopically expression of OVOL2 in mesenchymal-like cells leads to a partial transition to an epithelial phenotype and reduced malignancy. Reversing EMT by depleting ZEB1, a major target of OVOL2, does not eliminate the stemness advantage of OVOL2-deficient cells but does reduce their invasion capacity. A comparison of subpopulations at different stages of EMT revealed that the extent of EMT is positively correlated with metastasis and drug resistance; however, only the intermediate EMT state is associated with cancer stemness.
Conclusion: Distinct from other canonical EMT-TFs, OVOL2 only exhibits modest effect on EMT but has a strong impact on both metastasis and tumorigenesis. Therefore, OVOL2 could serve as a prognostic indicator for cancer patients.
Keywords: OVOL2, metastasis, EMT, stemness, nasopharyngeal carcinoma
Introduction
Nasopharyngeal carcinoma (NPC) is a unique type of head and neck cancer that arises from the epithelium of the nasopharynx; NPC is rare except in Southeast Asia and southern China, and it is classified as a squamous cell carcinoma or an undifferentiated type. Although NPC is sensitive to radiotherapy with adjuvant chemotherapy, approximate 30% of patients develop distant metastases to the bone, lymph nodes, liver and lung, and these metastatic events account for the majority of deaths from NPC [1-3]. Therefore, there is an urgent need to investigate the molecular mechanisms underlying NPC metastasis and to develop novel markers for predicting the metastasis risk of primary NPC patients.
Tumor metastasis is a multi-step process in which tumor cells move from the primary site to colonize distant organs in a progressive process that includes local invasion, intravasation, dissemination, extravasation and colonization. Accumulating evidence indicates that epithelial-mesenchymal transition (EMT) is crucial for cancer cells to acquire metastatic ability. EMT describes the shift toward the mesenchymal state; epithelial cells lose their junctions and apical-basal polarity and adopt migratory and invasive behaviors. The molecular hallmarks of EMT are down-regulation of E-cadherin and up-regulation of mesenchymal markers, such as N-cadherin, Vimentin and fibronectin [4]. EMT has been extensively studied in embryonic development and tissue remodeling [5, 6]. The role of EMT in cancer in complex, but it is generally accepted that EMT is linked to invasion and metastasis. In addition, EMT is implicated in other cancer-related properties, including resistance to cell death, the acquisition of stemness properties, and refractory responses to chemotherapy [7, 8].
EMT is executed by a group of transcription factors (EMT-TFs) that includes ZEB, Snail, Twist, and Slug [7, 9, 10]. These TFs coordinately regulate EMT by activating or suppressing downstream targets that maintain epithelial or mesenchymal traits, and these EMT-TFs themselves are controlled by various signals, such as the TGF-β and Wnt pathways, and non-coding RNAs. Dysregulation of EMT-TFs often leads to tumor progression [10].
Despite the involvement of EMT in the early stages of metastasis, such as invasion and intravasation, its role in cancer progression remains a matter of debate. Recent studies have challenged the notion that EMT contributes to metastasis [11, 12], and some contradicting reports were published on cancer stemness with either epithelial or mesenchymal state [13-17]. Of note, these studies manipulated master EMT-TFs, such as ZEB1 and Twist, to force cells into a fixed mesenchymal or epithelial state, which may cause loss of cell plasticity and stem cell phenotypes. Given that EMT is a reversible and dynamic process that is co-opted by cancer cells during metastasis, it is necessary to study EMT in a more reversible and physiological setting.
OVOL2 was recently discovered as a transcriptional repressor of EMT. OVOL2 belongs to the Ovo gene family; it harbors an N-terminal SNAG repressor motif and four C2H2 zinc finger domains at the C-terminus for DNA binding [18, 19]. OVOL2 is an evolutionarily conserved protein that is involved in many important physiological processes, such as oogenesis in drosophila and mice [20, 21], cranial neural tube development [22], mammary morphogenesis [23], angiogenesis, heart formation and placental development [24] in mice, and ectoderm differentiation in human cells [25] through EMT regulation. Down-regulation of OVOL2 has been found in a variety of cancers, and OVOL2 was reported to inhibit EMT and metastasis by suppressing ZEB1 in breast cancer [26], TWIST in lung cancer [27], c-Myc in cutaneous squamous cell carcinoma [28], Wnt signaling in colorectal cancer [29] and TGF-β signaling in breast cancer [30].
In this study, we characterized two cellular models derived from the same NPC cell line to identify key TFs that drive metastasis, and OVOL2 was found to be the most significantly changed TF in a pair of subclones with contrasting metastasis capacities. We show that loss of OVOL2 causes an intermediate hybrid EMT state that drives metastasis and tumorigenesis, while an extreme EMT state contributes to drug resistance and invasion phenotypes but not to stemness. Furthermore, our data suggest that restoring OVOL2 expression is a potential therapeutic strategy for NPC.
Results
OVOL2 is down-regulated in cellular models of NPC metastasis
Taking advantage of cancer heterogenicity, a typical NPC cell line CNE2 has been used to generate two distinct clonal populations, subclone-18 (S18) and subclone-26 (S26), that have high and low metastasis ability, respectively [31]. The two clones displayed contrasting morphology: the S18 subclone had spindle/fibroblastoid morphology typical of mesenchymal cells, whereas the S26 subclone and parental CNE2 cells adopted the cobble-stone shape typical of epithelial cells (Figure 1A). Global gene expression profiles revealed a striking difference in transcriptional programs between the two subpopulations derived from the same parental cell line, and functional profiling of the differentially expressed genes suggested that the greatest proportion was enriched in EMT (Figure 1B). Gene set enrichment analysis (GSEA) showed that S18 cells displayed a more mesenchymal phenotype than S26 cells (Figure 1C and Figure S1A, F-G), indicating that the S26 and S18 subclones are two subpopulations with epithelial and mesenchymal traits, respectively.
OVOL2 is down-regulated during EMT and in NPC tissues. (A) The morphology of CNE2, subclone-18 (S18) and subclone-26 (S26) cells by bright field microscopy (scale bar = 100 μm). (B) Gene set enrichment analysis (GSEA) of microarray data on S18 and S26 cells. NES: normalized enrichment score. (C) GSEA plot reveals an enrichment of a gene signature associated with EMT between S18 and S26 cells. FDR: false-discovery rate. (D) Fold change in the expression of EMT-transcription factors between S18 and S26 cells from microarray data. (E) Western blotting analysis of OVOL2 and EMT markers in CNE2, S18 and S26 cells. (F) (left) Western blotting analysis of OVOL2 and EMT markers in NPEC/NPC cell lines. (right) Pearson correlation between OVOL2 and E- or N-cadherin protein levels. Densitometry quantifications were performed with ImageJ software. (G) Immunohistochemistry analysis of OVOL2 expression in 22 normal nasopharyngeal epithelium samples and 192 primary tumor samples (scale bar = 100 μm), together with an enlarged view of each in the corresponding inset. (H) Kaplan-Meier survival curve of the overall survival of 192 NPC patients stratified by OVOL2 expression (high-expression group: IHC score ≥3; low-expression group: IHC score <3). The data were statistically evaluated using the log-rank test.
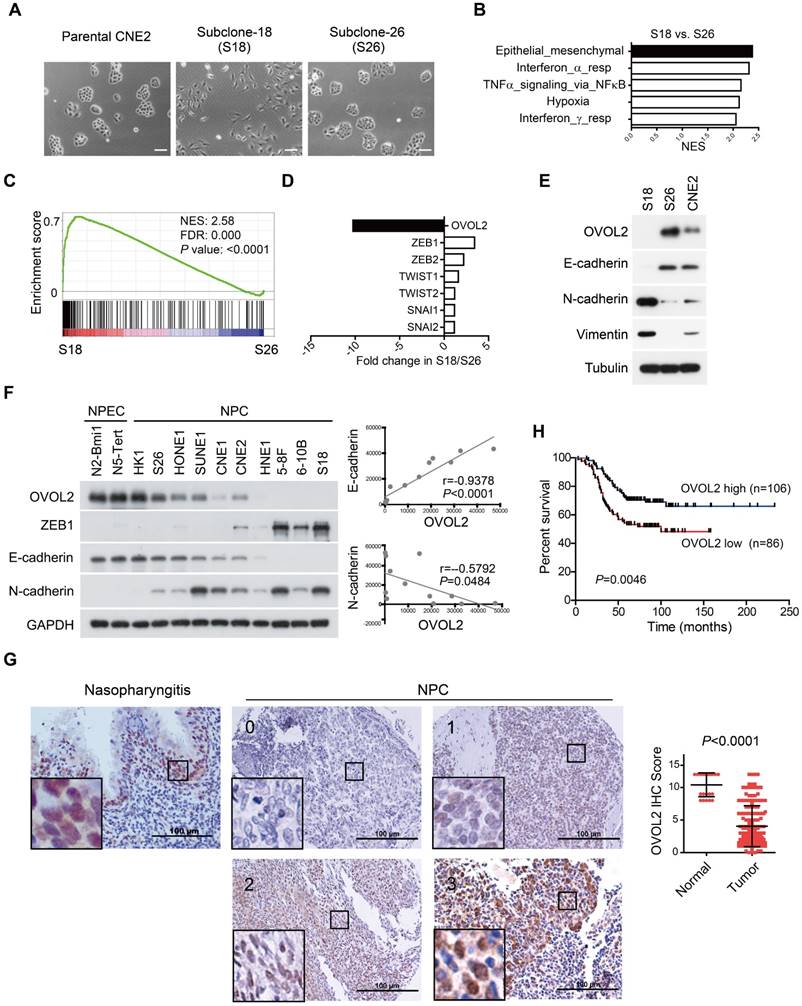
Next, we aimed to identify the key TF whose differential expression accounts for the contrasting characteristics of the S18 and S26 subpopulations. The transcriptome data suggested that OVOL2 was the TF with the greatest variance in expression among all known EMT-TFs, including ZEB1, ZEB2, TWIST1/2 and Snail1/2 (Figure 1D). Western blotting confirmed that OVOL2 was highly expressed in S26 cells, modestly expressed in CNE2 cells, and barely detectable in S18 cells; OVOL2 expression was inversely correlated with EMT extent, as characterized by E-cadherin down-regulation and N-cadherin up-regulation (Figure 1E). Furthermore, by analyzing OVOL2 expression in two normal nasopharyngeal epithelial cell (NPEC) lines and ten NPC cell lines, we found that expression of the epithelial gene E-cadherin was strongly correlated with OVOL2 levels, while expression levels of the mesenchymal genes N-cadherin and ZEB1 were inversely correlated with OVOL2 in NPC cell lines (Figure 1F and Figure 5B; see below).
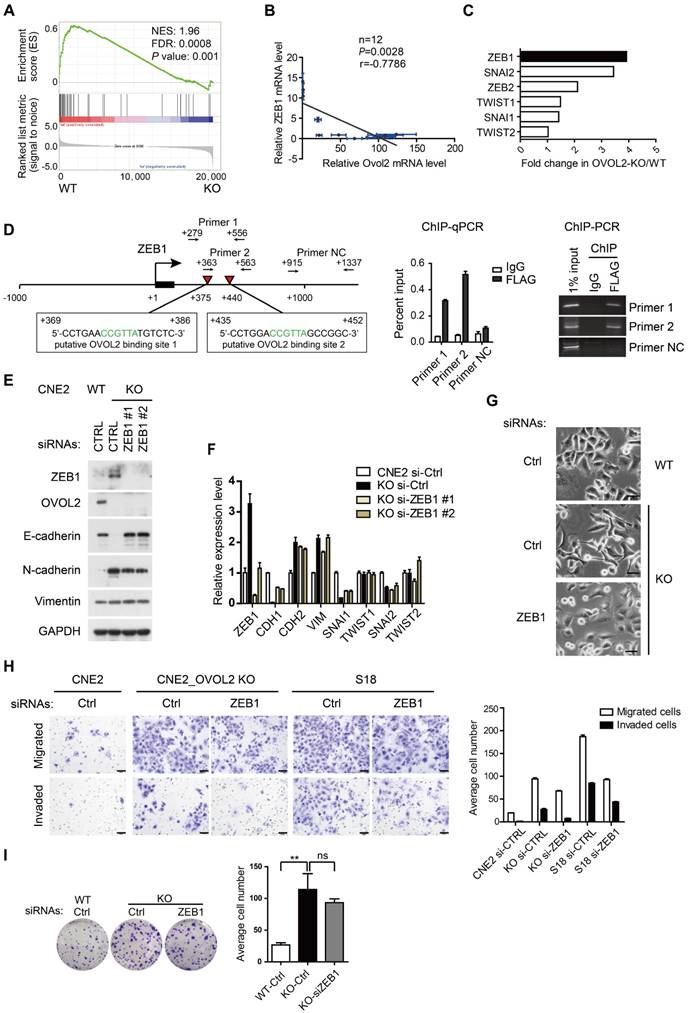
Reversal of EMT by ZEB1 knockdown in OVOL2-deficient cells. (A) GSEA of transcriptome data from WT versus OVOL2-KO cells revealed an enrichment of gene signatures associated with the down-regulation of ZEB1 target genes. (B) Correlation analysis of OVOL2 and ZEB1 mRNA expression in NPEC/NPC cell lines (two-tailed Pearson correlation). Blue line: error bar. (C) Fold changes in the expression of EMT-TFs between WT and OVOL2-KO CNE2 cells from microarray data. (D) (left) Diagram showing the presence of OVOL2 consensus motifs in the first intron of human ZEB1 gene. Black: exon 1; red triangle: putative OVOL2 binding sites; arrowhead: primers used in ChIP-qPCR/PCR; +1: transcriptional start site. (right) ChIP-qPCR/PCR analysis in CNE2 cells transfected with FLAG-OVOL2 showed that immunoprecipitation (IP) with anti-FLAG antibody results in enrichment of the two putative binding sites compared with IP with control immunoglobulin. (E) Protein levels of EMT-related genes with or without ZEB1 knockdown in OVOL2-KO cells. (F) mRNA levels of EMT-related genes in cells described in (E). (G) Morphology of CNE2 WT, CNE2 OVOL2-KO and S18 cells with or without ZEB1 knockdown (scale bar = 50 μm). (H) Representative image and quantification of Transwell cell migration and invasion assays with CNE2 WT, OVOL2-KO and S18 cells. n = 3, scale bar = 50 μm. (I) Colony formation of OVOL2-KO cells with or without ZEB1 knockdown. Mean ± SD, n = 3.
Next, we used immunohistochemistry (IHC) to evaluate OVOL2 levels in NPC patients using a tissue array containing 22 normal nasopharyngeal epithelium samples and 192 primary tumor samples. The results showed predominant nuclear staining for OVOL2 in the basal layer of the nasopharyngeal epithelium and NPC tissues. Notably, scoring of OVOL2 IHC based on staining strength and the percent of positive cells revealed that OVOL2 expression levels were significantly reduced in human NPC compared to non-cancerous nasopharyngeal tissues (Figure 1G), and low levels of OVOL2 were associated with poor overall survival of NPC patients (Figure 1H), indicating that OVOL2 may play a role in suppressing EMT and NPC progression.
OVOL2 acts as a repressor of EMT
To gain insight into the function of OVOL2 in NPC, OVOL2 was knocked out in the CNE2 and HNE1 cell lines using the CRISPR/Cas9-mediated gene editing system. Based on the T7E1 cleavage efficiency, two single-guide RNAs (sgRNAs) targeting the second exon of OVOL2 were selected for generating OVOL2-knockout (KO) cells (Figure S2A). Western blotting and sequencing verified the KO status of these cells (Figure 2A and Figure S2B-C). In OVOL2-KO cells, the expression of epithelial genes such as E-cadherin was strongly repressed, whereas mesenchymal genes such as N-cadherin and Vimentin were up-regulated (Figure 2A). Correspondingly, the morphology of CNE2 cells was altered from a cobblestone-like to a spindle-like phenotype upon OVOL2 depletion, accompanied by E-cadherin down-regulation and Vimentin up-regulation (Figure 2B). Moreover, analysis of microarray data supported the finding that OVOL2 depletion shifted the cells toward a mesenchymal phenotype (Figure 2C). Additionally, GSEA revealed that EMT was the most significantly affected event in the comparison of OVOL2 wild-type (WT) and KO cells (Figure S1C). Furthermore, reconstitution of OVOL2 into OVOL2-KO cells successfully rescued EMT, which excluded the possibility of off-target effects of the selected sgRNAs (Figure 2D). To further characterize the role of OVOL2 in EMT, we used a 3-dimensional cell culture system. Cells were plated in Matrigel or in suspension; control CNE2 cells developed uniform round spheres, whereas OVOL2-depleted CNE2 cells exhibited a loss of epithelial polarity and dendritic extensions (Figure 2E). Together, these data indicate that OVOL2 suppresses EMT in NPC cells.
OVOL2 inhibits EMT. (A) Western blot (WB) analysis of EMT markers in OVOL2-knockout (KO) CNE2 cell lines. (B) Morphological changes in OVOL2-KO cells were observed by bright field microscopy, and immunofluorescence analysis of E-cadherin and Vimentin was performed in CNE2 wild-type (WT) and KO cells (scale bar = 50 μm). (C) GSEA plot showing an enrichment of gene signatures associated with EMT between OVOL2-WT and OVOL2-KO cells. (D) WB analysis of EMT markers in OVOL2-KO cells before and after reconstitution with ectopic OVOL2. (E) Morphological features of OVOL2-WT and OVOL2-KO cells in suspension culture or in Matrigel (scale bar = 50 μm). (F) WB and qPCR analysis of EMT markers in S18 cells with or without OVOL2 overexpression. (G) Morphology and E-cadherin and Vimentin staining in S18 cells with or without OVOL2 overexpression (scale bar = 50 μm). (H) Morphology of S18 cells with or without OVOL2 overexpression in suspension culture or in Matrigel (scale bar = 50 μm).
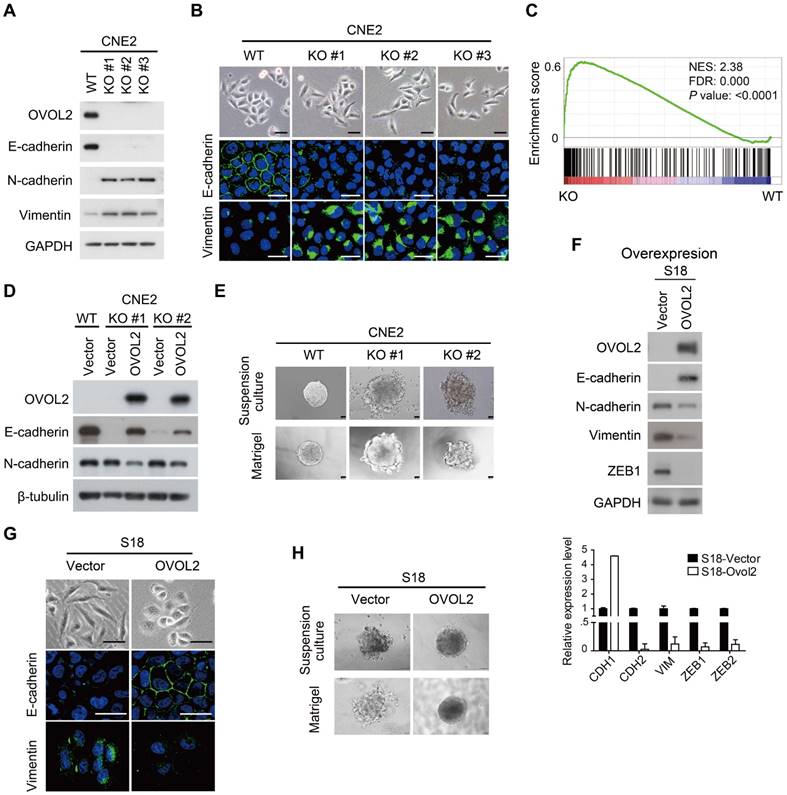
We next asked whether ectopic expression of OVOL2 induces the reverse process of EMT, called MET (mesenchymal-epithelial transition). Overexpression of OVOL2 in the mesenchymal-like S18 subclone led to a switch from N-cadherin to E-cadherin expression and decreases in the levels of mesenchymal markers like Vimentin and ZEB1 (Figure 2F). The cell morphology changed from mesenchymal-like to epithelial-like (Figure 2G), and the cells gained epithelial cell polarity in 3-D culture systems (Figure 2H). These results indicate that the primary function of OVOL2 is to inhibit EMT.
OVOL2 inhibits NPC metastasis
As OVOL2 was initially identified based on differences between two subclones with contrasting metastatic capacity (Figure 1A-E), we asked whether OVOL2 affects the metastatic potential of NPC. Global gene expression analysis showed that OVOL2-deficient cells were enriched for the signature associated with cancer invasion and metastasis compared to the respective WT cells (Figure S1B, G). Indeed, OVOL2 overexpression greatly impaired the migratory ability of S18 cells (Figure 3A). In contrast, OVOL2 KO led to a significant reduction in the migration rate in scratch wound migration assays (Figure 3B) and the invasion ability in Transwell invasion assays of CNE2 (Figure 3C) and HNE1 cells (Figure 3D).
OVOL2 suppresses the migration and metastasis of NPC cells. (A) Representative image and quantification of Transwell cell migration assays with S18 cells stably expressing ectopic OVOL2 or empty vector. n = 3, scale bar = 100 μm. (B) Wound healing assays with CNE2 WT and OVOL2-KO cells. (C) Representative image and quantification of Transwell cell invasion assays with CNE2 WT and OVOL2-KO cells. n = 3, scale bar = 100 μm. (D) Representative image and quantification of Transwell cell invasion assays with HNE1 WT and OVOL2-KO cells. (E) (left) Metastatic nodules on the lung surface driven by tail vein injection of CNE2 WT and OVOL2-KO cells were counted with the naked eye, n = 6. (right) Lung sections stained by hematoxylin and eosin (H&E) showed more metastatic nodules in KO cells than in WT cells. (F) Metastasis assay as in (E) with HNE1 WT and OVOL2-KO cells, n = 5. Data are presented as the mean ± SD. *p<0.05, **p<0.01, *** p<0.001.
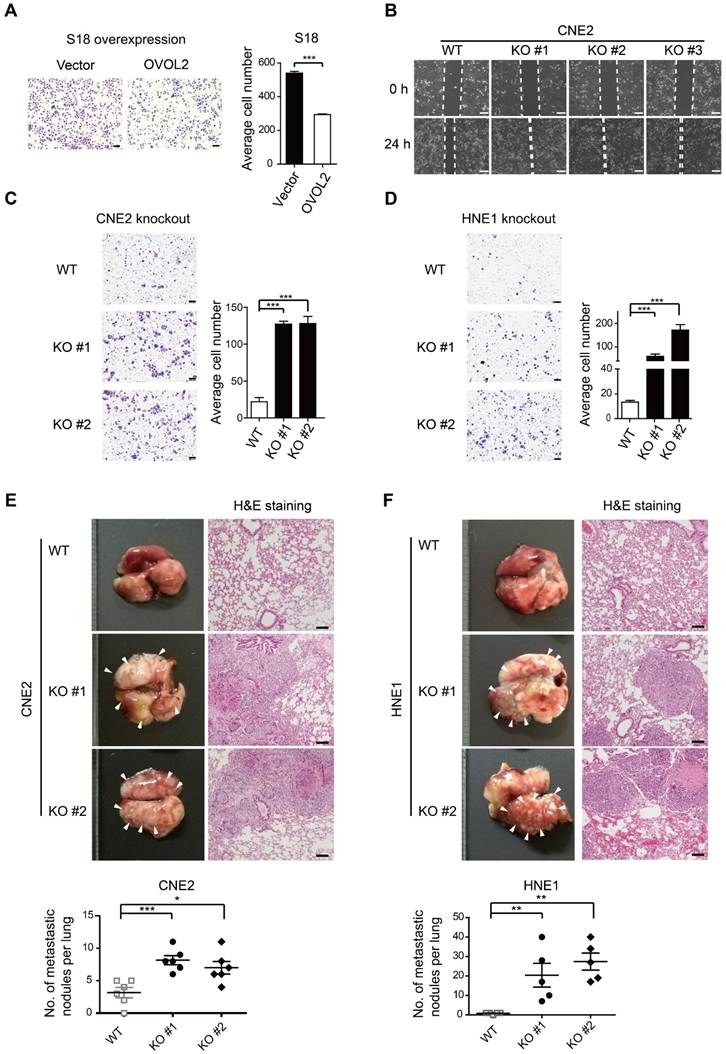
Next, the role of OVOL2 in metastasis was evaluated by tail vein injection of cancer cells, which is the most commonly used metastasis assay and primarily leads to the formation of metastatic nodules in the lung. Mice injected with CNE2 or HNE1 cells with OVOL2 depletion formed significantly more metastatic nodules than mice injected with control cells (Figure 3E-F). These results indicate that loss of OVOL2 results in a gain in invasiveness and distant organ colonization.
OVOL2 negatively regulates tumorigenicity
EMT is related to the generation of cancer stem cells (CSCs) under certain circumstances but is not always associated with stemness [7, 17]. For example, subclones S18 and S26, which were originally isolated from CNE2 cells based on their distinct metastatic abilities, did not differ in tumorigenicity in xenograft assays [31]. Given that EMT was the most characteristic difference between S18 and S26 cells and that the primary function of OVOL2 is to inhibit EMT, we then asked whether OVOL2 controls the stemness of NPC cells. We found that OVOL2-KO cells exhibited a higher plating efficiency than their WT counterparts (Figure 4A), and this advantage was abolished by the reconstitution of ectopic OVOL2 in KO cells (Figure 4B), indicating that OVOL2 deficiency caused increased “stemness” in vitro. Next, in vivo stemness was determined in a xenograft mouse model.
OVOL2 negatively regulates the tumorigenicity of NPC. (A) OVOL2 knockout (KO) in CNE2 cells increased the ability to form colonies on conventional plates. Mean ± SD, n = 3. (B) Colony formation of CNE2 WT, OVOL2-KO and OVOL2-KO cells reconstituted with ectopic OVOL2 (n = 3). (C) EMT marker expression in CNE2 cells stably expressing OVOL2 or empty vector. (D) Serial transplantation experiments using limiting dilutions of WT or OVOL2-KO CNE2 cells (n = 8 mice for each dilution). (E) CNE2 cells stably expressing OVOL2 or empty vector were subcutaneously injected into nude mice, and images were taken 22 days post-implantation. (F) Tumor weight in mice injected s.c. with CNE2 control or OVOL2-overexpressing cells (1×10⁵ cells; n = 8). (G) Growth curves of xenograft tumors formed by CNE2 cells stably expressing OVOL2 or empty vector (1×10⁵ cells were inoculated s.c.; n = 8). (H) WT or OVOL2-KO CNE2 cells were subcutaneously injected into nude mice, and images were taken 22 days post-implantation. (I) Tumor weight in mice injected with CNE2 WT or OVOL2-KO cells. (J) Growth curves of xenograft tumors formed by WT or OVOL2-KO CNE2 cells (5×10⁴ cells were inoculated s.c.; n = 6).
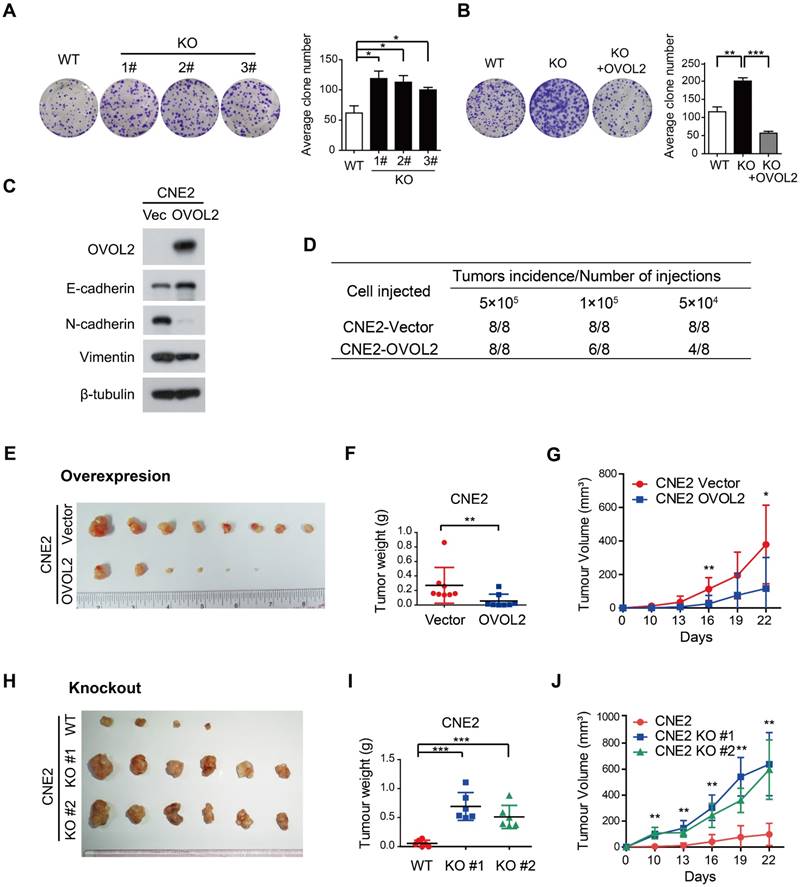
Limiting dilution transplantation analysis of NPC xenografts was conducted, and the results suggested that OVOL2-overexpressing cells exhibited a dramatic reduction in tumor initiating ability (Figure 4D) and a considerably reduced tumor growth rate (Figure 4E-G). Conversely, the absence of OVOL2 dramatically exacerbated tumorigenesis (Figure 4H-J). These results indicate a tight association between OVOL2-regulated EMT and stemness.
Depletion of ZEB1 in OVOL2-deficient cells recovers epithelial trait and cell invasiveness but not stemness
Previous reports revealed the existence of a mutual inhibition loop involving OVOL2 and ZEB1 in EMT [23, 26], and we wondered whether OVOL2 inhibits tumorigenic behavior by repressing ZEB1. A negative correlation between the levels of ZEB1 target genes and OVOL2 status was found in the transcription profiles of OVOL2-KO cells and their WT counterpart (Figure 5A). Furthermore, analyses of expression data from the CCLE database [32] suggested that ZEB1 expression had the strongest inverse correlation with OVOL2 among EMT-TFs in 1036 cancer cell lines (Figure S3A-B) and in 12 NPC cell lines (Figure 5B). Upon OVOL2 depletion, ZEB1 was the most significantly up-regulated EMT-TF (Figure 5C). Furthermore, motif-finding analysis revealed the presence of two conserved OVOL2-binding consensus motifs CCGTTA [23] in the first intron of human ZEB1 gene (+375 and +440 bp). Using chromatin immunoprecipitation (ChIP) assay, we detected OVOL2 binding to both regions on ZEB1, demonstrating that ZEB1 is a direct target gene of OVOL2 in NPC cells (Figure 5D).
To determine if OVOL2 inhibits EMT by antagonizing ZEB1, OVOL2-KO cells were manipulated to reduce the level of ZEB1 by RNA interference. Knockdown of ZEB1 in OVOL2-KO cells was sufficient to rescue E-cadherin expression to levels comparable to those in WT cells (Figure 5E-F); accordingly, OVOL2-KO cells regained epithelial morphology upon ZEB1 depletion (Figure 5G). In contrast, the expression of mesenchymal genes, including N-cadherin and Vimentin, was not rescued by ZEB1 depletion (Figure 5E-F and Figure S3C-D), in accordance with the role of ZEB1 as an epithelial repressor rather than a mesenchymal inducer [33]. Next, we asked whether maintenance of the epithelial program is important for the properties of OVOL2-deficient cells. Indeed, depletion of ZEB1 reduced the migration and invasion capacities of OVOL2-KO CNE2 cells and of S18 cells (Figure 5H); in contrast, ZEB1 depletion did not considerably reduce the colony formation ability of OVOL2-KO cells (Figure 5I). Collectively, these findings suggest that OVOL2 maintains epithelial trait by suppressing ZEB1 transcription and inhibits mesenchymal characteristics in a ZEB1-independent manner, probably by directly binding and repressing the transcription of mesenchymal genes; furthermore, partial MET induced by down-regulating ZEB1 was not sufficient to abolish the increased stemness properties of OVOL2-deficient cells.
OVOL2 is regulated by promoter methylation and epithelial differentiation
As the malignant progression of NPC is strictly suppressed by OVOL2, we next aimed to elucidate the mechanisms by which OVOL2 expression is regulated. Previous genome methylation sequencing revealed CpG methylation of the OVOL2 promoter [29, 34]; therefore, we performed bisulfite treatment and methylation-specific PCR analysis of the OVOL2 promoter in NPC cell lines and NPC tissues. The results showed that the OVOL2 promoter was hyper-methylated in most of the NPC cell lines but not in the two NPEC cell lines (Figure 6A). Furthermore, an analysis of 57 cases of NPC samples revealed OVOL2 promoter hyper-methylation in 80.7% of NPC tissues (Figure 6B). Consistently, treatment of the 5-8F and CNE1 cell lines with the demethylating agent 5-aza-2′-deoxycytidine (5-AZA) resulted in robust transcriptional reactivation of OVOL2 (Figure 6C).
Regulation of OVOL2 in NPC. (A) Methylation-specific PCR (MSP) of the OVOL2 promoter in NPEC and NPC cell lines. (B) MSP of the OVOL2 promoter in 57 NPC tissues. (C) 5-Aza-2′-deoxycytidine (5-AZA) up-regulated OVOL2 expression in 5-8F and CNE1 cells as determined by qPCR (n = 4) and Western blotting. Cells were treated with 2.5 μM 5-AZA for 72 h. (D) All-trans-retinoic acid (RA) induced the differentiation of CNE2 cells and up-regulated OVOL2. Cells were treated with various concentrations of RA as indicated for 72 h.
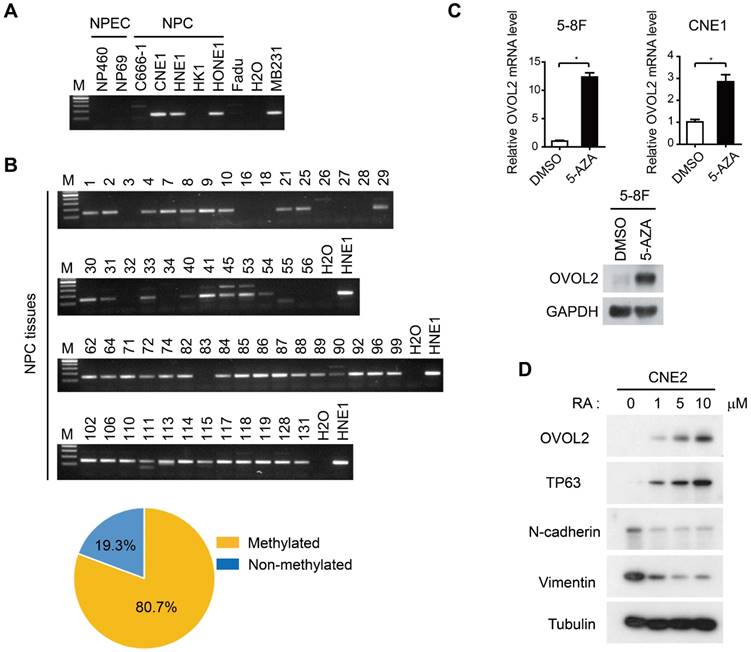
As 5-AZA treatment did not elevate OVOL2 expression in all the NPC cell lines (data not shown), we questioned whether there are other modes of OVOL2 regulation. OVOL2 was found to be expressed in the basal layer of the nasopharyngeal epithelium (Figure 1G), so we examined OVOL2 expression during epithelial differentiation. Retinoic acid (RA) induces the differentiation of various cell types, and we found that OVOL2 was significantly increased in CNE2 cells following RA treatment, concomitant with the up-regulation of the differentiation marker TP63 and the down-regulation of N-cadherin and Vimentin (Figure 6D). As the undifferentiated subtype is the most common subtype in NPC, these data provide another explanation for reduced OVOL2 expression in NPC.
In summary, OVOL2 expression is regulated at multiple levels with epigenetic and transcriptional controls.
Partial EMT caused by OVOL2 deficiency confers stemness and metastasis properties in NPC
Although OVOL2-KO cells displayed mesenchymal morphology and increased invasion and metastasis capacities resembling the S18 subclone, S18 cells do not show enhanced tumorigenicity compared to CNE2 and S26 cells [31]. To understand the divergent growth potentials of OVOL2-deficient CNE2 and S18 cells, which both exhibit mesenchymal traits, we compared the transcriptomes of OVOL2-KO CNE2 cells, CNE2 control cells, S18 cells, and S26 cells.
Surprisingly, EMT remained the top pathway that was differentially activated in OVOL2-KO CNE2 and S18 cells (Figure S1D). GSEA suggested that the extent of EMT was as follows: S18 > CNE2_OVOL2-KO > CNE2_WT > S26 (Figure 7A). To quantitively evaluate the extent of EMT in the above cells, the expression of epithelial and mesenchymal markers in these four cell lines was determined by Western blotting and qPCR. S18 cells completely lost E-cadherin expression and gained the highest levels of N-cadherin, ZEB1 and Vimentin; in contrast, OVOL2-depleted CNE2 cells retained low levels of E-cadherin and expressed modest levels of mesenchymal markers. In addition, CNE2 and S26 cells were the most epithelial-like, with little or no apparent EMT (Figure 7B-C). These data suggest that the loss of OVOL2 does not lead to complete EMT, which is exhibited in S18 cells. We also calculated an EMT score for each cell line by subtraction of -ΔCt N-cadherin and -ΔCt E-cadherin [35], and the results clearly indicated an intermediate EMT status of OVOL2-KO CNE2 cells (Figure 7D).
Loss of OVOL2 leads to partial EMT, which confers NPC with stemness properties. (A) GSEA of transcriptome data from S18, CNE2 OVOL2_KO, CNE2 WT and S26 cells reveals the enrichment of an EMT signature. (B) Western blot analysis of OVOL2 and EMT markers in S18, CNE2 OVOL2_KO, CNE2 WT and S26 cells. (C) qPCR analysis of OVOL2 and EMT markers in cells in (B). (D) EMT scores of cell lines in (B). (E) Migration and invasion ability of cell lines in (B) determined by Transwell assays (scale bar = 100 μm). (F) Cisplatin sensitivity of cells in (B) determined by treatment with various concentrations of cisplatin for 72 h. Cell viability was determined by CCK8 assay. (G) Proposed model of metastasis, drug resistance and stemness properties across the EMT spectrum.
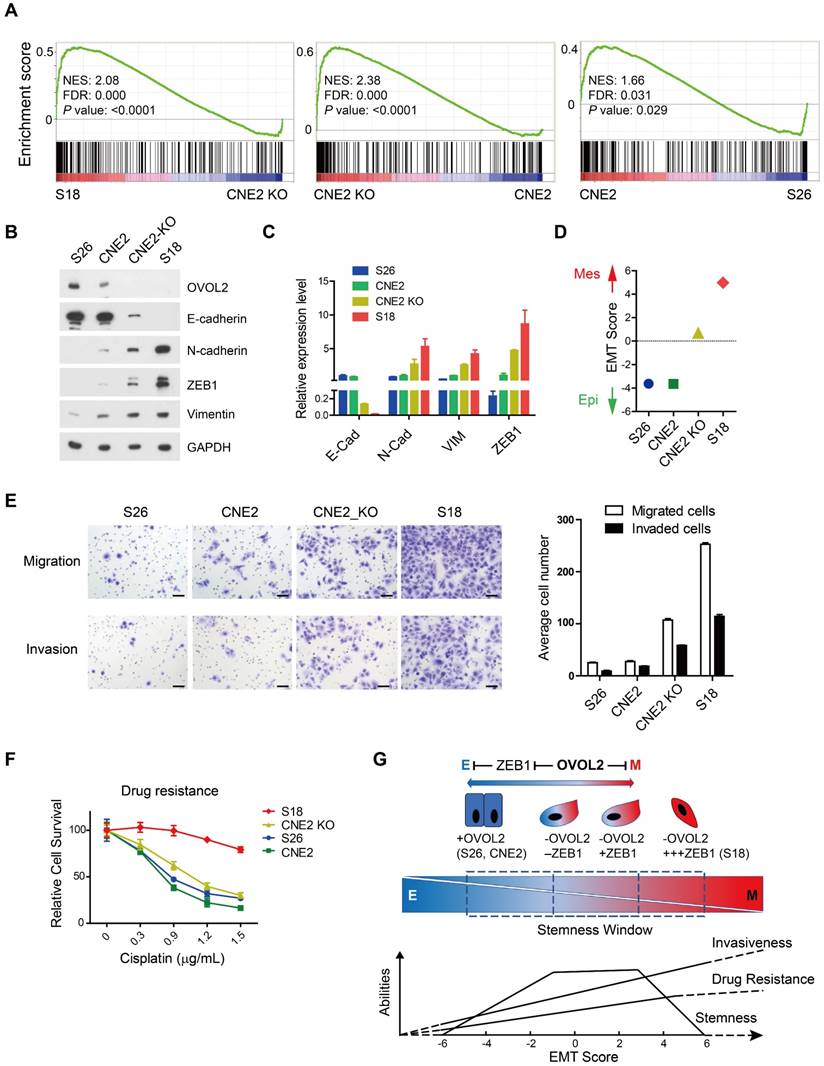
Next, we tried to establish a correlation between the EMT spectrum and tumor invasiveness and chemoresistance. We found that S18 cells harbored the greatest capacity for migration and invasion and were the most resistant to cisplatin-induced cell death, whereas OVOL2-depleted CNE2 cells showed modest increases in migration, invasion and drug resistance compared to parental CNE2 cells and the epithelial derivative S26 cells (Figure 7E-F). Therefore, the extent of EMT is associated with enhanced invasion ability and increased resistance to chemotherapy, but the acquisition of cancer stemness is limited to a narrow window of intermediate EMT (Figure 7G; see Discussion for details).
Taken together, our data suggest that OVOL2 is at the crossroads of EMT, metastasis and tumor stemness.
Discussion
The dysregulation of EMT-related TFs has been implicated in cancer progression. The role of OVOL2, an EMT-repressing TF, in suppressing metastasis has been shown in several human cancers, such as breast cancer, colorectal cancer and lung cancer [26, 27, 29, 30, 36]. In this report, by studying subclonal populations derived from the typical NPC cell line CNE2 that display relatively stable and contrasting phenotypes (S26: epithelial; S18: mesenchymal), we found that OVOL2 was the most significantly changed EMT-TF between the two subclones (Figure 1), and functional analysis suggested that OVOL2 acts not only as a suppressor of metastasis (Figure 3) but also as a potent tumor suppressor (Figure 4). OVOL2 was significantly down-regulated in NPC, at least partly due to promoter hyper-methylation and epithelial dedifferentiation (Figure 6), and low expression of OVOL2 was correlated with poor prognosis (Figure 1). The strong tumor inhibitory role of OVOL2 suggests that it is a master TF in NPC development.
Down-regulation of OVOL2 has been implicated in various types of human cancers and has often been associated with EMT and metastasis, such as in breast cancer [26, 30], lung cancer [27] and colorectal cancer [29]. On the other hand, activation of OVOL2 was also detrimental to cells and accompanied with MET. For example, overexpression of Ovol2 in mouse epidermal cells led to precocious differentiation [37] and skin blistering [38]; mutations in the promoter region of human OVOL2 that activate OVOL2 transcription have been found in congenital hereditary endothelial dystrophies [39]. Above evidences indicated that OVOL2 acts as a gatekeeper for epithelial homeostasis. The molecular mechanism by which OVOL2 restricts EMT involves ZEB1 repression, which has been demonstrated as a key target of OVOL2 in normal epithelial cells [23, 25, 40]. The finding has been reproduced in NPC cells in this study. However, ZEB1 might constitute only one of the causative genes for the EMT repressive function of OVOL2, since knockdown of ZEB1 was unable to fully reverse EMT caused by OVOL2 deficiency (Figure 5). In addition to ZEB1, OVOL2 has been reported to regulate various targets and signaling pathways to control tumorigenesis or metastasis, such as TWIST, NOTCH and c-Myc [27, 28, 41] genes and WNT [29] and TGF-β [30] signaling pathways. Whether OVOL2 inhibits EMT at multiple levels and adopts different mechanisms in suppression of different types of cancers need to be further studied in the future.
Intriguingly, OVOL2 was distinct from other canonical EMT-TFs in that its gain or loss did not cause complete MET or EMT. Transduction of OVOL2 into NIH-3T3 cells was not able to restore E-cadherin expression (Figure S3E). Overexpression of OVOL2 in S18 cells, a mesenchymal-like subclone of CNE2 cells, induced partial MET (Figure 2H), suggesting that OVOL2 can only push cells already in EMT to a more mesenchymal state; it cannot reprogram cells from a fixed mesenchymal state to an epithelial state. Conversely, genetic ablation of OVOL2 did not cause the complete loss of epithelial characteristics (Figure 7). Furthermore, partially reversing EMT by ZEB1 knockdown in OVOL2-deficient cells did not considerably impair their stemness properties, despite the full recovery of epithelial marker expression (Figure 5). On the other hand, although subclone S18 showed the highest EMT score and the highest capacity to migrate, invade, form metastatic outgrowths, and resist chemotherapy among OVOL2-KO CNE2 cells, parental CNE2 cells and subclone S26 (Figure 7 and [31]), S18 cells did not differ in primary tumor growth rate compared to parental CNE2 cells and the epithelial derivative S26 cells [31]. In contrast, OVOL2-KO CNE2 cells showed a modest increase in invasion, metastasis and drug resistance compared to WT CNE2 cells and the S26 subclone but a dramatic increase in primary tumor initiation and growth (Figure 4).
Complete loss or forced overexpression of EMT master TFs, such as ZEB1, Twist and Snail, or the EMT-suppressing microRNA miR-200 leads to complete EMT or MET, which is unfavorable for metastasis and CSC maintenance [11, 17, 42, 43]. Thus, there is intense debate as to whether EMT is a truly relevant event in cancer progression, and it is difficult to utilize these EMT-TFs to predict the metastasis risk in patients with primary cancer. In this report, we found that the modest effect of OVOL2 on EMT has a strong impact on both metastasis and tumorigenesis (Figure 3 and Figure 4), reinforcing the idea that a hybrid intermediate EMT state is linked to tumor stemness and indicating the potential application of OVOL2 in cancer diagnostics and prognostics. Our data suggest that tumor cells with a high EMT score show enhanced metastasis and drug resistance, while cells in a hybrid EMT state display high plasticity and a strong tumor initiating potential. These observations indicate that metastasis and drug resistance are enhanced during progression through EMT until cells attain a constitutive mesenchymal trait, whereas stemness is acquired in only a given spectrum of intermediate EMT states (Figure 7G). An open question is to what extent the intermediate stages of EMT promote stemness, and a more comprehensive and quantitative EMT scoring system is needed to utilize EMT state in prognostics.
In summary, our study may help clarify the extent to which EMT is involved in various cancer properties and pave the way to therapeutically targeting the EMT program in cancer therapy.
Materials and methods
Cell culture
Cells were cultured as described previously [44]. The CNE2 cell line and the S18 and S26 subclones were kindly provided by Dr. Chao-Nan Qian (SYSUCC).
Antibodies
The following antibodies were used in this study: OVOL2 (NBP1-88754; Novus, Littleton, CO, USA), E-cadherin (24E10; Cell Signaling Technology, Danvers, MA, USA), N-cadherin (13116; Cell Signaling Technology, Danvers, MA, USA), Vimentin (5741; Cell Signaling Technology, Danvers, MA, USA), ZEB1 (sc-10572; Santa Cruz Biotechnology, CA, USA), GAPDH (60004-1-1g; Protein-tech, Chicago, IL, USA) , β-tubulin (2128S; Cell Signaling Technology, Danvers, MA, USA) and FLAG (F3165; Sigma, USA). Horseradish peroxidase-conjugated goat anti-mouse/rabbit secondary antibodies were purchased from Promega (Madison, WI, USA).
Microarray analysis
Total RNA from CNE2, S26, S18 and CNE2 OVOL2-KO cells was isolated with Trizol reagent (Invitrogen, Carlsbad, CA, USA). Human Genome U133 Plus 2.0 Arrays (Affymetrix, Santa Clara, CA, USA) were used for gene expression analysis by CapitalBio Corporation (Beijing, China).
Quantitative real-time PCR
Total RNA was isolated with Trizol reagent (Invitrogen, Carlsbad, CA, USA) according to the manufacturer's instructions. First-strand cDNA was synthesized using a PrimeScript RT Reagent Kit (TaKaRa, Tokyo, Japan). Quantitative real-time PCR was performed using Platinum SYBR Green qPCR SuperMix (Invitrogen, Carlsbad, CA, USA) according to the manufacturer's instructions. The PCR primers used for amplifying OVOL2, E-cadherin, N-cadherin, Vimentin, ZEB1/2, SNAI1, TWIST and GAPDH are as follows:
OVOL2-F: 5'-TGCCACAACCAGGTGAAAA-3', OVOL2-R: 5'-GCTGGGTGAAGGCTTTATT-3'; CDH1/E-cadherin-F: 5'-TGCCCAGAAAATGAAAAAGG-3', CDH1/E-cadherin-R: 5'-GTGTATGTGGCAATGCGTTC-3'; CDH2/N-cadherin-F: 5'-AGCCAACCTTAACTGAGGAGT-3', CDH2/N-cadherin-R: 5'-GGCAAGTTGATTGGAGGGATG-3'; Vimentin-F: 5'-GAGAACTTTGCCGTTGAAGC-3', Vimentin-R: 5'-GCTTCCTGTAGGTGGCAATC-3'; ZEB1-F: 5'-ATGCAGCTGACTGTGAAGGT-3', ZEB1-R: 5'-GAAAATGCATCTGGTGTTCC-3'; ZEB2-F: 5'-GTCCATGCGAACTGCCATCTGATCCGCTCT-3', ZEB2-R: 5'-GGCTTGCAGAATCTCGCCAC-3'; SNAI1-F: 5'-ACCACTATGCCGCGCTCTT-3', SNAI1-R: 5'-GGTCGTAGGGCTGCTGGAA-3'; TWIST1-F: 5'-AAGGCATCACTATGGACTTTCTCT-3', TWIST1-R: 5'-GCCAGTTTGATCCCAGTATTTT-3'; and GAPDH-F: 5'-TTGCCATCAATGACCCCTTCA-3', GAPDH-R: 5'-CGCCCCACTTGATTTTGGA-3'.
Plasmid construction, cell transfection, and immunofluorescence (IF) staining
All procedures were performed as described previously [45]. The siRNA sequences are as follows: ZEB1-siRNA#1: 5'-GGACTCAAGACATCTCAGT-3'; and ZEB1-siRNA#2: 5'-TGATCAGCCTCAATCTGCA-3'.
Establishment of OVOL2-knockout cell lines via the CRISPR/Cas9 method
Knockout of OVOL2 by the CRISPR/Cas9 method was performed as described previously [44]. All knockout clones were verified by Western blotting and Sanger sequencing. The sequences of the two OVOL2 sgRNAs are as follows: sgRNA#1: 5'-GTTCGCTCTCGGGGGCGTGC-3'; and sgRNA#2: 5'-GTCGGGGCCCTCGGCGTCGC-3'. The genotyping primers were OVOL2-in1-F (5'-CGAGTGTGTGTGTCGGGG-3') and OVOL2-in2-R (5'-GCAGAGTCGACACAGTACCT-3').
3D culture in Matrigel and suspension culture
For 3D culture in Matrigel, 500 cells were mixed with 50 µL of Matrigel (Corning, USA) and seeded on a Lab-Tek Chamber Slide (Thermo Scientific, Waltham, USA). Then, 250 µL of culture medium was added to each well separately, and the medium was changed every other day. For suspension culture, 500 cells were mixed with DMEM/F12 medium in the presence of 20 ng/mL EGF, 1×B27 (17504-044, Thermo Scientific, Waltham, USA) and 20 ng/mL FGF-2 and seeded in 6-well plates for approximately 3 weeks. All images were obtained with an OLYMPUS RX71 microscope (Tokyo, Japan).
Transwell assay
The Transwell invasion assays were performed using 24-well Companion Plates containing Transwells (Falcon, USA) with 8 μm membrane pores. For the migration assay, 5×10⁴ cells in 100 μL of serum-free DMEM were added to the cell culture inserts. For the invasion assay, 5×10⁴ cells in 100 μL of serum-free DMEM were added to the upper chamber coated with Matrigel (Corning, USA). Then, 800 μL of DMEM containing 10% FBS was added to the bottom chamber. After 24 h of incubation, the cells on the lower surface of the filter were fixed with methanol, stained with crystal violet, and examined using a microscope.
ChIP assay
ChIP assay was performed as described previously [41]. FLAG antibody (F3165; Sigma, USA) was used in ChIP assay, the sequences of ChIP-qPCR/PCR primers are: Primer 1 F: 5-GGCAAAGTGGAGTGGGAAAG-3; Primer 1 R: 5-GGGGAAAAGTGCGGAAAGAA-3. Primer 2 F: 5-GCTCTCCCTGAACCGTTATG-3; Primer 2 R: 5-CAAGAGTGGGGAAAAGTGCG-3. Negative control primers targeting non-OVOL2 binding regions are Primer NC F: 5- TAACGGGGATTAGAGGCGC -3; Primer NC R: 5- GCCATCCAAGCCCCATTATC -3. For qPCR of ChIP analysis, ChIP efficiency of certain binding sites were calculated using percentage of ChIPped DNA against input chromatin.
Animal experiments
All animal work was done in accordance with a protocol approved by the Institutional Animal Care and Use Committee. Female BALB/c nude mice (5-6 weeks old) were purchased from Shanghai Laboratory Animal Center (SLAC, animal experimental license no. SYXKyue2010-0102). For the lung metastasis assay, 1×10⁶ viable cells were washed and harvested in PBS and subsequently injected into the lateral tail vein in a volume of 0.1 mL. All mice were sacrificed approximately 5 weeks after injection, and metastatic nodules on the surface of the lungs were counted by naked eye. The criteria used for counting metastatic nodules are as follows: whitish and round shape, and more than 1 mm in diameter. Microscopic examination was performed to further confirm the identity of metastatic foci in addition to macroscopic observation. Lungs for pathological examination were formalin-fixed, paraffin-embedded, then sectioned 4 μm thick and stained with H&E. For the tumor xenograft assay, mice were injected subcutaneously with 1×10⁵ cells. Tumor volume (V) was measured every two days and calculated with the formula V= (length×width2)/2.
Study approval
The use of human NPC tissues was reviewed and approved by the Ethical Committee of Sun Yat-sen University Cancer Center (GZR2016-105), and informed consent was obtained. The samples were retrospectively acquired from the surgical pathology archives of Sun Yat-sen University Cancer Center.
Immunohistochemistry (IHC) staining and evaluation
The formalin-fixed NPC tissue array and nasopharyngitis tissues were obtained from Sun Yat-sen University Cancer Center. All the samples were diagnosed by a clinical pathologist. The OVOL2 antigen was retrieved in EDTA pH 8.0 under high pressure, nonspecific antigens were blocked with goat serum for 30 min at room temperature, and the samples were incubated overnight at 4 °C with the OVOL2 antibody (1:50, Novus). The IHC slides were scored by two independent pathologists. A semi-quantitative scoring criterion was used for the IHC results whereby both the staining intensity and positive areas were recorded. The staining index (values 0-12) was obtained by multiplying the intensity of OVOL2-positive stain (negative, 0; weak, 1; moderate, 2; or strong, 3) with the proportion of immunopositive cells of interest (<25%, 1; 25-50%, 2; 50-75%, 3; or >75%, 4). All scores were subdivided into two categories according to a cutoff value of the receiver operating characteristic (ROC) curve in the study cohort: low expression (≤3) and high expression (>3). For the histological evaluation, mouse lung metastatic nodules were resected, fixed with 4% paraformaldehyde, and subjected to histological analysis.
Bisulfite treatment and methylation-specific PCR (MSP)
Bisulfite modification of genomic DNA and methylation-specific PCR were carried out as described previously [46]. Methylated and unmethylated MSP primer sets targeted the same CpG site on the OVOL2 promoter and were verified to not amplify non-bisulfite-treated genomic DNA: OVOL2 m1: 5'-AGGTTGGGAGTCGTTAGGC, OVOL2 m4: 5'-CGCTAAAAACAACGACGACG; OVOL2 u1: 5'-GAGGTTGGGAGTTGTTAGGT, OVOL2 u4: 5'-CCCACTAAAAACAACAACAACA.
Colony formation, cell proliferation assays and statistical analyses
All procedures were carried out as described previously [44].
Abbreviations
CSC: cancer stem cell; EMT: epithelial-mesenchymal transition; MET: mesenchymal-epithelial transition; NPC: nasopharyngeal carcinoma; OVOL2: Ovo Like Zinc Finger 2
Supplementary Material
Supplementary figures.
Acknowledgements
This study was supported by the National Natural Science Foundation of China (No. 81302370, 81672980), the Key Program of the National Natural Science Foundation of China (No. 81430059), the National Key R&D Program of China (No. 2016YF0902000, 2017YFA0505600), the Health & Medical Collaborative Innovation Project of Guangzhou City, China (No. 201400000001), the Key Program of Sun Yat-sen University (16ykjc33) and the Foundation of the Ministry of Science and Technology of Guangdong Province (No. 2015B050501005).
Competing Interests
The authors have declared that no competing interest exists.
References
1. Wei KR, Zheng RS, Zhang SW, Liang ZH, Ou ZX, Chen WQ. Nasopharyngeal carcinoma incidence and mortality in China in 2010. Chin J Cancer. 2014;33:381-7
2. Kamran SC, Riaz N, Lee N. Nasopharyngeal carcinoma. Surg Oncol Clin N Am. 2015;24:547-61
3. Chua ML, Wee JT, Hui EP, Chan AT. Nasopharyngeal carcinoma. Lancet. 2016;387:1012-24
4. Shibue T, Weinberg RA. EMT, CSCs, and drug resistance: the mechanistic link and clinical implications. Nat Rev Clin Oncol. 2017;14:611-29
5. Thiery JP, Acloque H, Huang RY, Nieto MA. Epithelial-mesenchymal transitions in development and disease. Cell. 2009;139:871-90
6. Nakaya Y, Sheng G. EMT in developmental morphogenesis. Cancer Lett. 2013;341:9-15
7. Nieto MA, Huang RY, Jackson RA, Thiery JP. Emt: 2016. Cell. 2016;166:21-45
8. Shibue T, Weinberg RA. EMT, CSCs, and drug resistance: the mechanistic link and clinical implications. Nat Rev Clin Oncol. 2017
9. Tam WL, Weinberg RA. The epigenetics of epithelial-mesenchymal plasticity in cancer. Nat Med. 2013;19:1438-49
10. Lamouille S, Xu J, Derynck R. Molecular mechanisms of epithelial-mesenchymal transition. Nat Rev Mol Cell Biol. 2014;15:178-96
11. Zheng X, Carstens JL, Kim J, Scheible M, Kaye J, Sugimoto H. et al. Epithelial-to-mesenchymal transition is dispensable for metastasis but induces chemoresistance in pancreatic cancer. Nature. 2015;527:525-30
12. Fischer KR, Durrans A, Lee S, Sheng J, Li F, Wong ST. et al. Epithelial-to-mesenchymal transition is not required for lung metastasis but contributes to chemoresistance. Nature. 2015;527:472-6
13. Mani SA, Guo W, Liao MJ, Eaton EN, Ayyanan A, Zhou AY. et al. The epithelial-mesenchymal transition generates cells with properties of stem cells. Cell. 2008;133:704-15
14. Wellner U, Schubert J, Burk UC, Schmalhofer O, Zhu F, Sonntag A. et al. The EMT-activator ZEB1 promotes tumorigenicity by repressing stemness-inhibiting microRNAs. Nat Cell Biol. 2009;11:1487-95
15. Yang J, Mani SA, Donaher JL, Ramaswamy S, Itzykson RA, Come C. et al. Twist, a master regulator of morphogenesis, plays an essential role in tumor metastasis. Cell. 2004;117:927-39
16. Tsai JH, Donaher JL, Murphy DA, Chau S, Yang J. Spatiotemporal regulation of epithelial-mesenchymal transition is essential for squamous cell carcinoma metastasis. Cancer Cell. 2012;22:725-36
17. Celia-Terrassa T, Meca-Cortes O, Mateo F, Martinez de Paz A, Rubio N, Arnal-Estape A. et al. Epithelial-mesenchymal transition can suppress major attributes of human epithelial tumor-initiating cells. J Clin Invest. 2012;122:1849-68
18. Li B, Dai Q, Li L, Nair M, Mackay DR, Dai X. Ovol2, a mammalian homolog of Drosophila ovo: gene structure, chromosomal mapping, and aberrant expression in blind-sterile mice. Genomics. 2002;80:319-25
19. Kumar A, Bhandari A, Sinha R, Sardar P, Sushma M, Goyal P. et al. Molecular phylogeny of OVOL genes illustrates a conserved C2H2 zinc finger domain coupled by hypervariable unstructured regions. PLoS One. 2012;7:e39399
20. Oliver B, Perrimon N, Mahowald AP. The ovo locus is required for sex-specific germ line maintenance in Drosophila. Genes Dev. 1987;1:913-23
21. Hayashi M, Shinozuka Y, Shigenobu S, Sato M, Sugimoto M, Ito S. et al. Conserved role of Ovo in germline development in mouse and Drosophila. Sci Rep. 2017;7:40056
22. Mackay DR, Hu M, Li B, Rheaume C, Dai X. The mouse Ovol2 gene is required for cranial neural tube development. Dev Biol. 2006;291:38-52
23. Watanabe K, Villarreal-Ponce A, Sun P, Salmans ML, Fallahi M, Andersen B. et al. Mammary morphogenesis and regeneration require the inhibition of EMT at terminal end buds by Ovol2 transcriptional repressor. Dev Cell. 2014;29:59-74
24. Unezaki S, Horai R, Sudo K, Iwakura Y, Ito S. Ovol2/Movo, a homologue of Drosophila ovo, is required for angiogenesis, heart formation and placental development in mice. Genes Cells. 2007;12:773-85
25. Kitazawa K, Hikichi T, Nakamura T, Mitsunaga K, Tanaka A, Nakamura M. et al. OVOL2 Maintains the Transcriptional Program of Human Corneal Epithelium by Suppressing Epithelial-to-Mesenchymal Transition. Cell Rep. 2016;15:1359-68
26. Roca H, Hernandez J, Weidner S, McEachin RC, Fuller D, Sud S. et al. Transcription factors OVOL1 and OVOL2 induce the mesenchymal to epithelial transition in human cancer. PLoS One. 2013;8:e76773
27. Wang ZH, Li Z, Hu M, Yang QJ, Yan S, Wu RS. et al. Ovol2 gene inhibits the Epithelial-to-Mesenchymal Transition in lung adenocarcinoma by transcriptionally repressing Twist1. Gene. 2017;600:1-8
28. Ito T, Tsuji G, Ohno F, Nakahara T, Uchi H, Furue M. Potential role of the OVOL1-OVOL2 axis and c-Myc in the progression of cutaneous squamous cell carcinoma. Mod Pathol. 2017;30:919-27
29. Ye GD, Sun GB, Jiao P, Chen C, Liu QF, Huang XL. et al. OVOL2, an Inhibitor of WNT Signaling, Reduces Invasive Activities of Human and Mouse Cancer Cells and Is Down-regulated in Human Colorectal Tumors. Gastroenterology. 2016;150:659-71 e16
30. Wu RS, Hong JJ, Wu JF, Yan S, Wu D, Liu N. et al. OVOL2 antagonizes TGF-beta signaling to regulate epithelial to mesenchymal transition during mammary tumor metastasis. Oncotarget. 2017;8:39401-16
31. Qian CN, Berghuis B, Tsarfaty G, Bruch M, Kort EJ, Ditlev J. et al. Preparing the "soil": the primary tumor induces vasculature reorganization in the sentinel lymph node before the arrival of metastatic cancer cells. Cancer Res. 2006;66:10365-76
32. Barretina J, Caponigro G, Stransky N, Venkatesan K, Margolin AA, Kim S. et al. The Cancer Cell Line Encyclopedia enables predictive modelling of anticancer drug sensitivity. Nature. 2012;483:603-7
33. Grooteclaes ML, Frisch SM. Evidence for a function of CtBP in epithelial gene regulation and anoikis. Oncogene. 2000;19:3823-8
34. Brinkman AB, Gu H, Bartels SJ, Zhang Y, Matarese F, Simmer F. et al. Sequential ChIP-bisulfite sequencing enables direct genome-scale investigation of chromatin and DNA methylation cross-talk. Genome Res. 2012;22:1128-38
35. Hanze J, Henrici M, Hegele A, Hofmann R, Olbert PJ. Epithelial mesenchymal transition status is associated with anti-cancer responses towards receptor tyrosine-kinase inhibition by dovitinib in human bladder cancer cells. BMC Cancer. 2013;13:589
36. Fu H, Qi L, Chen L, He Y, Zhang N, Guo H. Expression of Ovol2 is related to epithelial characteristics and shows a favorable clinical outcome in hepatocellular carcinoma. Onco Targets Ther. 2016;9:5963-73
37. Lee B, Villarreal-Ponce A, Fallahi M, Ovadia J, Sun P, Yu QC. et al. Transcriptional mechanisms link epithelial plasticity to adhesion and differentiation of epidermal progenitor cells. Dev Cell. 2014;29:47-58
38. Lee B, Watanabe K, Haensel D, Sui JY, Dai X. Overexpression of Transcription Factor Ovol2 in Epidermal Progenitor Cells Results in Skin Blistering. J Invest Dermatol. 2017;137:1805-8
39. Davidson AE, Liskova P, Evans CJ, Dudakova L, Noskova L, Pontikos N. et al. Autosomal-Dominant Corneal Endothelial Dystrophies CHED1 and PPCD1 Are Allelic Disorders Caused by Non-coding Mutations in the Promoter of OVOL2. Am J Hum Genet. 2016;98:75-89
40. Hong T, Watanabe K, Ta CH, Villarreal-Ponce A, Nie Q, Dai X. An Ovol2-Zeb1 Mutual Inhibitory Circuit Governs Bidirectional and Multi-step Transition between Epithelial and Mesenchymal States. PLoS Comput Biol. 2015;11:e1004569
41. Wells J, Lee B, Cai AQ, Karapetyan A, Lee WJ, Rugg E. et al. Ovol2 suppresses cell cycling and terminal differentiation of keratinocytes by directly repressing c-Myc and Notch1. J Biol Chem. 2009;284:29125-35
42. Schmidt JM, Panzilius E, Bartsch HS, Irmler M, Beckers J, Kari V. et al. Stem-cell-like properties and epithelial plasticity arise as stable traits after transient Twist1 activation. Cell Rep. 2015;10:131-9
43. Kim YS, Yi BR, Kim NH, Choi KC. Role of the epithelial-mesenchymal transition and its effects on embryonic stem cells. Exp Mol Med. 2014;46:e108
44. Lian YF, Yuan J, Cui Q, Feng QS, Xu M, Bei JX. et al. Upregulation of KLHDC4 Predicts a Poor Prognosis in Human Nasopharyngeal Carcinoma. PLoS One. 2016;11:e0152820
45. Feng L, Huang J, Chen J. MERIT40 facilitates BRCA1 localization and DNA damage repair. Genes Dev. 2009;23:719-28
46. Li L, Li C, Mao H, Du Z, Chan WY, Murray P. et al. Epigenetic inactivation of the CpG demethylase TET1 as a DNA methylation feedback loop in human cancers. Sci Rep. 2016;6:26591
Author contact
![]() Corresponding author: Miao Xu, Email: Xumiaoorg.cn, Tel: +86-20-87342311; Yi-Xin Zeng, Email: zengyxorg.cn, Tel: +86-20-8734-3190; Lin Feng, Email: fenglorg.cn, Tel: +86-20-87342626
Corresponding author: Miao Xu, Email: Xumiaoorg.cn, Tel: +86-20-87342311; Yi-Xin Zeng, Email: zengyxorg.cn, Tel: +86-20-8734-3190; Lin Feng, Email: fenglorg.cn, Tel: +86-20-87342626