Impact Factor
- Issue 14; 2026
- Issue 13; 2026
- Issue 12; 2026
- Issue 11; 2026
- Issue 10; 2026
- Volume 16; 2026
- Advance Articles
- Past Issues
- Cover Images
- Cover Suggestion
- Index & Coverage
- Special Issues
Introduction
Methods
Results
Discussion
Conclusion
Abbreviations
Acknowledgements
Supplementary Material
References
International Journal of Biological Sciences
International Journal of Medical Sciences
 Global reach, higher impact

Theranostics 2018; 8(14):3964-3973. doi:10.7150/thno.26439 This issue Cite
Research Paper
Development of an in vitro cell-sheet cancer model for chemotherapeutic screening
Jaewang Lee, Daiha Shin, Jong-Lyel Roh ![]()
Department of Otolaryngology, Asan Medical Center, University of Ulsan College of Medicine, Seoul, Republic of Korea
Received 2018-4-2; Accepted 2018-6-14; Published 2018-6-24
Abstract

Epithelial cancer grows in vivo in a microenvironment that comprises tumour, stroma, and immune cells. A three-dimensional (3D) culture model might be able to mimic the tumour microenvironment in vivo; therefore, we developed a new 3D epithelial cancer model using in vitro cell-sheet engineering and compared the results of treatment with several chemotherapeutic drugs among the 3D cell-sheet model, spheroid culture, and 2D cell culture.
Methods: The cell sheet comprised keratinocytes and a plasma fibrin matrix containing fibroblasts. Cancer spheroids with or without cancer-associated fibroblasts (CAFs) were interposed between the keratinocytes and fibrin layer. Cell growth, viability, and hypoxia were measured using the cell counting kit-8, LIVE/DEAD assay, and propidium iodide and LOX-1 staining. The morphology, invasion, and mRNA and protein expression were compared among the different cell culture models.
Results: Enhanced resistance to sorafenib and cisplatin by cancer spheroids and CAFs was more easily observed in the 3D than in the 2D model. Invasion by cancer-CAF spheroids into the fibrin matrix was more clearly observed in the 3D cell sheet. The expansion of viable cancer cells increased in the 3D cell sheet, particularly in those with CAFs, which were significantly inhibited by treatment with 10 μM sorafenib or 20 μM cisplatin (P < 0.05). TGF-β1, N-cadherin, and vimentin mRNA and protein levels were higher in the 3D cell-sheet model.
Conclusions: The 3D cell sheet-based cancer model could be applied to in vitro observation of epithelial cancer growth and invasion and to anticancer drug testing.
Keywords: Cancer model, spheroid, cell sheet, in vitro engineering, anti-cancer drug screening
Introduction
In vitro two-dimensional (2D) tissue models used in anticancer drug screening are commonly cultured in a monolayer on a flat surface, which makes it difficult to predict the actual drug effects in vivo. Cell-to-cell and cell-to-matrix interactions can be observed in tumours in vivo, but they are not observed in cancer cells cultured using the 2D model [1]. To resolve this, in vitro 3D models have been developed to mimic the in vivo cancer microenvironment [2, 3]. 3D co-culture systems involving various cell type present relevant interactions between cancer cells and stroma or stromal cells, such as stromal fibroblasts, myoepithelial cells, and luminal cells [3, 4]. The close tumour-stromal interactions can mimic the native tumour microenvironment by providing characteristics that are similar to those of tumours in vivo [5].
Epithelial cancers commonly begin in the basal stem-cell layer of the epithelium [6, 7] and are initially confined within that layer, but then grow outside the lamina propria and metastasize to the lymph nodes and distant organs. Epithelial cancers in vivo grow in a microenvironment that comprises keratinocytes, fibroblasts, the extracellular fibrin matrix, vessels, and immune cells. Tumour cells proliferate, invade, and migrate by reciprocal interactions with the stromal extracellular matrix [8]. The disease progression modifies the tissues surrounding the tumours and evolves into tumour-stromal interaction, ultimately ending in metastasis to secondary sites and resistance to therapy [9, 10]; therefore, examining the effects of anticancer drugs in preclinical tumours in vivo or in culture systems that mimic the tumour microenvironment in vitro might be worthwhile. Preclinical animal studies have been used to predict the potential clinical effectiveness and safety of anticancer drugs; however, these experiments are usually expensive, time-consuming, and often show limited quantification and extrapolatability to humans [11].
Specific in vitro 3D culture models that mimic the epithelial tumour microenvironment in vivo are lacking; therefore, we developed a new 3D epithelial cancer model using in vitro cell-sheet engineering to screen chemotherapeutic drugs. The cell sheet comprised epithelial and sub-epithelial layers consisting of keratinocytes overlaying a mixture of plasma fibrin and fibroblasts. The spheroids contained cancer cells, alone or with cancer-associated fibroblasts (CAFs), interposed between the keratinocytes and fibrin matrix layer. This study evaluated the potential usefulness of the new 3D cell-sheet model including cancer spheroids by comparing the efficacy of several chemotherapeutic drugs among the 3D cell-sheet model, spheroid culture, and 2D cell culture. Cancer cells showed enhanced invasive characteristics and resistance to chemotherapeutic agents when grown in the 3D cell sheet, which demonstrated the potential applicability of the model in reliable anticancer drug screening.
Methods
Cell line and reagents
Three head-and-neck cancer (HNC) cell lines—ANC-HN3, HN4, and HN9—which were established in our hospital, were used in this study. The cell lines were authenticated using short tandem repeat-based DNA fingerprinting and multiplex polymerase chain reaction (PCR). The cells were cultured in Eagle's minimum essential medium or Roswell Park Memorial Institute 1640 (Thermo Fisher Scientific, Waltham, MA, USA) with 10% foetal bovine serum at 37 °C in a humidified atmosphere containing 5% CO2. The cells were then exposed to cisplatin (Sigma-Aldrich, St. Louis, MO, USA) or sorafenib (Santa Cruz Biotechnology, Dallas, TX, USA) for the indicated time and at the indicated dose.
Generation of cancer spheroid and 3D mucosal sheet model
Cancer spheroids were generated using centrifugation to aggregate tumour cells under the non-adherent condition of the culture plate. A single-cell suspension of 5 × 10³ cells/well was loaded into each well of ultralow-attachment, round-bottom culture plates (Corning Inc., Corning, NY, USA). Cell aggregation to obtain aggregates ~200 μm in diameter was facilitated by centrifugation of the plate at 1,000 ×g for 10 min. Tumour cells mixed with CAFs (1:3) were also used to generate spheroids, using the same method.
The 3D cancer cell-sheet model was generated by incorporating a cancer spheroid into an oral mucosal cell sheet using the method described in our previous reports [12-14]. This study was approved by the institutional review board, and written informed consent was obtained from all participants. Briefly, small oral mucosal samples were harvested from patients who underwent trans-oral surgery. Blood (10 mL) from these patients was collected into vacutainer tubes (BD Bioscience, Franklin Lakes, NJ, USA) and the plasma was obtained by centrifugation. After washing, sterilizing, and dissociating the mucosa samples using enzymes, the epithelial and sub-epithelial layers were separated, and the oral keratinocytes and fibroblasts were cultured in vitro. For generating the 3D cancer cell-sheet model, a mixture of a plasma fibrin matrix and cultured fibroblasts was solidified in Transwell® cell-culture inserts with a 0.4-mm-pore polyester membrane (Corning) at 37 °C for 60 min. The inserts, medium, and supplements were placed in the plates. Tumour spheroids were overlaid on the fibrin matrix containing normal oral fibroblasts, and the cultured keratinocytes were seeded onto the fibrin matrix and tumour spheroid. The sheets were grown under air-liquid interface culture conditions. The tumour spheroids and 3D cell sheet were cultured for 3 days and then exposed to vehicle (control), 10 μM sorafenib, or 20 μM cisplatin for 3 days. Each experiment was conducted in triplicate.
Cell viability assays
Following exposure to cisplatin and sorafenib, cell viability was assessed using the cell counting kit-8 (CCK-8; Dojindo Molecular Technologies, Inc., Tokyo, Japan) according to the manufacturer's instructions. Control cells were exposed to an equivalent amount of vehicle. Cancer spheroids or cultured tumour cells were incubated in the CCK-8 solution for 4 h, and the supernatants were transferred to 96-well plates. Cell viability was assessed by measuring the absorbance at 450 nm using a SpectraMax M2 microplate reader (Molecular Devices, Sunnyvale, CA, USA). In addition, cell viability was evaluated using the LIVE/DEAD assay. First, tumour spheroids or tumours micro-dissected from the 3D cell sheet were washed twice with 1× Hank's balanced salt solution (HBSS; Sigma-Aldrich, St. Louis, MO, USA). Cancer spheroids or 3D cell sheets were incubated with 8 μg/mL calcein-AM (Corning) and propidium iodide (Sigma-Aldrich) in a dark room at 37 °C for 1 h. After washing twice with 1× HBSS, the spheroids and sheets were observed using a fluorescence microscope (Zeiss, Oberkochen, Germany) at an absorbance of 514 nm or 632 nm, respectively.
Visualization of hypoxia in the 3D cell-sheet model
Hypoxic cells in the 3D cancer-cell sheet were observed using the LOX-1 hypoxia probe (Organogenix Inc., Kanagawa, Japan). A 20-μM probe solution was added to the cell culture media at a final probe concentration of 2 μM. After incubation at 37 °C for 24 h, red phosphorescence in the 3D cell-sheet model was observed using a fluorescence microscope (Zeiss) at an absorbance of 616 nm. The cell sheet was also stained with 8 μg/mL calcein-AM (Corning) for co-visualization of viable cells. The area of live cells in the cancer-CAF or treatment groups was compared with that of the control of the C alone and the hypoxic cell areas relative to the control of C alone or C:CAF group.
Green fluorescent protein gene transfection
To observe the migration of cancer cells in the 3D cell sheet, ANC-HN3 cells were transfected with a green fluorescent protein (GFP) vector, pGFP (Takara Korea Biomedical Inc., Seoul, Korea), by using Lipofectamine® 2000 reagent (Thermo Fisher Scientific, Carlsbad, CA, USA) according to the manufacturer's protocol. A spheroid was made from ANC-HN3 cells transfected with pGFP, with or without CAFs (1:3), and the tumour spheroid was assembled into the mucosal cell-sheet model as described above. The growth and migration of tumour cells from the spheroid embedded in the cell sheet were observed using a fluorescence microscope (Zeiss) at an absorbance of 509 nm. Changes in viability, size, and growth area of the spheroid with or without CAFs grown in the 3D cell-sheet model were calculated. The cancer area included the spheroid plus the invasion region of the fibrin matrix. The size and area of the spheroid were compared with those on day 0.
Reverse transcription-quantitative polymerase chain reaction and immunoblotting
For mRNA and protein extraction, cancer spheroid and their expanding tumour areas in 3D cell-sheet models were micro-dissected under a microscope. Total RNA was extracted from cancer spheroids or from tumours that were micro-dissected from 3D cell sheets using a total RNA extraction kit (Thermo Fisher Scientific) according to the manufacturer's instructions. Reverse transcription-quantitative polymerase chain reaction (RT-qPCR) from 1-2 µg total RNA for each extracted sample was conducted using a SensiFAST™ SYBR® No-ROX Kit (Bioline International, Toronto, Canada) after cDNA synthesis using a SensiFAST™ cDNA Synthesis Kit (Bioline International). TGFB1, CDH2, VIM, and ACTB were amplified, and relative target mRNA levels were determined using the 2-ΔΔCt method and normalized against ACTB mRNA levels.
For western blotting, cancer spheroids or tumours micro-dissected from 3D cell sheets were lysed in cell lysis buffer (Cell Signaling Technology, Danvers, MA, USA) at 4 °C with a protease/phosphatase inhibitor cocktail (Cell Signaling Technology). Five to 15 µg of protein was resolved by sodium dodecyl sulphate polyacrylamide gel electrophoresis on 10%-15% gels, transferred to nitrocellulose or polyvinylidene difluoride membranes, and probed with primary and secondary antibodies. The following primary antibodies were used: anti-TGF-β1 (R&D Systems, Minneapolis, MN, USA), vimentin (Cell Signaling Technology), and anti-N-cadherin (BD Biosciences, San Jose, CA, USA). β-actin (BS6007M, BioWorld, Atlanta, GA, USA) served as the loading control. All antibodies were diluted to from 1:250 to 1:5000.
Statistical analyses
The data are presented as the mean ± standard error or deviation. The statistical significance of the differences among the different treatment groups was assessed using the Mann-Whitney U test in SPSS 24.0 (IBM Corporation, Armonk, NY, USA). Statistical significance was defined as a two-sided P value of < 0.05.
Results
Cancer spheroid and CAF incorporation promote resistance to chemotherapeutic agents
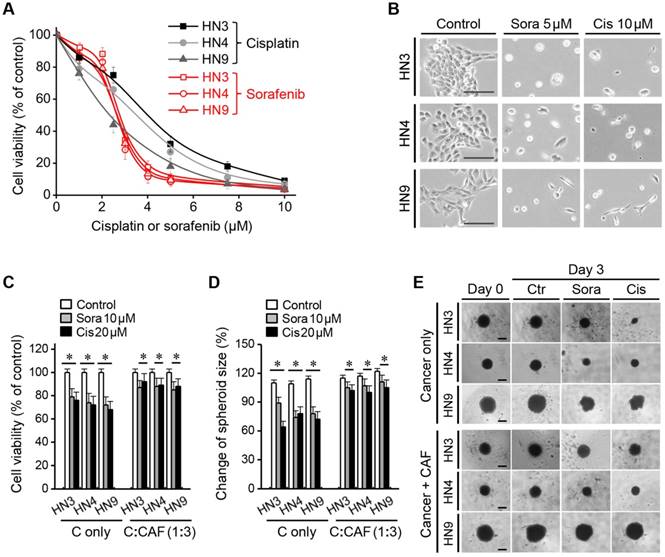
The half-maximal inhibitory concentrations (IC50) of sorafenib and cisplatin were 2.5-2.7 μM and 2.2-4.7 μM, respectively, for the three HNC cell lines grown in 2D culture plates. More than 90% of HNC cells died following treatment with <5 μM sorafenib or <10 μM cisplatin (Figure 1A-B); therefore, we used the highest concentrations (i.e., 10 μM sorafenib and 20 μM cisplatin) in subsequent experiments with cancer spheroids or 3D cell sheets. The viability of cancer spheroids after sorafenib or cisplatin treatment was much higher than that of HNC cells grown in 2D culture (Figure 1C). Incorporation of CAFs into the cancer spheroid (tumour:CAF = 1:3) resulted in even stronger resistance to 10 μM sorafenib or 20 μM cisplatin. After treatment with sorafenib and cisplatin for 3 days, cell viabilities were 72%-79% and 68%-76% in HNC spheroids without CAFs, respectively, and 85%-88% and 88%-92% in HNC spheroids with CAFs, respectively (all P < 0.05). Spheroid size was significantly decreased after sorafenib or cisplatin treatment, but the decrease was lower in cancer spheroids with CAFs than in those without CAFs (P < 0.05) (Figure 1D-E).
Cancer-associated fibroblast (CAF) incorporation in a cancer spheroid causes resistance to chemotherapeutic agents. (A-B) Viability of head-and-neck cancer cells HN3, HN4, and HN9 in a two-dimensional culture dish exposed to different concentrations of cisplatin (cis) or sorafenib (sora) for 72 h. Bars in cell images indicate 50 μm. (C-E) Viability and size changes in cancer spheroids without (C alone) or with CAFs (C:CAF = 1:3) exposed to 10 μM sorafenib or 20 μM cisplatin for 72 h. Spheroid size on day 3 was compared with that on day 0. The error bars represent the standard deviation from three replicates. *P < 0.05 relative to the control or the drug treatment groups of C alone. Bars in spheroid images indicate 100 μm.
Cancer-CAF spheroid in the 3D cell sheet shows enhanced invasive characteristics
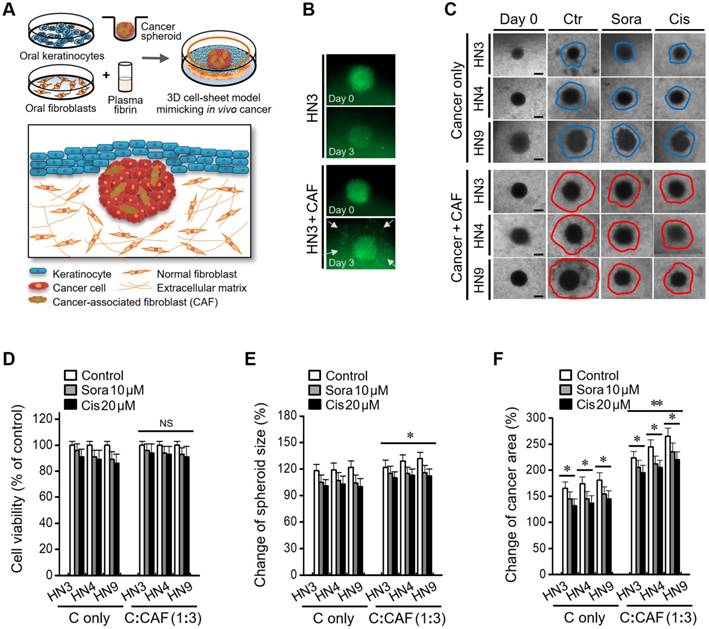
A 3D cancer cell-sheet model was successfully generated by embedding cancer spheroids into an oral mucosal cell sheet (Figure 2A and Figure S1). A cancer spheroid with pGFP-transfected HN3 cells was well visualized as green fluorescence. Cancer spheroids with CAFs appeared to be bigger and more invasive than those without CAFs (Figure 2B). Cancer spheroids with CAFs were more likely to spread into the fibrin matrix in the 3D cell-sheet model than those without CAFs (Figure 2C). Cell viability after treatment with sorafenib or cisplatin did not significantly differ between 3D cell sheets containing cancer spheroids with CAFs and those without CAFs (P > 0.05) (Figure 2D); however, spheroid size and cancer area, including the cancer spheroid and surrounding growth, were significantly larger in 3D cell sheets with CAF than in those without CAF incorporation (P < 0.05) (Figure 2E-F). Spheroid size and the cancer area were significantly changed in both cell sheets with and without CAFs after sorafenib or cisplatin treatment, but both measurements were larger in cell sheets with CAFs (P < 0.05).
A cancer-CAF spheroid in the three-dimensional (3D) cell-sheet model shows more invasive characteristics. (A) A cartoon showing a 3D cell-sheet model mimicking epithelial cancer in vivo. (B) The growth and invasion of green fluorescent protein (GFP)-tagged cancer spheroid with or without CAFs (C alone) in the 3D cell-sheet model. (C) Invasion of cancer spheroid with or without CAFs into the fibrin matrix in the 3D cell sheet. Bars in spheroid images indicate 100 μm. (D-F) Changes of viability, size, and growth area of the spheroid with or without CAFs grown in the 3D cell-sheet model and then exposed to 10 μM sorafenib or 20 μM cisplatin. The cancer area included the spheroid plus the invasion region into the fibrin matrix. The spheroid size and cancer area were compared with those on day 0. The error bars represent the standard deviation from three replicates. *P < 0.05, **P < 0.01 relative to the control or C alone.
Visualization of cancer cell viability, apoptosis, and hypoxia in the 3D cell-sheet model
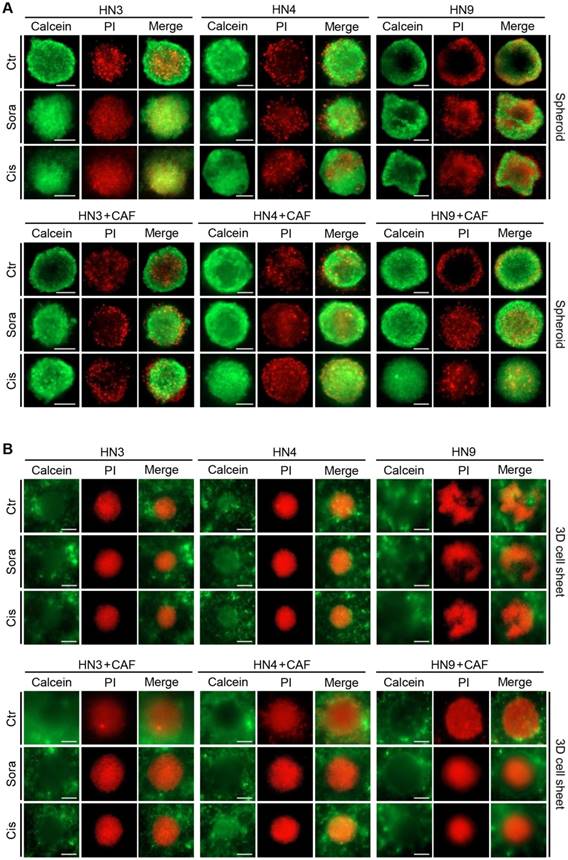
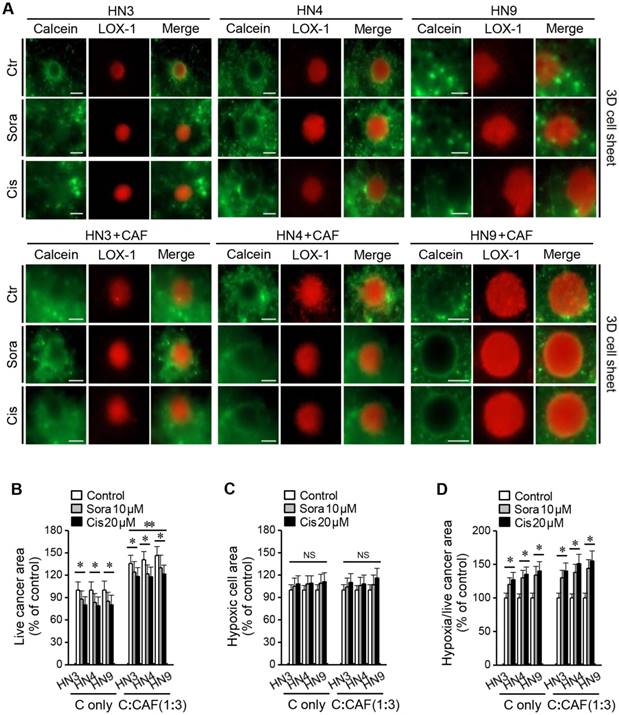
Figure 3 shows viable and dead cells in cancer spheroids and 3D cell sheets after calcein-AM and PI staining, respectively. Viable cancer cells appeared to be more expanded than the cancer spheroid in the 3D cell-sheet model. In addition, hypoxic area was observed after LOX-1 staining in the centre of cancer spheroid that was embedded into the 3D cell sheet (Figure 4A). The live cancer area was observed to be significantly larger in the 3D cell sheet with CAFs because the cancer spheroid with CAFs showed enhanced growth from its periphery into the surrounding region (P < 0.01) (Figure 4B). Although the live cancer area significantly decreased in both cell sheets with and without CAFs, it was larger in those with CAFs, regardless of sorafenib or cisplatin treatment (P < 0.05). Hypoxic areas appeared not to differ between the groups with and without CAFs (P > 0.05) (Figure 4C); however, the proportion of the hypoxic area to the live cancer area after drug treatment was significantly enlarged in cell sheets with and without CAFs because the treatment significantly decreased the live growing area (P < 0.05) (Figure 4D).
Expansion of viable cancer cells is increased in the three-dimensional (3D) cell-sheet model. Calcein-AM (green) and propidium iodide (PI, red) allow observation of viable and dead cells in the cancer spheroid (A) and 3D cell-sheet model (B) with or without CAFs. The spheroid and 3D cell sheet were exposed to vehicle control (ctr), 10 μM sorafenib, or 20 μM cisplatin for 72 h. The area of viable cells was larger in the 3D cell sheet than in the cancer spheroid because of a more peripheral spread of cancer cells in the 3D cell-sheet model. Bars indicate 100 μm.
Hypoxia observed in the 3D cell-sheet model. (A) Hypoxic cells were detected with LOX-1 staining (red) and live cells with calcein-AM (green). (B) Areas of live and hypoxic cells were measured in the 3D cell sheet with or without CAFs (C alone) at 72 h after exposure to vehicle control, 10 μM sorafenib, or 20 μM cisplatin. The areas of live cells in the cancer-CAFs or treatment groups were compared to the control of C alone and the hypoxic cell areas were relative to the control of C alone or the C:CAF group. Bars indicate 100 μm. The error bars represent the standard deviation from three replicates. *P < 0.05 relative to the control or the C alone.
Molecular expression levels in spheroids and cell sheets with or without CAFs
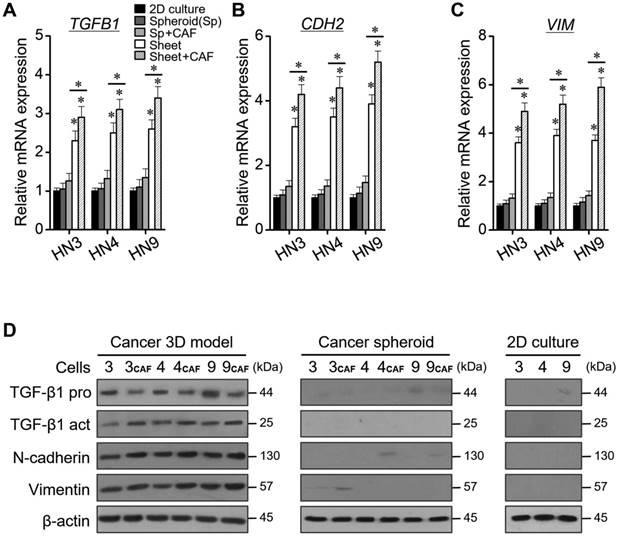
The relative mRNA levels of TGB1, CDH2, and VIM were significantly higher in cancers grown in the 3D cell sheet than in 2D monolayers or cancer spheroids, for all three HNC cell lines (P < 0.05) (Figure 5A-C). The mRNA levels were also higher in cancer cells grown in the 3D cell sheet with CAFs than in those grown in sheet without CAFs (P < 0.05). The protein levels of TGF-β1, N-cadherin, and vimentin were also much higher in cancer cells grown in the 3D cell-sheet model than in the 2D cultures or cancer spheroids (P < 0.05) (Figure 5D). The protein levels also appeared to be higher in cancer cells grown in the 3D cell-sheet model than in the cancer spheroid alone, and in 3D cell sheets with CAFs than in those without CAFs.
Levels of relative mRNA and protein expression according to 2D monolayer culture, spheroid, 3D cell sheet, and CAF incorporation. (A-C) Quantification of TGB1, CDH2, and VIM mRNAs. The error bars represent the standard deviation from three replicates. *P < 0.05 relative to the control or between cell sheet groups. (D) Western blotting of TGF-β1 (pro- and active forms), N-cadherin, and vimentin protein expression. β-actin was the loading control.
Discussion
The present study showed the usefulness of a 3D cell-sheet model that was tested for cancer growth, invasion, and anticancer drug screening. We developed a new 3D cell-sheet model that included a cancer spheroid interposed between oral keratinocytes and plasma fibrin with oral fibroblasts. Cancer-CAFs in the new 3D cell-sheet model showed enhanced invasive characteristics and resistance to chemotherapeutic agents. The expansion of viable cancer cells into the adjacent extracellular matrix with oral fibroblasts was greater in the 3D cell-sheet model than in a 2D model or cancer spheroid. Hypoxia was observed in the cancer spheroid grown in the 3D cell-sheet model. The mRNA and protein levels of proliferation and invasion markers, TGF-β1, N-cadherin, and vimentin, were higher in cancer cells grown in the 3D cell sheet; therefore, our study showed the potential applicability of our new model to reliable anticancer drug testing.
Our newly developed 3D cell-sheet model for anticancer drug testing involved embedding a cancer spheroid into an oral mucosal cell sheet. We previously developed an in vitro engineered autologous mucosal cell sheet consisting of oral keratinocytes and plasma fibrin containing oral mucosal fibroblasts [12-14]. The mucosal cell sheet promoted wound healing in the oral cavity and skin, with minimal scar formation [13, 14]. Furthermore, we developed a 3D cell-sheet model with cancer alone or cancer-CAFs interposed between keratinocyte and fibrin-fibroblast layers. Epithelial cancers arising in the upper aerodigestive tract commonly initiate in the basal stem-cell layer of the epithelium, grow over the basement membrane, and invade into local surrounding tissues [6]. Our newly developed model provides structural and histological similarities with epithelial cancers, showing the close relationship among cancer cells, CAFs, and the extracellular matrix and fibroblasts. A biomimetic model with fibrin gel is known to be an applicable 3D culture system by which to screen anticancer drug efficacy by observing changes in proliferation, invasion, and migration of cancer spheroid cells [15, 16]. Our model involved fibrin from blood plasma that contained oral fibroblasts, which facilitate the induction of collagen and vessel formation in wounds [17, 18], and might provide an appropriate mimic of the tumour microenvironment in vivo. The microenvironment including keratinocytes might also direct cancer spheroid cells into epithelial-mesenchymal transition (EMT) [19].
Our study showed that spheroid and CAFs promoted cancer cell resistance to cisplatin and sorafenib. For anticancer drug screening, cancer cells are commonly cultured in a 2D monolayer in a flat-bottomed plate. A multicellular spheroid model has been shown to more reliably predict the clinical responses of cancers to agents [20, 21]. A previous study showed that proliferation rates were more divergent in HNC cells grown in a 3D model than those in a 2D model, which might contribute to the observed differential response rates to increasing doses of cisplatin and irradiation [20]. Immunohistochemical analyses of proliferation and angiogenesis protein markers might better reflect the characteristics of cancers grown in 3D spheroid culture than in those grown in 2D culture [20]. A recent study also showed that HNC cells in 2D culture led to death by plasma-activated medium and H2O2; however, 3D tumour spheroids were rapidly regrown to be resistant to that treatment [21]. The different results in 2D and 3D culture systems might be explained by the fact that the 3D tumour microenvironment modulates the anticancer drug response [22]. In addition, CAFs are known to contribute to acquired chemotherapeutic resistance in cancer cells through the interaction between cancer cells and stroma [23, 24]. CAFs have been suggested to protect cancer cells from cetuximab treatment by inducing MMP-1 [25]. An escape from cancer therapy can be mediated by the adhesion of cancer cells to the extracellular matrix proteins collagen, laminin, and fibronectin [26]. CAFs also increase hyaluronan production, which increases resistance in drug-sensitive cancer cells [27]. CAFs function in a manner similar to that of myofibroblasts that secrete interleukin-6 (IL-6), which plays an important role in tumour proliferation, migration, and angiogenesis [28]. An increase in IL-6 promotes cancer-cell metastasis by inducing EMT [29]. Our study supported the previous findings that CAF incorporation into a cancer spheroid enhances resistance to chemotherapeutic agents. Furthermore, our new model allows examining the growth and invasion of cancer cells by mimicking the in vivo tumour microenvironment better than either the 2D monolayer model or the 3D cancer spheroid alone.
The cancer-CAF spheroid in our new 3D cell-sheet model showed enhanced invasive characteristics. The increased local invasion of cancer spheroid cells might also be reflected by the increase in cell proliferation levels and EMT markers. Our data from the new 3D model support the previous suggestion that the examination of mutual interplay between the tumour and its microenvironment is crucial in cancer research [30]. A synergistic interaction between the tumour and its microenvironment facilitates tumour growth and dissemination, as first suggested in Paget's “seed and soil” hypothesis [31]. The fibrin matrix and CAFs promote EMT of cancer spheroid cells by losing epithelial properties and gaining invasive mesenchymal properties [30, 32]. Furthermore, our model provides improved therapeutic evaluation of anticancer drugs. A previous report showed that the efficacy of drugs is better examined in a multicellular tumour spheroid that is cultured in collagen matrix gel [33]. 3D biomimetic model can also examine the resistance of epithelial cancer cells to various drugs by exploring cell-matrix interactions [34]. In addition, the 3D model allow for stable long-term culture, reportedly for up to 28 days, and reflect the pathophysiological events in cancer patients in terms of the evaluation of anticancer chemosensitivity better than 2D monolayers [34]. Hypoxia was also observed in the cancer spheroids in our 3D model system. The increase in the hypoxic area relative to the total cancer area in our study might be associated with resistance to sorafenib or cisplatin. A previous study suggested that the extent and pattern of hypoxia within multicellular tumour spheroids that are cultured in a 3D collagen matrix help in evaluating tumour phenotypic function and anticancer drug screening [35]. Drug resistance can be mediated by functional interactions between hypoxia-inducible factors and cell-death pathways in hypoxic tumour spheroid cells and the surrounding matrix [35, 36]. Our 3D model system might also provide information to help improve sensitivity to anticancer drugs on the basis of hypoxia in tumour spheroids cultured in the 3D cell-sheet model.
Drug penetration into and metabolism by cancer cells might be questionable in the 3D culture system; however, this issue can be resolved by introducing a microfluidic system into the 3D culture model [37]. Microfluidic 3D models include endothelial sprouts and neovessels with pro-angiogenic factors, allowing vessel formation and drug delivery to the tumour spheroids [38]. A co-culture with endothelial cells in the tumour spheroid or matrix allows for new vessel formation, the initiation of EMT, and the mobilization of tumour cells [39]. The 3D cell-sheet model containing endothelial cells might better replicate the physiological landscape of tumour tissue in vivo; therefore, our new 3D model will be further developed to include endothelial progenitor cells within the fibrin matrix layer containing fibroblasts [40]. This would provide a tumour microenvironment that more comprehensively mimics the progression of human solid tumours than our current 3D model does and should be examined in further studies. In addition, in vitro models mimicking the observed side effects of and resistance to drugs might be very useful and should be examined in future studies.
Conclusion
The present study showed the potential of our newly developed 3D epithelial cancer model produced by in vitro cell-sheet engineering for comparing the results of chemotherapeutic drug screening among the 3D cell-sheet model, spheroid culture, and 2D cell culture. Cancer cells and CAFs showed more extensive growth and invasion into the adjacent fibrin matrix in our 3D cell-sheet model. Cancer-CAF spheroids grown in the 3D cell-sheet model were more resistant to several chemotherapeutic agents, and the model provided molecular evidence of increased levels of proliferation and EMT markers; therefore, our 3D cell-sheet model might be applicable to in vitro observation of epithelial cancer growth and invasion and to anticancer drug testing.
Abbreviations
3D: three-dimensional; CAFs: cancer-associated fibroblasts; CCK-8: cell counting kit-8; EMT: epithelial-mesenchymal transition; GFP: green fluorescent protein; HNC: head-and-neck cancer; RT-qPCR: reverse transcription-quantitative polymerase chain reaction.
Acknowledgements
This study was supported by grants (no. HI15C2920) from the Korean Health Technology R&D Project through the Korea Health Industry Development Institute (KHIDI), Ministry of Health & Welfare, Seoul, Republic of Korea.
Supplementary Material
Supplementary figure.
Competing Interests
The authors have declared that no competing interest exists.
References
1. Cukierman E, Pankov R, Stevens DR, Yamada KM. Taking cell-matrix adhesions to the third dimension. Science. 2001;294:1708-12
2. Xu X, Farach-Carson MC, Jia X. Three-dimensional in vitro tumor models for cancer research and drug evaluation. Biotechnol Adv. 2014;32:1256-68
3. Unger C, Kramer N, Walzl A, Scherzer M, Hengstschlager M, Dolznig H. Modeling human carcinomas: physiologically relevant 3D models to improve anti-cancer drug development. Adv Drug Deliv Rev. 2014;79-80:50-67
4. Costa EC, Moreira AF, de Melo-Diogo D, Gaspar VM, Carvalho MP, Correia IJ. 3D tumor spheroids: an overview on the tools and techniques used for their analysis. Biotechnol Adv. 2016;34:1427-41
5. Nath S, Devi GR. Three-dimensional culture systems in cancer research: Focus on tumor spheroid model. Pharmacol Ther. 2016;163:94-108
6. Tang XH, Scognamiglio T, Gudas LJ. Basal stem cells contribute to squamous cell carcinomas in the oral cavity. Carcinogenesis. 2013;34:1158-64
7. Lu TL, Huang YF, You LR, Chao NC, Su FY, Chang JL. et al. Conditionally ablated Pten in prostate basal cells promotes basal-to-luminal differentiation and causes invasive prostate cancer in mice. Am J Pathol. 2013;182:975-91
8. Murata T, Mizushima H, Chinen I, Moribe H, Yagi S, Hoffman RM. et al. HB-EGF and PDGF mediate reciprocal interactions of carcinoma cells with cancer-associated fibroblasts to support progression of uterine cervical cancers. Cancer Res. 2011;71:6633-42
9. Joyce JA, Pollard JW. Microenvironmental regulation of metastasis. Nat Rev Cancer. 2009;9:239-52
10. Psaila B, Lyden D. The metastatic niche: adapting the foreign soil. Nat Rev Cancer. 2009;9:285-93
11. Knobloch J, Ruther U. Shedding light on an old mystery: thalidomide suppresses survival pathways to induce limb defects. Cell Cycle. 2008;7:1121-7
12. Roh JL, Lee J, Jang H, Kim EH, Shin D. Use of oral mucosal cell sheets for accelerated oral surgical wound healing. Head Neck. 2018;40:394-401
13. Roh JL, Jang H, Lee J, Kim EH, Shin D. Promotion of oral surgical wound healing using autologous mucosal cell sheets. Oral Oncol. 2017;69:84-91
14. Roh JL, Lee J, Kim EH, Shin D. Plasticity of oral mucosal cell sheets for accelerated and scarless skin wound healing. Oral Oncol. 2017;75:81-8
15. Bayat N, Ebrahimi-Barough S, Norouzi-Javidan A, Saberi H, Tajerian R, Ardakan MMM. et al. Apoptotic effect of atorvastatin in glioblastoma spheroids tumor cultured in fibrin gel. Biomed Pharmacother. 2016;84:1959-66
16. Bayat N, Ebrahimi-Barough S, Norouzi-Javidan A, Saberi H, Ardakan MMM, Ai A. et al. Anti-inflammatory effects of Atorvastatin by suppressing TRAF3IP2 and IL-17RA in human glioblastoma spheroids cultured in a three-dimensional model: Possible relevance to glioblastoma treatment. Mol Neurobiol. 2018;55:2102-10
17. Sclafani AP, McCormick SA. Induction of dermal collagenesis, angiogenesis, and adipogenesis in human skin by injection of platelet-rich fibrin matrix. Arch Facial Plast Surg. 2012;14:132-6
18. Martinez-Santamaria L, Conti CJ, Llames S, Garcia E, Retamosa L, Holguin A. et al. The regenerative potential of fibroblasts in a new diabetes-induced delayed humanised wound healing model. Exp Dermatol. 2013;22:195-201
19. Chandrasekaran S, Giang UB, King MR, DeLouise LA. Microenvironment induced spheroid to sheeting transition of immortalized human keratinocytes (HaCaT) cultured in microbubbles formed in polydimethylsiloxane. Biomaterials. 2011;32:7159-68
20. Kadletz L, Heiduschka G, Domayer J, Schmid R, Enzenhofer E, Thurnher D. Evaluation of spheroid head and neck squamous cell carcinoma cell models in comparison to monolayer cultures. Oncol Lett. 2015;10:1281-6
21. Nofel M, Chauvin J, Vicendo P, Judee F. Effects of Plasma Activated medium on head and neck FaDu cancerous cells: comparison of 3D and 2D response. Anticancer Agents Med Chem. 2017
22. Ekert JE, Johnson K, Strake B, Pardinas J, Jarantow S, Perkinson R. et al. Three-dimensional lung tumor microenvironment modulates therapeutic compound responsiveness in vitro-implication for drug development. PLoS One. 2014;9:e92248
23. Li XY, Hu SQ, Xiao L. The cancer-associated fibroblasts and drug resistance. Eur Rev Med Pharmacol Sci. 2015;19:2112-9
24. Meads MB, Gatenby RA, Dalton WS. Environment-mediated drug resistance: a major contributor to minimal residual disease. Nat Rev Cancer. 2009;9:665-74
25. Fiaschi T, Giannoni E, Taddei ML, Cirri P, Marini A, Pintus G. et al. Carbonic anhydrase IX from cancer-associated fibroblasts drives epithelial-mesenchymal transition in prostate carcinoma cells. Cell Cycle. 2013;12:1791-801
26. Paraiso KH, Smalley KS. Fibroblast-mediated drug resistance in cancer. Biochem Pharmacol. 2013;85:1033-41
27. Misra S, Ghatak S, Zoltan-Jones A, Toole BP. Regulation of multidrug resistance in cancer cells by hyaluronan. J Biol Chem. 2003;278:25285-8
28. Nagasaki T, Hara M, Nakanishi H, Takahashi H, Sato M, Takeyama H. Interleukin-6 released by colon cancer-associated fibroblasts is critical for tumour angiogenesis: anti-interleukin-6 receptor antibody suppressed angiogenesis and inhibited tumour-stroma interaction. Br J Cancer. 2014;110:469-78
29. Yadav A, Kumar B, Datta J, Teknos TN, Kumar P. IL-6 promotes head and neck tumor metastasis by inducing epithelial-mesenchymal transition via the JAK-STAT3-SNAIL signaling pathway. Mol Cancer Res. 2011;9:1658-67
30. Catalano V, Turdo A, Di Franco S, Dieli F, Todaro M, Stassi G. Tumor and its microenvironment: a synergistic interplay. Semin Cancer Biol. 2013;23:522-32
31. Paget S. The distribution of secondary growths in cancer of the breast. 1889. Cancer Metastasis Rev. 1989;8:98-101
32. Moustakas A, Heldin CH. Signaling networks guiding epithelial-mesenchymal transitions during embryogenesis and cancer progression. Cancer Sci. 2007;98:1512-20
33. Le VM, Lang MD, Shi WB, Liu JW. A collagen-based multicellular tumor spheroid model for evaluation of the efficiency of nanoparticle drug delivery. Artif Cells Nanomed Biotechnol. 2016;44:540-4
34. Loessner D, Stok KS, Lutolf MP, Hutmacher DW, Clements JA, Rizzi SC. Bioengineered 3D platform to explore cell-ECM interactions and drug resistance of epithelial ovarian cancer cells. Biomaterials. 2010;31:8494-506
35. Ma J, Zhang X, Liu Y, Yu H, Liu L, Shi Y. et al. Patterning hypoxic multicellular spheroids in a 3D matrix - a promising method for anti-tumor drug screening. Biotechnol J. 2016;11:127-34
36. Rohwer N, Cramer T. Hypoxia-mediated drug resistance: novel insights on the functional interaction of HIFs and cell death pathways. Drug Resist Updat. 2011;14:191-201
37. LaBonia GJ, Lockwood SY, Heller AA, Spence DM, Hummon AB. Drug penetration and metabolism in 3D cell cultures treated in a 3D printed fluidic device: assessment of irinotecan via MALDI imaging mass spectrometry. Proteomics. 2016;16:1814-21
38. Sung KE, Beebe DJ. Microfluidic 3D models of cancer. Adv Drug Deliv Rev. 2014;79-80:68-78
39. Ehsan SM, Welch-Reardon KM, Waterman ML, Hughes CC, George SC. A three-dimensional in vitro model of tumor cell intravasation. Integr Biol (Camb). 2014;6:603-10
40. Lee J, Kim EH, Shin D, Roh JL. Accelerated oral wound healing using a pre-vascularized mucosal cell sheet. Sci Rep. 2017;7:10667
Author contact
![]() Corresponding author: Jong-Lyel Roh, MD, PhD, Department of Otolaryngology, Asan Medical Center, University of Ulsan College of Medicine, 88 Olympic-ro 43-gil, Songpa-gu, Seoul 05505, Republic of Korea. Phone: +82-2-3010-3965; Fax: +82-2-489-2773; E-mail: rohjlseoul.kr
Corresponding author: Jong-Lyel Roh, MD, PhD, Department of Otolaryngology, Asan Medical Center, University of Ulsan College of Medicine, 88 Olympic-ro 43-gil, Songpa-gu, Seoul 05505, Republic of Korea. Phone: +82-2-3010-3965; Fax: +82-2-489-2773; E-mail: rohjlseoul.kr