Impact Factor
- Issue 14; 2026
- Issue 13; 2026
- Issue 12; 2026
- Issue 11; 2026
- Issue 10; 2026
- Volume 16; 2026
- Advance Articles
- Past Issues
- Cover Images
- Cover Suggestion
- Index & Coverage
- Special Issues
Introduction
Methods
Results
Discussion
Conclusion
Abbreviations
Supplementary Material
Acknowledgements
References
International Journal of Biological Sciences
International Journal of Medical Sciences
 Global reach, higher impact

Theranostics 2018; 8(15):4155-4169. doi:10.7150/thno.26055 This issue Cite
Research Paper
Plasma levels of heart failure biomarkers are primarily a reflection of extracardiac production
Weijie Du1,2*, Arnold Piek1*, E. Marloes Schouten1, Cees W.A. van de Kolk1, Christian Mueller3, Alexandre Mebazaa4,5, Adriaan A. Voors1, Rudolf A. de Boer1 ![]() , Herman H.W. Silljé1
, Herman H.W. Silljé1 ![]()
1. Department of Cardiology, University Medical Center Groningen, University of Groningen, The Netherlands
2. Department of Pharmacology (State-Province Key Laboratories of Biomedicine- Pharmaceutics of China, Key Laboratory of Cardiovascular Research, Ministry of Education), College of Pharmacy, Harbin Medical University, Harbin, China
3. Cardiovascular Research Institute Basel and Department of Cardiology, University Hospital Basel, Basel, Switzerland.
4. Research Medical Unit, INSERM, U-942, 'BIOmarkers in CArdioNeuroVAScular diseases', Paris, France.
5. Université Paris VII-Denis Diderot, Assistance Publique-Hôpitaux de Paris, Paris, France.Department of Anesthesiology and Critical Care Medicine, AP-HP, Saint Louis Lariboisière University Hospitals, Paris, France.
*Equal contribution
Received 2018-3-14; Accepted 2018-6-27; Published 2018-7-30
Abstract

Plasma heart failure (HF) biomarkers, like natriuretic peptides, are important in diagnosis, prognosis and HF treatment. Several novel HF biomarkers have been identified, including Gal-3, GDF-15 and TIMP-1, but their clinical potential remains vague. Here we investigated plasma biomarker levels in relation to tissue expression and structural and functional cardiac changes.
Methods: Cardiac remodeling, cardiac function, and plasma and tissue biomarker levels were investigated in mice after myocardial infarction induced by temporal and permanent LAD ligation (tLAD and pLAD). In addition, a pressure overload model induced by transverse aortic constriction (TAC) and an obese/hypertensive HFpEF-like mouse model were investigated.
Results: Plasma levels of ANP and its cardiac expression were strictly associated with cardiac remodeling and function. Gal-3, GDF-15 and TIMP-1 cardiac expressions were also related to cardiac remodeling and function, but not their plasma levels. Only directly after myocardial infarction could elevated plasma levels of Gal-3 and TIMP-1 be detected. Eight weeks after infarction, plasma levels were not elevated despite enhanced cardiac expression and low EF (18.3±3.3%, pLAD). Plasma levels of TIMP-1 and GDF-15 were elevated after TAC, but this also correlated with increased lung expression and congestion. In obese-hypertensive mice, elevated plasma levels of Gal-3, GDF-15 and TIMP1 were associated with increased adipose tissue expression and not with cardiac function.
Conclusions: The Gal-3, GDF-15 and TIMP-1 plasma pool levels are hardly influenced by dynamic changes in cardiac expression. These biomarkers are not specific for indices of cardiac remodeling, but predominantly reflect stress in other affected tissues and hence provide health information beyond the heart.
Keywords: heart failure, cardiac remodeling, biomarker, Galectin-3, GDF-15, TIMP-1
Introduction
Standard clinical examination of heart failure (HF) patients does not provide means for detailed patient stratification and therefore other tools are needed. Plasma biomarkers provide great promise to further dissect the underlying disease processes, may aid in further stratification and allow tailored therapy for HF patients [1].
Natriuretic peptides are the gold standard HF plasma biomarkers, have improved the management and evaluation of HF patients and have been included in the American Heart Association (AHA) and European Society of Cardiology (ESC) HF guidelines [2, 3]. These peptides are mainly produced and released by the heart in response to sustained wall stretch [4]. Cardiac-specific troponins were originally used as acute damage markers in diagnosis of myocardial infarction, but with the appearance of high-sensitivity troponin (hsTn) assays are now also being used as HF markers and are mentioned in the HF guidelines. Most other novel HF biomarkers appear to be non-cardiac specific [5]. Hence, the diagnostic value of these biomarkers is limited, but these biomarkers could provide essential information about underlying biological processes, like fibrosis, and aid in additive risk stratification of HF patients [6]. For this purpose, Gal-3 (Galectin-3) and sST2 (soluble suppression of tumorogenicity-2) have been included in the AHA HF guidelines [3]. Gal-3 is associated with organ fibrosis, including cardiac fibrosis, and is elevated in HF patients [4, 7, 8, 9]. sST2 is a soluble decoy receptor for IL-33 and is associated with adverse cardiac remodelling, including hypertrophy and fibrosis, by inhibiting the protective effects of IL-33 [10]. Although not yet mentioned in the HF guidelines, many other biomarkers have been identified that could act as prognostic biomarkers in HF [11]. The fibrotic marker TIMP-1 (tissue inhibitor of metalloproteinase-1), for instance, is elevated in HF [12-14] and increased levels were detected in coronary sinus blood, suggesting cardiac origin [15]. GDF-15 (growth differentiation factor-15), another emerging biomarker, is elevated in HF patients and protects the heart from cardiac damage [16-19]. Most interestingly, these biomarkers are also elevated in patients with HF with preserved ejection fraction (HFpEF), are related to disease severity and can have predictive power [20-25]. The correlation between the plasma levels of the above mentioned novel biomarkers and the presence and severity of cardiac dysfunction, and the relation to their production in other tissues, is, however, largely unknown. Understanding the origin of plasma biomarkers and whether other organs or tissues contribute to their elevated levels is therefore needed.
In contrast to clinical HF studies, preclinical animal studies allow us to investigate biomarkers at multiple levels (RNA and protein) and within multiple organs and tissues. Nevertheless, biomarker studies in small animals are hampered by the small plasma/serum volumes and the lack of appropriate reagents. We therefore focused on three novel heart failure biomarkers, Gal-3, GDF-15, and TIMP-1 and the established HF biomarker ANP, for which suitable reagents were available. We studied them in three mouse models of cardiac remodeling, including two models of HF with reduced ejection fraction (HFrEF), consisting of a myocardial infarction model and a transverse aortic constriction (MI and TAC), and one model with HFpEF characteristics generated by high fat diet (HFD) and angiotensin II (AngII) infusion (obesity/hypertension).
Methods
Animals
All animal experimental protocols were approved by the Animal Care and Use Committee of University of Groningen, The Netherlands (permit numbers: DEC6827A, DEC6920A and IVD16487-03-01) and were conducted according to the existing guidelines for the care and use of laboratory animals. Approximately 10-week-old male C57BL/6J mice were obtained from Envigo, the Netherlands. Mice were housed on a 12 h light/ 12 h dark cycle with ad libitum access to chow and water. In these exploratory studies, mice were randomized based on bodyweight. Exclusion criteria included abnormal bodyweight (>2 SD) and abnormal behavior. Prior to surgery, mice received a subcutaneous injection of Carprofen (5.0 mg/kg) to alleviate wound pain. For anesthesia, 2% isoflurane/oxygen was used. Cardiac functional measurements (MRI and pressure loops) were performed in a blinded fashion by an independent operator. Molecular and histological analyses were blinded. No mice were excluded from analysis, except for those mice that died or reached a humane endpoint before the end of the experiment.
Myocardial infarction
Myocardial infarctions (MI) were induced as previously described [26]. In brief, mice were anesthetized, intubated and placed supine on a heated pad for mechanical ventilation. To create large MIs, the left anterior descending coronary artery (LAD) was permanently ligated using a suture. To create small MIs, a temporal ligation was performed: a suture was tied onto a polyethylene tube placed on the LAD coronary artery and was removed again after 60 min. Control mice were sham operated. The experimental set-up is outlined in Figure S1A.
TAC
Transverse aortic constriction (TAC) was performed as previously described [26, 27]. In brief, mice were anesthetized, intubated and placed supine on a heated pad for mechanical ventilation. A suture was tied around a blunt 27-gauge needle placed on the aortic arch between the branchiocephalic and left carotid arteries, establishing a reproducible aortic stenosis. Control mice were sham operated. No differences were observed between 4 and 8 weeks sham-operated mice and these groups were therefore combined in later analyses. The experimental set-up is outlined in Figure S1B.
Obesity/hypertension
Mice were fed high-fat diet (HFD) (60 kcal% fat, D12492, Research diets, USA) or a control diet indicated with LFD (low fat diet) (10 kcal% fat, D12450J, Research diets, USA) for a period of 16 weeks. After 12 weeks, the diet was supplemented with a 4 week infusion of either angiotensin II (AngII) (1 mg/kg/day; Bachem, Switzerland) or saline using osmotic minipumps (Alzet 1004, Durect corporation, USA). Pumps were combined with polyetheretherketone tubing (Alzet PEEK tubing 0002612, Durect corporation, USA) to allow magnetic resonance imaging (MRI). Placement of pumps was performed as described before [7]. In brief, mice were anesthetized and placed in the prone position on a heating pad. A subcutaneous pocket was created in the right flank for pump insertion. The experimental set-up is outlined in Figure S1C.
Body mass composition
In the obesity/hypertension model, body mass composition was determined after 15 weeks of diet intervention using a minispec LF90II body composition analyzer (Bruker Optics, USA).
Magnetic resonance imaging (MRI)
Cardiac MRI was performed on anaesthetized mice using a 9.4 T, 89 mm bore size magnet equipped with 1500 mT/m gradients and connected to an advanced 400 MR system (BrukerBiospin, Germany) as previously described [26, 28]. Images were reconstructed and left ventricular end-diastolic volume (LVEDV), left ventricular end-systolic volume (LVESV) and left ventricular (LV) mass were determined using QMass® software (version MR 6.1.5, Medis Medical Imaging Systems, the Netherlands) and stroke volume (SV) and ejection fraction (EF) were calculated.
Hemodynamic measurements and sacrifice
Prior to sacrifice, hemodynamic measurements were performed using a Millar pressure transducer catheter (Mikro-Tip pressure catheter 1.4F, Transonic Scisense, Transonic Europe, The Netherlands). Mice were anaesthetized and the catheter was inserted via the right carotid artery. Heart rate, arterial pressures, left ventricular end-systolic pressure (LVESP), left ventricular end-diastolic pressure (LVEDP) and maximal and minimum rates of pressure change during contraction and relaxation, respectively dP/dtmax and dP/dtmin, were recorded. The dP/dtmax and dP/dtmin values were adjusted for LV maximal pressure (Pmax). After catheter removal, blood was collected, transferred into ethylenediaminetetraacetic acid (EDTA) tubes and immediately centrifuged at 1500×g for 10 min, followed by plasma collection. Organs were flushed with 10 mL saline to remove remaining red blood cells. Thereafter, LV and other tissues were collected. Blood plasma and tissues were frozen in liquid nitrogen and stored at -80 °C. An LV mid-slice of each heart was fixed in formalin and processed for histology and immunohistochemistry.
Immunohistochemistry
Formalin-fixed paraffin-embedded mid-transverse LV sections were cut in 4 µm thick slices and stained with Masson's trichrome to detect fibrosis. Whole stained sections were automatically imaged using a Nanozoomer 2.0 HT (Hamamatsu, Japan). Fibrosis fraction as a percentage of the entire section was quantified from a 20× magnification (ScanScope, Aperial Technologies, USA).
For ANP staining, paraffin sections were deparaffinized and, after blocking endogenous peroxidases with H2O2, these sections were incubated for 1 h at room temperature with rabbit anti-ANP (ab91250, ABCAM, UK) in PBS with 1% BSA. For Gal-3 staining, antigen retrieval was performed with 10 mM citrate buffer (pH 6.0) on deparaffinized sections and, after blocking endogenous peroxidases with H2O2, these sections were incubated for 1 h at room temperature with rat anti-Mac2 (CL8942AP, Cedarlane, Canada) in PBS with 1% BSA. For ANP, goat anti-rabbit IgG/HRP was used as secondary antibody and rabbit anti-goat IgG/HRP as tertiary antibody. For Gal-3, rabbit-anti rat IgG/HRP was used as secondary antibody. Subsequently 3, 3-diaminobenzidine (DAB) staining was performed and thereafter haematoxilin counterstaining, followed by mounting using DPX mounting medium (Sigma-Aldrich, USA). For microscopy, an Olympus BX50 microscope (Olympus, Japan) was used with 4×, 10× and 20× objectives and images were collected with an Olympus DP70 camera (Olympus, Japan).
RT-qPCR
Total RNA was isolated from organs using TRIzol reagent (Invitrogen Corporation, the Netherlands) and from visceral adipose tissue (VAT) using RNeasy lipid tissue mini kits (Qiagen, the Netherlands). cDNA was synthesized using QuantiTect Reverse Transcription kits (Qiagen, The Netherlands). RNA concentration of samples was determined by spectrophotometry (NanoDrop 2000, ThermoScientific, the Netherlands). Gene expression levels were determined using Absolute QPCR SYBR Green ROX mix (Abgene, Epsom, UK) using 7.5 ng cDNA. Real-time quantitative PCR (RT-qPCR) was performed on a C1000 Thermal Cycler CFX284 Real-Time Detection system (Bio-Rad Laboratories, The Netherlands). Gene expressions were corrected by ribosomal protein, large, P0 (36B4) reference gene expression. This gene showed minimal variation in expression between tissues, in contrast to many other reference genes (B2M, TBP, Ppia, GAPDH and PRL13A) that showed at least a 1.5-fold difference between LV and one of the tested organs (data not shown). Gene expressions in different organs were corrected by the values in LV of control mice. Oligonucleotide pairs are listed in Table S1.
ELISA and Western blot analysis of biomarkers
The following commercial enzyme-linked immunosorbent assays (ELISA) were used to determine protein levels in plasma: Gal-3 (DY1197, R&D, USA); GDF-15 (MGD150, R&D, USA); TIMP-1 (MTM100, R&D, USA); NT-proANP (BI-20892, BIOMEDICA, Austria). Plasma biomarker quantities are reported per volume of plasma.
The above-mentioned ELISA kits were also used for measurement of Gal-3, GDF-15 and TIMP-1 protein levels in cardiac, lung and adipose tissue. For LV and lung, tissue homogenization was performed in phosphate buffered saline (PBS) containing 0.5% Triton-x100 (Sigma-Aldrich, USA) and protease inhibitor (Roche 11873580001, complete, EDTA-free, Sigma-Aldrich, USA). After centrifugation at 12000 ×g for 10 min at 4 °C, the supernatants were used. For measurement of Gal-3, GDF-15 and TIMP-1 protein levels in VAT, total protein was extracted from tissues using Minute Total Protein Extraction kits for Adipose Tissues/Cultured adipocytes (Invent Biotechnologies, USA). Total lysate protein content was determined using Pierce BCA protein assay kits (ThermoScientific, USA). Tissue biomarker levels determined by ELISA were corrected for total protein lysate.
The NT-proANP ELISA kit was not suitable for detection of ANP in tissue lysates and therefore detection of ANP was performed by Western blotting. Proteins were isolated from frozen organs homogenized in ice-cold lysis buffer (50 mM Tris pH 8.0, 1% NP40, 0.5% deoxycholate, 0.1% SDS, 150 mM NaCl, 1 mM PMSF, 15 mM sodium vanadate) supplemented with protease and phosphatase inhibitor cocktails (Sigma-Aldrich, USA), and from VAT using the Minute Total Protein Extraction kit for Adipose Tissues/Cultured adipocytes (Invent Biotechnologies, USA). Proteins were loaded on SDS-PAGE gels and transferred onto nitrocellulose membranes (Bio-Rad, USA). The following antibodies were used for immunoblotting: anti-ANP (ab91250, Abcam, UK); anti-GAPDH (10R-G109A, Fitzgerald, USA); anti-MAC-2 (Gal-3) (Tebu-Bio, The Netherlands); anti-rat immunoglobulins/HRP (ab6734, Abcam, USA); anti-rabbit immunoglobulins/HRP (P0448, Dako, Denmark); and rabbit anti-mouse immunoglobulins/HRP (P0260, Dako, Denmark). Signals were detected by enhanced chemiluminescence (ECL) (PerkinElmer, USA), and intensities of bands were quantified with ImageQuant LAS 4000 (GE Healthcare Eurpe GmbH, Belgium). Protein levels were corrected by GAPDH reference protein levels. Fold changes relative to internal control were calculated and shown.
Statistics
All values are presented as mean ± standard error of the mean (SEM). Student's paired two-tailed t-test was used for two-group comparisons and one-way analysis of variance (ANOVA) followed by Tukey's post-hoc correction for multigroup comparisons. For non-normally distributed data or data without homogeneity of variance, non-parametric tests were performed. In this case, Mann-Whitney tests were used for two group comparisons and Kruskal-Wallis followed by Mann-Whitney tests for multiple group comparisons. Normality of data and homogeneity of variance were tested using the Shapiro-Wilk test for normality and Levene's test for homogeneity of variances, respectively. Correlation was determined using Spearman's correlation test. P < 0.05 was considered to be significant. SPSS software (IBM SPSS statistics, version 22, IBM, USA) was used for statistical analyses.
Results
Cardiac remodeling and biomarker expression after temporal LAD ligation (tLAD)
Myocardial infarctions (MIs) were generated by temporal and permanent ligations of the left anterior descending coronary artery (tLAD and pLAD, respectively). The tLAD groups were investigated at multiple time points, whereas the pLAD group was investigated at 8 weeks only (Figure S1A). The effects of tLAD in time are presented in Figure 1, and the comparison between tLAD and pLAD at 8 weeks is shown in Figure 2 and Table 1.
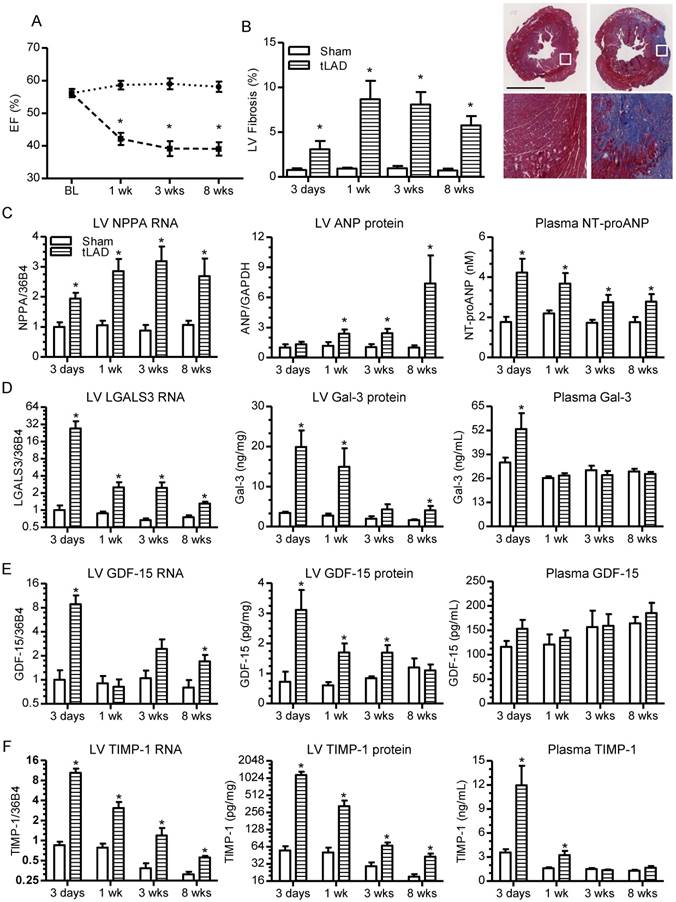
Cardiac function, remodeling and biomarker expression after tLAD. (A) Percent ejection fraction (EF) after tLAD, as determined by MRI (N=8-10). (B) Quantification of percent LV fibrosis as determined by Masson's trichrome staining (left panel) (N=8-10). Representative images of stained mid-left ventricular slices of mice of the 8 weeks group are shown on the left with higher magnifications of the indicated areas at the bottom. (C) NPPA gene expression (left panel), ANP protein levels in LV (middle panel) and NT-proANP biomarker plasma levels (right panel). (D-F) The same as (C), but for, respectively (D) Gal-3, (E) GDF-15 and (F) TIMP-1. Gene expression changes were corrected for 36B4 and are shown as fold changes relative to the 3 days sham group (N=6-10). ANP protein levels in the LV were determined by Western blot and corrected for GAPDH levels. All other proteins were determined by ELISA. Plasma protein levels N=6-9. LV protein levels N=4-9. Bars represent means. Error bars represent SEM. *P<0.05 versus respective control group. Black bar in (B) represents 2 mm.
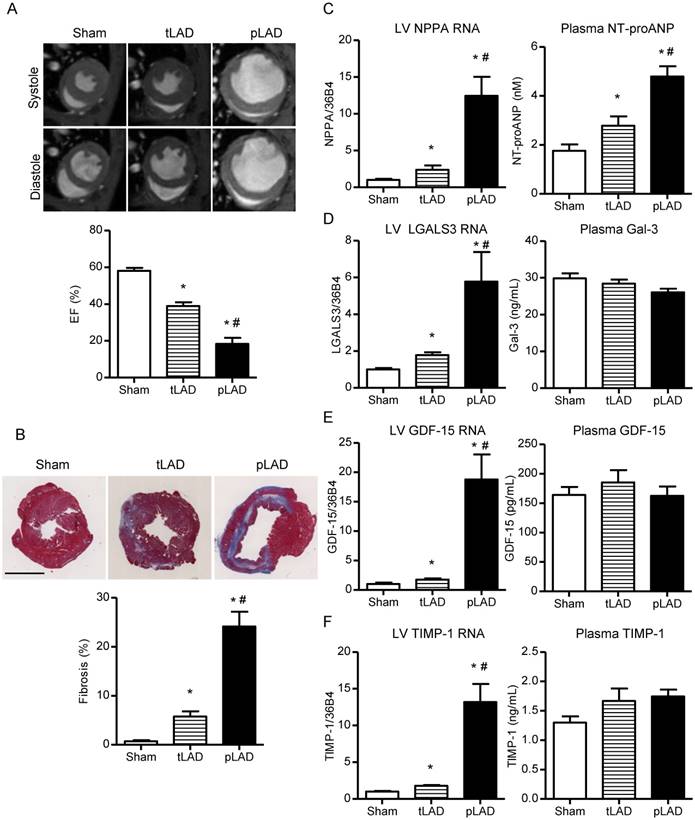
Cardiac function, remodeling and biomarker expression 8 weeks after tLAD and pLAD. (A) Representative MRI images of short axis in systole and diastole (upper panel). EF (%) 8 weeks after tLAD and pLAD, as determined by MRI (N=8-9). (B) Representative images of Masson's trichrome-stained transverse mid slices of LVs after 8 weeks follow up are shown (upper panel). (C) Quantification of percent LV fibrosis (lower panel, N=8-9), NPPA gene expression (left panel), and NT-proANP biomarker plasma levels (right panel). (D-F) The same as (C), but for, respectively (D) LGALS3/Gal-3, (E) GDF-15 and (F) TIMP-1 (N=6-10). Gene expression corrected for 36B4 and shown as fold changes relative to the 8 weeks sham group (N=6-9). Plasma levels N=8-9. Bars represent means. Error bars represent SEM. *P<0.05 versus control group. #P<0.05 versus tLAD. Black bar in (B) represents 2 mm.
Hemodynamic effects and effects on cardiac dimensions and function in tLAD/pLAD, TAC and HFD/AngII mice.
| P-catheter | MRI | ||||||||
|---|---|---|---|---|---|---|---|---|---|
| HR | MAP | LVESP | LVEDP | dP/dtmax | dP/dtmin | LVEDV | LVESV | EF | |
| Sham | 519 ± 18 | 86.7± 0.9 | 100.3 ± 2.6 | 7.8 ± 1.4 | 81.7 ± 4.6 | -78.3 ± 5.4 | 62.5 ± 2.6 | 26.4 ± 1.9 | 58.1 ± 1.6 |
| tLAD | 536 ± 9 | 86.6± 2.1 | 96.7 ± 3.1 | 9.4 ± 1.4 | 72.7 ± 2.4 | -63.73 ± 4.0* | 80.3 ± 3.8* | 49.3 ± 3.6* | 39.0 ± 2.1* |
| pLAD | 489 ± 14 | 72.3± 3.5*# | 84.2 ± 3.8*# | 11.6 ± 0.4* | 55.9 ± 1.4*# | -46.0 ± 1.8*# | 175.1 ± 21.7*# | 148.2 ± 22.9*# | 18.3 ± 3.3*# |
| Sham | 478 ± 18 | 81.6± 1.3 | 90.8 ± 3.0 | 4.3 ± 0.9 | 82,5 ± 3.9 | -85,4 ± 3,6 | 59.0 ± 1.9 | 22.6 ± 1.2 | 62.0 ± 1.1 |
| TAC4 | 484 ± 15 | 91.5± 5.7* | 137.4 ± 5.4* | 13.9 ± 4.0* | 48,8 ± 3.7* | -50,0 ± 2,8* | 79.1 ± 3.2* | 54.5 ± 3.6* | 31.5 ± 2.2* |
| TAC8 | 502 ± 9 | 85.7± 2.7 | 119.1 ± 9.7* | 22.0 ± 2.0* | 44,99 ± 1.6* | -39,9 ± 1.6* | 100.2 ± 6.5*# | 77.4 ± 7.0*# | 23.6 ± 2.2*# |
| LFD | 485 ± 21 | 93.6± 3.7 | 97.3 ± 2.3 | 10.5 ± 2.0 | 74.8 ± 4.7 | -66.4 ± 6.4 | 49.9 ± 2.1 | 22.7 ± 1.8 | 55.1 ± 1.8 |
| HFD | 472 ± 10 | 99.9± 2.4 | 105.1 ± 3.9 | 17.2 ± 2.7 | 72.5 ± 4.1 | -60.5 ± 3.6 | 46.3 ± 1.4 | 17.8 ± 0.7 | 61.7 ± 0.9* |
| HFD+AngII | 460 ± 30 | 107.8± 2.9* | 114.1 ± 9.2* | 17.7 ± 1.8 | 59.0 ± 4.8* | -47.4 ± 4.1* | 51.5 ± 2.5 | 24.7 ± 3.1 | 53.7 ± 3.7 |
Data are presented as mean ± standard error of the mean. dP/dtmax: maximal left ventricular contraction corrected by maximal ventricular pressure (1/s); dP/dtmin= maximal left ventricular relaxation corrected by maximal ventricular pressure (1/s); EF: ejection fraction (%); HFD: high fat diet; HR: heart rate (bpm); MAP: mean arterial pressure (mmHg); P-catheter: pressure catheter; MRI: magnetic resonance imaging; LFD: low fat diet; LVESP: left ventricular end-systolic pressure (mmHg); LVEDP: left ventricular end-diastolic pressure (mm Hg); LVEDV: left ventricular end-diastolic volume (µl); LVESV: left ventricular end-systolic volume (µl); pLAD: permanent ligation of the left anterior descending coronary artery; TAC: transverse aortic constriction; tLAD: temporal ligation of the left anterior descending coronary artery. N=8-12. *P<0.05 versus respective control group. #P<0.05 for pLAD versus tLAD, TAC 4 wks versus TAC 8 wks or HFD+AngII versus HFD.
Serial MRI measurements of the tLAD groups revealed a rapid drop in ejection fraction (EF) within one week post-MI and histological analysis of LV sections by Masson's trichrome staining confirmed the presence of infarcted fibrotic areas (Figure 1A-B). Cardiac gene expression of NPPA, encoding ANP, increased directly after MI and remained at a similar level thereafter (Figure 1C, left panel). Tissue ANP levels, determined by Western blotting, were also significantly elevated after tLAD (Figure 2C, middle panel, and Figure S2) and immunohistochemical analysis revealed that ANP was predominantly elevated in cardiomyocytes in the non-infarcted area (Figure S3). This also resulted in elevated NT-proANP plasma levels (Figure 1C, right panel), which increased even faster than tissue levels. This may be explained by ischemia-induced ANP secretion after infarction [29].
In contrast to NPPA, gene expression of LGALS3 (encoding Galectin-3), GDF-15 and TIMP-1 strongly increased within 3 days after tLAD, but subsequently decreased again, showing only a modest elevation at 8 weeks (Figure 1D-F, left panels). These gene expression profiles were similar to the expression profiles of extracellular matrix genes, including alpha-1 type 1 collagen (Col1a1) and alpha-3 type 1 collagen (Col3a1), and inflammatory genes, like interleukin-6 (IL-6) (Figure S4A). Gene expression changes were specific to the heart and no changes were observed in other tissues investigated (lung, kidney, liver) (Figure S4B-D). Gal-3, GDF-15 and TIMP-1 protein levels in tissue lysates and blood plasma were determined by ELISA. LV protein levels of Gal-3, GDF-15 and TIMP-1 largely paralleled gene expression patterns, with highly elevated protein levels within 3 days after MI (Gal-3 ~10-fold; GDF-15 ~3-fold; TIMP-1 ~20-fold increased) and subsequent decrease in the weeks thereafter (Figure 1D-F, middle panels). Immunohistochemical analysis confirmed this strong temporal increase in Gal-3 levels in the heart and importantly Gal-3 expression was confined to the infarcted area and localized to both non-cardiomyocytes and cardiomyocytes (Figure S5). The increase in expression also resulted in a temporal elevation of blood plasma levels of both Gal-3 and TIMP-1 at 3 days post-infarction (Figure 1D, F, right panels). None of them remained elevated in the weeks thereafter, despite reduced cardiac EF. Thus, only highly elevated LV expression directly after tLAD resulted in a temporal increase in Gal-3 and TIMP-1 plasma levels.
Cardiac remodeling and biomarker expression after permanent LAD ligation
The absence of elevated biomarker plasma levels (except NT-proANP) 8 weeks post-tLAD could be due to small MIs and hence limited decrease in cardiac function (e.g., EF from 58.1±1.6% in control to 39.0±2.1% in tLAD). Permanent LAD ligations (pLAD) that were performed in parallel generated much stronger cardiac dilatation at 8 weeks and a significant further decrease in EF to 18.3±3.3% (Figure 2A and Table 1). Moreover, cardiac fibrosis, indicative of infarct size, was much more pronounced at 8 weeks pLAD as compared to tLAD and the same was true for cardiac hypertrophy and diminished contraction and relaxation (Figure 2B and Table 1).
Since cardiac protein levels reflected gene expression levels at 8 weeks, only gene expression levels are shown for simplicity. For comprehensiveness, cardiac protein levels of all experiments are included in Figure S6. NPPA gene expression was much more elevated in the 8 weeks pLAD group as compared to the tLAD group and the same was true for cardiac protein levels and plasma levels (Figure 2C and Figure S6A). Cardiac gene expression and protein levels of Gal-3, GDF-15 and TIMP-1 were all higher in pLAD as compared to tLAD, but again this did not result in elevated plasma levels of these biomarkers (Figure 2D-F and Figure S6A). Thus, despite strongly reduced EF (18.3±3.3%) and concomitantly elevated cardiac expression, blood plasma levels did not change, except for NT-proANP.
Cardiac remodeling and biomarker expression after transverse aortic constriction (TAC)
To corroborate the above-mentioned findings, we decided to include a cardiac hypertrophy model by inducing LV pressure overload via transverse aortic constriction (TAC) (Figure S1B). In this model, EF progressively worsened from 4 to 8 weeks and, as expected, induced strong and progressive cardiomyocyte hypertrophy (Figure 3A-B). Cardiac fibrosis was modestly elevated in this cardiac hypertrophy model (Figure S7A) and hemodynamic analysis revealed a strong increase in LV end-systolic and end-diastolic pressures (LVESP, LVEDP), and contractility (dP/dTmax) and relaxation (dP/dTmin) worsened after 4 and 8 weeks post-TAC (Table 1).
Cardiac function, remodeling and biomarker expression 4 and 8 weeks after TAC. (A) Representative MRI images of short axis in systole and diastole (upper panel). EF (%) 8 weeks after tLAD and pLAD, as determined by MRI. (B) Representative images of mid-ventricular slices stained with FITC-WGA to determine cell size (upper panels). Quantification of cell size based on FITC-WGA staining (lower panel). (C) NPPA gene expression (left panel), and NT-proANP biomarker plasma levels (right panel). (D-F) The same as (C), but for, respectively (D) LGALS3/Gal-3, (E) GDF-15 and (F) TIMP-1. All analysis N=15-20 for sham, N=8-10 per TAC group. Bars represent means. Error bars represent SEM. *P<0.05 versus control group. #P<0.05 versus TAC 4 wks. Red bar in (B) represents 50 µm.
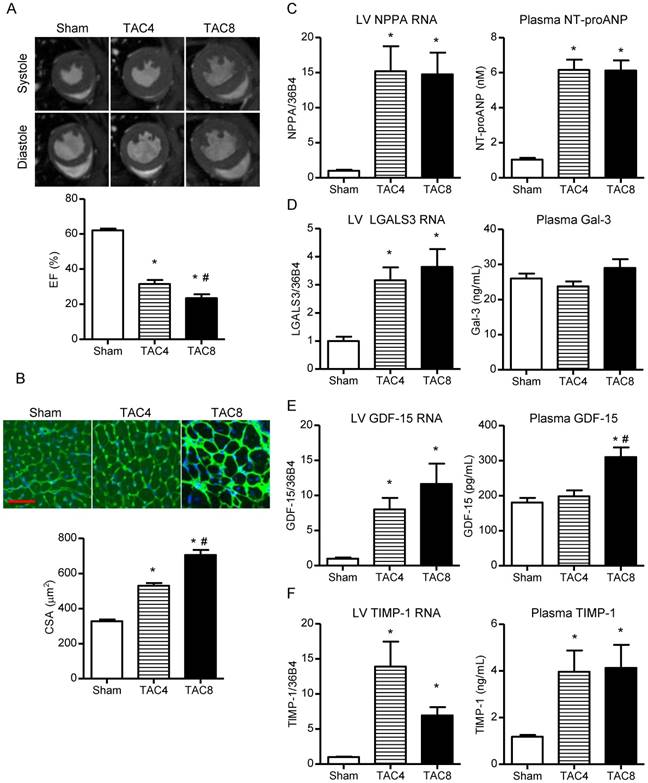
Cardiac gene expression and protein levels of all four biomarkers were significantly elevated 4 and 8 weeks after TAC (Figure 3C-F and Figure S4B). In plasma, NT-proANP levels were increased in both TAC groups. Plasma Gal-3 was again not elevated, despite increased cardiac expression and protein levels (Figure 3D). However, plasma TIMP-1 was clearly elevated and GDF-15 was elevated in the 8 weeks TAC group only (Figure 3E-F). This suggests that the underlying etiology of cardiac remodeling rather than cardiac function (e.g., %EF) per se determines the plasma levels of these biomarkers. The higher cardiac Gal-3, GDF-15 and TIMP-1 protein levels in the 8 weeks post-TAC group as compared to the post-MI groups are in accordance with this suggestion (Figure S6, comparison of panels A and B).
Comparison of biomarker expression in other tissues post-MI and post-TAC
Since cardiac failure can cause stress in distal organs, gene expression in other tissues was also investigated. As shown in Figure 4 (TAC study) and Figure S8 (tLAD and pLAD data), NPPA expression was confined to the heart, but the other biomarkers showed strong expression in other investigated organs (kidney, lung, liver). GDF-15 gene expression was about 100-fold higher in the liver and Gal-3 gene expression was almost 30-fold higher in lung as compared to LV tissue. This indicates that other organs may profoundly contribute to the plasma levels of these markers.
Biomarker gene expression in different organs post-TAC and lung-associated protein levels. (A-D) Gene expression levels in LV, liver, kidney and lung at 4 and 8 weeks post-TAC. (A) NPPA, (B) LGALS3, (C) GDF-15, (D) TIMP-1. N=15-20 for sham group of TAC experiment. For other groups, N=7-10. Bars represent means. Error bars represent SEM. *P<0.05 versus control group. #P<0.05 versus TAC 4wks. (E) Quantification of lung protein levels of Gal-3 (left), GDF-15 (middle) and TIMP-1 (right). (F) Association between GDF-15 and TIMP-1 plasma levels and their respective lung protein levels. (G) Association between GDF-15 and TIMP-1 lung protein levels and lung weight. Points in graph represent individual measurements of combined groups (N=17-25). Spearman's correlation test was performed.
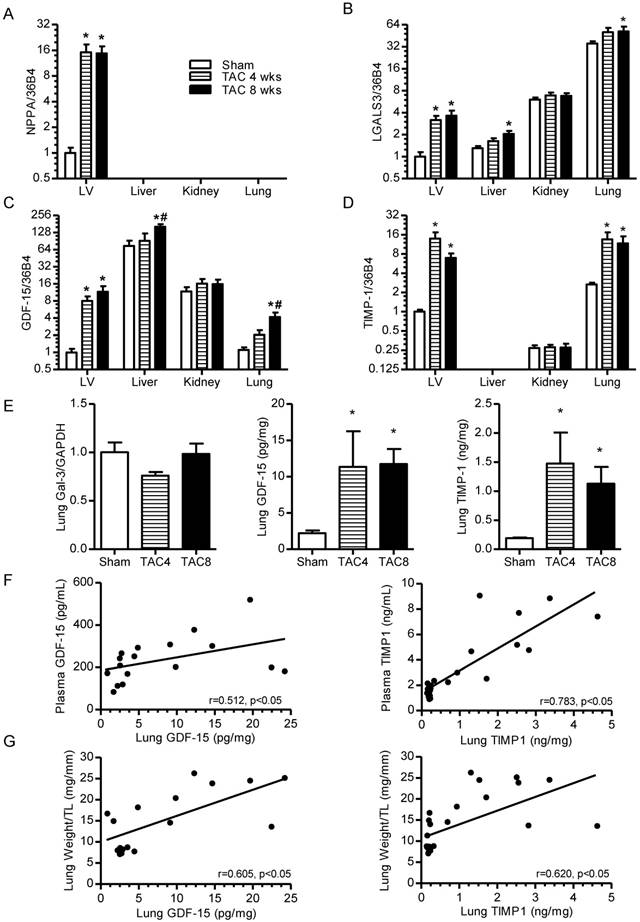
Despite reduced EF, no expression changes were identified in other organs post-MI (tLAD and pLAD) (Figure S8). After TAC, however, elevated expressions of Gal-3, GDF-15 and TIMP-1 were observed in lung tissue and Gal-3 and GDF-15 also showed some increase in the liver (Figure 4A-D). Since GDF-15 and TIMP-1 showed the highest fold increase in lung, lung protein levels, they were also investigated. Although, Gal-3 protein levels did not increase in the lungs, GDF-15 and TIMP-1 protein levels were significantly elevated (Figure 4E). The lung protein levels of GDF-15 and TIMP-1 also correlated with plasma protein levels and also with lung weight, suggesting that lung congestion in TAC animals could stimulate lung expression (Figure 4F-G). These results indicate that increased plasma levels after TAC may involve dynamic contribution of other affected organs. No congestion and increased lung expression were observed after MI, which could readily explain the lack of elevated biomarker plasma levels post-MI.
Biomarker levels in a high fat/ AngII mouse model
To further investigate the role of underlying etiology, we decided to include a mouse model that incorporates two important HFpEF risk factors, obesity and hypertension (Figure S1C). Compared to the control LFD mice, the HFD and HFD/AngII groups showed a significant increase in fat mass (Figure S9). In none of the tested conditions was cardiac dilatation or reduction in cardiac EF observed (Figure 5A). Low-dose AngII infusion induced cardiac fibrosis (Figure 5B), and cardiac mass increased significantly in the HFD+AngII group (Table S2). Importantly, in the combined HFD+AngII treatment group, cardiac dysfunction was observed, including diminished relaxation, indicative of a HFpEF-like phenotype (Table 1).
Cardiac function, remodeling and biomarker expression in hypertensive/obese mice. (A) Representative cardiac magnetic resonance imaging (MRI) images of the short axis of the LFD, HFD and HFD+AngII groups at 16wks. EF (%) as determined by MRI (lower panel). (B) Representative images of Masson's trichrome-stained mid-ventricular sections of the LFD, HFD and HFD+AngII groups. Quantification of percent LV fibrosis (lower panel). (C) NPPA gene expression (left panel), and NT-proANP biomarker plasma levels (right panel). (D-F) The same as (C), but for, respectively (D) Gal-3, (E) GDF-15 and (F) TIMP-1. N=7-13. Bars represent means. Error bars represent SEM. *P<0.05 versus LFD. #P<0.05 versus HFD. Black bar in (B) represents 2 mm.
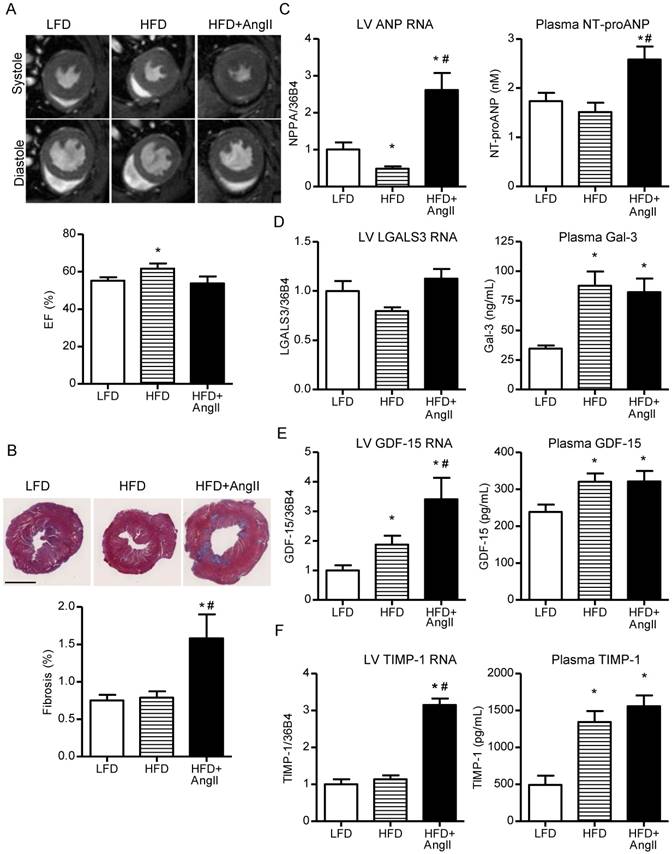
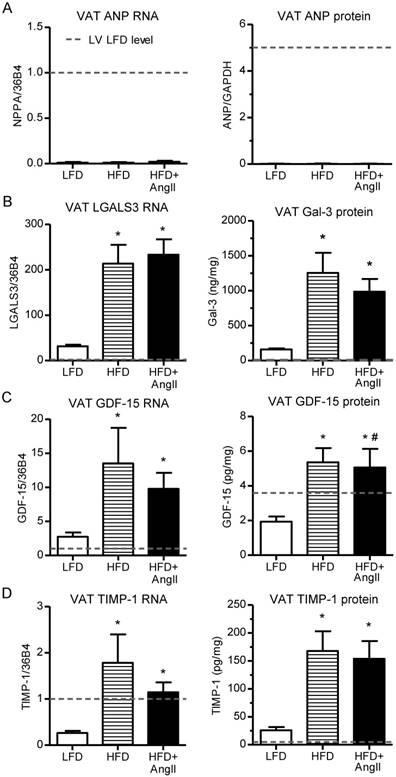
Investigation of LV NPPA gene expression and NT-proANP plasma levels revealed that these were elevated in the HFD+AngII group, in line with observed cardiac remodeling in this group (Figure 5C). Gal-3, GDF-15 and TIMP-1 were all elevated in plasma of the HFD groups, irrespective of AngII treatment, and hence plasma levels were not associated with cardiac remodeling (Figure 5F-H). In the LV, Gal-3 and TIMP-1 gene expressions did not change in the HFD group and GDF-15 gene expression showed only a moderate elevation, indicating that other tissues must be responsible for the elevated plasma levels (Figure 5 and Figure S6C). In lung and liver, no gene expression changes were observed for Gal-3, GDF-15 and TIMP-1 and in kidney, minor changes were observed (Figure S10). Since adipose tissue was strongly increased in the HFD groups, gene and protein expressions were also investigated in visceral adipose tissue (VAT). Interestingly, Gal-3, GDF-15 and TIMP-1 gene expression and proteins were readily detected in VAT and, importantly, strongly induced in the HFD groups (Figure 6). Gal-3 levels in HFD groups were almost 300-fold higher in VAT as compared to LV. Importantly, VAT protein levels of Gal-3 and GDF-15 strongly correlated with plasma biomarker levels (Figure S11).
HF biomarkers in visceral adipose tissue of hypertensive/obese mice. Gene expression changes are presented as fold change relative to LV levels in the LFD group (dashed lines). (A) NPPA gene expression (left) and ANP protein levels (right) in VAT. (B-D) The same for, respectively, (B) Gal-3, (C) GDF-15 and (D) TIMP-1. The dashed line shows the levels observed in the LV of the LFD group. N=4-10. Bars represent means. Error bars represent SEM. *P<0.05 versus LFD. #P<0.05 versus HFD.
Discussion
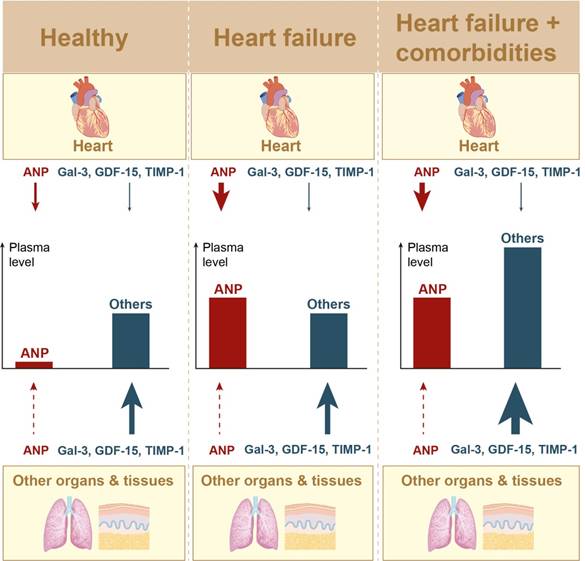
Here we investigated HF biomarkers ANP, Gal-3, GDF-15 and TIMP-1 at three different levels: i) organ gene expression, ii) organ protein quantities and iii) plasma protein quantities, all in relation to cardiac function and structure. This was performed in post-MI and TAC HFrEF mouse models and in an obese/hypertensive mouse model with HFpEF characteristics. Our comprehensive dataset revealed that cardiac gene expression and/or protein levels of these markers significantly increased upon cardiac remodeling. However, in blood plasma, only NT-proANP levels were specifically and significantly elevated in response to cardiac remodeling in all mouse models. Circulating levels of Gal-3, GDF-15 and TIMP-1 were strongly influenced by extra-cardiac tissues and their elevation also reflects enhanced stress and concomitant productions in these extra-cardiac tissues (Figure 7).
Model of organ/tissue involvement in plasma biomarker levels. Model with simplified schematic depiction of organ/tissue contribution to plasma biomarkers levels. Included organs/tissues: heart, lungs, kidney, liver and visceral adipose tissue (VAT). Larger arrow represents stronger relative contribution.
Cardiac gene expression of all four biomarkers paralleled in most cases the cardiac protein levels. Changes in cardiac ANP gene expression and protein levels showed some divergence under some conditions and this may be related to additional levels of control, including protein secretion and post-translational processing of ANP. Whereas ANP cardiac gene expression and plasma levels showed a very strong correlation in all cases, this was not true for the other biomarkers. At 8 weeks post-MI, cardiac expressions of Gal-3, GDF-15 and TIMP-1 were clearly elevated, but not their plasma levels. Although elevated plasma levels of GDF-15 and TIMP-1 were observed 8 weeks post-TAC, this may not simply reflect increased GDF-15 and TIMP-1 cardiac expression, since in these animals lung expression was also clearly elevated. TIMP-1 protein levels in lung tissue were even 4.5 times higher as compared to LV levels. Taking organ size into consideration, this suggests that under these conditions lungs may contribute stronger to the elevated plasma levels. The expression also correlated with lung weight, suggesting that TAC-mediated congestion may be responsible for increased GDF-15 and TIMP-1 plasma levels. It is therefore tempting to suggest that hemodynamic stress in other organs and tissues can contribute to elevated plasma levels of these biomarkers and hence these markers are indirectly associated with cardiac function.
In contrast to NPPA (ANP), the other biomarkers showed a fast temporal increased expression in the heart after cardiac infarction that resembled the pattern of inflammatory (IL-6) and pro-fibrotic genes (Col1a1, Col3a1), which is in accordance with their suggested functions in these processes. Whereas Gal-3 expression was confined to the infarcted area, ANP expression was mostly elevated in the remote area and absent from the infarcted (fibrotic) regions. Although we were unable to stain mouse TIMP-1 and GDF-15, the latter has previously been shown to be highly expressed in cardiomyocytes in the infarcted area in human hearts [30]. Therefore, in contrast to ANP, these novel biomarkers appear to play a role in the infarcted area, which again stresses the differences between these markers. Furthermore, as shown for Gal-3, different cell types may be involved at different stages after infarction, which further adds to the complexity of this biomarker.
The highly elevated expressions directly after infarction resulted in temporally elevated plasma levels of Gal-3 and TIMP-1. Although Gal-3 and TIMP-1 plasma levels have been reported to be elevated in patients with acute MI, the exact temporal changes have never been systematically investigated. Performing such clinical investigations could be rewarding, but results may be more complex to interpret. In patients, cardiovascular risk factors and comorbidities are involved in both causing and maintaining cardiovascular disease, whereas our MI mouse model was an isolated ischemic model, lacking these confounding factors that might influence biomarker levels, as discussed below.
Our observation that the plasma levels of the tested novel biomarkers did not change despite severely reduced EF (8 weeks post-MI), may sound remarkable, but we would like to point out that these are otherwise healthy mice without other co-morbidities. This seems to reflect the results of the HF-ACTION clinical study in which patients of NYHA class III and IV were included; but, in order to allow them to follow a structured exercise program, these patients were generally healthier than patients included in other HF studies. Not surprisingly, in this study, much lower Gal-3 plasma levels were measured as compared to other HF studies [31]. The observations that these biomarkers are mostly elevated in patients with additional co-morbidities and poor outcome further strengthens our observations [14, 15, 17, 32]. In particular, we showed that Gal-3, GDF-15 and TIMP-1 were strongly influenced by obesity. The elevated plasma levels in obese animals were not associated with cardiac function. Adipose tissue was the major producer of Gal-3 and its levels were even more than 300 times higher in adipose tissue as compared to LV tissue. Additional induction of a cardiac HFpEF-like phenotype in these animals using AngII infusion did not result in further enhancement of their plasma levels, despite alterations in cardiac expressions. Positive associations of these biomarkers have been reported with several other diseases and with obesity, and this provides clear evidence that non-cardiac sources are important determinants of their circulating levels in humans as well [5, 33, 34, 35, 36]. We therefore would like to postulate that elevated levels of these biomarkers in HF patients most likely reflect the presence of other comorbidities and hint to stress and involvement of other organs.
In many clinical studies, circulating levels of Gal-3, GDF-15 and TIMP-1 have been correlated to HF severity based on clinical symptoms (NYHA class) or tested for their predictive power for mortality and HF rehospitalization in HF patients [12, 14, 20, 21, 32, 34, 37]. Even though several clinical studies have shown that these biomarkers are associated with cardiac function (e.g., EF or LV strain) [38], cardiac remodeling (e.g., LV dimensions) [39, 40] and LV-filling pressures [37, 41, 42], none of these studies provided evidence for the cardiac nature of the increased systemic levels. Not surprisingly, several studies also provided evidence that these biomarkers could not be directly related to specific cardiac indices in HF patients, including echocardiographic parameters [43]. Moreover, in an elegant study, it was shown that elevated Gal-3 levels did not decline after heart transplantation, a clear indication that non-cardiac sources were responsible for high Gal-3 levels in these HF patients [44]. In cardiomyopathy patients, it was recently reported that plasma Gal-3 levels did not correlate with Gal-3 levels in endomyocardial biopsies [45]. Therefore, we postulate that correlating circulating biomarker levels to parameters of cardiac dysfunction does not take into account the above-mentioned issues, and such results might therefore generate false results. Thus, although these biomarkers are intensely studied in HF, our results call into question the feasibility of relating plasma/serum biomarkers levels to cardiac-specific indices of HF severity including function and dimensions. Our data clearly indicate that these measures have a strong relation to cardiac biomarker expression and production, but not necessarily to systemic biomarker levels.
Since ANP expression is highly cardiac specific, its plasma levels are not obscured by contribution of non-cardiac tissues. This is not true for the other HF biomarkers studied here and this is most likely also true for other non-cardiac specific HF biomarkers. Unfortunately, we could not test this for another HF biomarker that has been included in the AFFC/AHA clinical guidelines, soluble ST2 (sST2), due to lack of proper mouse reagents. From literature, it is known that sST2 gene expression is not cardiac specific and it is therefore likely that non-cardiac contributions will also affect plasma levels of sST2 [10, 46, 47]. Our results clearly show that it will be important to rigorously test any novel plasma biomarker in animal models, allowing the simultaneous investigation of the dynamic contribution of multiple tissues to the plasma levels.
Conclusion
In conclusion, we have shown that only plasma NT-proANP levels are directly related to cardiac function, whereas plasma levels of the novel HF biomarkers Gal-3, GDF15 and TIMP-1 are heavily influenced by dynamic contribution of non-cardiac tissues. Therefore, rather than being specific for indices of cardiac remodeling, these biomarkers reflect health status beyond cardiac function. They also reflect stress in other organs, either as a consequence of the failing heart and/or as a consequence of other underlying comorbidities, like metabolic syndromes.
Abbreviations
AngII: angiotensin II; ANP: atrial natriuretic peptide; EF: ejection fraction; Gal-3: galectin-3; GDF-15: growth differentiation factor-15; HF: heart failure; HFD: high fat diet; HFrEF: heart failure with reduced ejection fraction; HFpEF: heart failure with preserved ejection fraction; LAD: left anterior descending coronary artery; LFD: low fat diet; LV: left ventricle; LVEDP: left ventricular end-diastolic pressure; LVESP: left ventricular end-systolic pressure; MI: myocardial infarction; MRI: magnetic resonance imaging; pLAD: permanent LAD ligation; TAC: transverse aortic constriction; tLAD: temporal LAD ligation; TIMP-1: tissue inhibitor of metalloproteinase-1; VAT: visceral adipose tissue.
Supplementary Material
Supplementary figures and tables.
Acknowledgements
This work was supported by the Netherlands Heart Foundation (CVON-DOSIS, grant 2014-40, to Dr. de Boer) and the Innovational Research Incentives Scheme program of the Netherlands Organization for Scientific Research (NWO VIDI, grant 917.13.350, to Dr. de Boer). We thank Martin Dokter and Silke Oberdorf for excellent technical assistance. We like to thank Navin Suthahar for critical revision of the manuscript.
Competing Interests
The UMCG, which employs a number of the authors, received research grants and consultancy fees from AstraZeneca, Roche, Bristol Myers Squibb, Pfizer, Trevena, Thermofisher GmbH, and Sphingotec GmbH, for work done by UMCG employers. Dr. Voors received funding from Roche Diagnostics and Sphingotec. Dr. de Boer received speaker fees from Novartis. Dr. H. Silljé received research grants from AstraZeneca.
References
1. Chow SL, Maisel AS, Anand I. et al. Role of biomarkers for the prevention, assessment, and management of heart failure: A Scientific Statement From the American Heart Association. Circulation. 2017;135:e1054-e1091
2. Ponikowski P, Voors AA, Anker SD. et al. 2016 ESC Guidelines for the diagnosis and treatment of acute and chronic heart failure: the task force for the diagnosis and treatment of acute and chronic heart failure of the European Society of Cardiology (ESC). Developed with the special contribution of the Heart Failure Association (HFA) of the ESC. Eur J Heart Fail. 2016;18:891-975
3. Yancy CW, Jessup M, Bozkurt B. et al. 2017 ACC/AHA/HFSA Focused Update of the 2013 ACCF/AHA Guideline for the management of heart failure: a report of the American College of Cardiology/American Heart Association task force on clinical practice guidelines and the Heart Failure Society of America. J Card Fail. 2017;23:628-651
4. de Boer RA, Daniels LB, Maisel AS. et al. State of the art: newer biomarkers in heart failure. Eur J Heart Fail. 2015;17(6):559-569
5. Piek A, Du W, de Boer RA. et al. Novel heart failure biomarkers: why do we fail to exploit their potential? Crit Rev Clin Lab Sci. 2018;55(4):246-263
6. Piek A, de Boer RA, Sillje HH. The fibrosis-cell death axis in heart failure. Heart Fail Rev. 2016;21(2):199-211
7. Yu L, Ruifrok WP, Meissner M. et al. Genetic and pharmacological inhibition of galectin-3 prevents cardiac remodeling by interfering with myocardial fibrogenesis. Circ Heart Fail. 2013;6(1):107-117
8. Filipe MD, Meijers WC, Rogier van der Velde A. et al. Galectin-3 and heart failure: prognosis, prediction & clinical utility. Clin Chim Acta. 2015;443:48-56
9. Suthahar N, Meijers WC, Sillje HHW. et al. Galectin-3 activation and inhibition in heart failure and cardiovascular disease: an update. Theranostics. 2018;8(3):593-609
10. Kakkar R, Lee RT. The IL-33/ST2 pathway: therapeutic target and novel biomarker. Nat Rev Drug Discov. 2008;7(10):827-840
11. Ahmad T, Fiuzat M, Felker GM. et al. Novel biomarkers in chronic heart failure. Nat Rev Cardiol. 2012;9(6):347-359
12. Trucco E, Tolosana JM, Castel MA. et al. Plasma tissue inhibitor of matrix metalloproteinase-1 a predictor of long-term mortality in patients treated with cardiac resynchronization therapy. Europace. 2016;18(2):232-237
13. Moore L, Fan D, Basu R. et al. Tissue inhibitor of metalloproteinases (TIMPs) in heart failure. Heart Fail Rev. 2012;17(4-5):693-706
14. Jungbauer CG, Riedlinger J, Block D. et al. Panel of emerging cardiac biomarkers contributes for prognosis rather than diagnosis in chronic heart failure. Biomark Med. 2014;8(6):777-789
15. Tolosana JM, Mont L, Sitges M. et al. Plasma tissue inhibitor of matrix metalloproteinase-1 (TIMP-1): an independent predictor of poor response to cardiac resynchronization therapy. Eur J Heart Fail. 2010;12(5):492-498
16. Xu J, Kimball TR, Lorenz JN. et al. GDF15/MIC-1 functions as a protective and antihypertrophic factor released from the myocardium in association with SMAD protein activation. Circ Res. 2006;98(3):342-350
17. Kempf T, von Haehling S, Peter T. et al. Prognostic utility of growth differentiation factor-15 in patients with chronic heart failure. J Am Coll Cardiol. 2007;50(11):1054-1060
18. Kempf T, Zarbock A, Widera C. et al. GDF-15 is an inhibitor of leukocyte integrin activation required for survival after myocardial infarction in mice. Nat Med. 2011;17(5):581-588
19. Wollert KC, Kempf T, Wallentin L. Growth differentiation factor 15 as a biomarker in cardiovascular disease. Clin Chem. 2017;63(1):140-151
20. de Boer RA, Lok DJ, Jaarsma T. et al. Predictive value of plasma galectin-3 levels in heart failure with reduced and preserved ejection fraction. Ann Med. 2011;43(1):60-68
21. Chan MM, Santhanakrishnan R, Chong JP. et al. Growth differentiation factor 15 in heart failure with preserved vs. reduced ejection fraction. Eur J Heart Fail. 2016;18(1):81-88
22. Zouein FA, de Castro Bras LE, da Costa DV. et al. Heart failure with preserved ejection fraction: emerging drug strategies. J Cardiovasc Pharmacol. 2013;62(1):13-21
23. Tromp J, Khan MA, Klip IT. et al. Biomarker profiles in heart failure patients with preserved and reduced ejection fraction. J Am Heart Assoc. 2017;6(4):e003989
24. Zile MR, Baicu CF, Ikonomidis JS. et al. Myocardial stiffness in patients with heart failure and a preserved ejection fraction: contributions of collagen and titin. Circulation. 2015;131(14):1247-1259
25. Garg A, Virmani D, Agrawal S. et al. Clinical application of biomarkers in heart failure with a preserved ejection fraction: a review. Cardiology. 2017;136(3):192-203
26. Booij HG, Yu H, De Boer RA. et al. Overexpression of A kinase interacting protein 1 attenuates myocardial ischaemia/reperfusion injury but does not influence heart failure development. Cardiovasc Res. 2016;111(3):217-226
27. Cannon MV, Sillje HH, Sijbesma JW. et al. Cardiac LXRalpha protects against pathological cardiac hypertrophy and dysfunction by enhancing glucose uptake and utilization. EMBO Mol Med. 2015;7(9):1229-1243
28. Bovens SM, te Boekhorst BC, den Ouden K. et al. Evaluation of infarcted murine heart function: comparison of prospectively triggered with self-gated MRI. NMR Biomed. 2011;24(3):307-315
29. Dietz JR. Mechanisms of atrial natriuretic peptide secretion from the atrium. Cardiovasc Res. 2005;68(1):8-17
30. Kempf T, Eden M, Strelau J. et al. The transforming growth factor-beta superfamily member growth-differentiation factor-15 protects the heart from ischemia/reperfusion injury. Circ Res. 2006;98(3):351-360
31. Felker GM, Fiuzat M, Shaw LK. et al. Galectin-3 in ambulatory patients with heart failure: results from the HF-ACTION study. Circ Heart Fail. 2012;5(1):72-78
32. van Kimmenade RR, Januzzi JL Jr, Ellinor PT. et al. Utility of amino-terminal pro-brain natriuretic peptide, galectin-3, and apelin for the evaluation of patients with acute heart failure. J Am Coll Cardiol. 2006;48(6):1217-1224
33. Li P, Liu S, Lu M. et al. Hematopoietic-derived galectin-3 causes cellular and systemic insulin resistance. Cell. 2016;167(4):973-984.e12
34. Hagstrom E, Held C, Stewart RA. et al. Growth differentiation factor 15 predicts all-cause morbidity and mortality in stable coronary heart disease. Clin Chem. 2017;63(1):325-333
35. Breit SN, Johnen H, Cook AD. et al. The TGF-beta superfamily cytokine, MIC-1/GDF15: a pleotrophic cytokine with roles in inflammation, cancer and metabolism. Growth Factors. 2011;29(5):187-195
36. Mueller T, Leitner I, Egger M. et al. Association of the biomarkers soluble ST2, galectin-3 and growth-differentiation factor-15 with heart failure and other non-cardiac diseases. Clin Chim Acta. 2015;445:155-160
37. Shah RV, Chen-Tournoux AA, Picard MH. et al. Galectin-3, cardiac structure and function, and long-term mortality in patients with acutely decompensated heart failure. Eur J Heart Fail. 2010;12(8):826-832
38. Lok DJ, Lok SI, Bruggink-Andre de la Porte PW. et al. Galectin-3 is an independent marker for ventricular remodeling and mortality in patients with chronic heart failure. Clin Res Cardiol. 2013;102(2):103-110
39. Hansson J, Lind L, Hulthe J. et al. Relations of serum MMP-9 and TIMP-1 levels to left ventricular measures and cardiovascular risk factors: a population-based study. Eur J Cardiovasc Prev Rehabil. 2009;16(3):297-303
40. Xanthakis V, Larson MG, Wollert KC. et al. Association of novel biomarkers of cardiovascular stress with left ventricular hypertrophy and dysfunction: implications for screening. J Am Heart Assoc. 2013;2(6):e000399
41. Michalski B, Trzcinski P, Kupczynska K. et al. The differences in the relationship between diastolic dysfunction, selected biomarkers and collagen turn-over in heart failure patients with preserved and reduced ejection fraction. Cardiol J. 2017;24(1):35-42
42. Gonzalez A, Lopez B, Querejeta R. et al. Filling pressures and collagen metabolism in hypertensive patients with heart failure and normal ejection fraction. Hypertension. 2010;55(6):1418-1424
43. Stoltze Gaborit F, Bosselmann H, Kistorp C. et al. Galectin 3: association to neurohumoral activity, echocardiographic parameters and renal function in outpatients with heart failure. BMC Cardiovasc Disord. 2016;16:117-016 -0290-7
44. Grupper A, Nativi-Nicolau J, Maleszewski JJ. et al. Circulating galectin-3 levels are persistently elevated after heart transplantation and are associated with renal dysfunction. JACC Heart Fail. 2016;4(11):847-856
45. Besler C, Lang D, Urban D. et al. Plasma and cardiac galectin-3 in patients with heart failure reflects both inflammation and fibrosis: implications for its use as a biomarker. Circ Heart Fail. 2017;10(3):e003804
46. Chen WY, Hong J, Gannon J. et al. Myocardial pressure overload induces systemic inflammation through endothelial cell IL-33. Proc Natl Acad Sci U S A. 2015;112(23):7249-7254
47. Kaye DM, Mariani JA, van Empel V. et al. Determinants and implications of elevated soluble ST2 levels in heart failure. Int J Cardiol. 2014;176(3):1242-1243
Author contact
![]() Corresponding authors: H.H.W. Silljé, PhD & R.A. de Boer MD PhD, Department of Cardiology, University Medical Center Groningen, University of Groningen, Hanzeplein 1, 9713 GZ Groningen, The Netherlands, P.O. Box 30.001, 9700 RB Groningen, The Netherlands. Phone: +31 50 361 5523; fax: +31 50 3611347; E-mail: h.h.w.silljenl / r.a.de.boernl
Corresponding authors: H.H.W. Silljé, PhD & R.A. de Boer MD PhD, Department of Cardiology, University Medical Center Groningen, University of Groningen, Hanzeplein 1, 9713 GZ Groningen, The Netherlands, P.O. Box 30.001, 9700 RB Groningen, The Netherlands. Phone: +31 50 361 5523; fax: +31 50 3611347; E-mail: h.h.w.silljenl / r.a.de.boernl