Impact Factor
- Issue 14; 2026
- Issue 13; 2026
- Issue 12; 2026
- Issue 11; 2026
- Issue 10; 2026
- Volume 16; 2026
- Advance Articles
- Past Issues
- Cover Images
- Cover Suggestion
- Index & Coverage
- Special Issues
Introduction
Materials and Methods
Results and Discussion
Conclusion
Abbreviations
Acknowledgements
Supplementary Material
References
International Journal of Biological Sciences
International Journal of Medical Sciences
 Global reach, higher impact

Theranostics 2018; 8(15):4210-4225. doi:10.7150/thno.25625 This issue Cite
Research Paper
Highly sensitive/selective 3D nanostructured immunoparticle-based interface on a multichannel sensor array for detecting amyloid-beta in Alzheimer's disease
Ta-Chung Liu1, Yi-Chao Lee2, Chiung-Yuan Ko2, Ren-Shyan Liu3,4, Chien-Chih Ke3,4, Yu-Chun Lo2, Pei-Sung Hong1, Chao-Yi Chu1, Ching-Wen Chang5, Pu-Wei Wu1, You-Yin Chen2,5, ![]() , San-Yuan Chen 1,6,
, San-Yuan Chen 1,6, ![]()
1. Department of Materials Science & Engineering, National Chiao Tung University, No. 1001, Ta-Hsueh Rd., Hsinchu, Taiwan 30010, R.O.C.
2. The Ph.D. Program for Neural Regenerative Medicine, Taipei Medical University, No. 250 Wu-Xing St., Taipei 11010, Taiwan, R.O.C.
3. Department of Biomedical Imaging and Radiological Sciences, National Yang Ming University, No.155, Sec.2, Linong St., Taipei, Taiwan 11221, R.O.C.
4. Department of Nuclear Medicine and National PET/Cyclotron Center, Taipei Veterans General Hospital, No.201, Sec. 2, Shipai Rd., Taipei, Taiwan 11217, R.O.C.
5. Department of Biomedical Engineering, National Yang Ming University, No.155, Sec.2, Linong St., Taipei, Taiwan 11221, R.O.C.
6. Frontier Research Center on Fundamental and Applied Sciences of Matters, National Tsing Hua University, Taiwan 30010, R.O.C.
Received 2018-2-20; Accepted 2018-6-14; Published 2018-7-30
Abstract

Accumulation of β-amyloid (Aβ) peptides is highly associated with Alzheimer's disease (AD) progression in prevailing studies. The successful development of an ultrasensitive detection assay for Aβ is a challenging task, especially from blood-based samples.
Methods: We have developed a one-step electrophoresis/electropolymerization strategy for preparing a CSIP hierarchical immunoelectrochemical interface that is easily integrated into a PoCT device. The interface includes conductive silk fibroin-based immunoparticles (CSIPs) via electropolymerized Poly(3,4-ethylenedioxythiophene) (PEDOT) bridging to enable on-site electrochemical detection of serum amyloid-β42 (Aβ42) and -β40 (Aβ40) peptides from an AD blood test. In addition, micro-positron emission tomography (microPET) neuroimaging and behavioral tests were simultaneously performed.
Results: This nanostructured conductive interface favors penetration of water-soluble biomolecules and catalyzes a redox reaction, providing limits of detection (LOD) of 6.63 pg/mL for Aβ40 and 3.74 pg/mL for Aβ42. Our proof-of-concept study confirms that the multi-sensing electrochemical immunosensor array (MEIA) platform enables simultaneous measurement of serum Aβ42 and Aβ40 peptide levels and is more informative in early stage AD animals than amyloid-labeling Aβ plaque PET imaging and behavioral tests.
Conclusion: We believe this study greatly expands the applications of silk fibroin-based materials, is an important contribution to the advancement of biomaterials, and would also be valuable in the design of new types of multichannel electrochemical immunosensor arrays for the detection of other diseases.
Keywords: point-of-care testing (PoCT), Alzheimer's disease, amyloid-beta (Aβ), silk fibroin, microPET
Introduction
Alzheimer's disease (AD), one of the most common chronic and progressive forms of neurodegenerative disease, is pathologically regarded as the deposition of β-amyloid (Aβ) peptides including 39-42 amino acid residues in the brain [1, 2]. The Aβ species tend to aggregate to form different types (i.e., oligomers, fibrils, and plaques) that lead to degeneration of neuron function over time [3]. Among the different kinds of Aβ species in human cerebrospinal fluid (CSF), monomeric Aβ40 and Aβ42 are the two predominant proteolytic products, resulting from cleavage of amyloid precursor protein (APP) by β- and γ-secretase [4]. Measuring the levels of Aβ42 and Aβ40 in the CSF to determine the presence of plaques [5] has been an effective tool in the analysis of AD progression. However, the invasive procedure for collecting CSF is dangerous and painful for patients, thus limiting the application of these biomarkers. Previous studies have shown that circulating Aβ peptides in the blood provide insight into the Aβ equilibrium between the brain and periphery. Shibata et al. [6] hypothesized that there must be a clearance mechanism at the blood-brain barrier (BBB) to prevent Aβ accumulation and aggregation in the brain, and they have proven that low-density lipoprotein receptor-related protein-1 mediates transport of Aβ across the BBB to the periphery [7]. As a result, the plasma or serum Aβ level is potentially promising as a candidate marker for diagnosis and pre-clinical prediction.
Conventional strategies including neuroimaging approaches such as magnetic resonance imaging (MRI), positron emission tomography (PET), and single-photon emission computed tomography (SPET) are able to detect Aβ, but those neuroimaging methodologies have not yet been extended to clinics due to the equipment being complicated and requiring a high degree of expertise to operate. In addition, near-infrared fluorescence (NIR), surface plasmon resonance (SPR), and surface enhanced Raman spectroscopy (SERS), are also capable of measuring soluble Aβ for the assessment of AD progression and pathogenesis. Surface-enhanced Raman scattering (SERS) spectroscopy has emerged as a powerful ultrasensitive analytical technique in detecting plasma Aβ [8, 9] and quantitatively understanding the aggregation mechanism of Aβ. Unfortunately, large and efficient SERS enhancements are commonly confined within the nanostructured metal surface, therefore, hampering the direct acquisition of the vibrational spectra of large biomolecules, such as most of the proteins. An AuNP-based biosensor showed a detection limit of 1.5 pM with respect to Aβ1-42 in detecting ApoE4-mediated Aβ deposition under biological conditions using a localized SPR [10]. Matrix-assisted laser desorption/ionization time-of-flight mass spectrometry (MALDI-TOF-MS) is able to detect plasma Aβ in complex mixtures, which might provide better selectivity; however, it is time-consuming and needs sophisticated purifying procedures. Ignoring the preparation time of the sensing system, the whole detection process takes at least 2-3 h [11]. In comparison, electrochemical sensing methodologies provide rapid, selective/sensitive detection, easy integration, and are being urgently investigated to monitor Aβ in biofluids for AD diagnostics.
Nanomaterial-based modifications have shed light on mechanisms for enhancing sensitivity/selectivity of electrochemical immune-sensors by tuning electrode morphology and surface chemistry. Islam et al. [12] developed a microfludic biosensor for Aβ42 detection with a detection range of 100-300 μM using cyclic voltammetry (CV) by direct absorption of Aβ42 on the AuNPs surface. Liu et al. [13] reported a simple and sensitive electrochemical strategy for the detection of total Aβ peptides using gold nanoparticles modified with Aβ1-16-heme (denoted as Aβ1-16-heme-AuNPs). However, the sensitivity and selectivity with the above methods for Aβ absorption is still limited and a detection limit of 10 pM was achieved because only the planar interface exerts the responsive effect. Recently, a conductive nanostructured interface was proposed to enhance sensitivity/selectivity. Zhai et al. [14] presented a highly sensitive glucose enzyme sensor based on Pt nanoparticles-polyaniline hydrogel heterostructure. Yang et al. [15] designed a high-performance poly-3,4-ethylenedioxythiophene (PEDOT) nanofiber matrix for entrapment of glucose oxidase (GOx) to detect glucose at a lower polarization potential. Nevertheless, these biosensors lacked the tuning surface chemistry necessary to enhance the conjugation of enzymes or antibodies for higher sensitivity.
In this study, we intended to design a highly sensitive/selective nanostructured interface for electrochemical immune-sensors using conductive silk fibroin (SF)-based immunoparticles (CSIPs). Owing to its adjustable surface chemistry, SF assembles into nanospheres with enriched hydrophilic N-terminal sites on the shell surface for antibody conjugation through a salting-out process. By doping 3,4-ethylenedioxythiophene (EDOT) monomers into hydrophobic domains of SF and in-situ oxidized short poly(3,4-ethylenedioxythiophene) (PEDOT) chains along the SF backbone, the SF-based immunoparticles were bridged together through one-step electrophoresis/electropolymerization to form a continuous heterostructure. This hydrophilic interface favors the penetration of water-soluble biomolecules and seamless contact of analytic biomolecules, as well as catalyzes the electrochemical signals due to the high doping conductivity of PEDOT. Moreover, because of the toughness of SF, a three-dimensional structurally derived robust heterostructure can be fabricated by tuning the multiple electropolymerization cycles to enhance catalytic sensitivity. To demonstrate the proof-of-concept electrochemical detection for practical biomedical devices, we directly formed this nanostructured interface on a multichannel microelectrode array as a multi-sensing electrochemical immunosensor array (MEIA) to perform simultaneous detection of Aβ40 and Aβ42 levels in animal serum from triple-transgenic AD mice of different ages. The laboratory-designed approach demonstrated the potential to accelerate our understanding of the relationship between serum Aβ levels and AD progress. Moreover, molecular imaging with statistical analysis and behavioral tests were concurrently used to verify the precision.
Materials and Methods
Synthesis of CSIPs
B. mori silk fibroin solutions were prepared according to our previous published procedures [16]. Cocoons were boiled for 25 min in an aqueous solution of 0.02 M Na2CO3 and then rinsed thoroughly with distilled water to extract the sericin proteins. After drying, the extracted silk fibroin was dissolved in 9.3 M LiBr solution at 60 °C for 4 h, yielding a 20% (w/v) solution. This solution was dialyzed against distilled water using Slide-a-Lyzer dialysis cassettes (Pierce, molecular weight cut-off 3,500) for 72 h to remove the salt. The solution was optically clear after dialysis and centrifuged to remove the small amount of silk aggregates that formed during the process. The final concentration of silk in water was about 7.5% (= 68.7 mg/mL), determined by weighing the remaining solid after drying. In order to make silk fibroin and EDOT monomer dissolve each other, we kept the silk fibroin solution in a base condition (pH = 9), and then added EDOT/DMSO (100 μL/1 mL) solution in silk fibroin solution (ranging from 8250, 5500, 2750, 1375, 275, 55, and 27.5 μg/mL, each for 2 mL) to form a water-soluble mixture. Next, the mixture was sonicated for 30 min to make EDOT monomers anchoring into the hydrophobic domains along the silk fibroin protein backbone. After the SF/EDOT homogeneous aqueous solution was obtained, FeCl3‧6H2O and EDOT (Fe3+: EDOT = 3:1 mol/mol) were added and the reaction proceeded for 24 h at room temperature to carry out the oxidation polymerization. The supernatant solution was centrifuged at 8,050 rcf for 15 min to remove the undoped PEDOT chains. Next, K2HPO4 (1.25 M, pH = 8) was added into the above SF/EDOT homogeneous solutions to form nano-(micro) spheres by salting-out reaction, and then centrifuged for 15 min to remove the unreacted silk fibroin and EDOT aggregates that formed during the process. Finally, 5 SF concentrations (2750, 1375, 275, 55, and 27.5 μg/mL) with maximum doping EDOTs were used to synthesize 5 nano-(micro) particles; particles tended to aggregate into non-dispersible clusters in the salting out process when the SF concentration was larger than 3000 μg/mL.
Next, Aβ42 and Aβ40 antibody solutions (1 mL, 5 μg/mL) in 4 mM HEPES were incubated in the dark with 5 μL 10 mM NaIO4 for 30 min at room temperature, followed by quenching the reaction with 100 μL phosphate buffered saline (PBS). The 5 silk-based particles were incubated in MES (2-[N-morpholino] ethane sulfonic acid) conjugation buffer (pH = 6.25) for 1 h, then the obtained 5 silk-based particles (1 mL) were added into dehydrated anti-Aβ42 and anti-Aβ40 antibody solutions (1 mL, 5 μg/mL), which were purchased from Abcam (Anti-beta Amyloid 1-40 antibody [BDI350] and Anti-beta Amyloid 1-42 antibody [mOC31], Abcam, Cambridge, UK) for 2 h. The functionalized silk-based nanoparticle solutions were dialyzed against distilled water using Slide-a-Lyzer dialysis cassettes (20k MWCO, 12 mL) for 3 days to remove the unreacted antibodies and salt. Finally, the solution was centrifuged 3 times at 5,590 rcf for 20 min to achieve immunoparticles, named by CSIP40-1 to CSIP40-5 and CSIP42-1 to CSIP42-5, respectively.
Fabrication of MEIA platform for PoCT
To achieve multiple Aβ species sensing on the MEIA platform (the fabrication process and specifications of the MEIA platform are depicted in Figure S1 and Figure S2) with an in-built three-electrode configuration, a one-step electrophoresis/electropolymerization technique was applied. With a glass ring attached to the center of the MEIA chip as electroplating chamber, CSIP40-1 to CSIP40-5 and CSIP42-1 to CSIP42-5 as electroplating suspensions were used to conduct one-step electrophoresis/electropolymerization by CV using an electrochemical instrument (CHI 614C, CH Instruments, Inc., Austin, TX, USA). During the process, Ag/AgCl served as the reference electrode (No.002243, ALS Co., Ltd, Tokyo, Japan), and a platinum wire used as the counter electrode (No.002222, ALS Co., Ltd, Tokyo, Japan). Cyclic Voltammetry (CV) was scanned, ranging from +0.4 V to +1.4 V, within which the EDOT monomers were electropolymerized on the surface of the gold microelectrode at higher than 1.0 V. The CSIP40-1 to CSIP40-5 and CSIP42-1 to CSIP42-5 modified microelectrodes were fabricated.
Characterization of CSIPs
The morphology was examined using transmission electron microscopy (TEM; JEM-2100, JEOL Ltd., Tokyo, Japan), scanning electron microscopy (SEM; JSM S6700, JEOL Ltd., Tokyo, Japan) and inverted optical microscopy (OM; TE-2000U, Nikon Crop., Tokyo, Japan). The zeta potential and size of the CSIPs (1 mg/mL in water) were determined by laser Doppler anemometry (Delsa™ Nano C, Beckman Coulter, Inc., Brea, CA, USA) after being well-dispersed under ultrasound. Infrared spectroscopic analysis (FTIR, PerkinElmer Inc., Waltham, MA, USA) with a spectrum of 32 scans at 4 cm-1 resolution was performed on the gel films and probes. The analysis of surface morphology for the CSIP-modified electrode was performed with an Innova® atomic force microscope (AFM; Veeco Corp., Santa Barbara, CA, USA) in tapping mode using Tap300 cantilevers (Ted Pella, Inc., Redding, CA, USA). The scan rate was 0.4 Hz, and the scanning dimensions were set to 3 × 3 μm2. The topographic and simulated 3D images were obtained by using AFM with tapping mode, which was applied by setting z ramping with the tip at a single XY probe position. The antibody binding of CSIP-1 to CSIP-5 was quantified and evaluated by Bradford microassay. The intensity of absorbance was measured by a microplate ELISA reader (TECAN SunriseTM, Männedorf, Switzerland) at 595 nm. Each experiment was independently repeated three times (n = 3) for each substrate.
Electrochemical characterizations of CSIP-modified microelectrode
The electrochemical performance of the CSIP40-1 to CSIP40-5 and CSIP42-1 to CSIP42-5 modified microelectrodes on the MEIA platform with bounded antibody were tested using an electrochemical instrument (CHI 614C, CH Instruments, Inc., Austin, TX, USA) in a 0.01 M phosphate buffered saline (PBS) solution with an in-built three-electrode configuration. The parameters of the equivalent circuits were computed by ZView® software (Scribner Associates Inc. Southern Pines, NC, USA).
In vitro detection of Aβ40 and Aβ42 levels by MEIA platform and interference study
The electroactive methionine(35) (Met(35)) [17] reductive potential was chosen to measure current changes with different levels of Aβ. Since CSIP-2-modified microelectrode had optimal sensitivity among all CSIP-modified microelectrodes, the in-vitro experiments of CSIP40-2 and CSIP42-2 modified microelectrodes on the MEIA platform were conducted by linear sweep voltammetry (LSV) with different levels of Aβ40 and Aβ42 incubated in 0.01 M PBS ranging from 2 pM to 5 nM, at a scan rate of 0.1 V/s, with an in-built gold electrode as counter electrode and an in-built reference electrode. Amperometric responses were observed from the reduction at fixed optimal potential with Aβ40 and Aβ42 levels. As comparison to the in vitro serum test, the performances of the CSIP40 and CSIP42 modified microelectrodes on the MEIA platform were validated in vitro using 0.01 M PBS combined with several essential common proteins, which were 40 nM for Aβ40, 20 pM for Aβ42, and 400 pM for serum albumin and globulin, by LSV at a scan rate of 10 mV/s.
Determination of the detection limit
In this case, the limit of detection (LOD) is based on the standard deviation of response and slope, which can be expressed as 3 × σlow concentration / S, where σlow concentration is the standard deviation of the low concentration samples and S is the slope of the calibration line. The low concentration samples and blank samples were tested 10 times to calculate the standard deviation of low concentration samples.
Animal models
The experiments were carried out with the approval of the institutional animal care committee of National Yang Ming University, Taipei Medical University and National Chiao Tung University. The animals were kept in the laboratory animal center of Taipei Medical University under temperature-controlled environmental conditions (20 ± 3°C, 50-60% relative humidity) on a 12∶12 light-dark cycle and fed ad libitum. Altogether, 12 mice weighing ~20 g in two study groups were used in this study. The definition of animal groups was wild type (WT) control (n = 6) and AD models (n = 6) for the pairwise comparisons. The WT mice were B6129SF1/J (B6 × 129) mice [18], while the AD model mice were triple-transgenic Alzheimer's mice (3 × Tg-AD) [19]. The characteristics of this AD animal model contain three mutations associated with familial AD (APP Swedish, MAPT P301L, and PSEN1 M146V). The phenotypic and behavioral aspects found in AD were also displayed in this model [20].
Anesthesia
Mice were anesthetized with an inhalation anesthetic (isoflurane). Anesthesia was induced in an induction chamber (3% isoflurane and 3.5 L/min oxygen) for 6 min, after which the animal was placed in the animal MRI and PET/ computed tomography (CT) scanners, and fitted with a nose cone connected to a vaporizer to maintain 1.5% to 2% isoflurane with a gas flow of 3.5 L/min oxygen during the imaging procedure. Animal body temperature was maintained at 37 °C using a warm water circulation system (Thermo Fisher Scientific, Loughborough, UK).
Animal MRI
Anesthetized animals were placed into a stereotaxic holder compatible with the MRI acquisition systems and maintained normothermic using a water-based heating blanket at 37 °C. MRI scans of WT and 3 × Tg-AD mice in vivo at 4 to 6 months of age were performed on a 7 T Bruker Biospec 70/30 MRI system (Bruker Biospec 7030 USR, Ettlingen, Germany) equipped with a B-GA 12 gradient coil (BGA 12, 400 mT/m; rise time, 110 μs) inserted into the standard B-GA 20 S gradient coil set up (Bruker BioSpin, Ettlingen, Germany). A 72 mm inner diameter volume coil was used for excitation together with a dedicated mouse brain quadrature surface coil. A pressure sensor (SA Instruments, Inc., Stony Brook, NY, USA) was positioned under the abdomen of the mouse to monitor respiration (maintained at 55 breaths/min to 65 breaths/min). The T2-weighted anatomical images were obtained using a rapid acquisition with refocused echoes (RARE) sequence (TR = 2500 ms, TE = 50 ms, RARE factor 2, matrix size = 256 × 256, field of view (FOV) = 25 mm × 25 mm, average = 2, slice thickness = 1 mm). The scan time was approximately 25 min.
Micro PET/CT
A micro PET/CT imaging study was conducted using the Triumph pre‐clinical tri‐modality (LabPET/X‐SPECT/X‐O CT) imaging system (TriFoil Imaging, Inc., Northridge, CA, USA). This system applied circular scanning protocols for both PET and CT acquisition, with a translation stage in a variable axial imaging range. The axial field of view for CT without stage translation was 60 mm. The CT system had a power-adjustable 10-ray emitter ranging from 50 to 80 kVp and a microfocus (< 50 μm) tube. The PET detector array consists of 11,520 individual bismuth germanate crystals arranged in 48 rings and 180 blocks, providing 31 transaxial slices 1.175 mm (center‐to‐center) apart, a 100‐mm transaxial FOV, and a 37‐mm axial FOV for the LabPET sub‐system. For PET imaging of Aβ plaques in the brain, [11C]6-OH-BTA-1 ([11C]PiB) is the extensive radiolabeled compound that quantifies Aβ-specific binding signal in the 3 × Tg-AD mice with small animal PET. [11C]PiB was provided by the cyclotron facility in the National PET/Cyclotron Center (NCPP) at the Taipei Veterans General Hospital.
Micro PET/CT scans were repeatedly performed the same day as MRI. The anesthetized mice were placed into a stereotaxic holder compatible with the micro PET/CT acquisition system and maintained normothermic using a water-based heating blanket, with their heads in the center of the FOV and fixed in the prone position. A 20‐min static data acquisition was performed in 3D list mode with an energy window of 350-650 keV at 20 min following a [11C]PiB (33.2 ± 1.4 MBq; volume < 0.3 mL) injection via the tail vein. After each PET scan, CT acquisitions were also performed for 3 min (FOV = 80 mm), providing anatomical information of each animal as well as the attenuation map for the later image reconstruction. The emission data were normalized and corrected for the tracer decay time. All list mode data were sorted into 3D sinograms, which were then single‐slice Fourier rebinned into 2D sinograms. Summation images from 20 to 40 min after [11C]PiB injection were 3D reconstructed using a Maximum Likelihood Estimation Method (MLEM) algorithm [21], resulting in an image volume consisting of 240 × 240 × 31 voxels, each voxel with a size of 0.25 × 0.25 × 1175 mm3.
Monomeric Aβ levels of mice sera using MEIA platform and sandwich ELISA
After each MRI/PET scan was completed, submandibular blood samples collected from anesthetized mice were used to measure the levels of Aβ40 and Aβ42 at the age of 4, 5, and 6 months (n = 6 as a group in each month for WT and 3 × Tg-AD mice). In this study, the serum samples were collected after centrifugation of submandibular blood in a serum-gel tube (SARSTEDT, Montreal, Canada) and stored at 2 to 8 °C. For electrochemical detection, the serum samples (50 μL each) at age 4 to 6 months in WT and AD mice were dipped onto the center of the MEIA platform containing an in-built three-electrode configuration to conduct LSV measurements. The LSV measurements by CSIP40 and CSIP42 modified microelectrodes were held at 0.098 V with a scan rate of 0.1 V/s using a multichannel electrochemical recording system (Model ED821, eDAQ Pty Ltd, Denistone East, Australia). The serum levels of Aβ40 and Aβ42 were calculated according to the calibrations of in vitro tests. All measurements were done in duplicate.
Aβ40 and Aβ42 ELISA kits (Colorimetric; BioSource, Camarillo, CA) were also used to measure the Aβ40 and Aβ42 amount, respectively, according to the manufacturer's protocol [22]. Briefly, 96-well plates, precoated with specific mouse monoclonal antibodies generated against mouse Aβ40 and Aβ42 were coated onto a microplate and then used to capture Aβ40 and Aβ42 from serum samples (50 μL each) at age 4 to 6 months in WT and AD mice. The Aβ40 and Aβ42 mouse monoclonal antibodies can detect serum monomeric Aβ40 and Aβ42. Anti-rabbit IgG antibodies, horseradish peroxidase-labeled, detected the mouse monoclonal antibody. After addition of the stop solution into the substrate, the amounts of Aβ40 and Aβ42 were determined. Aβ peptides used as standard were prepared in 0.5 mL of Standard Diluent Buffer supplemented with 50 μL of 1 × Protease Inhibitor Cocktail (Calbiochem, San Diego, CA, USA). The standard curve demonstrated a direct relationship between Optical Density (OD) and Aβ40 and Aβ42 levels, i.e., the higher the OD the higher the Aβ40 and Aβ42 levels in serum samples. The plate was read at 450 nm on an absorbance microplate ELISA reader (TECAN SunriseTM, Männedorf, Switzerland) and analyzed for statistical significance. All measurements were done in duplicate. The serum levels of Aβ were corrected for dilution factor, and expressed as pg Aβ per mL serum.
Quantification of [11C]PiB PET
A co-registration technique with stand-alone PET and MRI scanners [23] was used to mark the specific brain regions. The implemented algorithm was based on the mutual information [24], providing smaller registration error when compared to other algorithms in the small animal brain for registration of PET to MRI [25]. An MRI template in Paxinos atlas space was created from the individual co-registered anatomical MRI datasets of all animals in this study and, together with the CT scan, used as the basis for region of interest (ROI) definition (Figure S3) according to the Paxinos atlas [26]. Three brain areas, bilateral thalami, bilateral cerebralcortices, and bilateral hippocampi were drawn to obtain the regional [11C]PiB PET signal uptake, which was averaged in each ROI and expressed as percentage of injected dose per cubic centimeter (%ID/cc).
Statistical analysis
All values are shown as mean ± standard deviation (SD). Statistical analysis was performed using a Kruskal-Wallis test for differences between WT and AD groups. Statistical significance was defined as a *P value of 0.05 and **P of 0.01 or less.
Results and Discussion
Fabrication of nanostructured immunoparticle-based interface
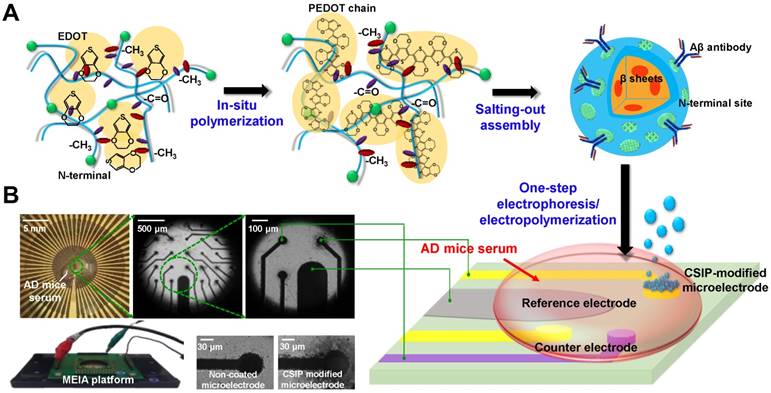
Figure 1A shows the formation of the immunoelectrochemical interface through one-step electrophoresis/electropolymerization deposition with CSIPs on the laboratory-designed MEIA to provide high sensitivity/specificity for Aβ species. The CSIPs were synthesized by a salting-out assembly process where SF with its long hydrophobic domains and short intervening hydrophilic spacers provides a negatively charged N-terminus and positively charged C-terminus at a physiological pH of 7.4 [27]. The formation of conductive SF-nanoparticles was strongly dependent on pH at various EDOT doping concentrations (Figure S4). At a higher pH, such as pH = 9, most charged amino acid side chains except the C-terminus are negatively charged, resulting in a rather elongated molecular conformation in solution due to the repulsive charge-charge interactions along the biopolymer backbone. The space between proteins enables hydrophobic EDOT monomers to easily dope into the hydrophobic domains so that PEDOT chains form along the SF protein backbone via oxidized polymerization with FeCl3 addition. As the SF/PEDOT composite was dispersed in potassium phosphate solution (K2HPO4, 1.25 M, pH = 9), nano-(micro) particles formed through a salting-out process as a hydrophobic core-hydrophilic shell structure enriched with N-terminal sites. The as-synthesized nanoparticle's N-terminal site directly formed covalent attachment with the fragment crystallizable region (Fc) moiety of antibodies by dehydration reaction [28], where the antigen binding sites on the antigen-binding fragment (Fab) portion were directed outward and, therefore, available for targeting. An XPS analysis was conducted to prove the Aβ antibodies were conjugated to the surface of the as-synthesized nanoparticles (See Figure S5). An electrophoresis process was applied for the deposition of negatively-charged CSIPs onto the positively-charged microelectrode by giving positive potentials between 0.4 V to 1.4 V, and a hierarchical structure formed from the CSIPs bridging with each other by PEDOT electropolymerization due to side-grafted PEDOT chains along the SF protein backbones. A real-time deposition process of CSIPs was also recorded by CV (Figure S6) where peak I and peak II indicated the tyrosine oxidation [29] and EDOT oxidation, respectively, proving the existence of bound antibodies and occurrence of electropolymerization. An optical image of the integrated MEIA platform is given in Figure 1B, depicting a well-fabricated chip for immune-electrochemical sensing with AD mouse serum. The central region of the chip includes a built-in three-electrode system, comprising recording sites modified by CSIPs, counter sites and reference sites made of gold, as well as conductive tracks.
(A) Schematic diagram showing the production of CSIPs by a salting-out assembly. The CSIPs were bridged together to construct an immunoelectrochemical interface via one-step electrophoresis/electropolymerization for PoCT in AD progression. (B) Optical images of the MEIA platform (including 56 recording sites as immunoelectrochemical recording sites or counter sites, and 4 reference electrodes), magnified top-view images of the central part of the MEIA chip, and magnified images of non-coated microelectrode and CSIP-modified microelectrode.
Structural and chemical properties of CSIPs
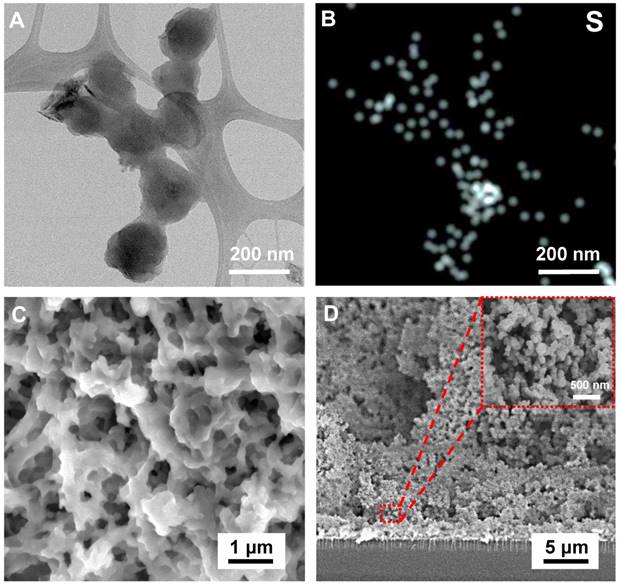
Figure 2A shows a TEM image of spherical 100-200 nm CSIPs with slight coagulation due to the hydrogen bonding and hydrophobic-hydrophobic interaction of PEDOT on the particle surface. The element mapping image of “S” in Figure 2B shows that the PEDOT exists in/on the silk fibroin-based nanoparticles, demonstrating that the interconnected PEDOT chains surrounding SF nanoparticles promote the connection of CSIPs together by one-step electrophoresis/electropolymerization. The top-view image in Figure 2C shows that the continuous heterostructure consists of interconnected PEDOT fibers and SF-based particles with a particle diameter of approximately 100-200 nm. During the electropolymerization process, the negatively charged CSIPs attach closely to the electrode interface of positively-charged gold electrode, thus forming a dense layer on the interface, as shown in Figure 2D. Subsequently, as the thickness of the hierarchical structure increases, the electropolymerization gradually decreases with the growth of the continuous structure and the hybrid CSIPs become more and more structure-disordered, thus forming a looser porous structure as demonstrated in the magnified view shown in the inset. The pores formed within the hybrid network also facilitate the uptake of electrolytes, as well as ion diffusion within the electrode. In addition, the hybrid framework is in situ synthesized so that the SF spheres are randomly and uniformly dispersed (repulsions among negatively charged SF spheres) on the electrode, thus preventing aggregation of SF spheres in the matrix layer. The average pore size and porosity were calculated to be 828.4 nm and 34.6%, respectively, based on analysis of the SEM images (n = 10) using Image J software (Image J 1.51h software, U.S. National Institutes of Health, Bethesda, MA, USA). Consequently, this hierarchical CSIP interface with high surface area and continuous pathways for ion/electron transport in the matrix layer can improve the redox charge transfer from polymer matrix to electrode as well as enhance the sensitivity and selectivity for the detection of Aβ.
(A) A TEM image showing the nanospherical structure of ~100-200 nm CSIPs. Based on the PEDOT hydrophobic force, CSIPs present slight coagulation through casting. (B) Element Sulfur mapping image of the TEM view. (C) A top-view SEM image of the CSIP heterostructure. (D) Cross-section SEM image of the hierarchical CSIP interface and its magnified view.
The FTIR spectrum (Figure S7) of the PEDOT reveals the chemical structure with a thiophene ring of -C-S-C stretching (640 cm-1), -C-S (767, 855, and 970 cm-1), -C-C (1495 cm-1), and -C=C (1630 cm-1). The SF showed the characteristic peaks of amide I, amide II, and amide III peaking at 1661, 1542 cm-1 and 1244 cm-1, respectively. It was also observed that the groups of the -S-C, -C-C, and -C=C peaks in thiophene were suppressed and band shifted in CSIPs because PEDOT chains were immersed into the main matrix of the SF-based spheres. Moreover, the CSIPs showed two broad shifting peaks at 1516 cm-1 and 1631 cm-1, which were combined with -C-C/amide II and -C=C/amide, confirming the effective doping of PEDOT on the SF-based spheres in the CSIP heterostructure. In order to obtain optimal conductivity of CSIPs, 6 specific EDOT/SF ratios (with maximum EDOT doping) were chosen to synthesize the nanoparticles (Figure S8). The results show that with insufficient SF, macroscopic gelation formed in a salting-out assembly. However, with increasing SF concentration, the agglomeration of SF disappeared and uniform spherical nanoparticles formed, revealing that the size of the CSIPs increased with SF concentration, as shown in Figure 3A. The inset of Figure 3A shows the AFM images of CSIPs with SF concentrations of 55, 1325, and 2750 μg/mL. However, these nanoparticles tended to aggregate into non-dispersible clusters in the salting-out process when the SF concentration was larger than 3 mg/mL. Therefore, 5 nano-(micro) CSIPs (5 SF concentrations below 3 mg/mL with maximum EDOT doping) were used to construct the immunoelectrochemical interfaces to investigate their sensing performances. The size distribution of CSIPs by dynamic scattering light (DLS) (Figure S9) demonstrated that the lower concentration of SF presents a narrower size distribution upon salting-out and vice versa.
(A) Size diagram of silk-based nanoparticles with various SF protein concentrations. The shaded area shows the failure of particle formation with greater than 3.0 mg/mL SF (n = 3 in each group). The inset illustrates the AFM images for SF concentrations of 0.055, 1.375 and 2.75 mg/mL. (B) The zeta potential of CSIP-1 to CSIP-5 with/without Aβ40 antibody binding (n = 3 in each group). (C) Bode plots for CSIP40-1 to CSIP40-5 modified microelectrodes. (D) Nyquist plots of CSIP40-1 to CSIP40-5 modified microelectrodes.
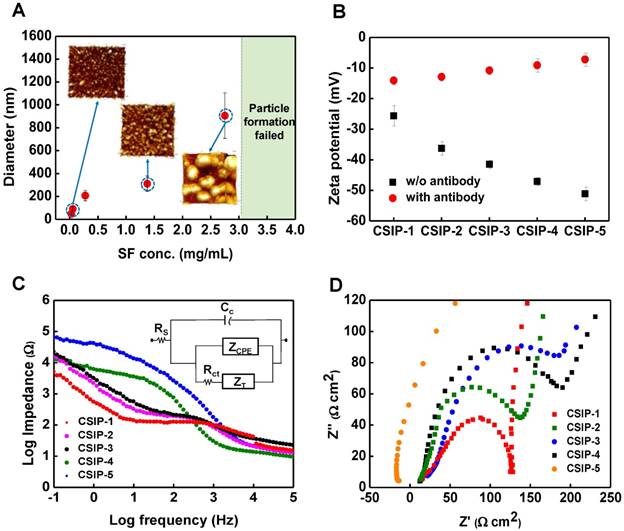
The zeta (ζ) potential was measured to evaluate the average surface properties on a single CSIP at 1 μg/mL Aβ40 antibody loading (Aβ40 antibody used for the evaluation). The CSIP solution was diluted 10 times to sustain the precision of measurement. With increasing SF concentration, the repulsive interactions along the protein increased, resulting in larger spaces among the SF proteins, resulting in the exposure of more N-terminal residues on the surface of the nanoparticles during the salting-out process. Without antibody binding, as shown in Figure 3B, the ζ potential of CSIPs decreased from -26 mV of CSIP-1 to -52 mV of CSIP-5 with increasing particle size. Compared to other CSIPs, CSIP-1 with smaller exposed N-terminal residues resulted in a slightly negative surface charge, which might result in slight agglomeration. In contrast, with antibody binding, the ζ potential of CSIPs increased slightly with SF concentration, but no obvious difference was observed in CSIP-1 and CSIP-5, indicating that most of the negatively charged N-terminal sites (antibody binding sites) were neutralized by Aβ antibody coupling, particularly for CSIP-1 agglomeration.
Electrochemical characterizations of CSIP-modified microelectrode
The electrochemical properties of CSIP-modified microelectrodes on the MEIA platform (we used CSIP40-modified microelectrodes) were evaluated to analyze the electrochemical impedance spectroscopy (EIS) results by Bode plot and Nyquist plot. The electrode/electrolyte interface can be further described with the equivalent circuit model as shown in the inset of Figure 3C using solution resistance (Rs), capacitor impedance (Cc), double layer interface impedance (Cdl, also called ZCPE), and infinite diffusion impedance (ZT) as EIS parameters. The two dominant parameters of the double layer interface impedance (ZCPE) and charge transfer resistance (Rt) were obtained to determine the overall electrochemical impedance of CSIP40-modified microelectrodes. It was observed that the net impedance increased from CSIP40-1 to CSIP40-5 modified microelectrodes at low frequencies. The CSIP40-1 showed the smallest impedance compared to other CSIP-modified microelectrodes because CSIP40-1, with the electropolymerized PEDOT and higher surface areas, can lower the thickness of the electrical double layer and provide more complex multiplexed channels for charge transfer, resulting in high ion/charge conductivity. In Figure 3D, the values of Rct (the diameter of the semicircle in the Nyquist plot) of CSIP40-1 to CSIP40-5 modified microelectrodes were calculated to be 62.5, 75.8, 194.2, 243.7, and 3080.4 Ω, respectively, from the Nyquist fitting plot by Zview software (Scribner Associates, Inc., Southern Pines, NC, USA). All CSIP40-modified microelectrodes presented similar profiles starting as a semicircle at high frequencies, except for CSIP40-5 because it displayed an uneven surface structure resulting from large particles. Although the CSIP40-1-modified microelectrodes had better conductivity than other CSIPs due to the lower Rct, CSIP40-2-modified microelectrode exhibited higher antibody binding due to the higher CV redox responses (Figure S10). We further tested the detection limit of CSIP-1 to CSIP-5 modified electrodes (Figure S11) and found that CSIP40-2 gave the lowest detection limit of 6.63 pg/mL, which is much lower than that of CSIP-1 (18.42 pg/mL). The results demonstrate that CSIP40-2-modified microelectrode is the best choice for proof-of-concept in vitro and ex vivo detection.
In vitro detection of Aβ peptides and interference study
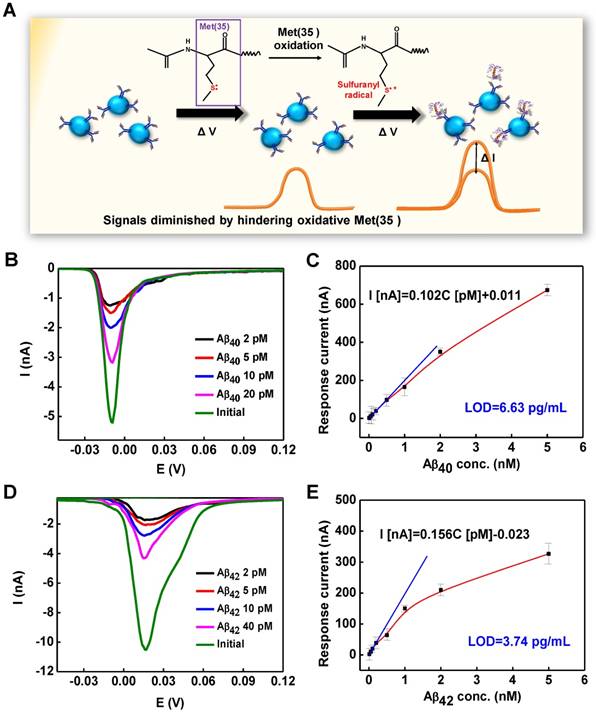
The detection mechanism of CSIP-modified microelectrodes is illustrated in Figure 4A. Prior to attaching Aβ species on the interface of the modified microelectrodes, signals could be observed from the oxidation/reduction reaction of electroactive Met(35) in the Aβ peptide sequences. As the binding site was occupied by a native Aβ peptide, the interface would be incapable of anchoring other Aβ peptide, and an electrochemical signal reduction from the oxidation/reduction of Met(35) would be recorded due to the specificity of the Aβ antibody to Aβ, indicating that the electrochemical changes correspond to the levels of native Aβ species. Each CSIP in the hierarchical structure has numerous binding sites available for anchoring Aβ species so that the electrochemical signals could be greatly amplified. Figure 4B demonstrates the reductive peaks at -0.011 V by LSV of CSIP40-2-modified microelectrode with continuous addition of Aβ40 monomers ranging from 20 pM to 2 pM. Similarly, Figure 4D shows the peaks at 0.013 V of CSIP42-2-modified microelectrode with Aβ42 monomer injections ranging from 40 pM to 2 pM. The sensitivity of CSIP40-2 and CSIP42-2-modified microelectrodes estimated by calibration curves is illustrated in Figure 4C and Figure 4E, respectively, showing the detection plot with different levels of Aβ monomers ranging from 2 pM to 5 nM. The sensitivity for CSIP40-2- and CSIP42-2- modified microelectrode can be expressed as I (nA) = 0.102 CAβ (pM) + 0.011 (R2 = 0.987) and I (nA) = 0.156 CAβ (pM) - 0.023 (R2 = 0.992), respectively. The calculated limits of detection (LOD) for CSIP-2 biosensor in detecting Aβ40 and Aβ42 were 6.63 pg/mL and 3.74 pg/mL at a visual linear detection range from 9- 2250 pg/mL for Aβ40 and 22.5-1125 pg/mL for Aβ42, respectively. Note that the deviations in the linear curve at high Aβ levels were attributed to the aggregation of Aβ, which hindered the oxidation of Met(35).
(A) The detection mechanism for bead-based immunosensing by the oxidation/reduction of Met(35) amino groups. (B) The LSV recorded by CSIP40-2 modified microelectrode with different concentrations of Aβ40 injections ranging from 20 pM to 2 pM. (C) The calibration plot of CSIP40-2 modified microelectrodes (n = 10 in each group). (D) The LSV recorded by CSIP42-2-modified microelectrode with different concentrations of Aβ42 injections ranging from 40 pM to 2 pM. (E) The calibration plot of CSIP42-2-modified microelectrodes (n = 10 in each group).
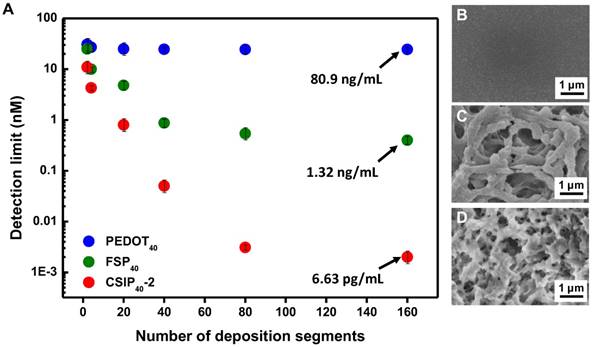
In order to evaluate the hierarchical effect on enhancing sensitivity of CSIP-modified microelectrode, the CSIP40-2-modified microelectrodes were fabricated with multiple deposition segments. For comparison, the gold microelectrodes with SF-free PEDOT immobilized with antibody (PEDOT40) and fibrous SF/PEDOT covalently bound with antibody (FSP40) were also fabricated using the same deposition segments as CSIP40-2. As shown in Figure 5, CSIP-modified microelectrode exhibited an enhancement factor of 1.22×10⁴ and 1.99×10² to a PEDOT40-modified microelectrode and FSP40-modified microelectrode, respectively. Although, PEDOT40 has a larger surface area with increased number of reactive sites, resulting in an extremely large responsive current. The increased current was offset by an increased background current noise and the poor water-solubility of PEDOT, which limits the sensitivity. In contrast, with the fibrous SF as the main structure, the FSP40-modified microelectrode was turned into a conductive hydrophilic interface, providing active sites to effectively bind antibodies at an Fc moiety site. As a result, FSP40-modified microelectrode exhibited better sensitivity than PEDOT40-modified microelectrode. Consequently, a greatly enhanced sensitivity was detected in CSIP40-2 modified microelectrode, which might be attributed to the following: 1) a porous nanostructure with high water solubility interface due to the hydrophilicity of SF (as measured by water contact angles shown in Figure S12) provided an analytic solution with perfect contact for the electrode matrix; 2) a β-sheet formation accompanied with silk fibroin nanoparticle self-assembly that assisted microcrystallization and alignment with the conformation of the π-conjugated PEDOT backbone [30].
(A) The detection limit vs. deposition segments of PEDOT40, FSP40, and CSIP40-2-modified microelectrodes (n = 3 in each group). (B-D) Top-view SEM images of PEDOT40, FSP40, and CSIP40-2 modified electrodes.
In addition, the electrodes were monitored by conducting CV every minute for a period of 20 min. Based on the responsive reductive signal data shown in Figure S13, the optimal incubation time was about 10 min when the responsive signals reached saturation. The stability of CSIP40-2 and CSIP42-2 modified microelectrodes is further illustrated in Figure S14. The stability of CSIP40-2 and CSIP42-2 remained 81.18 % and 86.34 % after 2 weeks, respectively. In addition, the CSIP40-2 modified microelectrode developed in this study enables the precise detection of serum Aβ levels in comparison with other electrochemical methods as listed in Table 1.
Comparison of several electrochemical sensors in detecting Aβ.
| Sensors | Method | Specialty | Detection limit | Reference |
|---|---|---|---|---|
| Aβ antibody/GCE | anti-IgG immuno | Aβ1-42/Aβ1-40 | 0.1 ng/mL | [31] |
| HRP-AuNPs-gelsolin | H2O2 production | N/A | 128.4 pg/mL | [32] |
| AuNPs-heme/Aβ1-16 | O2 reduction | Aβ1-42/Aβ1-40 | 45.8 pg/mL | [12] |
| Alkaline phospahte-cystein-Prp(95-115)peptide/GE | ECC redox | Oligomers | 61.9 pg/mL | [33] |
| SA-ALP/mAb/GE | p-AP redox (TCEP) | N/A | 22.5 pg/mL | [34] |
| PrPc-residues(95-110)/GE | EIS | Oligomers | 2.25 pg/mL | [35] |
| CSIPs, MEIA | Met(35) redox | Aβ40/Aβ42 | 6.63/3.74 pg/mL | This work |
CNT: carbon nanotube; GCE: glass carbon electrode; HRP: horseradish peroxidase; IgG: immunoglobulin G protein; mAb: monoclonal antibody; PrPc-residues95-110: biotinylated cellular prion protein; SA-ALP: streptavidin-conjugated alkaline phosphatase; TCEP: tris(2-carboxyethyl)phosphine.
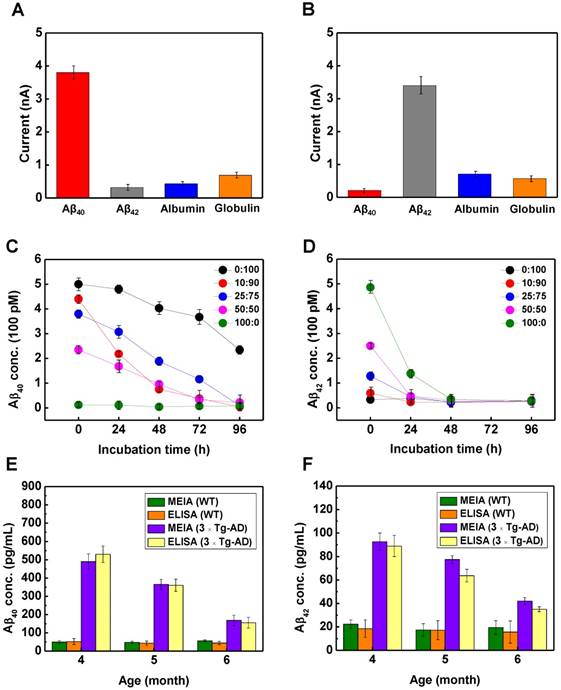
Since serum contains several different essential proteins, it is critical to maintain the specificity of the CSIP40-2 and CSIP42-2 modified microelectrodes on the MEIA platform towards monomeric Aβ isotopes. The specificity investigation is illustrated in Figure 6A-B. The oxidation peak values were measured before and after incubation of each microelectrode using each of the following solutions: 40 nM for Aβ40, 20 pM for Aβ42, 400 pM for serum albumin and globulin. For CSIP40-2-modified microelectrode, an obvious voltammetry signal (~3.7 nA) appeared when incubating Aβ40. Other signals obtained for Aβ42, serum albumin, and globulin were found to be minimal and statistically insignificant. The CSIP42-2-modified microelectrode also exhibited high specificity (strongly responsive to Aβ42 isotopes rather than other test proteins). So far, there have been few studies evaluating the temporal changes in serum Aβ levels or Aβ42/40 ratio in transgenic AD animal models.
Interference study of (A) CSIP40-2-modified microelectrode and (B) CSIP42-2-modified microelectrode injected with 40 nM for Aβ40, 20 pM for Aβ42, and 400 pM for serum albumin and globulin (n = 5 in each group). The detection of (C) CSIP40-2 and (D) CSIP42-2 MEIA platform with incubation time at different ratios of monomeric Aβ42:Aβ40 concentrations, respectively (n = 3 in each group). The Aβ40 and Aβ42 level in male WT and 3 × Tg-AD mice at 4, 5 and 6 months were measured by (E) CSIP40 -2 and (F) CSIP42-2 modified microelectrodes on the MEIA platform, respectively. Data were evaluated by MEIA and ELISA (n = 6 for each group).
Measuring Aβ peptide levels with different Aβ42/40 ratios
For proof-of-concept validation of a serum test, 5 different Aβ42/40 molar concentration ratios of 0/100, 10/90, 25/75, 50/50 and 100/0 were prepared for in situ measurement (Figure 6C-D). Electrochemical measurement of both Aβ40 and Aβ42 levels was performed to monitor the daily aggregation behaviors of Aβ40 and Aβ42 monomers in a 0-96 h incubation. Higher levels of Aβ peptides in the mixture resulted in lower responsive Aβ oxidative signals with an incubation time for the modified microelectrode, illustrating that the oxidation signals of Met(35) are suppressed in aggregated Aβ species adsorbed on the modified electrode, corresponding to a smaller number of Met(35) residues exposed to the microelectrode surface. Briefly, in a short time of 0-24 h, high Aβ42 tended to self-assemble into curly protofibrils at a rapid rate due to the β-sheet conformation and later favored the very tethered mature fibrils when binding with Aβ40 monomers [36]. Therefore, Aβ42 content in a range around 0.11-0.25 of Aβ42/Aβ40 ratio (Aβ42/Aβ40 = 10:90 to Aβ42/Aβ40 = 25/75 in this case) induced a very rapid onset of aggregation in a rich Aβ40 monomers environment [37], as a result of the hidden Met(35) residues with reduced oxidation signals, as shown in Figure 6C. In contrast, in a relatively low Aβ40 environment, Aβ40 tended to form full length mature fibrils in spite of increasing Aβ42 monomers as initiating seeding with incubation time. In Figure 6D, the reduction rate of Met(35) signals was induced with increasing Aβ42 monomer seeding because protofibrils were massively produced in a short time by seeding Aβ42 monomers, and fibrillogenesis of Aβ42 was accelerated with time. In summary, these Aβ42/40 mixture conformational transitions could be electrochemically detected as a concomitant decrease in the Met(35) oxidation current.
Real serum test
According to a previous study, 3xTg-AD mice develop plaques beginning at 6 months of age and neurofibrillary tangles (NFTs) at 12 months. 3xTg-AD mice display synaptic dysfunction, including long-term potentiation deficits before plaque and tangle pathology [19]. 3xTg-AD mice showed memory deficits at 4-6 months, which were correlated with the accumulation of intraneuronal Aβ in the hippocampus and amygdala [38]. Consequently, we focused on early detection of Aβ levels of 4-, 5-, and 6-month-old 3xTg-AD mice to define the relationship between serum Aβ level and AD progression. To compare the performances of the CSIP40-2 and CSIP42-2 modified microelectrodes on the MEIA platform, a standard ELISA assay was also conducted to evaluate serum Aβ40 and Aβ42 levels at 4 to 6-months as shown in Figure 6E and Figure 6F, respectively. For WT mice, both ELISA and MEIA showed no statistically significant variation in evaluating Aβ40 levels. However, ELISA showed larger variations in Aβ42 with MEIA because of the extremely low concentration in serum. In AD animals, Aβ40 and Aβ42 levels peaked at 4 months, but decreased during aging for both ELISA and MEIA. The absolute concentrations determined with the two assays showed a similar trend for Aβ40/42 levels in AD animals, indicating that our designed MEIA platform displayed great detection reliability. The reduction in serum Aβ during aging in AD animals may reflect more deposition of Aβ in the brain and Aβ elimination through brain blood vessels because of cerebrovascular dysfunction induced by more cerebrovascular amyloidosis [39]. Our results demonstrate that the serum Aβ40 and Aβ42 levels not only decrease with age, but also show statistically significant differences during aging in AD animals. Moreover, the MEIA platform gave measurements for evaluating the ratio of Aβ42 over Aβ40 and this might provide critical information about Aβ aggregation in the brain. The Aβ42/40 ratio was found in the range of 0.3 to 0.4 for WT animals; however, the ratio of Aβ42/40 in the range of 0.15 to 0.25 for AD animal increased during aging, which is proportional to AD progression (see Figure S15). Based on the results shown in Figure 6A-B, the rate of Aβ aggregation/fibril peaked at a molar ratio around 0.11 to 0.25 of Aβ42/40, but decreased when the contents of Aβ42 increased [40]. As a result, the Aβ42/40 ratio might also be helpful to understand the relationship between serum Aβ levels and AD progression.
Verification by microPET imaging and behavioral test
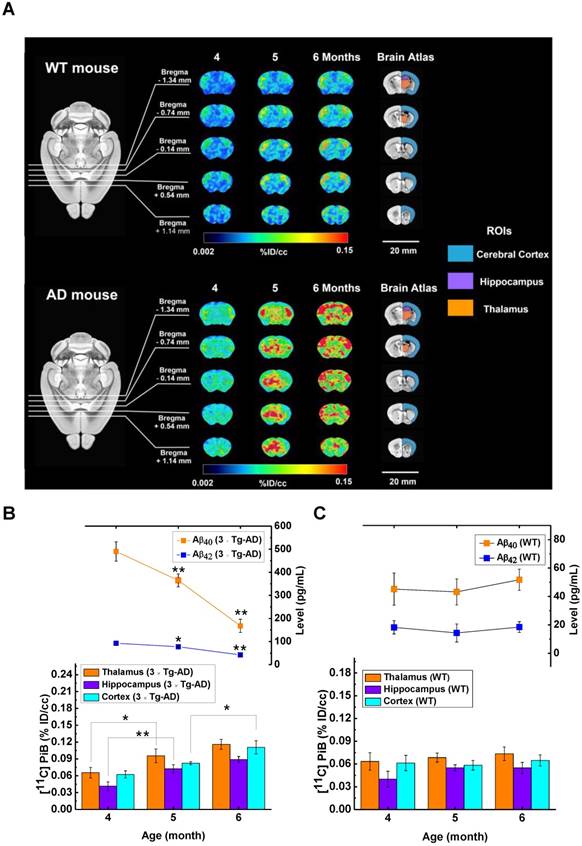
The [11C]PIB microPET imaging in vivo of Aβ plaque accumulations [41] for 4, 5 and 6-month AD and WT mice is depicted in Figure 7A. In Figure S16, the AD animals showed earlier onset and more rapid progression of Aβ plaque deposition compared to WT animals at the age of 5 months in the cerebral cortex and thalamus. Meanwhile, highly significant [11C]PiB uptake in the cerebral cortex, hippocampus and thalamus with Aβ plaques was found in AD animals as compared with WT animals at the age of 6 months. To further investigate the early diagnosis in AD animals by microPET, the [11C]PiB uptake levels were evaluated during aging (bottom of Figure 7B and Figure 7C for 6 × Tg-AD and WT mice, respectively). For the thalamus in AD animals, the [11C]PiB uptake levels increased with time and showed significant [11C]PiB uptake at 5 months vs. 4 months. For the hippocampus in AD animals, there were highly significant differences during aging in [11C]PiB uptake levels at 5 months vs. 4 months, while there was no significant difference at 6 months vs. 5 months. In contrast, for the cerebral cortex in AD animals, the levels of [11C]PiB uptake constituted significant [11C]PiB uptake only at 6 months vs. 5 months. From the results above, we can infer that [11C]PiB uptake did not clearly show the complete and continuous changes during aging in AD animals. However, the MEIA evaluation of Aβ40 and Aβ42 levels showed all significant changes or highly significant differences (*P < 0.05 and **P < 0.01, Kruskal-Wallis test) during aging in AD animals as shown in the upper layer of Figure 7B, indicating that MEIA reflects the progression of Aβ aggregation in brain and Aβ elimination through brain blood vessels over time. Finally, a novel object recognition (NOR) in Figure S17 was used to evaluate the learning and memory levels among AD animals of different ages. In brief, the comparison of AD and WT animals by preference index (%) did not show obvious differences among all ages. Only the preference index of AD animals at the age of 6 months was slightly lower than 50%, indicating that AD animals showed familiar object preference. The AD symptoms were not well recognized by the NOR behavioral trial although the MEIA showed significant changes during aging in AD animals. In summary, our developed MEIA assay may open up a reliable and fast multimodal approach for determining different types of serum Aβ levels, as well as investigating the role of this important biomarker of AD progression.
(A) MicroPET imaging of 6 × Tg-AD and WT mice at the age of 4 to 6 months (n = 6 for each group). Three brain areas, bilateral thalami, bilateral cerebral cortices, and bilateral hippocampi were drawn to obtain the regional [11C]PiB PET signal uptake, which was averaged in each ROI and expressed as a percentage of injected dose per cubic centimeter (%ID/cc). (B) The bottom figure shows [11C]PiB PET signal uptake in brain regions of thalamus, hippocampus and cerebral cortex for 6 × Tg-AD mice. The upper figure shows the Aβ40 and Aβ42 levels in male 6 × Tg-AD mice at 4, 5 and 6 months (n = 6), measured by MEIA. (C) The bottom figure shows [11C]PiB PET signal uptake in the brain regions of the thalamus, hippocampus and cerebral cortex for WT mice. The upper figure shows the Aβ40 and Aβ42 level in male WT mice at 4, 5 and 6 months (n = 6), measured by MEIA. All data are presented as the mean ± SD. *, P <0.05 (Kruskal-Wallis test) and **, P <0.01 (Kruskal-Wallis test) compared with 6 vs. 5 months and 5 vs. 4 months.
Conclusion
Here, we report a one-step electrophoresis/electropolymerization strategy for preparing a CSIP hierarchical interface that is easily integrated into a PoCT device. With the competitive assay, very low levels of Aβ40 and Aβ42 were detected and the LOD was estimated to be 6.63 pg/mL for Aβ40 and 3.74 pg/mL for Aβ42, which is comparable to that obtained by most other electrochemical detection methods. In addition, the laboratory-designed MEIA platform is able to electrochemically detect Aβ isotopes and remains much faster and simpler than the existing methods without the requirement for expensive and complicated instruments. More importantly, this assay provides useful information for early stage AD in comparison with other methods such as [11C]PiB PET or behavioral tests. We believe this study greatly expands the applications of silk fibroin-based materials, is an important contribution to the advancement of biomaterials, and would also be valuable in the design of new types of multichannel electrochemical immunosensor arrays for the detection of other diseases.
Abbreviations
Aβ: β-amyloid; AD: Alzheimer's disease; APP: amyloid precursor protein; AuNPs: gold nanoparticles; BBB: blood-brain barrier; Cdl: double layer interface impedance; CSF: cerebrospinal fluid; CSIP: conductive silk fibroin-based immunoparticles; CT: computed tomography; CV: cyclic voltammetry; EIS: electrochemical impedance spectroscopy; Fc: fragment crystallizable region; GOx: glucose oxidase; HEPES: 4-(2-hydroxyethyl)-1-piperazineethanesulfonic acid; LOD: limit of detection; MALDI-TOF-MS: matrix-assisted laser desorption/ionization time-of-flight mass spectrometry; MEIA: microelectrode immunosensor array; MES: 2-(N-morpholino)ethanesulfonic acid; Met(35): methionine(35); MRI: magnetic resonance imaging; NIR: near-infrared fluorescence; NOR: novel object recognition; OD: optical density; PBS: Phosphate buffered saline; PEDOT: Poly(3,4-ethylenedioxythiophene); PET: positron emission tomography; PoCT: point-of-care testing; Rct: charge transfer resistance; Rs: solution resistance; SD: standard deviation; SERS: surface enhanced Raman spectroscopy; SF: silk fibroin; SPET: single-photon emission computed tomography; SPR: surface plasmon resonance; 3 × Tg-AD: triple-transgenic Alzheimer's mice; WT: wild type; ZT: infinite diffusion impedance.
Acknowledgements
This work is financially supported by Ministry of Science and Technology of Taiwan under Contract numbers of MOST 106-2221-E-009 -065 -MY3, 105-2221-E-010 -014 -MY2 and 105-2221-E-009 -024 -MY3. We appreciate 7T animal MRI Core Lab of the Neurobiology and Cognitive Science Center for technical and facility support and C. H. Hsieh and J. H. Chen of the Instrumentation Center for MRI experiments at National Taiwan University. We also thank the Taiwan Mouse Clinic (MOST 104-2325-B-001-011) for the MicroPET/CT experiment, which is funded by the National Research Program for Biopharmaceuticals (NRPB) at the Ministry of Science and Technology of Taiwan.
Supplementary Material
Supplementary figures.
Competing Interests
The authors have declared that no competing interest exists.
References
1. Rauk A. The chemistry of Alzheimer's disease. Chem Soc Rev. 2009;38:2698-15
2. Rolinski OJ, Amaro M, Birch DJS. Early detection of amyloid aggregation using intrinsic fluorescence. Biosens Bioelectron. 2010;25:2249-52
3. Beeg M, Stravalaci M, Bastone A, Salmona M, Gobbi M. A modified protocol to prepare seed-free starting solutions of amyloid-β (Aβ)₁₋₄₀ and Aβ₁₋₄₂ from the corresponding depsipeptides. Anal Biochem. 2011;411:297-9
4. Golde TE, Eckman CB, Younkin SG. Biochemical detection of Aβ isoforms: implications for pathogenesis, diagnosis, and treatment of Alzheimer's disease. Biochim Biophys Acta. 2000;1502:172-87
5. Lewczuk P, Matzen A, Blennow K, Parnetti L, Molinuevo JL, Eusebi P, Kornhuber J, Morris JC, Fagan AM. Cerebrospinal fluid Aβ42/40 corresponds better than Aβ42 to amyloid PET in Alzheimer's disease. J Alzheimers Dis. 2017;55:813-22
6. Shibata M, Yamada S, Kumar SR, Calero M, Bading J, Frangione B, Holtzman DM, Miller CA, Strickland DK, Ghiso J, Zlokovic BV. Clearance of Alzheimer's amyloid-β1-40 peptide from brain by LDL receptor-related protein-1 at the blood-brain barrier. J Clin Invest. 2000;106:1489-99
7. DeMattos RB, Bales KR, Cummins DJ, Paul SM, Holtzman DM. Brain to plasma amyloid-beta efflux: a measure of brain amyloid burden in a mouse model of Alzheimer's disease. Science. 2002;295:2264-7
8. Haes AJ, Chang L, Klein WL, Van Duyne RP. Detection of a biomarker for Alzheimer's disease from synthetic and clinical samples using a nanoscale optical biosensor. J Am Chem Soc. 2005;127:2264-2271
9. Demeritte T, VirakaNellore BP, Kanchanapally R, Sinha SS, Pramanik A, Chavva SR, Ray PC. Hybrid graphene oxide based plasmonic-magnetic multifunctional nanoplatform for selective separation and label-free identification of Alzheimer's disease biomarkers. ACS Appl Mater Interfaces. 2015;7:13693-13700
10. Kang MK, Lee J, Nguyen AH, Sim SJ. Label-free detection of ApoE4-mediated β-amyloid aggregation on single nanoparticle uncovering Alzheimer's disease. Biosens Bioelectron. 2015;72:197-204
11. Nakamura A, Kaneko N, Villemagne VL, Kato T, Doecke J, Doré V, Fowler C, Li QX, Martins R, Rowe C, Tomita T, Matsuzaki K, Ishii K, Ishii K, Arahata Y, Iwamoto S, Ito K, Tanaka K, Masters CL, Yanagisawa K. High performance plasma amyloid-β biomarkers for Alzheimer's disease. Nature. 2018;554:249-254
12. Islam K, Jang YC, Chand R, Jha SK, Lee HH, Kim YS. Microfluidic biosensor for β-amyloid (1-42) detection using cyclic voltammetry. J Nanosci Nanotechnol. 2011;11:5657-62
13. Liu L, Zhao F, Ma F, Zhang L, Yang S, Xia N. Electrochemical detection of β-amyloid peptides on electrode covered with N-terminus-specific antibody based on electrocatalytic O2 reduction by Aβ(1-16)-heme-modified gold nanoparticles. Biosens Bioelectron. 2013;49:231-5
14. Li L, Wang Y, Pan L, Shi Y, Cheng W, Shi Y, Yu G. A nanostructured conductive hydrogels-based biosensor platform for human metabolite detection. Nano Lett. 2015;15:1146-51
15. Yang G, Kampstra KL, Abidian MR. High performance conducting polymer nanofiber biosensors for detection of biomolecules. Adv Mater. 2014;26:4954-60
16. Sofia S, McCarthy MB, Gronowicz G, Kaplan DL. Functionalized silk-based biomaterials for bone formation. J Biomed Mater Res. 2001;54:139-48
17. Prabhulkar S, Piatyszek R, Cirrito JR, Wu ZZ, Li CZ. Microbiosensor for Alzheimer's disease diagnostics: detection of amyloid beta biomarkers. J Neurochem. 2012;122:374-81
18. Haines DC, Chattopadhyay S, Ward JM. Pathology of aging B6;129 mice. Toxicol Pathol. 2001;29:653-61
19. Oddo S, Caccamo A, Shepherd JD, Murphy MP, Golde TE, Kayed R, Metherate R, Mattson MP, Akbari Y, LaFerla FM. Triple-transgenic model of Alzheimer's disease with plaques and tangles: intracellular Abeta and synaptic dysfunction. Neuron. 2003;39:409-21
20. Puzzo D, Lee L, Palmeri A, Calabrese G, Arancio O. Behavioral assays with mouse models of Alzheimer's disease: practical considerations and guidelines. Biochem Pharmacol. 2014;88:450-67
21. I. J. Myung. Tutorial on maximum likelihood estimation. J Math Psychol. 2003:47 90-100
22. Shih YY, Chen YY, Chen JC, Chang C, Jaw FS. ISPMER: integrated system for combined PET, MRI, and electrophysiological recording in somatosensory studies in rats. Nucl Instr Meth Phys Res. 2007;580:938-43
23. Wells 3rd WM, Viola P, Atsumi H, Nakajima S, Kikinis R. Multi-modal volume registration by maximization of mutual information. Med Image Anal. 1996;1:35-51
24. Vaquero JJ, Desco M, Pascau J, Santos A, Lee I, Sidel J, Green M. PET, CT, and MR image registration of the rat brain and skull. IEEE Trans Nucl Sci. 2001;48:1440-5
25. Franklin KB, Paxinos G. The mouse brain in stereotaxic coordinates. 4th ed. Boston, USA: Academic Press. 2012
26. Altman GH, Diaz F, Jakuba C, Calabro T, Horan RL, Chen J, Lu H, Richmond J, Kaplan DL. Silk-based biomaterials. Biomaterials. 2003;24:401-16
27. Lopes P, Xu M, Zhang M, Zhou T, Yang YL, Wang C, Ferapontova EE. Direct electrochemical and AFM detection of amyloid-β peptide aggregation on basal plane HOPG. Nanoscale. 2014;6:7853-7
28. Wu CH, Huang YY, Chen P, Hoshino K, Liu HY, Frenkel EP, Zhang XJ, Sokolov KV. Versatile immunomagnetic nanocarrier platform for capturing cancer cells. ACS Nano. 2013;7:8816-23
29. Casado N, Herna'ndez G, Veloso A, Devaraj S, Mecerreyes D, Armand M. PEDOT Radical polymer with synergetic redox and electrical properties. ACS Macro Lett. 2016;5:59-64
30. Ouyang BY, Chi CW, Chen FC, Xi QF, Yang Y. High-conductivity poly(3,4-ethylenedioxythiophene): Poly(styrene sulfonate) film and its application in polymer optoelectronic devices. Adv Funct Mater. 2005;15:203
31. Rama EC, González-García MB, Costa-García A. Competitive electrochemical immunosensor for amyloid-beta 1-42 detection based on gold nanostructurated screen-printed carbon electrodes. Sens Actuators B Chem. 2014;201:567-71
32. Yu Y, Sun X, Tang D, Li C, Zhang L, Nie D, Yin X, Shi G. Gelsolin bound β-amyloid peptides(1-40/ 1-42): electrochemical evaluation of levels of soluble peptide associated with Alzheimer's disease. Biosens Bioelectron. 2015;68:115-21
33. Liu L, Xia N, Jiang M, Huang N, Guo S, Li S, Zhang S. Electrochemical detection of amyloid-β oligomer with the signal amplification of alkaline phosphatase plus electrochemical-chemical-chemical redox cycling. J Electroanal Chem. 2015;754:40-5
34. Liu L, He Q, Zhao F, Xia N, Liu H, Li S, Liu R, Zhang H. Competitive electrochemical immunoassay for detection of β-amyloid (1-42) and total β-amyloid peptides using p-aminophenol redox cycling. Biosens Bioelectron. 2014;51:208-12
35. Rushworth JV, Ahmed A, Griffiths HH, Pollock NM, Hooper NM, Millner PA. A label-free electrical impedimetric biosensor for the specific detection of Alzheimer's amyloid-beta oligomers. Biosens Bioelectron. 2014;56:83-90
36. McGowan E, Pickford F, Kim J, Onstead L, Eriksen J, Yu C, Skipper L, Murphy MP, Beard J, Das P, Jansen K, Delucia M, Lin WL, Dolios G, Wang R, Eckman CB, Dickson DW, Hutton M, Hardy J. Abeta42 is essential for parenchymal and vascular amyloid deposition in mice. Neuron. 2005;47:191-9
37. Vandersteen A, Hubin E, Sarroukh R, Baets GD, Schymkowitz J, Rousseau F, Subramaniam V, Raussens V, Wenschuh H, Wildemann D, Broersen K. A comparative analysis of the aggregation behavior of amyloid-β peptide variants. FEBS Lett. 2012;586:4088-93
38. Billings LM, Oddo S, Green KN, McGaugh JL, LaFerla FM. Intraneuronal Abeta causes the onset of early Alzheimer's disease-related cognitive deficits in transgenic mice. Neuron. 2005;45:675-88
39. LaRue B, Hogg E, Sagare A, Jovanovic S, Maness L, Maurer C, Deane R, Zlokovic BV. Method for measurement of the blood-brain barrier permeability in the perfused mouse brain: application to amyloid-beta peptide in wild type and Alzheimer's Tg2576 mice. J Neurosci Methods. 2004;138:233-42
40. Jan A, Gokce O, Luthi-Carter R, Lashuel HA. The ratio of monomeric to aggregated forms of Aβ40 and Aβ42 is an important determinant of amyloid-β aggregation, fibrillogenesis, and toxicity. Biol Chem. 2008;283:28176-89
41. Zimmer ER, Parent MJ, Cuello AC, Gauthier S, Rosa-Neto P. MicroPET imaging and transgenic models: a blueprint for Alzheimer's disease clinical research. Trends Neurosci. 2014;37:629-41
Author contact
![]() Corresponding authors: You-Yin Chen, Department of Biomedical Engineering, National Yang Ming University, No.155, Sec.2, Linong St., Taipei, Taiwan 11221, R.O.C. Phone: +886-02-2826-7022; E-mail: irradiancenet.tw and San-Yuan Chen, Department of Materials Science and Engineering, National Chiao Tung University, No. 1001, Ta-Hsueh Rd., Hsinchu, Taiwan 30010, R.O.C. Phone: +886-03-5712121-31818; Fax: +886-03-5724727; Email: sanyuanchennctu.edu.tw
Corresponding authors: You-Yin Chen, Department of Biomedical Engineering, National Yang Ming University, No.155, Sec.2, Linong St., Taipei, Taiwan 11221, R.O.C. Phone: +886-02-2826-7022; E-mail: irradiancenet.tw and San-Yuan Chen, Department of Materials Science and Engineering, National Chiao Tung University, No. 1001, Ta-Hsueh Rd., Hsinchu, Taiwan 30010, R.O.C. Phone: +886-03-5712121-31818; Fax: +886-03-5724727; Email: sanyuanchennctu.edu.tw