Impact Factor
 Global reach, higher impact
Theranostics 2018; 8(17):4601-4603. doi:10.7150/thno.28837 This issue Cite
Erratum
Early Assessment of Tumor Response to Radiation Therapy using High-Resolution Quantitative Microvascular Ultrasound Imaging: Erratum
Sandeep K. Kasoji1, Judith N. Rivera1, Ryan C. Gessner1,2, Sha X. Chang1,3, Paul A. Dayton1 ![]()
1. UNC/NCSU Joint Dept. of Biomedical Engineering;
2. Sonovol, Inc. (current affiliation);
3. Department of Radiation Oncology, University of North Carolina.
Published 2018-8-18
Corrected-article in Theranostics, Volume 8, 156
Unfortunately, a coding error was discovered in the analysis code used for calculating volumetric vascular density (VVD). Specifically, the variable used as the devisor in the VVD calculation was not reinitialized in every iteration during whole batch analysis of the entire data set. This resulted in an error in calculations for most of the VVD growth curves for untreated, local control, and local failure tumors. We have corrected this error and reprocessed the data which was affected. Revised tables and discussion of results are provided here.
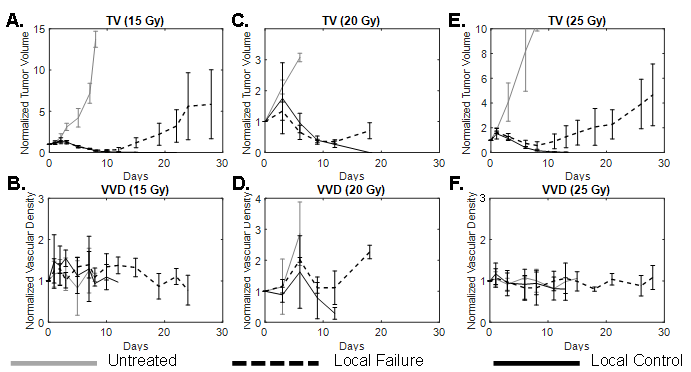
(Corrected) Figure 4:
A comparison of tumor volume (A, C, E) and tumor microvascular density (B, D, F) growth curves for local control (solid black), local failure (dotted black), and untreated tumors (solid gray) for each dose group. Sample sizes for local control, local failure, and untreated groups were 3, 4, and 2 for the 15 Gy group, 2, 3, and 5 for the 20 Gy group, and 5, 3, and 2 for the 25 Gy cohorts, respectively. Error bars represent standard deviation.
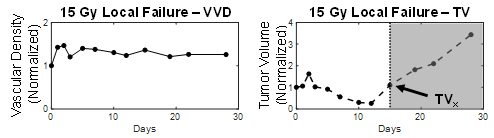
(Corrected) Figure 5:
Example of vascular density (left) and tumor volume (right) growth curves from a 15 Gy local failure. All measurements were normalized to baseline values. The increase in the growth curve demarcates the recurrence phase for local failure tumors, which is illustrated by the shaded region (TVx). VVDx could not be determined for this particular tumor from the original paper after the data was reprocessed, although other animals not shown in the original paper (Figure A) show a clear demarcation. VVDx was only determined for the 20 Gy cohort; due to noise in the individual VVD growth curves in the 15 and 25 Gy cohorts, VVDx could not be confidently determined.
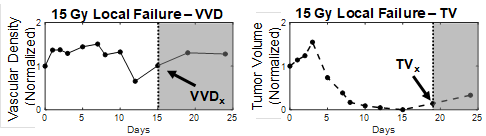
A new figure provided in this erratum only, showing VVD and TV in a different animal as an example of our method of visualizing change in the VVD and TV growth curves.
(Corrected) Figure 6 and Figure 6 Caption: [Vascular density measurements for days 7, 10, 15, and 19 should read 0.48, 0.46, 0.43, and 0.48, respectively.] A visual comparison of vascular density and tumor volume changes during the tumor recurrence phase of a 15 Gy local failure tumor. Measured VVD changes are not found to be significant. However, when looking at a maximum intensity projection of the 3D image, there are visual indications of newly formed vessels at days 15 and 19. The tumor boundary in the b-mode images is indicated by the solid yellow line.
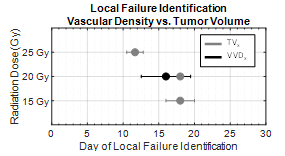
(Corrected) Figure 7:
Dose dependence of the early detection of treatment failure by tumor vascular density. Local failure identification using vascular density (black) occurred earlier than using tumor volume (gray). VVDx could only be determined for the 20 Gy group and not in the 15 or 25 Gy cohorts due to noise in the longitudinal growth curve data.
(Corrected) Table 2:
Statistical analysis of tumor volume and volumetric vascular density growth curves for each dose group. Significant differences were observed only in TV doubling time immediately post-treatment. Treated tumors experienced delayed tumor growth (increased TV doubling time) immediately after treatment. There were no other statistically significant growth curve trends between treated and untreated, and local control and local failure tumors.
| Untreated | All Treated | 15 Gy | 20 Gy | 25 Gy | ||||
|---|---|---|---|---|---|---|---|---|
| Local Control | Local Failure | Local Control | Local Failure | Local Control | Local Failure | |||
| TV Doubling time - Initial Response (days) | 1.9 ± 0.5 | 3.8 ± 2.6 (p=0.009) | 5.6 ± 3.4 | 3.4 ± 0.5 | 2.4 ± 1.4 | |||
| 5.5 ± 1.2 | 5.7 ± 4.7 | 3.6 ± 0.7 | 3.3 ± 0.3 | 2.3 ± 1.3 | 2.4 ± 1.9 | |||
| VVD increase - Initial Response (%) | 39.1 ± 105.0 | 32.8 ± 39.1 | 33.2 ± 26.9 | 85.6 ± 62.6 | 11.7 ± 21.9 | |||
| 36.8 ± 47.6 | 31.1 ± 10.9 | 62.2 ± 117.3 | 101.3 ± 7.6 | 17.2 ± 25.9 | 7.0 ± 22.6 | |||
| TV Halving time - Regression (days) | ~ | 3.0 ± 1.0 | 3.2 ± 0.7 | 2.8 ± 0.3 | 2.9 ± 1.4 | |||
| 2.5 ± 0.3 | 3.8 ± 0.5 | 3.0 ± 0.6 | 2.7 ± 0.1 | 2.1 ± 0.3 | 1.3 ± 1.6 | |||
| VVD Regression (%) | ~ | -20.4 ± 30.6 | -8.1 ± 33.0 | -49.0 ± 8.6 | --13.3 ± 27.8 | |||
| -25.2 ± 28.0 | -1.3 ± 35.1 | -55.0 ± 9.1 | -45.0 ± 6.8 | --15.2 ± 26.6 | --10.2 ± 35.6 | |||
| TV Doubling time - Recurrence (days) | ~ | 4.7 ± 2.1 | 3.6 ± 0.8 | 6.4 ± 3.4 | 4.5 ± 1.2 | |||
| VVD - Recurrence (%) | ~ | 26.6 ± 73.6 | -13.4 ± 68.0 | 100.7 ± 71.0 | 19.0 ± 22.5 | |||
(Corrected) Table 3:
Average initial TV and initial VVD values for each dose group. Larger initial TV were associated with local failure. There are no statistically significant differences in initial VVD between local failure and local control tumors.
| Dose (Gy) | Average Initial TV (mm3) (*p<0.05) | Average Initial VVD (*p<0.05) | ||
|---|---|---|---|---|
| Local Failure | Local Control | Local Failure | Local Control | |
| 15 | 171 ± 52 | 108 ± 40 | 0.32 ± .05 | 0.37 ± 0.11 |
| 20 | 230 ± 67 | 137 ± 110 | 0.14 ± 0.03 | 0.14 ± 0.02 |
| 25 | 290 ± 77 | 169 ± 39* | 0.49 ± 0.14 | 0.47 ± 0.10 |
Discussion
Our previous paper stated significant differences in volumetric vascular density (VVD) between local control and local failure tumors in all three radiation dose cohorts (15, 20, and 25 Gy). After correcting the analysis error, significant results were found for the 20 Gy cohort, but results for the 15 and 25 Gy results are no longer significant and are inconclusive. There was no significant difference in the time of tumor volume (TV) recurrence compared to VVD recurrence in the 20 Gy group. The average trends for the local failure and local control groups in the 15 and 25 Gy cohorts appear to follow the three response phases after RT (Table 2) until tumors reach a volume of ~100 mm3, at which point VVD is observed to decrease. This is likely due to a combination of increased tumor hypoxia and loss of contrast sensitivity outside the imaging field of view. Additionally, no correlation was found between initial TV values and initial VVD values in local failure tumors. An average increase in VVD was observed in two of the four 20 Gy untreated control tumors, however this was not observed in the 15 or 25 Gy cohorts, which may also be attributed to increased tumor necrosis and hypoxia due to the fast tumor growth rates.
References
1. Kasoji SK, Rivera JN, Gessner RC, Chang SX, Dayton PA. Early Assessment of Tumor Response to Radiation Therapy using High-Resolution Quantitative Microvascular Ultrasound Imaging. Theranostics. 2018;8(1):156-168 doi:10.7150/thno.19703
Author contact
![]() Corresponding author: Paul A. Dayton padaytonunc.edu Office: (919) 843-9521
Corresponding author: Paul A. Dayton padaytonunc.edu Office: (919) 843-9521