Impact Factor
- Issue 14; 2026
- Issue 13; 2026
- Issue 12; 2026
- Issue 11; 2026
- Issue 10; 2026
- Volume 16; 2026
- Advance Articles
- Past Issues
- Cover Images
- Cover Suggestion
- Index & Coverage
- Special Issues
Introduction
Materials and Methods
Results
Discussion
Conclusion
Abbreviations
Acknowledgements
References
International Journal of Biological Sciences
International Journal of Medical Sciences
 Global reach, higher impact

Theranostics 2018; 8(1):156-168. doi:10.7150/thno.19703 This issue Cite
Research Paper
Early Assessment of Tumor Response to Radiation Therapy using High-Resolution Quantitative Microvascular Ultrasound Imaging
Sandeep K. Kasoji1, Judith N. Rivera1, Ryan C. Gessner1,2, Sha X. Chang1,3, Paul A. Dayton1 ![]()
1. UNC/NCSU Joint Dept. of Biomedical Engineering;
2. Sonovol, Inc. (current affiliation);
3. Department of Radiation Oncology, University of North Carolina.
Received 2017-2-17; Accepted 2017-8-22; Published 2018-1-1
Abstract

Measuring changes in tumor volume using anatomical imaging weeks to months post radiation therapy (RT) is currently the clinical standard for indicating treatment response to RT. For patients whose tumors do not respond successfully to treatment, this approach is suboptimal as timely modification of the treatment approach may lead to better clinical outcomes. We propose to use tumor microvasculature as a biomarker for early assessment of tumor response to RT. Acoustic angiography is a novel contrast ultrasound imaging technique that enables high-resolution microvascular imaging and has been shown to detect changes in microvascular structure due to cancer growth. Data suggest that acoustic angiography can detect longitudinal changes in the tumor microvascular environment that correlate with RT response.
Methods: Three cohorts of Fisher 344 rats were implanted with rat fibrosarcoma tumors and were treated with a single fraction of RT at three dose levels (15 Gy, 20 Gy, and 25 Gy) at a dose rate of 300 MU/min. A simple treatment condition was chosen for testing the feasibility of our imaging technique. All tumors were longitudinally imaged immediately prior to and after treatment and then every 3 days after treatment for a total of 30 days. Both acoustic angiography (using in-house produced microbubble contrast agents) and standard b-mode imaging was performed at each imaging time point using a pre-clinical Vevo770 scanner and a custom modified dual-frequency transducer.
Results: Results show that all treated tumors in each dose group initially responded to treatment between days 3-15 as indicated by decreased tumor growth accompanied with decreased vascular density. Untreated tumors continued to increase in both volume and vascular density until they reached the maximum allowable size of 2 cm in diameter. Tumors that displayed complete control (no tumor recurrence) continued to decrease in size and vascular density, while tumors that progressed after the initial response presented an increase in tumor volume and volumetric vascular density. The increase in tumor volumetric vascular density in recurring tumors can be detected 10.25 ± 1.5 days, 6 ± 0 days, and 4 ± 1.4 days earlier than the measurable increase in tumor volume in the 15, 20, and 25 Gy dose groups, respectively. A dose-dependent growth rate for tumor recurrence was also observed.
Conclusions: In this feasibility study we have demonstrated the ability of acoustic angiography to detect longitudinal changes in vascular density, which was shown to be a potential biomarker for tumor response to RT.
Keywords: microbubble, acoustic angiography, dual-frequency, radiation therapy, ultrasound.
Introduction
Radiation therapy (RT) is one of the most common cancer treatment modalities and is used to treat 30-70% of all cancer patients in North America alone, by itself or in combination with surgery or chemotherapy [1]. RT is used either with curative intent for complete tumor eradication or local control, or with palliative intent to reduce tumor growth and symptom control. Unfortunately, patients often have varied tumor responses to RT due to differences in tumor type and other genetic and epigenetic factors [2]. Furthermore, the biological mechanisms of RT effects are still not well understood enough for clinicians to account for this variability [3]. For many types of cancers, the current clinical standard for assessing response to RT is RECIST (Response Evaluation Criteria in Solid Tumors), in which changes in tumor size are measured with MR and CT diagnostic imaging [4]. Unfortunately for patients receiving RT, the extent of tumor control (complete reduction in tumor size, tumor shrinkage, or cessation of tumor progression) is often not measurable until months after treatment [5]. Since a timely switch to an alternative treatment approach may lead to a better prognosis in cases where RT is not effective, it is important to determine response to therapy as early as possible [6]. The ability to measure early physiological biomarkers that indicate treatment failure prior to long term changes in tumor size would represent a significant advancement in early treatment response detection.
Hanahan et al proposed six “hallmarks of cancer” consisting of molecular characteristics of the tumor microenvironment that contribute to the development and proliferation of tumors, one of which is aberrant angiogenesis. Tumor neovascularization is signified by excessive sprouting of tortuous vessels within or near the tumor area, therefore increasing vessel density and in some cases, perfusion [7]. The tumor microvascular environment also plays an important role in the efficacy of RT. Endothelial apoptosis of tumor microvasculature is known to be a homeostatic factor in the regulation of tumor growth and is strongly correlated with tumor control when treated with radiation, therefore suggesting that DNA damage and consequential cell death due to exposure to ionizing radiation may not be the only significant factor determining the effect of RT [8]. Additionally, microvascular remodeling and angiogenesis after RT has been observed in animal models within two days of treatment using intravital optical microscopy, which demonstrates the highly dynamic nature of the tumor microvasculature [9]. While the biological basis of vascular remodeling is not entirely understood, patterns in the microvascular response to treatment may be a tell-tale sign of the fate of the treated tumor that can be discerned remarkably soon after therapy. Currently, there are very few clinical technologies available that have the sensitivity to measure microvascular structure. In this study, we propose a contrast ultrasound imaging technique to image and characterize tumor microvasculature in terms of volumetric vascular growth. We hypothesize that changes in tumor microvasculature caused by RT occur sooner than changes in tumor volume, and therefore can potentially be used as a biomarker for predicting tumor control.
Contrast enhanced ultrasound (CEUS) is a low-cost , non-ionizing, and safe imaging modality that can visualize and measure vascularity and perfusion in tissue with high contrast sensitivity compared to CT and MR [10]. The microbubble contrast agents used for CEUS are composed of a gas core and a stabilizing shell. Typically, the core consists of an inert gas such as a perfluorocarbon or sulfur hexafluoride, and common shell materials include PEGylated phospholipids or albumin. The gas is exhaled out through the lungs and the shell components are filtered and excreted through the liver and spleen via the reticuloendothelial system and phagocytic mechanisms [11]. Microbubbles are non-toxic unlike MR and CT gadolinium based and iodinated contrast agents, which are contraindicated in various patient populations due to their nephrotoxicity [12]. Commercial microbubbles are polydisperse and typically range from 1-5 µm in diameter, constraining them within the vasculature [13].
Advanced CEUS techniques can yield quantitative diagnostic information, including relative tissue enhancement, tissue perfusion, expression of endothelial biomarkers, and vascular structure [14-17]. CEUS perfusion imaging and molecular imaging (used for measuring tissue perfusion and endothelial molecular expression, respectively) have been investigated extensively in both pre-clinical and clinical settings for measuring vascular response to therapy and both short and long-term effects on tumor control [16,18,19]. Angiogenic-based cancer therapeutics (i.e. sunitinib, bevacizumab, sorafenib, Dll4-notch inhibitors) and RT alter the expression of angiogenic factors, thus interfering with microvascular growth or inflicting injury to the endothelium resulting in severe local hypoxia and tumor growth delay [20-23]. Molecular imaging has been shown to detect changes in angiogenic and inflammation endothelial biomarkers, such as vascular endothelial growth factor and P-selectin, that may predict response to therapy [16,24,25]. Perfusion imaging techniques, such as power Doppler and destruction reperfusion, have also demonstrated that tumor blood flow changes caused by RT by itself or in combination with adjuvant chemotherapy can be detected within days after treatment [18,26-29].
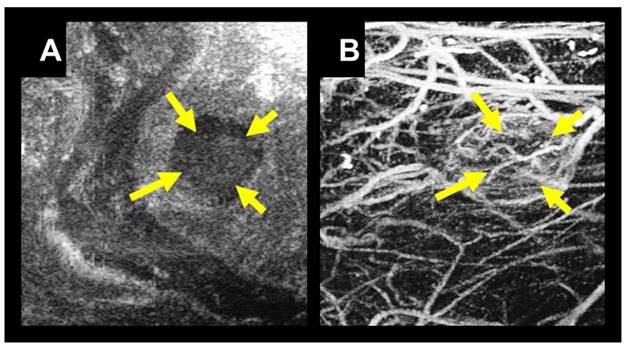
Acoustic angiography (AA) is a super-harmonic CEUS imaging technique that enables high-resolution microvascular imaging. This technique requires a confocal dual-frequency transducer design with a low frequency element to transmit and a high frequency element to receive at several harmonics higher than the transmit frequency [30]. The large bandwidth separation of the transmit and receive frequencies enables the detection of broadband microbubble signals while rejecting linear tissue signal. Reconstructing a stack of 2D images using this dual-frequency technique results in a high-resolution (100-200 µm) and high contrast-to-tissue ratio (30-40 dB) 3D image volume of the underlying microvasculature (Figure 1).
A) B-mode image in the coronal view of a tumor located in the right flank of a rat indicated with yellow arrows. B) A coronal maximum intensity projection of 3D intensity data from a stack of 2D acoustic angiography images in the same imaging area. Using acoustic angiography we can visualize the tumor tissue and microvasculature with exceptional tissue rejection.
These images can be subsequently segmented and analyzed to quantify vascular features such as vascular density, vessel tortuosity, and vessel diameter and can also be used to better assess the tumor boundary since abnormal microvasculature extends beyond the physical tumor space. Vessel morphology and density cannot be directly quantified with other clinically existing CEUS technologies due to the resolution limitations and relatively low signal-to-noise ratio. We have previously shown that quantitative acoustic angiography can detect and quantify abnormal vascular density and vessel tortuosity in areas of cancer growth compared to healthy tissue [31,32]. Our objective in this study is to demonstrate the sensitivity of acoustic angiography to detect and quantify changes in tumor vascular density in response to RT as an indicator for long-term treatment success or failure. We propose to begin this investigation under a simple high-dose single fraction treatment condition to demonstrate feasibility and potential benefit of our technique.
Materials and Methods
Rat and Tumor Models
All animal surgical and imaging procedures were reviewed and approved by the University of North Carolina at Chapel Hill Animal Care and Use Committee prior to conducting this study. Rat fibrosarcoma (FSA) tumor tissue gracious provided by the Dewhirst lab at Duke University was subcutaneously implanted in the right flank of 30 female Fischer 344 rats as previously described [33]. The rat FSA model was originally induced and isolated from Fischer 344 rats injected with the carcinogen, methylcholanthrene [34]. Rat FSA is characterized as a local, non-metastasizing tumor that is highly vascular and oxygen dependent [34, 35]. Because of its high vascularity, it is an appropriate tumor model for acoustic angiography imaging after RT, since we are specifically interested in the tumor vascular response to therapy. Because rat FSA is oxygen dependent, avascular regions typically undergo tissue necrosis [35].
Radiation Therapy and Monitoring
Once the tumors reached their target treatment size of 5-10 mm in diameter in the longest dimension of the sagittal plane, the tumors were given a single dose of radiation. The rats were split into four different dose cohorts and received either 0 Gy (treatment control, n=9), 15 Gy (n=8), 20 Gy (n=5), or 25 Gy (n=8) of radiation. The dose levels were determined during a longitudinal pilot RT study (unpublished) that was conducted at 0, 5, and 20 Gy. We found that 5 Gy had no tumor control, and 20 Gy had roughly 50% local control (tumor shrinkage and eventual disappearance) and 50% local failure (initial tumor shrinkage followed by a delayed tumor regrowth). We selected a dose level of 15-25 Gy as it allowed us to investigate the dose dependent correlation between TV change and VVD change for both local control and local failure groups with similar statistics.
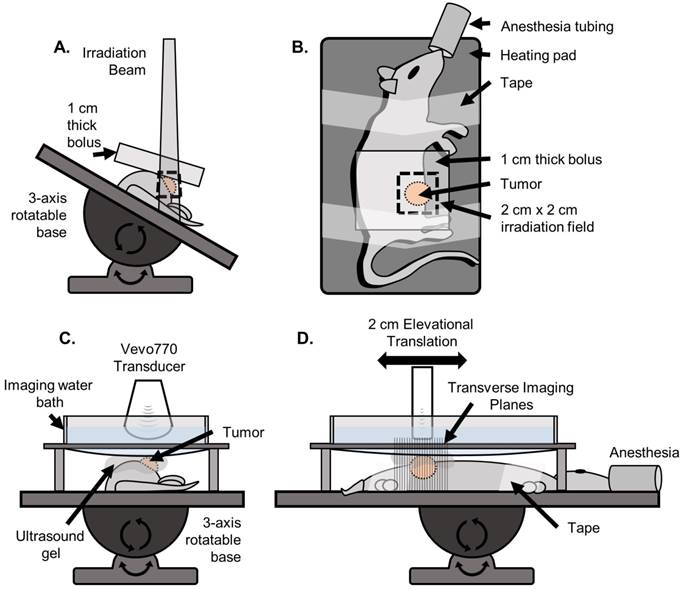
The rats were anesthetized using vaporized isoflurane and oriented in the left lateral recumbent position on a heating pad throughout the duration of the treatment with front and rear paws stabilized on the heating pad with medical tape. Positioning was performed using a rotatable rat positioning table (VisualSonics, Toronto Canada) so that the tumor was completely irradiated while minimizing exposure to the abdominal region (Figure 2). The rats were treated with a Primus II clinical linear accelerator (Siemens Healthcare, Malvern, PA) with a dose prescription of 6 MV photons, 2 cm x 2 cm collimated radiation field size at 100 cm source-to-skin-distance (SSD), and 1 cm of water-equivalent build-up material. All rats were monitored daily for the first 2 weeks following treatment, and then every third day thereafter. Additionally, the animals were all fed identical diets consisting of regular protein pellets and both calorie-rich and hydrating gels to mitigate excessive weight-loss and water-loss due to dehydration in the case of intestinal distress caused by radiation enteritis.
Setup used for irradiation and ultrasound imaging. A) (Front view) For irradiation, the rat was positioned on a heating pad mounted to a 3-axis rotatable base. The heating pad was rotated to an angle such that the irradiation beam was centered on the tumor while minimizing exposure to the abdominopelvic region. The 1 cm water-equivalent bolus was then placed on top of the tumor region. B) (Top view) The rat was secured to the heating pad using medical tape. A 2 cm x 2 cm irradiation field size was used. C) (Front view) For imaging, the rat was positioned on the same heating pad, oriented parallel to the floor such that the tumor was facing up. A custom designed water bath was used to separate the transducer from the gel while still being continuously coupled to the tumor, so that the mechanical translation of the transducer would not displace the gel causing decoupling and introducing air bubbles. D) (Side view) The transducer was mechanically translated in the elevational dimension for 2 cm for each scan.
Imaging Procedure
Rats were imaged immediately prior to radiation for baseline measurements. After the radiation treatment, imaging was performed daily for 3 consecutive days and then every 3 days for approximately 30 days or until the tumors reached the maximum size of 2 cm in the longest diameter.
During each imaging session, the rats were anesthetized using vaporized isoflurane and positioned on a heating pad as described above. A tail vein IV catheter was inserted for constant microbubble contrast infusion during acoustic angiography imaging. Microbubble contrast agents were prepared in-house using sterile techniques, as previously described [33]. The contrast was diluted with 0.9% sterile saline in a 1:1 ratio. The contrast agent was administered as a small bolus of 50 µL immediately followed by a constant rate of infusion of 40 µL/min using a pre-clinical infusion pump. Contrast was infused for 30 s before imaging was initiated to allow contrast flow to achieve a steady state and then was continued for the duration of the imaging scan. A total contrast volume of approximately 180 µL was injected for one acoustic angiography scan. The tumor region of the rat was shaved and depilated and ultrasound gel was applied onto the tumor region for ultrasound coupling. A custom imaging bath was used for all imaging to minimize gel decoupling during mechanical translation of the transducer (Figure 2). All imaging was performed on a Vevo 770 pre-clinical ultrasound scanner (VisualSonics, Toronto, ON, Canada) with a custom prototype dual-frequency transducer modified from a VisualSonics RMV707 probe, as previously described [36]. This transducer utilized a 4 MHz transmitter and a 30 MHz receiver, and was mechanically swept to acquire 2D images, and then translated in the elevational axis to acquire 3D data. A b-mode (anatomical) image volume was acquired over a 2 cm region, followed by an acoustic angiography scan over the same region. The elevational step size for each image was 100 µm. Two-frame averaging with a frame rate of 3 frames/s was used for all acoustic angiography imaging to improve the signal-to-noise ratio for producing optimal images.
Image Analysis
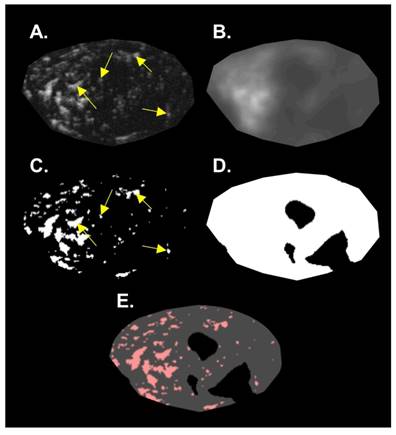
The b-mode images were used to calculate tumor volume (TV). The caliper feature on the Vevo 770 imaging software was used to measure the longest tumor diameter in each image axis to approximate the ellipsoidal volume of the tumor. The acoustic angiography images were post-processed using MATLAB (MathWorks, Natick, MA) to measure volumetric vascular density (VVD). It is important to identify and remove large hypoechoic regions to not overestimate the total perfused tissue volume [37,38]. We assumed that large hypoechoic regions were due to necrosis and hypoxia, based on tumor ex vivo observations and prior literature that describes rat FSA as a highly oxygen dependent tumor [35]. These hypoechoic regions will be referred to as “necrotic” for simplicity, which encompasses necrotic and perinecrotic regions. For identifying necrotic regions, a de-noising 2D median filter was applied to each frame of the acoustic angiography image slices to smooth the image and then a threshold was used to create a binary mask that identified large dark regions. This binary mask was then applied to the corresponding frame of the original acoustic angiography image followed by subsequent thresholding to identify the vessels using the local Otsu threshold method [39]. VVD was calculated by dividing the number of pixels representing vessels by the number of pixels representing the tumor tissue sans necrosis (Figure 3).
Summary of the image analysis for calculating VVD. A single 2D slice of a 3D volume is shown in this figure. A) The original acoustic angiography region of interest (ROI). B) The original image, de-noised with a 2D median filter. C) The binary vessel image of the original ROI produced by applying an Otsu threshold. D) The hypoechoic mask made by applying a threshold on the de-noised image (B). E) The mask (D) applied to the binary vessel image (C). Arrows indicate resolvable vessels that have been converted into binary by thresholding.
Data Analysis
At the end of the study, treated rats were retrospectively categorized based on the treatment outcome as either local failure (initial treatment response followed by tumor recurrence) or local control (full treatment response resulting in complete tumor disappearance). The 20 Gy study was terminated early at day 20 due to imaging schedule constraints. All local control tumors were monitored for the duration of the study (30 days) for tumor regrowth, followed by an additional 30 days.
TV and VVD growth curves for all individual rats were normalized by their respective baseline (pre-treatment) values. Initial TV growth curves (before tumor regression) and tumor recurrence rates were characterized by calculating their doubling times (Dt) using the following equation, where Dt is the doubling time, T0 is the time of initial measurement, V0 is the initial volume, and Vf is the final volume: Dt = (T - T0) × (log(2)/log(Vf)) - log(V0).
Similarly, TV regression was characterized by calculating the tumor halving times (Ht) using the following equation: Ht = (T - T0) × (log(1/2)/log(Vf)) - log(V0) [40].
Different phases of the VVD curves (initial response, regression, and recurrence phases) were characterized using linear regression.
TVx and VVDx represent the beginning of the recurrence phase for tumor volume and volumetric vascular density measurements, respectively, for an individual tumor. Statistical differences in growth curves and TVx and VVDx values were evaluated using the Mann-Whitney U-test, and differences observed between dose groups were evaluated with the Kruskal-Wallis test, followed by the Tukey Post-Hoc multiple comparison test (α = 0.05). All statistical analysis was performed in MATLAB.
Results
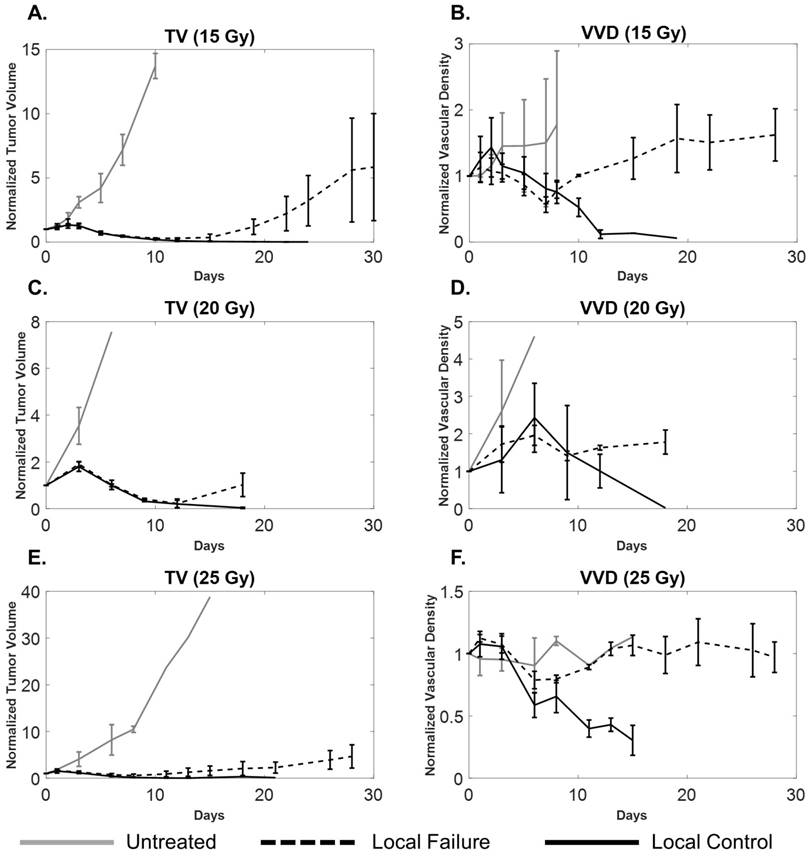
The treatment response statistics and sample sizes for each dose group are summarized in Table 1. Local failure, local control and untreated tumors in each dose group present distinctly different VVD and TV growth curves (Figure 4).
Treatment Response Statistics by Dose Group Summary statistics of the treatment outcomes for each dose group. Local tumor failure refers to tumors that initially responded but regrew and progressed, and local tumor control refers to tumors that completely disappeared after treatment.
| 15 Gy | 20 Gy | 25 Gy | |
|---|---|---|---|
| Local Tumor Failure | 5 (63%) | 3 (60%) | 3 (38%) |
| Local Tumor Control | 3 (38%) | 2 (40%) | 5 (63%) |
| Total Treated Tumors: | 8 | 5 | 8 |
A comparison of tumor volume (A, C, E) and tumor microvascular density (B, D, F) growth curves for local control (solid black), local failure (dotted black), and untreated tumors (solid gray) for each dose group. Sample sizes for local control, local failure, and untreated groups were 3, 4, and 2 for the 15 Gy group, 2, 3, and 5 for the 20 Gy group, and 5, 3, and 2 for the 25 Gy cohorts, respectively. Error bars represent standard deviation. Local failure tumors undergo a transient decrease in vascular density that correlates with tumor regression and eventually increases, correlating with tumor recurrence. For local control tumors, both TV and VVD decrease. The large error bars in TV and VVD curves are expected due to variability in tumor growth as well as heterogeneity of vascular supply.
Initial Response
Untreated tumors underwent normal, uninterrupted exponential volume growth with a mean doubling time of 1.9 ± 0.5 days (median: 1.9 days; range: 1.4 days; IQR: 0.6 days). All treated tumors presented delayed tumor volume growth after the treatment (day 0) until day 3, at a growth rate significantly less (p=0.009) than the untreated tumors with a mean tumor doubling time of 3.8 ± 2.6 days (median: 3.2 days; range: 11.7 days; IQR: 2.0 days). There was a non-significant decrease in the average tumor doubling time for treated tumors as RT dose increased. VVD of all treated tumors increased by an average of 18 ± 13%, significantly greater (p=0.023) than in untreated tumors, which increased by 4 ± 6%. There were no significant VVD or TV differences between local failure and local control tumors within each dose group (Table 2).
Tumor Volume and Volumetric Vascular Density Growth Curve Statistics Statistical analysis of tumor volume and volumetric vascular density growth curves for each dose group. Significant differences were observed in TV doubling time and VDD increase, immediately post-treatment. Treated tumors experienced delayed tumor growth (increased TV doubling time) immediately after treatment while VVD in treated tumors increased at a significantly higher rate than untreated tumors. There were no other statistically significant growth curve trends between treated and untreated, and local control and local failure tumors.
| Untreated | All Treated | 15 Gy | 20 Gy | 25 Gy | ||||
|---|---|---|---|---|---|---|---|---|
| Local Control | Local Failure | Local Control | Local Failure | Local Control | Local Failure | |||
| Tumor Volume Doubling time - Initial Response (days) | 1.9 ± 0.5 | 3.8 ± 2.6 (p=0.009) | 5.6 ± 3.4 | 3.4 ± 0.5 | 2.4 ± 1.4 | |||
| 5.5 ± 1.2 | 5.7 ± 4.7 | 3.6 ± 0.7 | 3.3 ± 0.3 | 2.3 ± 1.3 | 2.4 ± 1.9 | |||
| Volumetric Vascular Density increase - Initial Response (%) | 4.3 ± 6.1 | 18.1 ± 12.7 (p=0.023) | 21.0 ± 15.8 | 26.5 ± 10.2 | 10.0 ± 5.1 | |||
| 22.3 ± 21.3 | 20.5 ± 14.0 | 23.8 ± 15.3 | 28.3 ± 8.9 | 8.6 ± 5.9 | 12.4 ± 2.9 | |||
| Tumor Volume Halving time - Regression (days) | ~ | 3.0 ± 1.0 | 3.2 ± 0.7 | 2.8 ± 0.3 | 2.9 ± 1.4 | |||
| 2.5 ± 0.3 | 3.8 ± 0.5 | 3.0 ± 0.6 | 2.7 ± 0.1 | 2.1 ± 0.3 | 1.3 ± 1.6 | |||
| Volumetric Vascular Density Regression (%) | ~ | -12.8 ± 9.3 | -10.9 ± 4.9 | -20.9 ± 14.7 | -9.3 ± 5.0 | |||
| -10.4 ± 6.1 | -11.7 ± 3.5 | -26.0 ± 19.6 | -17.5 ± 14.1 | -11.1 ± 5.7 | -6.2 ± 1.0 | |||
| Tumor Volume Doubling time - Recurrence (days) | ~ | 4.7 ± 2.1 | 3.6 ± 0.8 | 6.4 ± 3.4 | 4.5 ± 1.2 | |||
| Volumetric Vascular Density recurrence (%) | ~ | 5.2 ± 3.2 | 7.2 ± 3.6 | 4.7 ± 3.3 | 3.2 ± 1.4 | |||
Tumor Regression
By day 5, all treated tumors experienced tumor regression where both tumor volume and vascular density decreased. There was no statistical difference in the regression rates of either TV or VVD between local control and local failure tumors in the 15, 20, and 25 Gy treatment groups. For local control tumors, the tumors continued to shrink and completely disappeared between days 15 and 20, accompanied with decreasing VVD (Table 2).
Tumor Recurrence
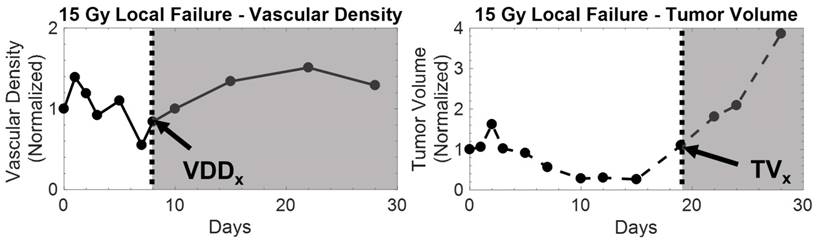
All local failure tumors rebounded and recurred between days 10 and 20 as indicated by their TV growth curves. VVD began to increase between days 7 and 11 and was also associated with tumor recurrence. Tumor recurrence occurred (non-significantly) earlier as dose increased as indicated by decreasing average TVx; VVD recurrence (average VVDx) was not statistically different between dose groups. When comparing TV and VVD curves for each individual tumor, the increase in VVD was observed earlier than the increase in TV (Figure 5). Figure 6 visually illustrates TV and VVD changes where VVD begins to increase while TV is still in the regression phase.
Example of vascular density (left) and tumor volume (right) growth curves from a 15 Gy local failure. All measurements were normalized to baseline values. In this particular local failure, vascular density begins to increase as early as day 8, while tumor volume regrowth occurs later. The increase in the growth curve for both metrics demarcates the recurrence phase for local failure tumors, which is illustrated by the shaded region. The tumor volume and vascular density growth curves of local failure tumors in each dose group behaved similarly.
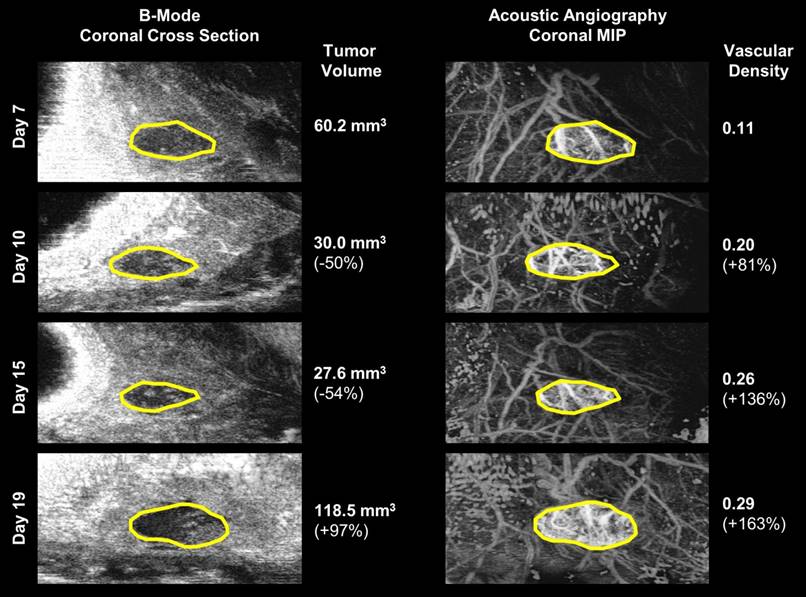
A visual comparison of vascular density and tumor volume changes during the tumor regrowth phase of the same 15 Gy local failure tumor plotted in Figure 4. Vascular density (right) noticeably increases from day 7 to day 19, while tumor volume (left) size continues to decrease until day 19. The tumor boundary in the b-mode images is indicated by the solid yellow line. Note that microvascular data is shown as a maximum intensity projection but is actually a 3-D data set.
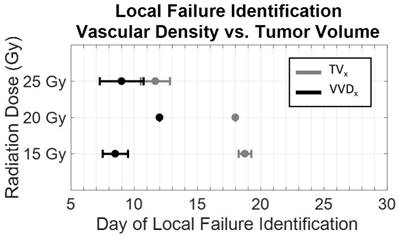
Increase in VVD for individual rats was observed 10.25 ± 1.5 days, 6 ± 0 days, and 4 ± 1.4 days earlier than increases in TV, in the 15 Gy*, 20 Gy*, and 25 Gy cohorts, respectively (Figure 7, *p<0.05). The initial tumor volumes were 157.8 ± 5.9 mm3, 182.9 ± 68.1 mm3, 201.4 ± 77.4 mm3, for the 15, 20, and 25 G groups, respectively. Variation in initial tumor volumes between groups was due to tumor growth difficulties; specifically, at the time of treatment, tumors either did not develop or grew too large (>1 cm in diameter) to be continued in the study. There were non-statistically significant differences in TV and VVD measurements between local controls and local failures; specifically, local failures exhibited higher TVs and VVDs (Table 3).
Dose dependence of the early detection of treatment failure by tumor vascular density. Local failure identification using vascular density (black) occurred earlier than using tumor volume (gray). With increasing dose, the difference in the time of identification between vascular density and tumor volume decreased. ([*] significant at p < 0.05).
Average Initial TV and VVD Values Average initial tumor volume and initial vascular density values for each dose group. Larger initial tumor volumes were associated with local failure. While not statistically significant, the average initial vascular density for local failure tumors was greater than local tumor control. This became less pronounced as dose increased.
| Dose (Gy) | Average Initial TV (mm3) (*p<0.05) | Average Initial VVD (*p<0.05) | ||
|---|---|---|---|---|
| Local Failure | Local Control | Local Failure | Local Control | |
| 15 | 171 ± 52 | 108 ± 40 | 0.25 ± .04 | 0.16 ± 0.10 |
| 20 | 230 ± 67 | 137 ± 110 | 0.26 ± 0.01 | 0.20 ± 0.05 |
| 25 | 290 ± 77 | 169 ± 39* | 0.27 ± 0.02 | 0.25 ± 0.04 |
No severe adverse health effects or significant weight loss were observed in any of the rats during the entirety of the study. The orientation of the rat during treatment minimized irradiation of the abdominopelvic region, resulting in less toxicity than in our previous studies where the rat was oriented perpendicular to the radiation beam. Mild radiation enteritis was experienced by fewer than 5 rats, which resulted in loose stool and an average of 5 g or 3% loss of body weight. This was mitigated with supplementary high calorie food and hydrogel water (Methods section). All rats with recurring tumors were euthanized at the end of the study. Rats with successfully treated tumors have been kept indefinitely (>180 days) since the end of the study and have not shown any signs of tumor recurrence.
Discussion
We have previously demonstrated that acoustic angiography can visualize microvasculature with high-resolution, and various quantitative metrics are sensitive to certain abnormal microvascular structural properties (e.g. tortuosity, density) that allow us to discern cancerous tissue from normal tissue [31,32]. Based on previous research that has demonstrated that microvascular remodeling occurs within days after radiation exposure using optical imaging, we hypothesized that quantification of microvascular changes using acoustic angiography may indicate response to therapy sooner than using tumor volume alone, the current clinical standard for assessing response to treatment [9]. In this work, we have demonstrated that quantitative acoustic angiography is sensitive to changes in microvascular density induced by RT and its feasibility as a tool for predicting treatment response.
We believe the clinical implications of our data are significant. In this tumor model, we have demonstrated that by quantifying the dynamic microvascular response to RT, tumor recurrence can be detected earlier than using tumor volume measurements alone. In clinical practice, irradiated tumors often do not significantly change in size until 3-4 months after treatment and therefore post-treatment imaging is also not performed during this time [41]. For any cancer patient, early detection of cancer and early assessment of treatment response is critical for maximizing the chance of improving or maintaining quality of life. By decreasing the wait time between treatment and post-treatment evaluation, we may be able to increase the probability of successfully modifying an unsuccessful treatment strategy to one that is tailored to the patient. This is specifically important for RT, which by itself is often used with radical intent more than in a palliative setting.
The results in this study using a rat FSA model demonstrate that changes in volumetric vascular density is a biomarker that presents differently in local control and local failure tumors in response to RT, and that vascular density regrowth associated with tumor recurrence in local failure tumors occurs significantly sooner than tumor volume regrowth. In the tumors that present local control, VVD and TV both decrease at similar rates until the tumor completely disappears.
We observe three phases after RT in both the VVD and TV curves, as described by Kozin et al: 1) initial treatment response presented by a continued increase in TV and VVD, 2) tumor regression phase presented by decrease in TV and VVD, and in local failure tumors, 3) tumor recurrence phase [42]. In the initial treatment response phase, we observed an increase in VVD that occurred at a significantly greater rate than in untreated tumors, most likely due to short term inflammation and subsequent hypervascularization caused by the high-dose RT. This observation is supported by previous pre-clinical studies that observed hyperperfusion immediately after RT [26]. Days before TV recurrence (TVx) is measurable in the local failure tumors, the tumors begin to undergo a rapid increase in vascular density that can be visualized on imaging and quantitatively measured. While we do not have data supporting why vascular density increases earlier than tumor volume, prior evidence suggests that the tumor endothelium experiences stress-induced expression of vascular endothelial growth factor (VEGF) and αvβ3-integrins, therefore evading cell death and possibly promoting revascularization and tumor cell proliferation [43,44].
In this study, we observed that the average tumor volume in the local failure tumors was larger than the local control tumors, in all dose groups, although the size difference was not significant due to variance. The increased likelihood of failure in RT treatment of larger tumors is consistent with radiation biology theory [45,46]. As expected, the tumor volume threshold corresponding with local control increased as a function of radiation dose (Table 3). We also observed that average initial vascular density was greater in local failure tumors compared to local control tumors; however, the differences were not significant and require further investigation (Figure 7). Although a higher VVD at the time of treatment might be associated with an increase in tumor oxygenation and improved RT outcome, this hypothesis remains unanswered with conflicting reported results from previous studies [47]. Hypoxic tumors are known to be more radioresistant than normoxic tumors due to a number of reasons including the lower probability of reactive oxygen species being produced by ionizing radiation thus forming fewer DNA strand breaks, as well as the negative effect of hypoxia on the pathway for DNA damage repair resulting in a more radioresistant cell type [48]. While many previous studies have observed a positive correlation between vascular density and therapeutic response, others have reported that vascular density has no effect, or an inverse correlation with treatment response [47,49]. We speculate that in this particular tumor model, endothelial cells within the larger tumors, which inherently have a higher VVD, may undergo a smaller fraction of lethal radiation damage than smaller tumors and can eventually repair, possibly encouraging tumor regrowth. Due to the variability in tumor growth rates and unforeseen treatment scheduling complications, our initial size distribution was not comparable in all dose groups and is a confounding factor in explaining the effect of initial vascular density on treatment outcome.
We observed earlier tumor recurrence with increasing dose; however, this requires further investigation. There are two possible explanations. First, as mentioned previously, the average initial (pre-treatment) TV was larger as dose increased, which may have resulted in a lower tumor cell kill fraction despite being treated with higher doses. Second, there is evidence that suggests that hypoxia induced by higher dose RT activates the unfolded protein response, protecting against hypoxia and resulting in the ability to more aggressively proliferate and metastasize [50]. However, further investigation is required to determine if FSA is affected by hypoxia-induced stress.
We chose to use a simple, single high-dose fraction treatment to demonstrate feasibility of our imaging technique. Our dosage scheme was determined based on pilot study results (unpublished) of a longitudinal RT study performed at 0, 5, and 20 Gy in the same rat and tumor model. In the 20 Gy treatment group, ~50% resulted in local control. We chose doses between 15 and 25 Gy to investigate the TV and VVD differences between local controls and local failures while also determining any dose dependent responses. Conventional dose fractionation, or the division of the total radiation dose into multiple smaller doses over 7-8 weeks, is clinically used to reduce healthy tissue toxicity by allowing cellular repair in between successive treatments [51]. At this point, the effect of a dose fractionated scenario on tumor VVD is unclear and is an important, clinically relevant question that still needs to be answered. Our high-dose treatment conditions are more relevant to stereotactic body radiotherapy (SBRT) or stereotactic radiosurgery (SRS), and hypo-fractionated radiation therapy, which precisely deliver high dose radiation to the target tissue with just a single or few treatments [52]. Hypofractionation and SBRT/SRS, while relatively new and controversial in the field of radiotherapy, are promising techniques that may reduce toxicity while improving tumor control [52-54]. The results from this initial study motivate us to conduct further investigation under experimental conditions closer to more clinically relevant applications that incorporate conventional and hypo-fractionated RT.
As mentioned previously, tumor hypoxia and necrosis play an important role in tumor response to radiation [50, 55]. The microvascular changes observed in this study are specific to the Fischer 344 rat fibrosarcoma tumor model. Since this tumor strain has been shown to be highly oxygen dependent we made an assumption that areas of hypovascularity (hypoechoic regions) represented necrotic and perinecrotic regions [35]. The motivation for removing the hypoechoic regions was to prevent overestimation of the perfused tissue volume. However, histology was not performed to confirm the hypoechoic regions as necrotic/perinecrotic to validate our analysis. This can be performed in future studies using the TUNEL assay and hematoxylin and eosin staining [56].
The diversity of human tumors is accompanied with a wide range of neovascularization patterns, including both avascular (hypoxic) and vascular development [7]. Further investigation using this technique in different types of human-derived tumor models is warranted since the microvascular response after exposure to radiation will likely vary among different tumor types. Regardless, we are encouraged from these results that quantitative microvascular measurements using acoustic angiography may significantly improve the current methods for treatment assessment.
The current dual-frequency prototype transducer suffers from resolution and imaging depth limitations. The resolution of acoustic angiography is between 100-200 µm, which places a limitation on the smallest size tumor that can be accurately analyzed for VVD. Tumors less than 1 mm in diameter may inaccurately measure VVD as high as 20-50% due to the resolution limitation. Additionally, due to the fixed focus of the dual-frequency transducer, our depth of field was limited to approximately 1.0 cm axially with a maximum depth penetration of ~2 cm. Tumors near 2 cm in diameter were clipped at the top and bottom in order to maintain the focus of the transducer in the center of the tumor. Acoustic angiography experiences substantial one-way frequency dependent attenuation due to the high frequency receive bandwidth, which limits the imaging penetration depth to superficial organs. Decreasing the transducer receiving frequency will improve the imaging penetration depth and depth of field, however the signal-to-noise ratio would be compromised due to the reduced separation between tissue signal and higher harmonic contrast signal. Conversely, increasing the receiving frequency will improve resolution, but at the cost of decreasing contrast sensitivity, penetration depth, and depth of field. Despite these limitations, acoustic angiography has remarkably high resolution and contrast sensitivity relative to clinically available CEUS techniques. Further, development of a linear array dual-frequency transducer will enhance acoustic angiography with the increased depth of field and faster image acquisition required for clinical translation [57,58]. Nevertheless, due to the high-frequency receive bandwidth, acoustic angiography will always be limited to imaging targets within a few cm of the skin. Neck cancers, prostate, and breast cancers might be reasonable targets, however deeper cancers in organs such as the liver will not be accessible without an endoscopic imaging tool.
It is also worth noting that new super-resolution imaging techniques may provide an alternative solution to imaging angiogenic vasculature with an order of magnitude better resolution once the technology matures. However, super resolution imaging still requires tens of minutes to acquire a 3D volume of data due to data acquisition and processing limitations [59].
In our study, we retrospectively categorized the treated tumors as local control or failure based on the final treatment outcome. The development of a predictive tool indicating treatment outcome based on repeated vascular density (or other vessel morphological features) and tumor volume measurements will be highly relevant to the clinical translation of this diagnostic technique. There has been a recent surge of interest in developing models for predicting a patient's outcome to cancer therapy. The field of Radiomics, for example, has been established to use large sets of minable MR, CT and PET imaging data to extract quantitative features such as tumor sphericity, homogeneity, and volume. When combined with other patient medical data, it can be analyzed using advanced bioinformatics statistical techniques to determine correlations to tumor behavior and treatment response [60]. Similarly, with acoustic angiography image data, we can extract additional quantitative features that describe microvascular characteristics of certain tumors and their response to therapy. We plan to continue investigating changes in vessel morphology (using metrics to describe vessel tortuosity) and molecular expression in response to RT in future studies. Contrast-enhanced ultrasound imaging is a safe, inexpensive, and highly accessible imaging modality with many applications in all fields of oncology, and with on-going technical improvements, acoustic angiography is a promising and clinically translatable imaging technology.
Conclusion
While the biological basis for the variation of tumor response to radiation is still not entirely understood, there is a growing body of evidence that suggests that the tumor microvascular environment plays a significant role in radiation treatment efficacy. Our objective in this study was to assess tumor response to radiation by quantifying changes in vascularity that may be associated with treatment outcome. Our results demonstrated that vascular changes, specifically increases in vascular density, are a potential biomarker for assessing long-term tumor response to RT. We believe that providing a more timely and reliable method for assessing treatment response may enable clinical treatment decisions to be made earlier than the current standard of care, therefore improving cancer patient outcomes.
Abbreviations
AA: acoustic angiography; VVD: volumetric vascular density; TV: tumor volume; RT: radiation therapy; FSA: fibrosarcoma; CEUS: contrast enhanced ultrasound; SRS: stereotactic radiosurgery; SBRT: stereotactic body radiotherapy.
Acknowledgements
The project described was supported by the National Institutes of Health through grant R01CA170665 and the National Center for Advancing Translational Sciences (NCATS), National Institutes of Health, through Grant Award Number UL1TR001111. The content is solely the responsibility of the authors and does not necessarily represent the official views of the funding agencies. The authors would like to acknowledge the UNC Department of Radiation oncology for providing access to the clinical linear accelerators for the animal treatments, as well as Dr. Stuart Foster, Mike Lee, Emmanuel Cherin, and Jay Son (Sunnybrook Research Institute) and Chris Chaggares and Desmond Hirson (Visualsonics) for their help with the development of our dual-frequency prototype transducers.
Competing Interests
Authors Paul A. Dayton and Ryan C. Gessner of this publication are co-inventors on the dual-frequency imaging approach described here and have equity ownership in Sonovol, Inc., a company that has licensed this patent. Other authors have declared that no competing interest exists.
References
1. Miller KD, Siegel RL, Lin CC, Mariotto AB, Kramer JL, Rowland JH. et al. Cancer treatment and survivorship statistics, 2016. CA Cancer J Clin. 2016;66(4):271-89 doi:10.3322/caac.21349
2. West CM, Barnett GC. Genetics and genomics of radiotherapy toxicity: towards prediction. Genome Med. 2011;3(8):52. doi:10.1186/gm268
3. Suit H, Skates S, Taghian A, Okunieff P, Efird JT. Clinical implications of heterogeneity of tumor response to radiation therapy. Radiother Oncol. 1992;25(4):251-260 doi:10.1016/0167-8140(92)90244-O
4. Eisenhauer EA, Therasse P, Bogaerts J, Schwartz LH, Sargent D, Ford R. et al. New response evaluation criteria in solid tumours: Revised RECIST guideline (version 1.1). Eur J Cancer. 2009;45(2):228-247 doi:10.1016/j.ejca.2008.10.026
5. Mardor Y. Early Detection of Response to Radiation Therapy in Patients With Brain Malignancies Using Conventional and High b-Value Diffusion-Weighted Magnetic Resonance Imaging. J Clin Oncol. 2003;21(6):1094-1100 doi:10.1200/JCO.2003.05.069
6. Brindle K. New approaches for imaging tumour responses to treatment. Nat Rev Cancer. 2008;8(2):94-107 doi:10.1038/nrc2289
7. Hanahan D, Weinberg RA. Hallmarks of cancer: The next generation. Cell. 2011;144(5):646-674 doi:10.1016/j.cell.2011.02.013
8. Garcia-Barros M, Paris F, Cordon-Cardo C, Lyden D, Rafii S, Haimovitz-Friedman A. et al. Tumor response to radiotherapy regulated by endothelial cell apoptosis. Science. 2003;300(5622):1155-9 doi:10.1126/science.1082504
9. Maeda A, Leung MKK, Conroy L, Chen Y, Bu J, Lindsay PE. et al. In vivo optical imaging of tumor and microvascular response to ionizing radiation. PLoS One. 2012:7 (8). doi:10.1371/journal.pone.0042133
10. Cokkinos DD, Antypa EG, Skilakaki M, Kriketou D, Tavernaraki E, Piperopoulos PN. Contrast enhanced ultrasound of the kidneys: What is it capable of?. Biomed Res Int 2013. 2013 doi:10.1155/2013/595873
11. Quaia E. Classification and Safety of Microbubble-Based Contrast Agents. Contrast Media in Ultrasonography: Basic Principles and Clinical Applications. Berlin, Heidelberg: Springer Berlin Heidelberg. 2005
12. Chang EH, Chong WK, Kasoji SK, Dayton PA, Rathmell WK. Management of indeterminate cystic kidney lesions: Review of contrast-enhanced ultrasound as a diagnostic tool. Urology. 2015
13. Wang L. Diagnostic value of quantitative contrast-enhanced ultrasound (CEUS) for early detection of renal hyperperfusion in diabetic kidney disease. J Nephrol. 2015
14. Dayton PA, Rychak JJ. Molecular ultrasound imaging using microbubble contrast agents. Front Biosci. 2007;12:5124-5142 doi:10.2741/2553
15. Gessner R, Dayton PA. Advances in molecular imaging with Ultrasound. Mol Imaging. 2010;9(3):117-127 doi:10.2310/7290.2010.00022
16. Streeter JE, Herrera-Loeza SG, Neel NF, Yeh JJ, Dayton PA. A comparative evaluation of ultrasound molecular imaging, perfusion imaging, and volume measurements in evaluating response to therapy in patient-derived xenografts. Technol Cancer Res Treat. 2013;12(4):311-21 doi:10.7785/tcrt.2012.500321
17. Dayton PA, Gessner RC, Phillips L, Shelton SE, Heath Martin K, Lee M. et al. The implementation of acoustic angiography for microvascular and angiogenesis imaging. Conf Proc IEEE Eng Med Biol Soc. 2014;2014:4283-4285 doi:10.1109/EMBC.2014.6944571
18. Su JM, Huang YF, Chen HHW, Cheng YM, Chou CY. Three-dimensional power doppler ultrasound is useful to monitor the response to treatment in a patient with primary papillary serous carcinoma of the peritoneum. Ultrasound Med Biol. 2006;32(5):623-626 doi:10.1016/j.ultrasmedbio.2006.01.005
19. Niermann KJ, Fleischer AC, Huamani J, Yankeelov TE, Kim DW, Wilson WD. et al. Measuring tumor perfusion in control and treated murine tumors: correlation of microbubble contrast-enhanced sonography to dynamic contrast-enhanced magnetic resonance imaging and fluorodeoxyglucose positron emission tomography. J Ultrasound Med. 2007;26:749-756 doi:26/6/749
20. Vasudev NS, Reynolds AR. Anti-angiogenic therapy for cancer: Current progress, unresolved questions and future directions. Angiogenesis. 2014;17(3):471-494 doi:10.1007/s10456-014-9420-y
21. Kuhnert F, Kirshner JR, Thurston G. Dll4-Notch signaling as a therapeutic target in tumor angiogenesis. Vasc Cell. 2011;3(1):20. doi:10.1186/2045-824X-3-20
22. El Kaffas A, Giles A, Czarnota GJ. Dose-dependent response of tumor vasculature to radiation therapy in combination with Sunitinib depicted by three-dimensional high-frequency power Doppler ultrasound. Angiogenesis. 2013;16(2):443-454 doi:10.1007/s10456-012-9329-2
23. Yoon SS, Stangenberg L, Lee YJ, Rothrock C, Dreyfuss JM, Baek KH. et al. Efficacy of Sunitinib and Radiotherapy in Genetically Engineered Mouse Model of Soft-Tissue Sarcoma. Int J Radiat Oncol Biol Phys. 2009;74(4):1207-1216 doi:10.1016/j.ijrobp.2009.02.052
24. Zhou J, Wang H, Zhang H, Lutz AM, Tian L, Hristov D. et al. Vegfr2-targeted three-dimensional ultrasound imaging can predict responses to antiangiogenic therapy in preclinical models of colon cancer. Cancer Res. 2016;76(14):4081-4089 doi:10.1158/0008-5472.CAN-15-3271
25. El Kaffas A, Smith K, Pradhan P, Machtaler S, Wang H, von Eyben R. et al. Molecular Contrast-Enhanced Ultrasound Imaging of Radiation-Induced P-Selectin Expression in Healthy Mice Colon. Int J Radiat Oncol Biol Phys. 2017;97(3):581-585
26. Park HJ, Griffin RJ, Hui S, Levitt SH, Song CW. Radiation-Induced Vascular Damage in Tumors: Implications of Vascular Damage in Ablative Hypofractionated Radiotherapy (SBRT and SRS). Radiat Res. 2012;177(3):311-327 doi:10.1667/RR2773.1
27. El Kaffas A, Nofiele J, Giles A, Cho S, Liu SK, Czarnota GJ. DLL4-notch signalling blockade synergizes combined ultrasound-stimulated microbubble and radiation therapy in human colon cancer xenografts. PLoS One. 2014:9 (4). doi:10.1371/journal.pone.0093888
28. Sunar U, Makonnen S, Zhou C, Durduran T, Yu G, Wang H-W. et al. Hemodynamic responses to antivascular therapy and ionizing radiation assessed by diffuse optical spectroscopies. Opt Express. 2007;15(23):15507-15516 doi:10.1364/OE.15.015507
29. Czarnota GJ, Karshafian R, Burns PN, Wong S, Al Mahrouki A, Lee JW. et al. Tumor radiation response enhancement by acoustical stimulation of the vasculature. Proc Natl Acad Sci. 2012;109(30):E2033-E2041 doi:10.1073/pnas.1200053109
30. Gessner R, Lukacs M, Lee M, Cherin E, Foster FS, Dayton PA. High-resolution, high-contrast ultrasound imaging using a prototype dual-frequency transducer: In vitro and in vivo studies. IEEE Trans Ultrason Ferroelectr Freq Control. 2010;57(8):1772-1781 doi:10.1109/TUFFC.2010.1615
31. Gessner RC, Aylward SR, Dayton PA. Mapping microvasculature with acoustic angiography yields quantifiable differences between healthy and tumor-bearing tissue volumes in a rodent model. Radiology. 2012;264(3):733-40 doi:10.1148/radiol.12112000
32. Shelton SE, Lee YZ, Lee M, Cherin E, Foster FS, Aylward SR. et al. Quantification of microvascular tortuosity during tumor evolution using acoustic angiography. Ultrasound Med Biol. 2015;41(7):1896-1904 doi:10.1016/j.ultrasmedbio.2015.02.012
33. Streeter JE, Gessner R, Miles I, Dayton PA. Improving sensitivity in ultrasound molecular imaging by tailoring contrast agent size distribution: In vivo studies. Mol Imaging. 2010;9(2):87-95 doi:10.2310/7290.2010.00005
34. Grant JP, Wells SA. Tumor resistance in rats immunized to fetal tissues. J Surg Res. 1974;16(5):533-540 doi:10.1016/0022-4804(74)90080-8
35. Schroeder T, Yuan H, Viglianti BL, Peltz C, Asopa S, Vujaskovic Z. et al. Spatial heterogeneity and oxygen dependence of glucose consumption in R3230Ac and fibrosarcomas of the Fischer 344 rat. Cancer Res. 2005;65(12):5163-5171 doi:10.1158/0008-5472.CAN-04-3900
36. Gessner RC, Frederick CB, Foster FS, Dayton PA. Acoustic angiography: A new imaging modality for assessing microvasculature architecture. Int J Biomed Imaging. 2013. 2013 doi:10.1155/2013/936593
37. Ungersma SE, Pacheco G, Ho C, Yee SF, Ross J, Van Bruggen N. et al. Vessel imaging with viable tumor analysis for quantification of tumor angiogenesis. Magn Reson Med. 2010;63(6):1637-1647 doi:10.1002/mrm.22442
38. Fenton BM, Paoni SF, Beauchamp BK, Ding I. Zonal image analysis of tumour vascular perfusion, hypoxia, and necrosis. Br J Cancer. 2002;86(11):1831-6 doi:10.1038/sj.bjc.6600343
39. Otsu N. A threshold selection method from gray-level histograms. IEEE Trans. Syst Man Cybern. 1979;9(1):62-66 doi:10.1109/TSMC.1979.4310076
40. Paling MR, Shawker TH, Dwyer A. Ultrasonic evaluation of therapeutic response in tumors: its values and implications. J Clin Ultrasound. 1981;9(6):281-288 Available from: http://ovidsp.ovid.com/ovidweb.cgi?T=JS&PAGE=reference&D=med2&NEWS=N&AN=6788808
41. Hermans R. Post-treatment imaging of head and neck cancer. Cancer Imaging. 2004;4:S6-S15 doi:10.1102/1470-7330.2004.0007
42. Kozin S V, Duda DG, Munn LL, Jain RK. Neovascularization after irradiation: What is the source of newly formed vessels in recurring tumors? J Natl Cancer Inst. 2012;104(12):899-905 doi:10.1093/jnci/djs239
43. Gorski DH, Beckett MA, Jaskowiak NT, Calvin DP, Mauceri HJ, Salloum RM. et al. Blockade of the Vascular Endothelial Growth Factor Stress Response Increases the Antitumor Effects of Ionizing Radiation. Cancer Res. 1999;59(14):3374-3378 Available from: http://cancerres.aacrjournals.org/content/59/14/3374.full
44. Palmowski M, Peschke P, Huppert J, Hauff P, Reinhardt M, Maurer M. et al. Molecular ultrasound imaging of early vascular response in prostate tumors irradiated with carbon ions. Neoplasia. 2009;11(9):856-63 doi:10.1593/neo.09540
45. Brenner DJ. Dose, volume, and tumor-control predictions in radiotherapy. Int J Radiat Oncol Biol Phys. 1993;26(1):171-179 doi:10.1016/0360-3016(93)90189-3
46. Johnson CR, Thames HD, Huang DT, Schmidt-Ullrich RK. The tumor volume and clonogen number relationship: tumor control predictions based upon tumor volume estimates derived from computed tomography. Int J Radiat Oncol Biol Phys. 1995;33(2):281-287
47. Lövey J, Lukits J, Remenár E, Koronczay K, Kásler M, Németh G. et al. Antiangiogenic effects of radiotherapy but not initial microvessel density predict survival in inoperable oropharyngeal squamous cell carcinoma. Strahlentherapie und Onkol. 2006;182(3):149-156 doi:10.1007/s00066-006-1447-6
48. Harada H. How Can We Overcome Tumor Hypoxia in Radiation Therapy? J Radiat Res. 2011;52(5):545-556 doi:10.1269/jrr.11056
49. Pignataro L, Carboni N, Midolo V, Bertolini F, Buffa R, Mario Cesana B. et al. Clinical relevance of microvessel density in laryngeal squamous cell carcinomas. Int J Cancer. 2001;92(5):666-670
50. Brown JM. Tumor Hypoxia in Cancer Therapy. Methods Enzymol. 2007:435 doi:10.1016/S0076-6879(07)35015-5
51. Withers HR. Biologic basis for altered fractionation schemes. Cancer. 1985;55(9 Suppl):2086-2095 doi:10.1002/1097-0142(19850501)55:9+3.0.CO;2-1
52. Magnuson WJ, Mahal A, Yu JB. Emerging Technologies and Techniques in Radiation Therapy. Semin Radiat Oncol. 2017;27(1):34-42
53. Jabbari S, Weinberg VK, Kaprealian T, Hsu IC, Ma L, Chuang C. et al. Stereotactic body radiotherapy as monotherapy or post-external beam radiotherapy boost for prostate cancer: Technique, early toxicity, and PSA response. Int J Radiat Oncol Biol Phys. 2012;82(1):228-234 doi:10.1016/j.ijrobp.2010.10.026
54. Hannan R, Tumati V, Xie X-J, Cho LC, Kavanagh BD, Brindle J. et al. Stereotactic body radiation therapy for low and intermediate risk prostate cancer-Results from a multi-institutional clinical trial. Eur J Cancer. 2016;59:142-151 doi:10.1016/j.ejca.2016.02.014
55. Fix SM, Borden MA, Dayton PA. Therapeutic gas delivery via microbubbles and liposomes. J Control Release. 2015;209:139-149 doi:10.1016/j.jconrel.2015.04.027
56. Loo DT. In situ detection of apoptosis by the TUNEL assay: An overview of techniques. Methods Mol Biol. 2011;682:3-13 doi:10.1007/978-1-60327-409-8_1
57. Martin KH, Lindsey BD. et al. Dual-frequency piezoelectric transducers for contrast enhanced ultrasound imaging. Sensors. 2014;14(11):20825-42
58. Kim J, Li S, Kasoji S, Dayton PA, Jiang X. Phantom evaluation of stacked-type dual-frequency 1-3 composite transducers: A feasibility study on intracavitary acoustic angiography. Ultrasonics. 2015;63:7-15 doi:10.1016/j.ultras.2015.06.009
59. Lin F, Shelton S, Espíndola D, Rojas J, Pinton G, Dayton P. Ultrasound Localization Microscopy for Identifying Microvascular Morphology Features of Tumor Angiogenesis at a Resolution Beyond the Diffraction Limit of Conventional Ultrasound. Theranostics. 2017;7(1):196-204
60. Gillies RJ, Kinahan PE, Hricak H. Radiomics: Images Are More than Pictures, They Are Data. Radiology. 2015;278(2):151169. doi:10.1148/radiol.2015151169
Author contact
![]() Corresponding author: Paul A. Dayton padaytonunc.edu Office: (919) 843-9521
Corresponding author: Paul A. Dayton padaytonunc.edu Office: (919) 843-9521