Impact Factor
- Issue 14; 2026
- Issue 13; 2026
- Issue 12; 2026
- Issue 11; 2026
- Issue 10; 2026
- Volume 16; 2026
- Advance Articles
- Past Issues
- Cover Images
- Cover Suggestion
- Index & Coverage
- Special Issues
Introduction
Methods
Results
Discussion
Abbreviations
Supplementary Material
Acknowledgements
References
International Journal of Biological Sciences
International Journal of Medical Sciences
 Global reach, higher impact

Theranostics 2018; 8(17):4733-4749. doi:10.7150/thno.26550 This issue Cite
Research Paper
Mesenchymal glioblastoma constitutes a major ceRNA signature in the TGF-β pathway
Qixue Wang1,*, Jinquan Cai2*, Chuan Fang3*, Chao Yang1, Junhu Zhou1, Yanli Tan4, Yunfei Wang1, Yansheng Li1, Xiangqi Meng2, Kai Zhao1, Kaikai Yi1, Sijing Zhang1, Jianning Zhang1, Chuanlu Jiang2, ![]() , Jing Zhang5,
, Jing Zhang5, ![]() , Chunsheng Kang1,
, Chunsheng Kang1, ![]()
1. Laboratory of Neuro-Oncology, Tianjin Neurological Institute, Department of Neurosurgery, Tianjin Medical University General Hospital and Key Laboratory of Neurotrauma, Variation, and Regeneration, Ministry of Education and Tianjin Municipal Government, Tianjin 300052, China
2. Department of Neurosurgery, the Second Affiliated Hospital of Harbin Medical University, Neuroscience Institute, Heilongjiang Academy of Medical Sciences, Harbin 150086, China
3. Department of Neurosurgery, Hebei University Affiliated Hospital, Baoding 071000, China
4. Department of Pathology, Medical College of Hebei University, Baoding, Hebei 071000, China
5. Institute for Cancer Genetics, Columbia University Medical Center, Columbia University, New York, New York 10032, USA
*These authors contributed equally to this work as first authors.
Received 2018-4-8; Accepted 2018-8-15; Published 2018-9-9
Abstract

Rationale: Competitive endogenous RNA (ceRNA) networks play important roles in posttranscriptional regulation. Their dysregulation is common in cancer. However, ceRNA signatures have been poorly examined in the invasive and aggressive phenotypes of mesenchymal glioblastoma (GBM). This study aims to characterize mesenchymal glioblastoma at the mRNA-miRNA level and identify the mRNAs in ceRNA networks (micNET) markers and their mechanisms in tumorigenesis.
Methods: The mRNAs in ceRNA networks (micNETs) of glioblastoma were investigated by constructing a GBM ceRNA network followed by integration with a STRING protein interaction network. The prognostic micNET markers of mesenchymal GBM were identified and validated across multiple datasets. ceRNA interactions were identified between micNETs and miR181 family members. LY2109761, an inhibitor of TGFBR2, demonstrated tumor-suppressive effects on both primary cultured cells and a patient-derived xenograft intracranial model.
Results: We characterized mesenchymal glioblastoma at the mRNA-miRNA level and reported a ceRNA network that could separate the mesenchymal subtype from other subtypes. Six genes (TGFBR2, RUNX1, PPARG, ACSL1, GIT2 and RAP1B) that interacted with each other in both a ceRNA-related manner and in terms of their protein functions were identified as markers of the mesenchymal subtype. The coding sequence (CDS) and 3'-untranslated region (UTR) of TGFBR2 upregulated the expression of these genes, whereas TGFBR2 inhibition by siRNA or miR-181a/d suppressed their expression levels. Furthermore, mesenchymal subtype-related genes and the invasion phenotype could be reversed by suppressing the six mesenchymal marker genes.
Conclusions: This study suggests that the micNETs may have translational significance in the diagnosis of mesenchymal GBM and may be novel therapeutic targets.
Keywords: ceRNA network, micNETs, TGFBR2, mesenchymal subtype
Introduction
Competitive endogenous RNAs (ceRNAs) were recently reported to play a role in posttranscriptional regulation. Recent findings indicate that RNA transcripts can communicate with each other via common microRNA (miRNA) response elements (MREs) [1]. This hypothesis provides a powerful explanation for the inconsistencies in RNA levels compared to protein levels. This new biological language has given rise to novel insights on human development and disease. The muscle-specific transcription factors (TFs) MAML1 and MEF2C are upregulated by the long noncoding RNA linc-MD1 in a ceRNA-related manner, leading to muscle differentiation [2]. Dysregulation of the ceRNA network has been reported in several cancers [3-5]. PTENP1, a pseudogene of PTEN, functions as a tumor suppressor by upregulating PTEN in a ceRNA-related manner [6, 7]. Further studies are needed beyond profiling the imbalance of ceRNA networks in cancers to investigate the role of ceRNAs in tumor progression. Regulation of established oncogenic pathways in glioblastoma by miRNA-RNA interactions was first described by Sumazin et al., whom reported that PTEN is a core-hub regulated by 13 miRNAs in glioblastoma multiform (GBM) [5].
GBM is the most common malignant primary brain tumor in adults and has a median survival of 12.2 to 18.2 months despite tumor resection followed by radiation and chemotherapy [8, 9]. Temozolomide (TMZ) is a widely used and virtually unique chemotherapeutic drug for GBM [10]. Molecular alteration profiles of GBM could shed light on its pathogenesis and potential therapeutic targets. Chen et al. systematically identified somatic genomic alterations in glioblastoma. GBM cells commonly exhibit amplification of chromosome 7 and deletion of chromosome 10, along with sustained activation of the PI3K/AKT/RAS, p53 and cell cycle pathways [11]. The most widely accepted molecular subtypes were presented in 2010 as proneural, neural, classical and mesenchymal based on integrated genomic analysis [12]. Although all subtypes share the same essential characteristics, there are some differences in features among subtypes. The proneural subtype has alterations in PDGFRA and a point mutation in IDH1. The proneural subtype might be the only subtype that benefits from first-line bevacizumab treatment [13]. The mesenchymal subtype correlates with poor outcome and resistance to irradiation [14, 15]. In vivo, hypoxic stress stimulates 3444glioblastoma to transform into the mesenchymal subtype to adapt to the microenvironment [16, 17]. The transcriptional network for mesenchymal transformation was first reported by Maria et al. in 2011, whom identified C/EBPβ and STAT3 as initiators and master regulators [18]. However, systematic descriptions of the mesenchymal subtype are still needed.
Transforming growth factor-β (TGF-β) is a pluripotency cytokine that plays a dominant role in epithelial-to-mesenchymal transition (EMT) [19]. The TGF-β pathway is the putative oncogenic driver of group 3 in medulloblastoma [20]. TGF-β treatment induced a mesenchymal subtype in serous ovarian cancer [21]. In glioma, TGF-β drives proliferation, promotes migration and invasion, and stimulates angiogenesis [22]. TGF-β receptor type 2 (TGFBR2) is the sole ligand-binding receptor of TGF-β1-3. This function gives TGFBR2 a key position in the TGF-β pathway and indicates that TGFBR2 is a potential therapeutic target that cannot be ignored.
In this study, we characterized mesenchymal glioblastoma at the mRNA-miRNA level and reported a ceRNA network that could separate the mesenchymal subtype from other subtypes. Six genes (TGFBR2, RUNX1, PPARG, ACSL1, GIT2 and RAP1B) that interacted with each other in both a ceRNA-related manner and in terms of their protein functions were identified as markers of the mesenchymal subtype. The coding sequence (CDS) and 3'-untranslated region (UTR) of TGFBR2 upregulated the expression of these genes, whereas TGFBR2 inhibition by siRNA or miR-181a/d suppressed their expression levels. Furthermore, mesenchymal subtype-related genes and the invasion phenotype could be reversed by suppressing the six mesenchymal marker genes, which indicated that these marker genes are key mRNAs in ceRNA networks (micNETs) of the mesenchymal subtype and identified the TGF-β pathway as a therapeutic target for patients with mesenchymal GBM.
Methods
Glioblastoma dataset
The glioblastoma dataset was collected from TCGA data portal (https://tcga-data.nci.nih.gov/tcga/), CGGA data portal (http://www.cgga.org.cn/), and Rembrandt dataset (https://caintegrator.nci.nih.gov/rembrandt/). The sequencing platform of the database and the number and subtype of the patients are recorded in Table S1.
ceRNA network construction
First, 583 GBM gene expression datasets (Agilent microarray) were downloaded from TCGA legacy database. Then, 560 out of 583 GBMs with matched whole-genome gene expression (Agilent microarray platform) and miRNA expression data were downloaded from TCGA database. A Spearman correlation test was applied to calculate the correlation coefficient and P values of the genes and miRNAs, and the P values were corrected by the Benjamini and Hochberg method. Gene-miRNA pairs with corrected P values less than or equal to 0.05 and correlation coefficients less than 0 were retained. Gene-miRNA pairs that were not included in public miRNA target databases, such as miRanda, miRTarBase, or TargetScan, were removed. Gene pairs (ceRNA pairs) with less than 10 shared miRNAs were filtered out. For each ceRNA pair, a hypergeometric test was applied using the following formula:
 , where N is the total number of miRNAs, K is the number of miRNAs interacting with the specified gene, n is the number of miRNAs interacting with the candidate ceRNA of the chosen gene, and c is the number of miRNAs shared between these two genes. A Benjamini and Hochberg multiple comparison was applied to calculate the corrected P value. ceRNA pairs with corrected P values greater than 0.05 were removed.
Cell lines, clinical samples and patient-derived xenografts
The human GBM cell lines U87 and LN229 were purchased from ATCC. U87 and LN229 cells were cultured in complete DMEM containing 10% FBS, 100 units/mL penicillin, and 50 μg/mL streptomycin and incubated at 37 °C and 5% CO2. Cells at ~70% confluence were transfected with CDS, the 3'UTR or siRNA of TGFBR2, or a miR-181a/d overexpression vector, as indicated. The TGFBR2-CDS and TGFBR2-3'-UTR plasmids were synthesized by Shanghai Integrated Biotech Solutions. siRNA of TGFBR2 and mimics of miR-181a and miR-181d were ordered from GenePharma. The transfection reagent Lipofectamine® 3000 was purchased from Thermo Fisher.
The tumors were surgically resected from patients diagnosed with GBM. After resection, tumor tissues were cut into 1-mm3 blocks. A portion of the blocks was treated with DMSO or LY2109761 (Selleck) for 48 h in complete DMEM. The remaining portion of the blocks was surgically implanted into mice to establish patient-derived xenografts (PDX). All patients signed a consent form.
Real-time PCR
After the indicated treatments, GBM cells or tissue blocks were lysed in TRIzol reagent (Sigma-Aldrich). The lysate was mixed well with chloroform and centrifuged for 15 min at 13000 ×g at 4 °C. RNA in the top aqueous phase was collected and mixed with propan-2-ol to precipitate total RNA. The cDNA was synthesized with 1 µg of total RNA following the protocol of a Promega reverse transcriptional kit. The results of real-time PCR were normalized to the corresponding GAPDH mRNA levels. Relative gene expression was analyzed by the 2∆∆-Cq method. The primers were as follows:
TGFBR2-CDS: forward: 5'-GTCTGTGTGGCTGTATGGAGA-3', reverse: 5'- ACAAGTCAGGATTGCTGGTGT-3'
TGFBR2-3'UTR: forward: 5'-CTCTAGGCACCCTCCTCAGT-3', reverse: 5'- CCCTACGGTGCAAGTGGAAT-3'
RUNX1 forward: 5'-TTTCCAGTCGACTCTCAACGG-3', reverse: 5'- GCCGTAGTACAGGTGGTAGG-3'
PPARG: forward: 5'-AACTTTGGGATCAGCTCCGT-3', reverse: 5'- TGAGGGAGTTGGAAGGCTCT-3'
GIT2: forward: 5'-TTCAACGCCCATGAGTTTGC-3', reverse: 5'- GCTGTCATAGTCGGGCTGA-3'
ACSL1: forward: 5'-ACCTCAAGGTGCTTCAACCC-3', reverse: 5'- CACCATCAGCCGGACTCTTC-3'
RAP1B: forward: 5'-TGCACAACAGTGTATGCTTGAAA-3', reverse: 5'- ATGTGGACTGTGCTGTGATGG-3'
RUNX2 forward: 5'-GAACCCAGAAGGCACAGACA-3', reverse: 5'- CCTAGGCACATCGGTGATGG-3'
LIF: forward: 5'-TCTTGGCGGCAGTACACAG-3', reverse: 5'- GAGGTGCCAAGGTACACGAC-3'
SHC1: forward: 5'-CCGGGACCTGTTTGACATGA-3', reverse: 5'- TGCAAGCCAGTGAGCACATA-3'
NRP2: forward: 5'-CACCAGAACTGCGAGTGGAT-3', reverse: 5'- ATGGAGCCCGAGGAGATGAT-3'
SOCS3: forward: 5'-CAGCTCCAAGAGCGAGTACC-3', reverse: 5'- TGTCGCGGATCAGAAAGGTG-3'OSMR: forward: 5'-TACGCGTCAGAGTTTGCACT-3', reverse: 5'- CTCAGGGAACTTGGCATCGT-3'
BACE2: forward: 5'-CCTTCTTCGACTCCCTGGTG-3', reverse: 5'- CGCATCAAACACCTTCTGGG-3'PLAU: forward: 5'-AGGCTTAACTCCAACACGCA-3', reverse: TTTCCACTGTGGGTCAGCAG-3'
SERPINH1: forward: 5'-CCTGCTAGTCAACGCCATGT-3', reverse: 5'- GGATGATGAGGCTGGAGAGC-3'
COL4A1: forward: 5'-CCACCAGGACAAAAGGGTGA-3', reverse: 5'- GCATCCTGGAATACCTGGGG-3'
ACTN1: forward: 5'-GCTGCACCCTTCAACAACTG-3', reverse: 5'- GATCTCCTGAGGCGTGATGG-3'
PDPN1: forward: 5'-GAACCAGCGAAGACCGCTAT-3', reverse: 5'- CCTTCCCGACATTTTTCGCA-3'
SERPINE1: forward: 5'-GAGAACCTGGGAATGACCGA-3', reverse: 5'- CCACAAAGAGGAAGGGTCTG-3'
ITGA5: forward: 5'-CACCACCAGCAAAAACGGGA-3', reverse: 5'- TGCCTTGGTCCATTGCACA-3'
RNA-binding protein immunoprecipitation and RIP-qPCR assays
RNA immunoprecipitation (RIP) experiments were performed following the instructions of the RIP™ RNA-Binding Protein Immunoprecipitation system (Merck Millipore). Rabbit anti-AGO2 antibody (1:50, Abcam) was used to precipitate RNAs in U87 cells. Lysates were incubated with the antibody for 4 h at 4 °C. The coprecipitated RNAs were detected by real-time PCR [23].
Preparation of plasmids and determination of 3'-UTR activity
The 3'-UTR reporters of the 6 core genes were obtained from Ibsbio (Shanghai, China). The sequences of the reporters are shown as follows:
TGFBR2: GCTAGCAGTTTCTTTTGCTTATATGTTAATAGTTTTACCCTCTGCATTGGAGAGAGGAGTGCTTTACTCCAAGAAGCTTTCCTCATGGTTACCGTTCTCTCCATCATGCCAGCCTTCTCAACCTTTGCAGAAATTACTAGAGAGGATTTGAATGTGGGACACAAAGGTCCCATTTGCAGTTAGAAAATTTGTGTCCACAAGGACAAGAACAAAGTATGAGCTTTAAAACTCCATAGGAAACTTGTTAATCAACAAAGTCGAC
PPARG: GCTAGCCAGAGAGTCCTGAGCCACTGCCAACATTTCCCTTCTTCCAGTTGCACTATTCTGAGGGAAAATCTGACACCTAAGAAATTTACTGTGAAAAAGCATTTTAAAAAGAAAAGGTTTTAGAATATGATCTATTTTATGCATATTGTTTATAAAGTCGAC
RUNX1: GCTAGCTTGTTTATTTTAGACTTTAAAATGAGCTACTTCTTATTCACTTTTGTAAACAGCTAATAGCATGGTTCCAATTTTTTTTAAGTTCACTTTTTTTGTTCTAGGGGAAATGAATGTGCAAAAAAAGAAAAAGAACTGTTGGTTATTTGTGTTATTCTGGATGTATAAAAATCAATGGAAAAAAATAAACTTTCAAATTGAAATGACGGTATAACACATCTACTGAAAAAGCAACGGGAAATGTGGTCCTATTGTCGAC
GIT2: GCTAGCAAGAGTTCCTTAGAGAGTGTGCTCTAGCTGGCTGCCTGCTACCCCAAAGCTCTGAAAGAGTAAGGTTGAAGTGCTGGAACATGCTCAGATTGTTTTTTAGTTACTCAAAAGCCCCTTCTTGTTCTGAATGTGAAAGCTCTTCCCGTTCCTGCTTACTGCAGCCATTCTGTGTGTGTGGTTCAGACCCTGGCCTAGGGCCGGTGATGTGGATGAGTGAAGGGAGCCAGGTACACGGCAGCAGGGCAGAGGAGTCGAC
ACSL1: GCTAGCTATATACAAGCACAACAGGGCTTGCACTAAAGAATTGTCATTGTAATAACACTACTTGGTAGCCTAACTTCATATATGTATTCTTAATTGCACAAAAAGTCAATAATTTGTCACCTTGGGGTTTTGAATGTTTGCTTTAAGTGTTGGCTATTTCTATGTTTTATAAACCAAAACAAAATTTCCAAAAACAATGAAGGAAAGTCGAC
RAP1B: GCTAGCCTTGCTCATGCATAAGTGTATTTGCAATACCAAATATACAGGTTTAGTATTTTTGCCTGTTAGTGATTGTTTCACATGTGTAACGTTTTGGTTGAGATGTTAAATGGTGGACGAGTACTGTGGATGTGAATGTGGGAAGTAATTTTAATCATATGTAATTGGTCACAAGGCCTAATTTGCAGTAACTATTGCTGTTTTATTTAACAATGCCTTGTTGCTTTGTATGCATTAATGTTTGGATGTAAAGATTGTCGAC
The vector of the reporter plasmids was pmirGLO. To analyze 3'-UTR activity, ~95% confluent U87 cells in 96-well plates were cotransfected with the 3'-UTR reporters of the six genes and either TGFBR2-3'-UTR or si-TGFBR2. Twenty-four hours after transfection, the cells were lysed and used to determine firefly and Renilla luciferases activities using the Dual-GLO® Luciferase Assay System from Promega (E2920).
Immunohistochemical staining
Immunohistochemistry was performed on PDX tissues by subjecting 4-µm paraffin sections to a three-step process and a DAB staining kit (ZSGB-BIO). In brief, formalin-fixed, paraffin-embedded tissue sections were dried at 80 °C for 15 min and dewaxed in xylene, rinsed in graded ethanol, and rehydrated in double-distilled water. For antigen retrieval, slides were pretreated by steaming them in sodium citrate buffer (10 mM sodium citrate, pH 6.0) for 15 min at 100 °C. After the sections were washed with phosphate-buffered saline for 3 min, they were immunostained with primary antibodies against Ki-67, TGF-β and CD34 from ZSGB-BIO and incubated at 4 °C overnight. After 3 washes in PBS buffer, the tissues were covered by HRP-conjugated anti-mouse/rabbit antibodies for 30 min at room temperature (RT). Staining reactions were performed by covering the tissue samples with the prepared DAB chromogen solution and incubating them for approximately 10 min to allow proper brown color development [24].
Immunofluorescence staining
U87 cells were seeded into a confocal Petri dish until ~90% confluence was reached. Then, the cells were fixed in 4% paraformaldehyde for 30 min at RT. Immunofluorescence staining was conducted with antibodies against TGFBR2 (R&D, 1:200), RUNX1 (Abcam, 1:200), PPARG (Proteintech, 1:200), GIT2 (Abcam, 1:200), ACSL1 (Proteintech, 1:200) and RAP1B (R&D, 1:200). The cells were washed with PBS and incubated with Alexa Fluor 594 (Life Technologies, 1:200). Then, phalloidin (Life Technologies, 1:200) was employed to stain the F-actin in the cells. Nuclei were stained with DAPI, and the cells were visualized by an FV-1200 laser scanning confocal microscope.
Statistical analysis
We developed a predictive model for the mesenchymal subtype and a risk score model for patient survival based on the expression level (expr) of six micNETs and the corresponding β values from logistic regression analysis or the regression coefficients derived from univariate Cox regression analysis. The predictive model score = 2.268 × exprTGFBR2 + 0.827 × exprRUNX1 - 0.019 × exprPPARG + 0.469 × exprGIT2 + 0.279 × exprRAP1B + 0.454 × exprACSL1 - 0.835. The survival risk score = 0.001 × exprTGFBR2 + 0.057 × exprRUNX1 + 0.048 × exprPPARG + 0.238 × exprGIT2 + 0.024 × exprRAP1B + 0.041 ×exprACSL1 [25].
Receiver operating characteristic (ROC) curves were constructed to determine the discriminatory capacity of micNETs or TFs for diagnosis. Kaplan-Meier analysis was performed to estimate the survival time of different subgroups, and a log-rank test was used to determine prognostic differences. Cox proportional hazards regression analyses and Pearson correlation tests were used to determine significant differences. Comparisons of binary and categorical patient characteristics between subgroups were performed using Fisher's exact test. STRING, a database of protein-protein interactions, was also used. STRING takes a list of gene products and returns a diagram of known and potential interactions [26]. Gene Ontology (GO) and KEGG Pathway analyses were performed when gene sets (Pearson r > 0.4) were submitted to the DAVID website (http://david.abcc.ncifcrf.gov/home.jsp). ClueGO [27], a Cytoscape APP, was used to perform functional analysis. Biological processes were further analyzed through gene set enrichment analysis (GSEA) [28]. Single-sample GSEA (ssGSEA) was used to calculate the enrichment score of every gene set for every sample [29]. Heatmaps were constructed and produced by Gene Cluster 3.0 and Gene Tree View software. All statistical computations were performed with the statistical software environment R version 3.4.1 (http://www.r-project.org/), GraphPad Prism Version 6.01 or Microsoft Excel 2013. P < 0.05 was considered statistically significant.
Results
Identification of a ceRNA network enriched in the mesenchymal subtype
We collected 560 GBMs with matched whole-genome gene expression and miRNA expression data from TCGA database to establish the ceRNA network for GBM. Correlations between genes and miRNAs were calculated using Spearman correlations, and then, gene-miRNA pairs that were not included in public databases, miRanda, miRTarBase, or TargetScan were removed (Figure S1). We used a stringent cutoff of 10 miRNAs shared between any two ceRNA pairs and relaxed the number of miRNAs shared between ceRNA pairs to eight and five. For the cutoff of five miRNAs shared between any two ceRNA pairs, we obtained a ceRNA network of 600397 connections and 5355 genes (Table S2). For the cutoff of eight miRNAs shared between any two ceRNA pairs, we obtained a ceRNA network of 101545 connections and 2587 genes (Table S3). The ceRNA networks under different numbers of shared miRNAs between two ceRNA pairs also retain key features: the ceRNA networks are characterized by two distinct, highly connected subnetworks and sparse connections between them. Interestingly, 58.5% of the genes (blue nodes) in the subnetwork were significantly enriched in the mesenchymal subtype, whereas 41.5% of the genes (yellow nodes) were mutually exclusive in the mesenchymal subtype (Figure S2A-D). Additionally, genes in the ceRNA network were not enriched in specific chromosomes but were instead uniformly distributed throughout the genome, suggesting their universal and powerful roles in tumorigenesis (Figure S2E-F). Overall, the ceRNA networks we constructed are robust with regard to the number of miRNAs shared between two ceRNA pairs.
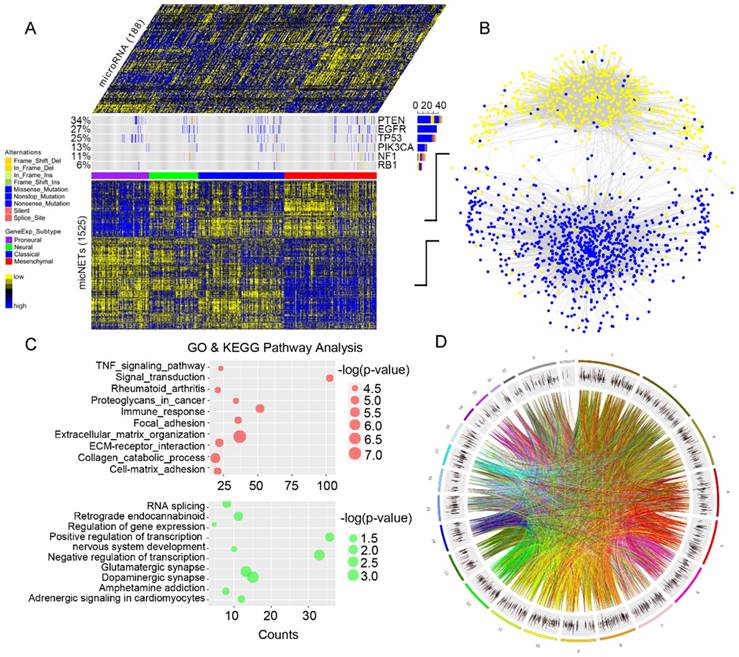
After gene pairs with fewer than 10 shared miRNAs were filtered out, gene pairs in the ceRNA network were finally determined based on hypergeometric test results. This process led to a GBM ceRNA network of 1525 mRNAs and 188 miRNAs (Figure 1A), which were characterized by two distinct, highly connected subnetworks and sparse connections between them (Figure 1B). Interestingly, 831 genes (88% of the blue nodes) in the subnetwork were significantly enriched in the mesenchymal subtype, while 446 genes (77% of the yellow nodes) were mutually exclusive in the mesenchymal subtype (P = 1.32×10⁻⁷, Table S4). GO and KEGG pathway enrichment analyses revealed that the subnetwork with genes highly expressed in the mesenchymal subtype was enriched in EMT-related pathways (Figure 1C and Table S5), whereas the subnetwork of lowly expressed genes was associated with proneural functions (Figure 1C and Table S6). Additionally, genes in the ceRNA network were not enriched in specific chromosomes but were instead uniformly distributed throughout the genome, suggesting their universal and powerful roles in tumorigenesis (Figure 1D).
Global landscape of mRNA-miRNA interactions in glioblastoma. (A) Genes that interacted with each other in a ceRNA-dependent manner are presented in a cluster arranged by proneural, neural, classical and mesenchymal subtypes. The ceRNA network included 1525 mRNAs and 188 miRNAs. Several genetic alterations are listed in the middle of the heatmap. NF1 mutations were primarily enriched in the mesenchymal subtype. (B) The ceRNA genes formed a network in which the highly expressed micNETs in the mesenchymal subtype are labeled blue, and genes with low expression are labeled yellow. (C) Functions of micNETs in the blue ceRNA hub or yellow ceRNA hub were profiled by GO and KEGG pathway analyses. (D) The circus plot shows the genomic location of micNETs in the ceRNA network.
We collected three ceRNA networks, including the Hermes GBM ceRNA network (Figure S3A) [5], hallmark-associated ceRNA networks in 20 major cancers (including GBM) (Figure S3B) [30], and cancer-associated ceRNA networks from starBase v2 (Figure S3C) [31]. The Hermes GBM ceRNA network was established by the information-theoretic Hermes algorithm [5], which predicts ceRNA coupling between two mRNAs based on the relative size of their shared miRNA regulatory program, as predicted by the Cupid algorithm [5, 32, 33], and the conditional mutual information between each mRNA and each of their shared miRNAs [34]. In the hallmark-associated cancer ceRNA network, AGO-CLIP data were used to support miRNA-target interactions during ceRNA network construction [30]. The ceRNA network from starBase v2 [31] was manually extracted with the default parameter settings for genes covered in our ceRNA network. We first compared the three ceRNA networks and discovered that a small percentage of connections was shared between any two ceRNA networks (6.25% of connections shared between the Hermes GBM ceRNA network and starBase v2, 2.2% between the Hermes GBM ceRNA network and the hallmark-associated cancer ceRNA network, 4.55% between the hallmark-associated cancer ceRNA network and starBase v2). We also compared our ceRNA network with the three networks and found that 6.83%, 0.5% and 6.66% of the connections were shared by our ceRNA network with the Hermes GBM ceRNA network, the hallmark-associated cancer ceRNA network, and the cancer ceRNA network in starBase v2, respectively. Considering the different methods used to establish the three cancer ceRNA networks, we established a high-confidence ceRNA network based on our ceRNA network by extracting connections reported in at least one of the three other ceRNA networks (Table S7). The high-confidence ceRNA network consists of two distinct subnetworks (Figure S3D): the subnetwork of genes highly expressed in the mesenchymal subtype that are enriched in EMT-related pathways, and the subnetwork of lowly expressed genes that are associated with proneural functions (Figure S3E). Additionally, genes in the ceRNA network were not enriched in specific chromosomes but were instead uniformly distributed throughout the genome (Figure S3F), suggesting their universal and powerful roles in tumorigenesis.
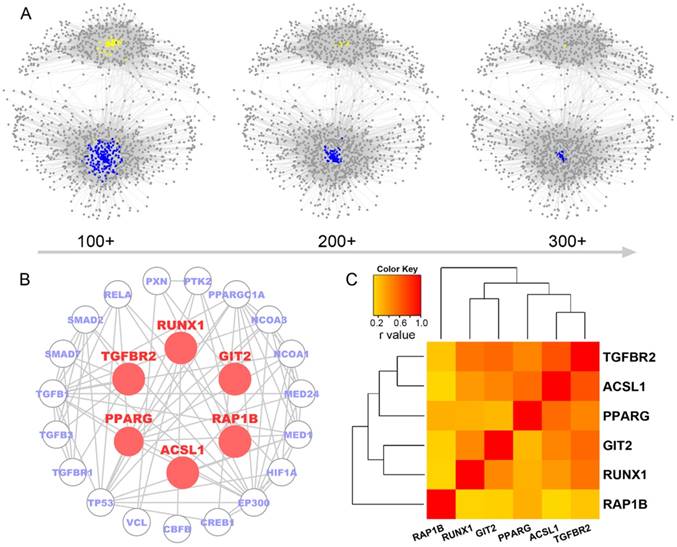
Genes with high degrees of connectivity tended to be at the center of each ceRNA subnetwork (Figure 2A). A total of 26 out of 27 genes with connection degrees higher than 300 were associated with the mesenchymal subtype (Figure S4). A protein-protein interaction subnetwork including 26 genes was extracted from the STRING database. Six genes (TGFBR2, RUNX1, PPARG, GIT2, ACSL1 and RAP1B) were mutually connected with each other in both the ceRNA network (Figure 2A) and the protein interaction network (Figure 2B). Pearson correlation analysis indicated that TGFBR2 might play a key role in the six micNETs, whereas RAP1B might weakly interact with the other micNETs (Figure 2C).
Identification of six micNETs as a coregulated hub of mesenchymal glioblastomas. (A) The micNETs with more than 100, 200 or 300 connections are highlighted in the ceRNA network. (B) STRING analysis of micNETs with greater than 300 connections identified six genes (TGFBR2, RUNX1, PPARG, GIT2, ACSL1 and RAP1B) that were mutually connected with each other. (C) The heatmap shows the correlations of the six micNETs: TGFBR2, RUNX1, PPARG, ACSL1, GIT2 and RAP1B.
As shown in Figure 3A, the 26 highly expressed genes in the ceRNA network were predicted to bind 51 miRNAs. Their six core genes were targeted by a total of 44 miRNAs, including all members of the miR-181 family (Figure 3B). According to a report by Kim et al. [35], none of these 44 miRNAs were enriched in the neuro-mesenchymal precursor cluster, which was consistent with our results on all 44 miRNAs highly expressed in the nonmesenchymal subtypes. miR-181 family genes were characteristically downregulated in the mesenchymal subtype and were negatively associated with the six core genes in GBMs (Figure 3C). TGFBR2 was found to have a high degree of connectivity (> 300) in the ceRNA network, and its expression levels were significantly correlated with those of the other five micNETs. TGFBR2 is also an indispensable receptor in the TGF-β pathway [36]. We overexpressed the CDS and 3'-UTR of TGFBR2 in U87 and LN229 cells to investigate whether TGFBR2 could regulate the other micNETs. Real-time PCR analysis indicated that the expression of micNETs was enhanced by TGFBR2 in both a CDS and 3'-UTR transfection-dependent manner (Figure 3D-E). To further confirm the ceRNA interactions of the six micNETs, we referred to a previous work [5] and constructed 3'-UTR luciferase reporters of TGFBR2, RUNX1, PPARG, GIT2, ACSL1 and RAP1B. TGFBR2 siRNA inhibited the activity of the 3'-UTRs of these genes, while overexpression of TGFBR2 3'-UTR significantly upregulated the luciferase activity of these constructs (Figure S5), suggesting the presence of ceRNA interactions among the six micNETs.
mRNAs-miRNAs form the hub in the ceRNA network. (A) Integrated circus profile of the ceRNA hub in chromosomes. The inner ring represents 27 core micNETs, whereas the outside ring represents their targeting miRNAs. (B) Six core micNETs and their bridge miRNAs are displayed in a Cytoscape network. (C) Six core micNETs were highly expressed, whereas their targeting miRNAs were lowly expressed in the mesenchymal subtype, as presented in the heatmap. (D-G) Relative mRNAs levels from three independent experiments are shown. The CDS and 3'-UTR of TGFBR2 were cloned into pcDNA3.1 vectors. U87 and LN229 cells were transfected with the indicated plasmids or miRNA mimics for 48 h, and mRNA was extracted for micNET analysis. (H) The scheme of RIP analysis. (I) After overexpression of miR-181a and miR-181d in U87 cells, AGO2 proteins were pulled down by an antibody. The expression levels of TGFBR2 and RUNX1 were measured by real-time PCR assays.
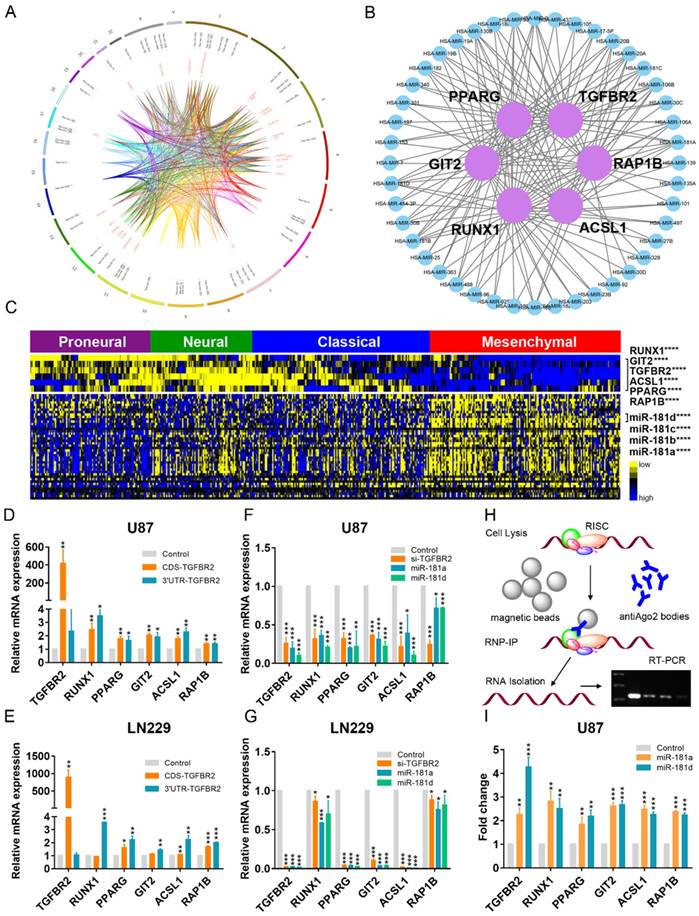
As the 3'-UTR of TGFBR2 could not enhance its own expression, upregulation of the other micNETs by TGFBR2-3'-UTR tended to affect the ceRNA network. miRNAs function as bridges in the ceRNA network. Then, we knocked down TGFBR2 by siRNA or overexpressed miR-181a/d, which were predicted to target key micNETs in the ceRNA network. The mRNA levels of the six micNETs were inhibited by downregulation of TGFBR2 or overexpression of miR-181a/d (Figure 3F-G). It is known that miRNAs and their target mRNAs can form a complex with AGO2 protein. miR-181a/d was predicted to target the six micNETs and exhibited low expression levels in the mesenchymal subtype, suggesting that the miR-181 family may participate in EMT by mediating the expression levels of TGFBR2 and the other five micNETs. We overexpressed miR-181a and miR-181d in U87 cells and examined micNET-AGO2-miR-181a/d complex binding to further investigate ceRNA regulation between TGFBR2 and other micNETs. RIP analysis indicated that miR-181a/d promoted the binding of micNETs to the AGO2 complex, which partly explained the opposite expression patterns of micNETs and miRNAs in mesenchymal subtypes and confirmed the ceRNA interactions among micNETs (Figure 3H-I).
Six micNETs, TGFBR2, RUNX1, PPARG, GIT2, ACSL1 and RAP1B, predict the GBM mesenchymal subtype
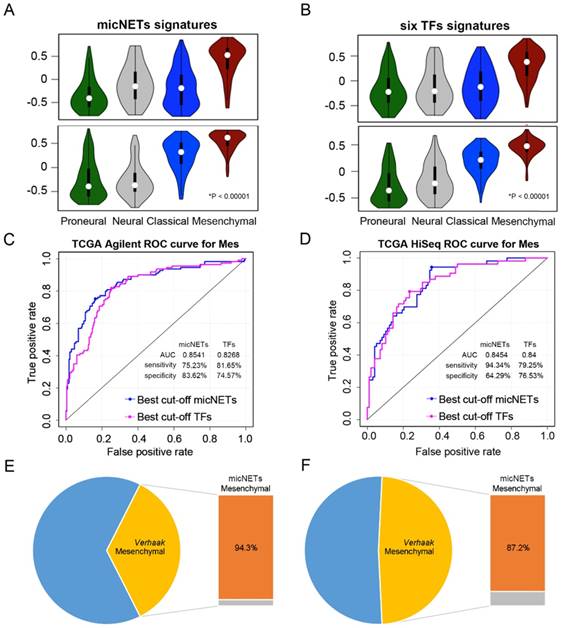
We applied the six micNETs to TCGA (1119 samples), CGGA (272 samples) and Rembrandt (227 samples) databases to investigate whether the six micNETs could predict the mesenchymal subtype. Previous studies have reported that six TFs (STAT3, C/EBPβ, RUNX1, FOSL2, BHLHE40 and ZNF238) [18] are marker genes of the mesenchymal subtype. ssGSEA enrichment analysis revealed that the six micNETs and six TFs were significantly enriched in the mesenchymal samples (Figure 4A-B and Figure S6A-B), suggesting that the micNETs could act as surrogate markers of mesenchymal subtypes.
Expression levels of six micNETs predicted the mesenchymal subtype. (A-B) ssGSEA enrichment analysis was employed to evaluate the expression pattern of six micNETs and six TFs in the proneural, neural, classical and mesenchymal subtypes in TCGA Agilent and HiSeq databases. (C-D) ROC curve analysis based on the risk score was used to evaluate the predictive value of the six micNETs and six TFs for the mesenchymal subtype in TCGA Agilent and HiSeq databases. (E-F) The pie plot shows that mesenchymal samples predicted by micNETs were mainly consistent with the mesenchymal subtype reported by Verhaak et al. in TCGA Agilent and HiSeq databases.
We used the risk score method to construct a model for the prediction of survival or subtype based on these six genes and investigated their prognostic and predictive value [25, 37]. The signature risk score was calculated for each of the 481 patients with glioblastoma in TCGA Agilent dataset and was then applied to validate samples in other datasets.
ROC curves were generated based on the risk score model to evaluate the performance of the micNETs and TFs. The micNETs performed slightly better than the TFs in classifying samples as mesenchymal subtypes in TCGA Agilent GBM database (micNETs: AUC = 0.8883, sensitivity = 80.13%, specificity = 84%; six TFs: AUC = 0.8647, sensitivity = 83.33%, specificity = 76.92%, Figure 4C-D and Figure S6C-D). The optimal cutoff for the risk score was determined according to the ROC curve, revealing that 94.3% and 87.2% of the mesenchymal samples were successfully classified as the mesenchymal subtype in TCGA HiSeq and Rembrandt databases, respectively; meanwhile, the frequencies of the six TFs were 79.2% and 80.7%, respectively, in TCGA HiSeq and Rembrandt databases (Figure 4E-F and Figure S6E-F).
Survival analysis revealed that patients with a high-risk score of micNETs had poor overall survival in all databases (Figure S7A-D, TCGA Agilent: P = 0.0332, TCGA u133a: P = 0.0234, TCGA RNA-seq: P = 0.0171 and CGGA RNA-seq: P = 0.0105). The distribution of risk score and the corresponding cutoff are shown in Figure S7A-D. After adjustments for chemotherapy, age at diagnosis and Karnofsky performance score (KPS), Cox regression analysis revealed that the risk score of micNETs was still correlated with the overall survival of patients with GBM (Figure S7E-H, TCGA Agilent: P = 4.30×10⁻², HR = 1.626, TCGA u133a: P = 3.66×10⁻², HR = 1.301, TCGA RNA-seq: P = 7.03×10⁻³, HR = 1.290 and CGGA RNA-seq: P = 3.72×10⁻², HR = 2.276).
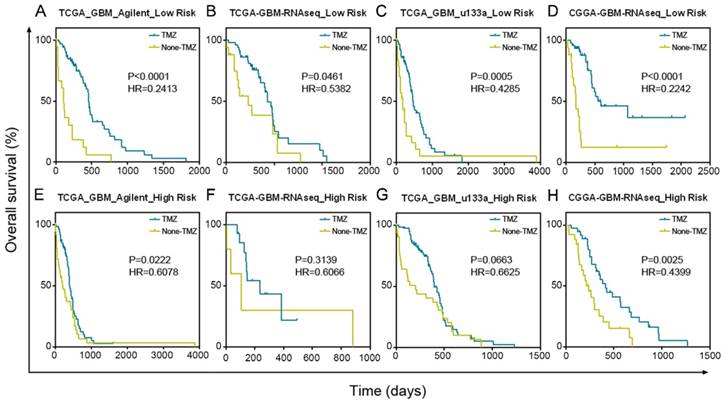
Patients with a low-risk score significantly benefited from TMZ chemotherapy in TCGA Agilent GBM dataset (Figure 5A, P < 0.0001). In addition, we confirmed the results in TCGA RNA-seq (P = 0.0461), TCGA u133a (P = 0.0005) and CGGA RNA-seq (P < 0.0001) datasets, further demonstrating the good prognosis of groups with low-risk scores after TMZ treatment (Figure 5B-D). Although patients in the high-risk score group also benefited from TMZ treatment, their treatment effect was much worse than that of the low-risk score group in TCGA Agilent (P = 0.0222), TCGA RNA-seq (P = 0.3139), TCGA u133a (P = 0.0663) and CGGA RNA-seq (P = 0.0025) datasets (Figure 5E-H).
GBM patients with low risk scores had a greater benefit from TMZ chemotherapy than GBM patients with high risk scores. (A-D) Patients with low micNET risk scores received a significant benefit from TMZ treatment in TCGA Agilent database, TCGA RNA-seq database, TCGA u133a database and CGGA RNA-seq database. (E-H) Patients with high micNET risk scores showed a poorer treatment effect than patients with low risk scores in the same database.
TCGA subtypes are associated with particular signaling pathways and distinct immune response statuses [12, 38]. Thus, exploring the roles of micNETs involved in the immune response could provide new potential agents to target mediators of tumor-induced immunosuppression in GBM. We parsed TCGA and CGGA datasets to show that patients with high micNET scores had a significantly higher correlation with immunosuppressors and immune effectors than patients with low micNET scores [12, 39] (Figure S8). For further comprehensive study of micNET-related immunological processes in malignant brain tumors, we downloaded the classifier gene sets for specific immune cell lineages [40, 41], which were subsequently defined as metagenes. Based on the single-sample GSEA, we observed that the micNET score was positively associated with immune cell lineages, such as B cells (r = 0.669), helper T cells (r = 0.587), cytotoxic T cells (r = 0.488), myeloid cells (r = 0.807), monocytes (r = 0.683), NK cells (r = 0.647), dendritic cells (r = 0.691) and T-cell lineages (r = 0.557) in TCGA GBM Agilent dataset (Figure S9A). A similar pattern of GBM in TCGA GBM RNA-seq, TCGA GBM u133a and CGGA GBM RNA-seq datasets was observed (Figure S9B-D). As revealed above, the six micNETs play a key role in immunosuppression in GBM. We overlapped micNET-related genes (r > 0.4) of the CGGA and TCGA datasets with immunosuppressors (Figure S10). The six micNETs were significantly correlated with ARRB2, BTK, CASP4, CD4, CD59, ELF4, LAIR1, LYN, MR1, MSR1, NFKB1, NLRP3, PML, RAB27A, REL, SWAP70, TGFB1, TGFBR2, and TRPM2. Our results indicated that the six micNETs provide new evidence regarding immunotherapy and the infiltration of immune cells into glioma tumors.
The TGF-β pathway is a potential therapeutic target for the GBM mesenchymal subtype
In 2010, Carro et al. reported that C/EBPβ, STAT3 and four other TFs participate in the activation of mesenchymal gene expression in malignant glioma and showed that activation of this small regulatory module is necessary to initiate and maintain an aberrant phenotypic state in cancer cells [18]. MicNETs with connection degrees of more than 200 were subjected to ClueGO analysis and shown to be enriched in positive regulation of EMT (P = 8.27×10⁻³) and the transforming growth factor beta receptor complex (P = 4.41×10⁻⁴) (Figure 6A and Table S8). Based on the COMPARTMENTS subcellular localization database [42], we predicted the subcellular locations of the six micNET proteins (Figure 6B). The TGFBR2 protein was primarily located in the cell membrane (evidence: 100%); most of the RAP1B, ASCL1 and GIT2 proteins were enriched in the cytosol (evidence: 100%, 99.7%, and 99.9%, respectively); and most of the RUNX1 and PPARG proteins were in the nucleus (evidence: 94.0% and 99.8%, respectively). We also used immunofluorescence to validate the subcellular localization of proteins in glioblastoma cells (Figure S11).
TGFBR2 promotes the mesenchymal phenotype in GBM cells. (A) micNETs with connection degrees of greater than 200 were subjected to ClueGO analysis, and major mesenchymal-related signatures are presented. (B) The locations of six micNETs were predicted by the COMPARTMENTS subcellular localization database. (C) Mesenchymal subtype-related genes were selected according to the report by Carro et al. in 2011 [18]. (D) U87, LN229 and U251 cells were transfected with the CDS and 3'-UTR of TGFBR2 (2.5 µg/well in a six-well plate) for 48 h. U87 and LN229 cells were transfected with si-TGFBR2 (50 nmol/mL) for 48 h. Mesenchymal subtype-related signature genes were measured by real-time PCR.
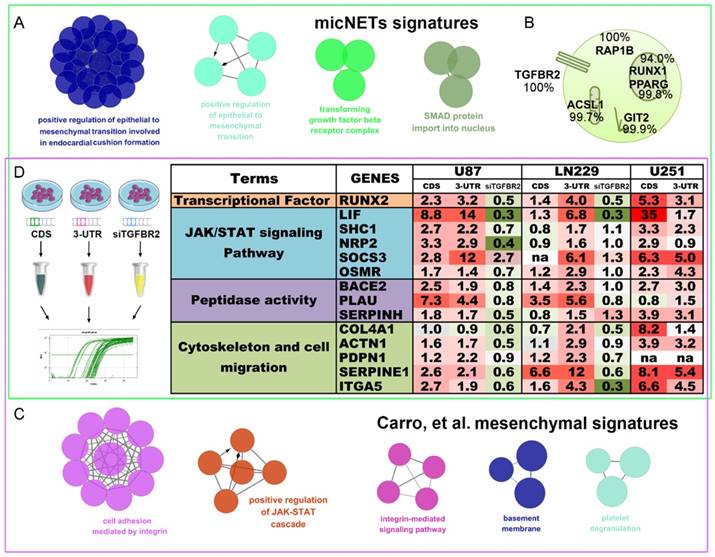
The six TFs reported by Carro et al. can bind the promoter regions of the 41 “mesenchymal” genes. ClueGO analysis of these target genes (“mesenchymal” genes) revealed that they are involved in cell adhesion mediated by integrin (P = 7.11×10⁻⁶), positive regulation of the JAK-STAT cascade (P = 6.63×10⁻⁴), and the integrin-mediated signaling pathway (P = 8.06×10⁻⁵) (Figure 6C and Table S9). After overlapping these two gene sets, we selected 14 mesenchymal subtype-related genes that potentially drive the phenotypic transition. Overexpression of the CDS and 3'-UTR of TGFBR2 upregulated the expression levels of these mesenchymal-subtype related genes. LIF, SERPINE1 and RUNX2 are micNETs with high connectivity in the ceRNA network and are sensitive to the expression levels of the 3'-UTR of TGFBR2. Furthermore, inhibition of TGFBR2 expression levels by siRNA led to downregulation of these micNETs (Figure 6D), confirming that the TGF-β pathway participates in the regulation of mesenchymal genes.
We generated xenografts from tumor tissues resected from two patients with GBM to further validate the functional roles of the TGF-β pathway in mesenchymal glioblastoma (Figure 7A). Thirteen 1-mm3 tumor tissues were cultured in complete DMEM and treated with either DMSO or LY2109761, an inhibitor of TGFBR2. Real-time PCR analysis indicated that the mesenchymal-related gene expression pattern was downregulated by LY2109761 (Figure 7B). Tissue blocks of TBD0207 and TBD0220 were subjected to RNA-seq and miRNA-seq analysis. The sequencing results revealed that LY2109761 could upregulate miR-181a/b expression and downregulate the expression of mesenchymal genes, such as MET, LIF, IL-6 and OSM (Figure 7C). GO and KEGG pathway analyses of the differentially expressed genes (FDR < 0.001, log2FC > 1) revealed that they are involved in EMT (P = 5.77×10⁻⁶, Figure 7D and Table S10), positive regulation of mesenchymal cell proliferation (P = 5.49×10⁻⁷), the TGF-β signaling pathway (P = 4.23×10⁻²), cytokine-cytokine receptor interactions (P = 2.80×10⁻⁶), and the PI3K-Akt signaling pathway (P = 3.15×10⁻³).
The TGF-β pathway could be a therapeutic target for the mesenchymal subtype of GBM. (A) Operations were performed on patients with diagnosed GBM. Tumors were obtained and evaluated by histopathological examination. (B) Tumor tissues were cut into 1-mm3 blocks and separated into two groups. One group was treated with DMSO, whereas the other group was treated with LY2109761, an inhibitor of TGFBR2. RNA was extracted from the tissue blocks, and mesenchymal-related signature genes were evaluated by real-time PCR. (C) The tissue blocks of TBD0207 and TBD0220 were subjected to RNA-seq and miRNA-seq. (D) The differentially expressed genes (FDR < 0.001, log2FC > 1) were subjected to GO and KEGG pathway analyses. (E) PDX models were established to test the efficiency of LY2109761 in vivo. (F) Immunohistochemistry was performed to detect Ki-67, TGF-β and CD34 expression. (G) Tumors derived from the PDX model were tested by RNA-seq analysis. (H) Mfuzz was performed to detect alternative expression profiles.
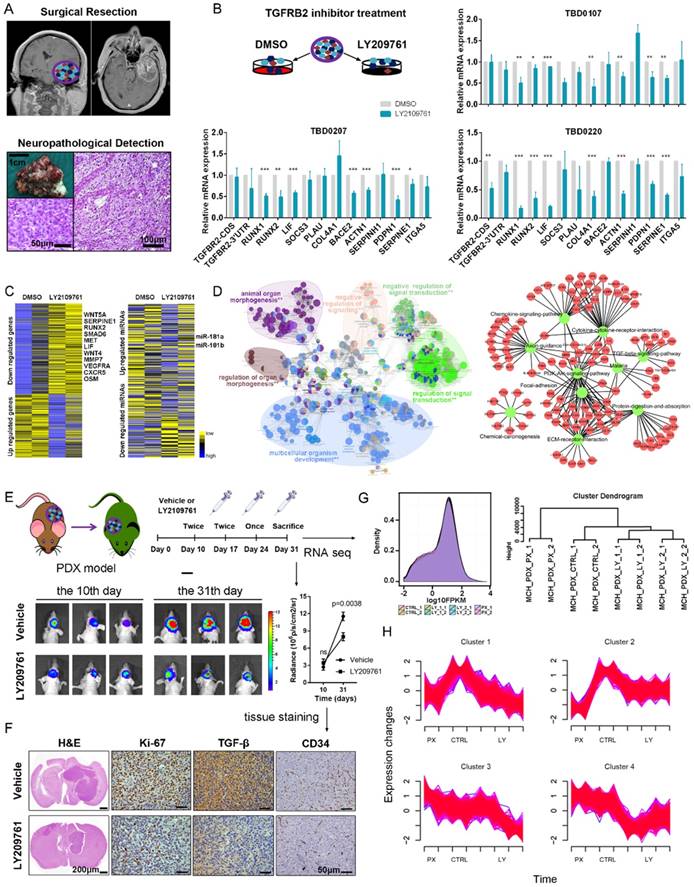
Then, we employed the PDX model to test the efficiency of LY2109761 in vivo. The drug was intraperitoneally administered (Figure 7E), and the mice were sacrificed on the 31st day. Tumor volume was clearly reduced in the LY2109761 treatment group and was accompanied by decreased Ki-67, TGF-β and CD34 staining (Figure 7F). Then, the tumors were excised and subjected to RNA-seq. All groups had similar expression density distributions. Hierarchical clustering showed that the same processing groups had the closest distances (Figure 7G). The expression profiles of clusters determined by Mfuzz showed that the genes of mesenchymal subtype-related micNETs were downregulated by LY2109761 (Figure 7H and Table S11).
Discussion
In the present study, a ceRNA network was constructed for GBM based on TCGA GBM Agilent microarray data. mRNAs in ceRNA networks in glioblastoma were designated micNETs. In the ceRNA network, these micNETs were assembled into two subnetworks that were each characterized by hubs linked with genes with a low degree of connectivity. Recently, Yang's team performed paired-end RNA sequencing and microarray analyses to obtain the expression profiles of mRNAs, lncRNAs, circRNAs and miRNAs of three glioblastoma and matched normal samples. They found that 501 lncRNAs, 1999 mRNAs, 2038 circRNAs and 143 miRNAs were differentially expressed between glioblastoma and matched normal brain tissues [43]. Cao et al. analyzed the lncRNAs regulating mRNAs as ceRNAs in glioblastoma and constructed a long noncoding RNA-mediated ceRNA network by integrating genome-wide lncRNA and mRNA expression profiles. Survival analyses demonstrated that the lncRNAs and network module are potential prognostic biomarkers for GBM.
In our work, the two subnetworks of micNETs had different gene expression levels in the mesenchymal subtype, suggesting that they might have different biological functions in shaping GBM phenotypes. In addition, the expression patterns of micNETs in the two ceRNA subnetworks are completely opposite between the proneural and mesenchymal subtypes, suggesting different biological functions in the two GBM subtypes. Most non-GCIMP mesenchymal GBMs were reported to arise from a proneural-like precursor. Loss of NF-1 could convert the proneural subtype to a mesenchymal subtype [44]. It is not surprising that NF-1 is present in the proneural subtype-enriched subceRNA network. Therefore, low expression of NF-1 appears to not only promote the mesenchymal subtype by eliminating the suppression of the RAS pathway but also participate in posttranscriptional regulation.
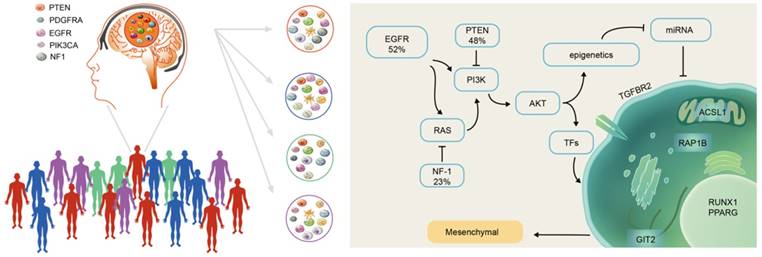
There were more highly expressed micNETs in the mesenchymal subtype than in the proneural subtype. A total of 26 out of the 27 genes with degrees greater than 300 were in the hubs of the ceRNA subnetwork associated with the mesenchymal subtype. However, a set of 26 genes is still too large for clinical applications. We employed STRING protein-protein interaction networks to narrow down the micNET and establish core micNET signatures. TGFBR2, RUNX1, PPARG, GIT2, ACSL1 and RAP1B were identified as the core micNET signature as they interacted with each other in both the ceRNA and protein-protein networks. TGF-β was reported to stimulate the expression and function of RUNX1 [45]. Thus, it makes sense that the CDS of TGFBR2 upregulated the expression of RUNX1 (Figure 3D-E). The six micNETs are directly sponged by 44 miRNAs in the network, accounting for a quarter of the total miRNAs in the ceRNA network. Notably, the miR-181 family and several other miRNAs had decreased expression in the mesenchymal subtype. Many studies have been conducted on the miR-181 family in glioblastoma [46]. Specifically, in our previous study, miR-181d was shown to have great prognostic value and was recommended for use as a molecular biomarker for gliomas by Chinese Glioma Cooperative Group (CGCG) clinical practice guidelines [47]. As the promoter of the miR-181 family has many methylation sites, epigenetic regulation of miR-181ds might be present in the mesenchymal subtype. Tri-methylation of H3K27 was reported to be facilitated by the RTK/EGFR/AKT pathway in GBM [48], whereas EGFR overexpression plus NF-1 mutation were common in the mesenchymal subtype [12]. These genomic phenotypes might trigger the silencing of miR-181s and other miRNAs, leading to a deregulated ceRNA network (Figure 8).
Scheme of mesenchymal GBM subtype progression.
The six micNETs were enriched in the mesenchymal subtype and could also predict the mesenchymal subtype, as verified in 1618 clinical patient samples (Figure 4 and Figure S6), suggesting their great potential for clinical diagnosis. Microarray chips or PCR kits with these micNETs may rapidly characterize glioblastoma samples. The proteins of these six micNETs have different cellular locations. As a cytokine receptor, TGFBR2 is indispensable for TGF-β1, TGF-β2 and TGF-β3 signal transduction [49]. RUNX1 is a TF that regulates multiple functions and is a potential therapeutic target for leukemia [50-52]. RUNX1 functions as a miRNA hub in hematopoiesis in both a transcriptional and posttranscriptional manner [53]. In glioblastoma, RUNX1 is also involved in a miRNA-mRNA interaction network that regulates oncogenic pathways [5] and is considered a key TF in the mesenchymal subtype [18]. PPARγ is a nuclear hormone receptor transcription factor that has a well-known role in lipid metabolism [54]. Recently, PPARγ was found to regulate EMT after internal radiation (IR) of glioma, which leads to radioresistance [55]. ACSL1, which initiates cellular long-chain fatty acid metabolism, was reported to enhance the proliferation of hepatoma cells [56]. GIT2 is a multifunctional protein that was recently discovered to promote DNA repair induced by IR [57] and indicates a potentially poor prognosis in radiotherapy. RAP1B mediates TMZ resistance in GBM cells by cytoskeletal remodeling, and this effect could be reduced by miR-181 [58]. Thus, the marker micNETs selected by bioinformatics analysis reveal complex tumor-promoting functions.
As the TGF-β pathway impacts the micNET signature and major ceRNA networks, targeting the TGF-β pathway could be valuable in the mesenchymal subtype. Although TMZ is still a first-line chemotherapy for patients with GBM, our results indicated that patients with high expression levels of micNET signatures responded poorly to TMZ. TMZ induces cytotoxicity by methylating the O6 and N7 positions of guanine and causing O6-methylguanine lesions. Meanwhile, DNA damage repair confers resistance to TMZ [59, 60]. Indeed, TGF-β was shown to promote an effective DNA damage response [61, 62]. Blockade of the TGF-β pathway enhanced the radiation response and prolonged the survival of glioblastoma in a U87 subcutaneous model and GBM-derived CSLC [63]. Inhibiting TGF-β can abolish the radiation resistance mediated by the tumor microenvironment in GBM [64]. Tumors with active TGF-β signaling exhibit resistance to DNA-damaging agents by regulating DNA repair genes [65, 66]. Our research confirmed the effect of LY2109761 in glioblastoma tissue blocks and GBM PDX. PDX models have the advantage of retaining key characteristics of clinical tumors [67]. Indeed, the PDX models in this study possessed the same characteristics of invasiveness and rapid progression as the source tumor in the patient. LY2109761 suppressed the expression of mesenchymal signatures in tissue blocks and PDX in vivo. Genes (such as LIF, RUNX2 and SERPINE1) were inhibited in both tissue blocks, which was consistent with our measurements in GBM cell lines.
Although TMZ remains a first-line chemotherapy for patients with GBM, our results indicated that patients with high expression levels of micNET signatures responded poorly to TMZ. Therefore, a treatment combining TMZ with TGF-β pathway inhibitors is a better therapeutic strategy for patients with the mesenchymal subtype than TMZ treatment alone. Recently, immunotherapy with PD-1/PD-L1 inhibitors showed great promise for cancer treatment. Nivolumab, pembrolizumab and atezolizumab are the listed drugs for tumor therapy [68-70]. PD-1/PD-L1 are highly expressed and have predictive value for the mesenchymal glioblastoma subtype [71, 72]. The mesenchymal subtype of GBM tends to exhibit low purity and exhibits an intensive immune phenotype [73]. Together, this evidence indicates that the mesenchymal glioblastoma subtype might benefit from anti-PD-1/PD-L1 immunotherapy. However, the TGF-β pathway tends to drive immune evasion when tumors are treated with PD-1/PD-L1 blockade [74, 75]. Therefore, combined treatment targeting the TGF-β pathway and PD-1/PD-L1 immune check point will provide new possibilities for mesenchymal glioblastoma therapy.
In conclusion, our study revealed that the ceRNA signature of mesenchymal glioblastoma is enriched in the TGF-β pathway and characterized this subtype at the mRNA-miRNA level. We found that key micNET signatures could be used to diagnose mesenchymal GBM and discovered that the TGF-β pathway is a potential therapeutic target for mesenchymal glioblastoma.
Abbreviations
micNET: mRNAs in ceRNA networks; ceRNA: competitive endogenous RNA; GBM: glioblastoma; CDS: coding sequence; UTR: 3'-untranslated region; miRNA: microRNA; MREs: miRNA response elements; TFs: transcription factors; TMZ: temozolomide; TGF-β: transforming growth factor-β; EMT: epithelial-to-mesenchymal transition; TGFBR2: TGF-β receptor type 2; ROC: receiver operating characteristic; GO: Gene Ontology; ssGSEA: single-sample GSEA; KPS: Karnofsky performance score.
Supplementary Material
Supplementary figures and table legends.
Supplementary table 1.
Supplementary table 2.
Supplementary table 3.
Supplementary table 4.
Supplementary table 5.
Supplementary table 6.
Supplementary table 7.
Supplementary table 8.
Supplementary table 9.
Supplementary table 10.
Supplementary table 11.
Acknowledgements
This work was supported by the National Key Research and Development Program (No. 2016YFC0902502), the National Natural Science Foundation of China (81502619), the Tianjin National Natural Scientific Fund (16JCYBJC27400), and the Tianjin Municipal Science and Technology Commission Project (15ZXLCSY00060, 15ZXJZSY00040).
Competing Interests
The authors have declared that no competing interest exists.
References
1. Salmena L, Poliseno L, Tay Y, Kats L, Pandolfi PP. A ceRNA hypothesis: the Rosetta Stone of a hidden RNA language? Cell. 2011;146(3):353-358
2. Cesana M, Cacchiarelli D, Legnini I, Santini T, Sthandier O, Chinappi M. et al. A long noncoding RNA controls muscle differentiation by functioning as a competing endogenous RNA. Cell. 2011;147(2):358-369
3. Xia T, Liao Q, Jiang X, Shao Y, Xiao B, Xi Y. et al. Long noncoding RNA associated-competing endogenous RNAs in gastric cancer. Sci Rep. 2014;4:6088
4. Li L, Wang D, Xue M, Mi X, Liang Y, Wang P. 3'UTR shortening identifies high-risk cancers with targeted dysregulation of the ceRNA network. Sci Rep. 2014;4:5406
5. Sumazin P, Yang X, Chiu HS, Chung WJ, Iyer A, Llobet-Navas D. et al. An extensive microRNA-mediated network of RNA-RNA interactions regulates established oncogenic pathways in glioblastoma. Cell. 2011;147(2):370-381
6. Guo X, Deng L, Deng K, Wang H, Shan T, Zhou H. et al. Pseudogene PTENP1 Suppresses Gastric Cancer Progression by Modulating PTEN. Anticancer Agents Med Chem. 2016;16(4):456-464
7. Yu G, Yao W, Gumireddy K, Li A, Wang J, Xiao W. et al. Pseudogene PTENP1 functions as a competing endogenous RNA to suppress clear-cell renal cell carcinoma progression. Mol Cancer Ther. 2014;13(12):3086-3097
8. Stupp R, Mason WP, van den Bent MJ, Weller M, Fisher B, Taphoorn MJ. et al. Radiotherapy plus concomitant and adjuvant temozolomide for glioblastoma. N Engl J Med. 2005;352(10):987-996
9. Stupp R, Hegi ME, Mason WP, van den Bent MJ, Taphoorn MJ, Janzer RC. et al. Effects of radiotherapy with concomitant and adjuvant temozolomide versus radiotherapy alone on survival in glioblastoma in a randomised phase III study: 5-year analysis of the EORTC-NCIC trial. Lancet Oncol. 2009;10(5):459-466
10. Munoz JL, Rodriguez-Cruz V, Ramkissoon SH, Ligon KL, Greco SJ, Rameshwar P. Temozolomide resistance in glioblastoma occurs by miRNA-9-targeted PTCH1, independent of sonic hedgehog level. Oncotarget. 2015;6(2):1190-1201
11. Brennan CW, Verhaak RG, McKenna A, Campos B, Noushmehr H, Salama SR. et al. The somatic genomic landscape of glioblastoma. Cell. 2013;155(2):462-477
12. Verhaak RG, Hoadley KA, Purdom E, Wang V, Qi Y, Wilkerson MD. et al. Integrated genomic analysis identifies clinically relevant subtypes of glioblastoma characterized by abnormalities in PDGFRA, IDH1, EGFR, and NF1. Cancer Cell. 2010;17(1):98-110
13. Sandmann T, Bourgon R, Garcia J, Li C, Cloughesy T, Chinot OL. et al. Patients With Proneural Glioblastoma May Derive Overall Survival Benefit From the Addition of Bevacizumab to First-Line Radiotherapy and Temozolomide: Retrospective Analysis of the AVAglio Trial. J Clin Oncol. 2015;33(25):2735-2744
14. Halliday J, Helmy K, Pattwell SS, Pitter KL, LaPlant Q, Ozawa T. et al. In vivo radiation response of proneural glioma characterized by protective p53 transcriptional program and proneural-mesenchymal shift. Proc Natl Acad Sci U S A. 2014;111(14):5248-5253
15. Bhat KPL, Balasubramaniyan V, Vaillant B, Ezhilarasan R, Hummelink K, Hollingsworth F. et al. Mesenchymal differentiation mediated by NF-kappaB promotes radiation resistance in glioblastoma. Cancer Cell. 2013;24(3):331-346
16. Joseph JV, Conroy S, Pavlov K, Sontakke P, Tomar T, Eggens-Meijer E. et al. Hypoxia enhances migration and invasion in glioblastoma by promoting a mesenchymal shift mediated by the HIF1alpha-ZEB1 axis. Cancer Lett. 2015;359(1):107-116
17. Mineo M, Ricklefs F, Rooj AK, Lyons SM, Ivanov P, Ansari KI. et al. The Long Non-coding RNA HIF1A-AS2 Facilitates the Maintenance of Mesenchymal Glioblastoma Stem-like Cells in Hypoxic Niches. Cell Rep. 2016;15(11):2500-2509
18. Carro MS, Lim WK, Alvarez MJ, Bollo RJ, Zhao X, Snyder EY. et al. The transcriptional network for mesenchymal transformation of brain tumours. Nature. 2010;463(7279):318-325
19. Zhang J, Tian XJ, Zhang H, Teng Y, Li R, Bai F. et al. TGF-beta-induced epithelial-to-mesenchymal transition proceeds through stepwise activation of multiple feedback loops. Sci Signal. 2014;7(345):ra91
20. Lin CY, Erkek S, Tong Y, Yin L, Federation AJ, Zapatka M. et al. Active medulloblastoma enhancers reveal subgroup-specific cellular origins. Nature. 2016;530(7588):57-62
21. Yang D, Sun Y, Hu L, Zheng H, Ji P, Pecot CV. et al. Integrated analyses identify a master microRNA regulatory network for the mesenchymal subtype in serous ovarian cancer. Cancer Cell. 2013;23(2):186-199
22. Roy LO, Poirier MB, Fortin D. Transforming growth factor-beta and its implication in the malignancy of gliomas. Target Oncol. 2015;10(1):1-14
23. Chen Q, Cai J, Wang Q, Wang Y, Liu M, Yang J. et al. Long Noncoding RNA NEAT1, Regulated by the EGFR Pathway, Contributes to Glioblastoma Progression Through the WNT/beta-Catenin Pathway by Scaffolding EZH2. Clin Cancer Res. 2018;24(3):684-695
24. Cai J, Zhu P, Zhang C, Li Q, Wang Z, Li G. et al. Detection of ATRX and IDH1-R132H immunohistochemistry in the progression of 211 paired gliomas. Oncotarget. 2016;7(13):16384-16395
25. Zhao S, Cai J, Li J, Bao G, Li D, Li Y. et al. Bioinformatic Profiling Identifies a Glucose-Related Risk Signature for the Malignancy of Glioma and the Survival of Patients. Mol Neurobiol. 2017;54(10):8203-8210
26. Franceschini A, Szklarczyk D, Frankild S, Kuhn M, Simonovic M, Roth A. et al. STRING v9.1: protein-protein interaction networks, with increased coverage and integration. Nucleic Acids Res. 2013;41(Database issue):D808-815
27. Bindea G, Mlecnik B, Hackl H, Charoentong P, Tosolini M, Kirilovsky A. et al. ClueGO: a Cytoscape plug-in to decipher functionally grouped gene ontology and pathway annotation networks. Bioinformatics. 2009;25(8):1091-1093
28. Subramanian A, Tamayo P, Mootha VK, Mukherjee S, Ebert BL, Gillette MA. et al. Gene set enrichment analysis: a knowledge-based approach for interpreting genome-wide expression profiles. Proc Natl Acad Sci U S A. 2005;102(43):15545-15550
29. Verhaak RG, Tamayo P, Yang JY, Hubbard D, Zhang H, Creighton CJ. et al. Prognostically relevant gene signatures of high-grade serous ovarian carcinoma. J Clin Invest. 2013;123(1):517-525
30. Xu J, Li Y, Lu J, Pan T, Ding N, Wang Z. et al. The mRNA related ceRNA-ceRNA landscape and significance across 20 major cancer types. Nucleic Acids Res. 2015;43(17):8169-8182
31. Li JH, Liu S, Zhou H, Qu LH, Yang JH. starBase v2.0: decoding miRNA-ceRNA, miRNA-ncRNA and protein-RNA interaction networks from large-scale CLIP-Seq data. Nucleic Acids Res. 2014;42(Database issue):D92-97
32. Chiu HS, Llobet-Navas D, Yang X, Chung WJ, Ambesi-Impiombato A, Iyer A. et al. Cupid: simultaneous reconstruction of microRNA-target and ceRNA networks. Genome Res. 2015;25(2):257-267
33. Li Y, Jin X, Wang Z, Li L, Chen H, Lin X. et al. Systematic review of computational methods for identifying miRNA-mediated RNA-RNA crosstalk. Brief Bioinform. 2017
34. Chiu HS, Martinez MR, Bansal M, Subramanian A, Golub TR, Yang X. et al. High-throughput validation of ceRNA regulatory networks. BMC Genomics. 2017;18(1):418
35. Kim TM, Huang W, Park R, Park PJ, Johnson MD. A developmental taxonomy of glioblastoma defined and maintained by MicroRNAs. Cancer Res. 2011;71(9):3387-3399
36. Nadauld LD, Garcia S, Natsoulis G, Bell JM, Miotke L, Hopmans ES. et al. Metastatic tumor evolution and organoid modeling implicate TGFBR2 as a cancer driver in diffuse gastric cancer. Genome Biol. 2014;15(8):428
37. Zhang W, Zhang J, Yan W, You G, Bao Z, Li S. et al. Whole-genome microRNA expression profiling identifies a 5-microRNA signature as a prognostic biomarker in Chinese patients with primary glioblastoma multiforme. Cancer. 2013;119(4):814-824
38. Doucette T, Rao G, Rao A, Shen L, Aldape K, Wei J. et al. Immune Heterogeneity of Glioblastoma Subtypes: Extrapolation from the Cancer Genome Atlas. Cancer Immunol Res. 2013:1 (112)
39. Cai J, Chen Q, Cui Y, Dong J, Chen M, Wu P. et al. Immune heterogeneity and clinicopathologic characterization of IGFBP2 in 2447 glioma samples. Oncoimmunology. 2018;7(5):e1426516
40. Donson AM, Birks DK, Schittone SA, Kleinschmidt-DeMasters BK, Sun DY, Hemenway MF. et al. Increased immune gene expression and immune cell infiltration in high-grade astrocytoma distinguish long-term from short-term survivors. J Immunol. 2012;189(4):1920-1927
41. Cai J, Zhang W, Yang P, Wang Y, Li M, Zhang C. et al. Identification of a 6-cytokine prognostic signature in patients with primary glioblastoma harboring M2 microglia/macrophage phenotype relevance. PLoS One. 2015;10(5):e0126022
42. Binder JX, Pletscher-Frankild S, Tsafou K, Stolte C, O'Donoghue SI, Schneider R. et al. COMPARTMENTS: unification and visualization of protein subcellular localization evidence. Database (Oxford). 2014;2014:bau012
43. Yuan Y, Jiaoming L, Xiang W, Yanhui L, Shu J, Maling G. et al. Analyzing the interactions of mRNAs, miRNAs, lncRNAs and circRNAs to predict competing endogenous RNA networks in glioblastoma. J Neurooncol. 2018;137(3):493-502
44. Ozawa T, Riester M, Cheng YK, Huse JT, Squatrito M, Helmy K. et al. Most Human Non-GCIMP Glioblastoma Subtypes Evolve from a Common Proneural-like Precursor Glioma. Cancer Cell. 2014;26(2):288-300
45. Liu HP, Cao AT, Feng T, Li Q, Zhang W, Yao S. et al. TGF-beta converts Th1 cells into Th17 cells through stimulation of Runx1 expression. Eur J Immunol. 2015;45(4):1010-1018
46. Wang H, Tao T, Yan W, Feng Y, Wang Y, Cai J. et al. Upregulation of miR-181s reverses mesenchymal transition by targeting KPNA4 in glioblastoma. Sci Rep. 2015;5:13072
47. Jiang T, Mao Y, Ma W, Mao Q, You Y, Yang X. et al. CGCG clinical practice guidelines for the management of adult diffuse gliomas. Cancer Lett. 2016;375(2):263-273
48. Huang K, Yang C, Wang QX, Li YS, Fang C, Tan YL. et al. The CRISPR/Cas9 system targeting EGFR exon 17 abrogates NF-kappaB activation via epigenetic modulation of UBXN1 in EGFRwt/vIII glioma cells. Cancer Lett. 2017;388:269-280
49. Nana AW, Yang PM, Lin HY. Overview of Transforming Growth Factor beta Superfamily Involvement in Glioblastoma Initiation and Progression. Asian Pac J Cancer Prev. 2015;16(16):6813-6823
50. Keita M, Bachvarova M, Morin C, Plante M, Gregoire J, Renaud MC. et al. The RUNX1 transcription factor is expressed in serous epithelial ovarian carcinoma and contributes to cell proliferation, migration and invasion. Cell Cycle. 2013;12(6):972-986
51. Zhao X, Chen A, Yan X, Zhang Y, He F, Hayashi Y. et al. Downregulation of RUNX1/CBFbeta by MLL fusion proteins enhances hematopoietic stem cell self-renewal. Blood. 2014;123(11):1729-1738
52. Goyama S, Schibler J, Cunningham L, Zhang Y, Rao Y, Nishimoto N. et al. Transcription factor RUNX1 promotes survival of acute myeloid leukemia cells. J Clin Invest. 2013;123(9):3876-3888
53. Rossetti S, Sacchi N. RUNX1: A microRNA hub in normal and malignant hematopoiesis. Int J Mol Sci. 2013;14(1):1566-1588
54. Janani C, Ranjitha Kumari BD. PPAR gamma gene-a review. Diabetes Metab Syndr. 2015;9(1):46-50
55. Kesanakurti D, Maddirela D, Banasavadi-Siddegowda YK, Lai TH, Qamri Z, Jacob NK. et al. A novel interaction of PAK4 with PPARgamma to regulate Nox1 and radiation-induced epithelial-to-mesenchymal transition in glioma. Oncogene. 2017;36(37):5309-5320
56. Cui M, Xiao Z, Wang Y, Zheng M, Song T, Cai X. et al. Long noncoding RNA HULC modulates abnormal lipid metabolism in hepatoma cells through an miR-9-mediated RXRA signaling pathway. Cancer Res. 2015;75(5):846-857
57. Lu D, Cai H, Park SS, Siddiqui S, Premont RT, Schmalzigaug R. et al. Nuclear GIT2 is an ATM substrate and promotes DNA repair. Mol Cell Biol. 2015;35(7):1081-1096
58. She X, Yu Z, Cui Y, Lei Q, Wang Z, Xu G. et al. miR-181 subunits enhance the chemosensitivity of temozolomide by Rap1B-mediated cytoskeleton remodeling in glioblastoma cells. Med Oncol. 2014;31(4):892
59. Zhang N, Wu X, Yang L, Xiao F, Zhang H, Zhou A. et al. FoxM1 inhibition sensitizes resistant glioblastoma cells to temozolomide by downregulating the expression of DNA-repair gene Rad51. Clin Cancer Res. 2012;18(21):5961-5971
60. Caporali S, Falcinelli S, Starace G, Russo MT, Bonmassar E, Jiricny J. et al. DNA damage induced by temozolomide signals to both ATM and ATR: role of the mismatch repair system. Mol Pharmacol. 2004;66(3):478-491
61. Wang M, Saha J, Hada M, Anderson JA, Pluth JM, O'Neill P. et al. Novel Smad proteins localize to IR-induced double-strand breaks: interplay between TGFbeta and ATM pathways. Nucleic Acids Res. 2013;41(2):933-942
62. Hubackova S, Kucerova A, Michlits G, Kyjacova L, Reinis M, Korolov O. et al. IFNgamma induces oxidative stress, DNA damage and tumor cell senescence via TGFbeta/SMAD signaling-dependent induction of Nox4 and suppression of ANT2. Oncogene. 2016;35(10):1236-1249
63. Zhang M, Kleber S, Rohrich M, Timke C, Han N, Tuettenberg J. et al. Blockade of TGF-beta signaling by the TGFbetaR-I kinase inhibitor LY2109761 enhances radiation response and prolongs survival in glioblastoma. Cancer Res. 2011;71(23):7155-7167
64. Hardee ME, Marciscano AE, Medina-Ramirez CM, Zagzag D, Narayana A, Lonning SM. et al. Resistance of glioblastoma-initiating cells to radiation mediated by the tumor microenvironment can be abolished by inhibiting transforming growth factor-beta. Cancer Res. 2012;72(16):4119-4129
65. Liu L, Zhou W, Cheng CT, Ren X, Somlo G, Fong MY. et al. TGFbeta induces "BRCAness" and sensitivity to PARP inhibition in breast cancer by regulating DNA-repair genes. Mol Cancer Res. 2014;12(11):1597-1609
66. Brunen D, Willems SM, Kellner U, Midgley R, Simon I, Bernards R. TGF-beta: an emerging player in drug resistance. Cell Cycle. 2013;12(18):2960-2968
67. Cho SY, Kang W, Han JY, Min S, Kang J, Lee A. et al. An Integrative Approach to Precision Cancer Medicine Using Patient-Derived Xenografts. Mol Cells. 2016;39(2):77-86
68. Cattrini C, Boccardo F. Atezolizumab and bladder cancer: facing a complex disease. Lancet. 2018;391(10118):305-306
69. Gomes F, Serra-Bellver P, Lorigan P. The role of nivolumab in melanoma. Future Oncol. 2018
70. Luke JJ, Lemons JM, Karrison TG, Pitroda SP, Melotek JM, Zha Y. et al. Safety and Clinical Activity of Pembrolizumab and Multisite Stereotactic Body Radiotherapy in Patients With Advanced Solid Tumors. J Clin Oncol. 2018 JCO2017762229
71. Wang Z, Zhang C, Liu X, Sun L, Li G, Liang J. et al. Molecular and clinical characterization of PD-L1 expression at transcriptional level via 976 samples of brain glioma. Oncoimmunology. 2016;5(11):e1196310
72. Liu S, Wang Z, Wang Y, Fan X, Zhang C, Ma W. et al. PD-1 related transcriptome profile and clinical outcome in diffuse gliomas. Oncoimmunology. 2018;7(2):e1382792
73. Zhang C, Cheng W, Ren X, Wang Z, Liu X, Li G. et al. Tumor Purity as an Underlying Key Factor in Glioma. Clin Cancer Res. 2017;23(20):6279-6291
74. Mariathasan S, Turley SJ, Nickles D, Castiglioni A, Yuen K, Wang Y. et al. TGFbeta attenuates tumour response to PD-L1 blockade by contributing to exclusion of T cells. Nature. 2018
75. Tauriello DVF, Palomo-Ponce S, Stork D, Berenguer-Llergo A, Badia-Ramentol J, Iglesias M. et al. TGFbeta drives immune evasion in genetically reconstituted colon cancer metastasis. Nature. 2018
Author contact
![]() Corresponding authors: Chunsheng Kang, Tel.: +86 22 60817499; Fax: +86 22 27832255; Email: kang97061edu.cn, Jing Zhang, Tel.: +1 3474173298; Fax: +1 2128515267; Email: jz2716columbia.edu and Chuanlu Jiang, Tel.: +86 451 86605088; Fax: +86 451 86296347; Email: jcl6688com
Corresponding authors: Chunsheng Kang, Tel.: +86 22 60817499; Fax: +86 22 27832255; Email: kang97061edu.cn, Jing Zhang, Tel.: +1 3474173298; Fax: +1 2128515267; Email: jz2716columbia.edu and Chuanlu Jiang, Tel.: +86 451 86605088; Fax: +86 451 86296347; Email: jcl6688com