Impact Factor
 Global reach, higher impact
Theranostics 2018; 8(18):4985-4994. doi:10.7150/thno.27728 This issue Cite
Research Paper
Early prediction of revascularisation by angiomotin-targeting positron emission tomography
Anais Moyon1,2,3 ![]() , Philippe Garrigue1,2,3, Laure Balasse2, Samantha Fernandez2, Pauline Brige2, Marie Nollet1, Guillaume Hache1,2, Marcel Blot-Chabaud1, Françoise Dignat-George1,4, Benjamin Guillet1,2,3
, Philippe Garrigue1,2,3, Laure Balasse2, Samantha Fernandez2, Pauline Brige2, Marie Nollet1, Guillaume Hache1,2, Marcel Blot-Chabaud1, Françoise Dignat-George1,4, Benjamin Guillet1,2,3 ![]()
1. Aix Marseille Univ, INSERM 1263, INRA 1260, C2VN, Marseille, France.
2. Aix-Marseille Univ, CERIMED, Marseille, France.
3. Service de Radiopharmacie, APHM, Marseille, France.
4. Service d'Hématologie, Hôpital Conception, APHM, Marseille, France.
Received 2018-6-7; Accepted 2018-8-10; Published 2018-10-5
Abstract

This study aimed to develop a PET imaging agent of angiomotin (AMOT) expression, a potential biomarker of functional tissue regeneration in post-ischaemic conditions.
Methods: Hindlimb ischaemia was induced by ligature and resection of the right femoral artery in mice, and clinical score and limb perfusion were evaluated up to 30 days after surgery. AMOT expression was evaluated by histology and Western blot analysis. NODAGA-conjugates of AMOT ligand, sCD146, were designed, synthesised and radiolabelled with gallium-68. 68Ga-sCD146 microPET/CT imaging was performed from day 1 to day 30 after ischaemia. 68Ga-sCD146 specificity for AMOT was evaluated by autoradiography.
Results: Immunohistochemistry showed a significant endothelial overexpression of AMOT from day 5 up to day 10 in the ischaemic hindlimb. 68Ga-sCD146 PET signal intensity correlated significantly with AMOT immunohistochemistry evaluation. 68Ga-sCD146 PET imaging showed a significant uptake in the ischaemic hindlimb from day 2 to day 15, peaking on day 5 (ipsi/contralateral ratio = 2.4 ± 1.3, P = 0.0005) and significantly decreased after pharmacological blocking (62.57 ± 11% decrease in PET signal P = 0.032). Finally, we observed a significant correlation between day 5 68Ga-sCD146 PET signal intensity and clinical recovery (day 28) or hindlimb perfusion recovery (day 30).
Conclusions: This work reports for the first time an early and sustained increase in AMOT expression after hindlimb ischaemia in mice. We therefore developed an AMOT-targeting imaging agent, 68Ga-sCD146, and showed its specific uptake up to 21 days after ischaemic hindlimb using microPET imaging. Correlation of early post-ischaemic PET signal with both delayed perfusion recovery and clinical outcome allows us to postulate that 68Ga-sCD146 represents a promising radiotracer for tissue angiogenesis assessment.
Keywords: angiomotin, ischaemia, sCD146, Gallium, angiogenesis.
Introduction
Tissue blood supply defect, so-called ischaemia, results in tissue suffering from a lack of nutrients and oxygen, leading to cell death and tissue atrophy, but also initiates adaptive regeneration. The activation of these processes depends on tissue subtypes, blood flow impairment duration and intensity, and comorbidities [1]. Cerebral ischaemia, heart ischaemia and critical limb ischaemia are devastating vascular diseases with a rising prevalence, notably due to the increasingly elderly population [2]. Facing the absence of any validated effective therapy, many efforts are currently committed to developing treatments that enhance tissue regeneration [3]. Additionally, new diagnostic tools are required not only to identify new molecular targets, but also to assess angiogenesis and subsequent tissue regeneration in patients for therapy selection and/or therapy monitoring. For this purpose, isotopic imaging represents an efficient imaging modality thanks to its high sensitivity and its ability to quantify biochemical processes at the molecular scale [4,5].
Angiogenesis is now well understood, and many targets have been evaluated for molecular imaging of angiogenesis, such as integrin αvβ3, vascular endothelial growth factor receptor (VEGFR), CD105 or CD13, in preclinical and clinical studies for the past 20 years [6]. Still, these developments have not led to convincing results, and efforts are still needed to identify innovative relevant targets and to develop effective imaging agents of angiogenesis.
Recent evidence has supported a critical role for angiomotin (AMOT), a member of the motin family, in angiogenesis regulation during the embryonic vascular system development [7] and also during tumour vasculature growth promotion [8,9]. Alternative splicing encodes at least two AMOT isoforms, p80 and p130 (80kDa and 130kDa, respectively), sharing different expressions and biological activities predominantly in endothelial cells [10].
Angiostatin was first identified as an AMOT antagonist, impairing its pro-angiogenic properties [11]. We recently described a soluble form of CD146 (sCD146) as a positive agonist of AMOT [12]. sCD146 is mainly generated by the proteolytic cleavage of the membrane-anchored form of CD146 [13,14], and presents in vitro and in vivo angiogenic properties in hindlimb ischaemia models [15] and mouse tumour-bearing models [16]. Furthermore, numerous reports highlight that serum levels of sCD146 can be considered a novel biomarker of heart failure patients [17,18], systemic sclerosis [19,20], pulmonary congestion [21], liver diseases [22], atherosclerosis and plaque instability [23,24].
Taking these biomarker properties and perspectives into account, its nanomolar affinity for AMOT [12] and its involvement in angiogenic processes through AMOT targeting, we hypothesised that a 68Ga-radiolabelled form of sCD146 may represent a potential radiotracer for PET imaging of AMOT expression, and a surrogate marker of tissue regeneration and angiogenesis.
The aim of this study was 1) to validate our hypothesis that AMOT is overexpressed after ischaemia in a post-ischaemic context, 2) to develop a 68Ga-radiolabelled derivative of sCD146, and 3) to evaluate its potential as a PET imaging agent for AMOT tissue expression and its predictive value for tissue recovery.
Methods
Animal experiments
All procedures using animals were approved by the Institution's Animal Care and Use Committee (Project #2015061112039708, CE14 Aix-Marseille Université) and were conducted according to the EU Directive 2010/63. Seven-week-old female BALB/c mice (Janvier Labs) were housed in enriched cages placed in a temperature-and hygrometry-controlled room with daily monitoring and fed with water and commercial diet ad libitum.
Mouse model of hindlimb ischaemia
Unilateral hindlimb ischaemia was performed after femoral artery excision. LASER-Doppler perfusion imaging (Perimed) was used to assess revascularisation from day 1 to day 30 after surgery. Hindlimb perfusion was quantified on days 1, 7, 15, 20 and 30 post-ischaemia and is expressed as a ratio of ischaemic to non-ischaemic limb blood flow. A motility impairment score was calculated for each mouse as follows: 1, unrestricted active movement; 2, restricted active foot; 3, use of the other leg only; 4, leg necrosis; and 5, self-amputation.
Immunohistochemistry
To evaluate tissue AMOT expression, mice were euthanised on days 5, 10, 21 and 30 post-ischaemia. Gastrocnemius ischaemic and contralateral muscles were harvested and fixed in 10% neutral-buffered formalin and embedded in paraffin (Tissue-Tek VIP5 Jr, Sakura). Five μm-thick sections were stained with a C-18 anti-angiomotin antibody (Santa-Cruz, 1:500) using a fully automated Leica BOND-III stainer and a Novocastra Bond Polymer Refine Detection kit containing a post-primary peroxidase blocking polymer reagent and a chromogen DAB (diaminobenzidine), and counterstained with haematoxylin. Slides were observed under an optical microscope (Nikon Eclipse) and results are expressed as AMOT-positive surface (µm2).
Western blot
Western blot analysis was performed as previously described [25]. Briefly, mice were euthanised on day 5 post-ischaemia. Gastrocnemius ischaemic and contralateral muscles were harvested and directly snap-frozen in liquid nitrogen. Each muscle was mechanically milled in cold lysis buffer (Tris 1 M, pH 8 (10 mM), EDTA 0.5 M, pH 8 (1 mM), NaCl 5 N (150 mM) and NP40 10% 1 mL). Proteins were quantified by protein assay (BCA protein assay kit, Pierce). Thirty micrograms of protein was mixed with NuPAGE lithium dodecylsulfate sample buffer (Invitrogen) and NuPAGE sample reducing agent (Invitrogen). Samples were then subjected to NuPAGE using 4-12% Novex Bis-Tris gels (Invitrogen), and separated proteins were transferred onto nitrocellulose membranes (Invitrogen). Membranes were probed with specific primary antibodies, anti-AMOT p130 or p80 antibody (Abcam ab85143) diluted to 1/1000, incubated overnight with a control antibody (anti-GAPDH 1/5000, Abcam ab9484). Membranes were then washed three times with TBST and incubated with respective peroxidase-coupled secondary antibodies (Thermo Scientific, 31460). Blots were revealed with the ECL substrate (Pierce).
NODAGA conjugation
sCD146 solution (1 mg/mL, Biocytex) was purified using Amicon Ultra-0.5 3 kDa centrifugal filter (Millipore) then mixed with p-NCS-benzyl-NODAGA (10Eq) in 0.2 M bicarbonate buffer. The mixture was incubated at 37 °C for 3 h. The conjugate was then transferred to an Amicon Ultra-0.5 3 kDa centrifugal filter, washed three times with PBS to eliminate unconjugated small molecules, and concentrated before storing at -80 °C.
Radiochemistry
Gallium chloride (68GaCl3, 200.7 ± 41 MBq/500 µL) was obtained from the elution of a commercial TiO2-based 68Ge/68Ga generator (Galliapharm, Eckert-Ziegler) using 0.1 N HCl, and buffered with a fresh 4 M ammonium acetate solution (pH 7.4) and added to sCD146 precursor (15 μg), reaching a final pH of 6.0. The reaction mixture was stirred at room temperature for 15 min with gentle agitation every 5 min.
Radiochemical purity was determined by radio-thin-layer chromatography (TLC) using a miniGITA radio-TLC scanner detector (Raytest) (solid phase: ITLC-SG; eluents: 1:1 [v/v] mixture of 1 M aqueous ammonium acetate solution and methanol; Rf [free 68Ga]/[68Ga-sCD146]: 0/1). Evaluation of radiolabelling stability was performed in human serum at 30, 60 and 120 min after radiosynthesis.
18F-Fluorodeoxyglucose (18F-FDG) was purchased as a ready-to-use radiopharmaceutical (Gluscan, Advanced Accelerator Applications).
Assessment of 68Ga-sCD146 specificity for AMOT
To validate the radiotracer affinity for AMOT, autoradiography of gastrocnemius muscle sections was performed on day 5 post-ischaemia. Muscles were fixed in 10% paraformaldehyde overnight, dehydrated, and embedded in paraffin (Tissue-Tek VIP5 Jr, Sakura). Sections 5-µm thick were deparaffinised, rehydrated and incubated with 10-15 kBq of 68Ga-sCD146 (2.05 nM in PBS) for 30 min, without or after 60 min of C-18 anti-AMOT antibody blocking (1 μM in PBS). Radioactivity of each section was then evaluated using a Cyclone phosphor system scanner (Perkin-Elmer). Results are expressed as digital light units per mm2 (DLU/mm2).
MicroPET imaging
In vivo biodistribution in healthy mice: images were continuously acquired immediately after a 5.0 ± 2 MBq/100 µL 68Ga-sCD146 IV injection and recorded up to 2 h post-injection.
MicroPET imaging of hindlimb ischaemia mouse model: mice were IV injected with 5±3.5 MBq/100 µL of 68Ga-sCD146 on days -1, 1, 2, 5, 10, 15, 21 and 30 post-ischaemia. PET images were acquired 40 min after injection.
Another group of ischaemic mice, fasted for 4 h, were IV injected with 10 ± 4.9 MBq/100 µL of 18F-FDG on days -1, 2, 5, 10, 15, 21 and 30 post-surgery. PET images were acquired 40 min after injection. No blood flow defect difference (P = 0.51) was observed between the two groups of mice (68Ga-sCD146; n = 7 and 18F-FDG; n =5) at day 1 post-ischaemia.
Blocking experiment: a 100-fold excess of cold peptide (sCD146, 250µg) was IV injected 30 min before 5.0 ± 3 MBq/100 µL 68Ga-sCD146 injection. PET images were acquired 40 min after 68Ga-sCD146 injection.
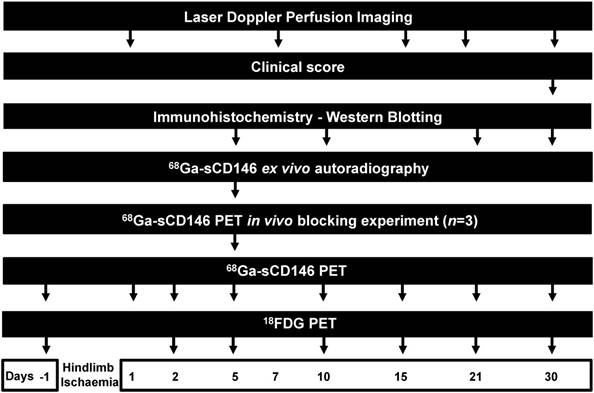
PET imaging experiments are summarised in Figure 1.
Experimental paradigm.
MicroPET imaging sessions were performed on a NanoscanPET/CT camera (Mediso) under 2% isoflurane anaesthesia. Quantitative region-of-interest (ROI) analysis of the PET signal was performed on attenuation- and decay-corrected PET images using InterviewFusion software (Mediso) and tissue uptake values are expressed as a mean ischaemic-to-contralateral gastrocnemius muscle signal ratio ±SD and as a mean percentage of the injected dose per gram of tissue (%ID/g) ± SD.
Ex vivo biodistribution studies
Biodistribution studies were performed to validate the PET data after dynamic PET scans of 2 h. Mice were euthanised before all the main organs/tissues were collected and weighed. The activity in tissues was counted in an automated γ-counter (Packard, Cobra-II), and the accumulated activity values were calculated and are reported as %ID/g (mean ± SD).
Statistical analysis
Biodistribution data were analysed using GraphPad Prism software v7. Data are expressed as mean values ± SD. Ischaemic-to-contralateral muscle ratio differences were analysed using one-way ANOVA analysis of variance. Differences between ischaemic and contralateral muscles were analysed using parametric paired Student's t-test. Gaussian distribution was assumed by a Shapiro-Wilk normality test. Analysis of correlation was realised with a Pearson test. Differences were considered statistically significant when P < 0.05.
Results
Hindlimb ischaemia induced blood perfusion defect followed by partial recovery
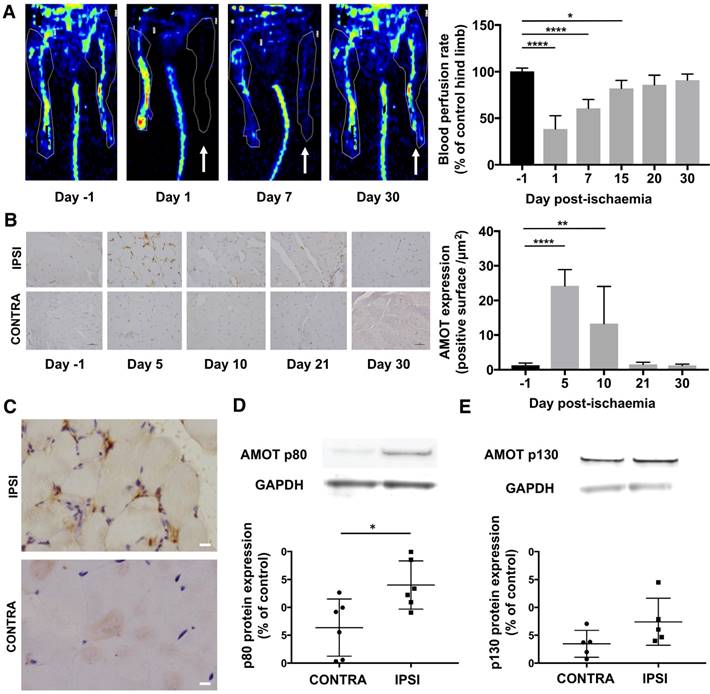
Hindlimb blood flow defect and recovery was evaluated using LASER-Doppler imaging over 4 weeks after femoral artery ligation. Average ipsilateral-to-contralateral hindlimb tissue perfusion ratio (n = 7) decreased from 100.4 ± 3% before surgery to 38.6 ± 14% (P = 0.0001) on day 1, 60.8 ± 9% on day 7 (P = 0.0001), 82.0 ± 9% on day 15 (P = 0.01), 86.0 ± 10% (P = 0.07) on day 20, and 91.0 ± 7% (P = 0.35) on day 30 after surgery (Figure 2A). The mean clinical tissue damage score was observed at the end of the experiment at day 30 post-surgery (3.4 ± 1.6; n = 15).
AMOT signal expression was increased after hindlimb ischaemia. (A) LASER-Doppler perfusion imaging showing the gradual recovery of blood perfusion in the ischaemic hindlimb (white arrow: ischaemic hindlimb). Quantitative analysis expressed as ischaemic-to-contralateral muscle ratio (%, mean ± SD) from day 1 to day 30 post-surgery showed a significant decrease in hindlimb perfusion on days 1, 7 and 15 compared to the day before surgery (****P = 0.0001 and *P = 0.014; n = 7). (B) Immunohistochemistry staining of AMOT in hindlimb ischaemic muscle (IPSI) and contralateral muscle (CONTRA). Quantitative analysis showed a significant overexpression of AMOT in ischaemic muscle compared to contralateral muscle. (****P < 0.0001 and **P = 0.004; n = 4). (C) Immunohistochemistry staining of AMOT in hindlimb ischaemic muscle (upper frame) and contralateral muscle (below) at day 5 post-ischaemia. Qualitative analysis showed a co-localisation between AMOT staining and vascular structure in ischaemic muscle. (scale bar: 10 µm). (D-E) Protein expression of AMOT in hindlimb ischaemic muscle and contralateral muscle assessed by Western blot analysis of gastrocnemius muscles at day 5 post-surgery. Results are expressed in relative values on GAPDH expression. Quantitative analysis showed a significant overexpression of AMOT p80 and p130 isoforms in ischaemic muscle compared to contralateral muscle. (*P = 0.034; n = 6 for p80 and P = 0.08; n = 5 for p130).
Tissue AMOT expression is sustainably increased after hindlimb ischaemia
AMOT expression was mainly observed within the vascular area of muscle fibre and presented a typical endothelial labelling (Figure 2C) [26].
Quantitative analysis of immunohistochemical staining compared to the day before surgery, expressed as ipsilateral-to-contralateral ratio, showed a significant increase of AMOT expression in ischaemic muscle from day 5 (24.2 ± 5; P < 0.0001; n = 6) and up to day 10 (13.3 ± 11; P = 0.004; n = 4). No significant overexpression was observed on day 21 (1.5 ± 0.6; P = 0.99; n = 4) or on day 30 post-ischaemia (1.3 ± 0.4; P = 0.99; n = 4) (Figure 2B).
AMOT p80 and p130 isoforms are overexpressed 5 days after hindlimb ischaemia
Five days post-ischaemia, Western blot experiments showed a significant overexpression of AMOT p80 isoform expression in the ischaemic limb (1.4 ± 0.4; P = 0.04; n = 6) compared to the contralateral limb (0.63 ± 0.5). Moreover, we did not observe a significant AMOT p130 isoform overexpression in the ischaemic limb (0.74 ± 0.4; P = 0.08; n = 5) compared to the contralateral limb (0.34 ± 0.2) (Figure 2D-E).
Radiosynthesis of 68Ga-sCD146 results in a stable radiotracer that specifically targets AMOT
The radiolabelling purity of 68Ga-sCD146 was 93.1 ± 2% (n = 6) without further purification and the specific radioactivity was 1.33 ± 0.04 GBq/nmol. The radiochemical stability of 68Ga-sCD146 was evaluated in serum 120 min after synthesis at 90 ± 2% (n = 3).
68Ga-sCD146 showed a favourable pharmacokinetic profile in vivo
68Ga-sCD146 biodistribution was evaluated in healthy mice (n = 3) by dynamic microPET up to 2 h following IV injection (Figure 3A, C-D). 68Ga-sCD146 was mainly eliminated through the urinary tract (bladder: 173.4 ± 73 %ID/g 2 h p.i.) and less notably through the hepatobiliary system (liver: 9.4 ± 3 %ID/g 2 h p.i.). PET signal quantifications in the intestine and the hindlimb muscle were 1.7 ± 0.04 %ID/g and 0.31 ± 0.2 %ID/g respectively.
68Ga-sCD146 biodistribution studies. (A) Representative biodistribution obtained by PET imaging. (B) Biodistribution studies obtained by gamma counting 120 min post-injection (n = 3). (C) Image-derived time activity curves for heart, liver, lung, brain, bones, intestines and muscles (n = 3). (D) 68Ga-sCD146 biodistribution in bladder and kidneys. (n = 3). Results showed that 68Ga-sCD146 was mostly eliminated by the urinary and hepatobiliary route.
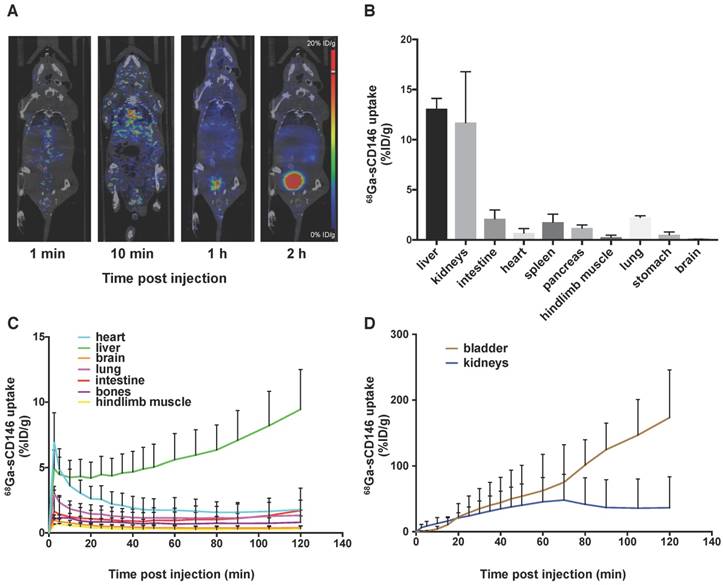
These results were confirmed by gamma counting after animal euthanasia and organ harvesting 2 h after injection: 13.0 ± 1.0 %ID/g, 2.12 ± 0.87 %ID/g and 0.26 ± 0.21 %ID/g for the liver, intestine and hindlimb muscle, respectively (n = 3; Figure 3B).
68Ga-sCD146 targets AMOT protein
68Ga-sCD146 signal quantification from autoradiography on sections of gastrocnemius muscles harvested on day 5 post-ischaemia was significantly higher on ischaemic muscle sections (477.4 ± 201 DLU/mm2) compared to the contralateral ones (115.10 ± 134 DLU/mm2; n = 8; P = 0.0012) (Figure 4A). A further 60 min preincubation with C-18 anti-AMOT antibody resulted in a significant decrease of 68Ga-sCD146 binding on ischaemic gastrocnemius muscle (93.9 ± 116 DLU/mm2), resulting in a mean decrease of -79.63 ± 28% (n = 8; P = 0.0008).
68Ga-sCD146 targeted AMOT protein. (A) 68Ga-sCD146 specificity assessed by autoradiography on sections of gastrocnemius muscle on day 5 post-ischaemia, after incubation with 10-15 kBq of 68Ga-sCD146 (2.05 nM in PBS) for 30 min, without or after 60 min of C-18 anti-AMOT antibody blocking (1 μM) (***P = 0.0008; n = 8). (B) Representative PET images of 68Ga-sCD146 acquired 40 min post-injection, without (a) and after blocking experiments (b) with a 100-fold excess of unradiolabelled peptide injected 30 min before the radiotracer injection (white arrow: ischaemic hindlimb). (C) Hindlimb uptake of 68Ga-sCD146 quantification expressed as ischaemic-to-contralateral muscle ratio on day 5 post-surgery and 40 min post-injection. 68Ga-sCD146 uptake was significantly reduced in the presence of unlabelled peptide sCD146 (160 μg). (*P = 0.03; n = 3). (D) Correlation between AMOT expression assessed by immunohistochemistry and 68Ga-sCD146 uptake by PET imaging at all acquisition times. (P = 0.02; n = 5).
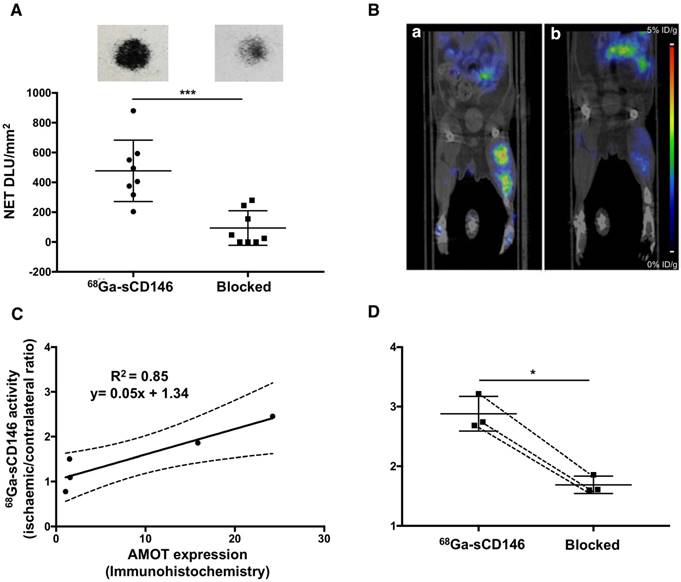
Notably, a significant correlation was observed between AMOT expression assessed by immunohistochemistry and 68Ga-sCD146 PET signal intensity in ischaemic muscle at all acquisition times (Pearson R2 = 0.851; P = 0.025; n = 5) (Figure 4C).
68Ga-sCD146 PET signal increased earlier, higher and more sustainably compared to 18F-FDG after hindlimb ischaemia in mice
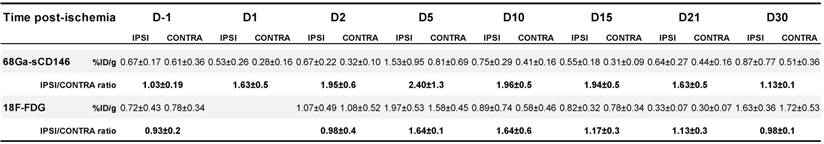
68Ga-sCD146 uptake (Table 1) expressed as ischaemic-to-contralateral muscle PET signal ratio showed a significant tracer uptake, peaking on day 5 post-ischaemia (2.40 ± 1.3), and was 1.63 ± 0.5, 1.95 ± 0.6, 1.96 ± 0.5, 1.94 ± 0.5, 1.63 ± 0.5 and 1.13 ± 0.1 on days 1, 2, 10, 15, 21 and 30 after ischaemia, respectively (n = 7). Compared to the day before surgery (0.93 ± 0.2; n = 7), the 68Ga-sCD146 PET signal ratio was significantly higher on days 2 (P = 0.0183), 10 (P = 0.018) and 15 (P = 0.021) and most notably on day 5 (P = 0.0005) (Figure 5A, C).
68Ga-sCD146 and 18F-FDG TEP imaging the day before surgery (D-1) and from day 1 up to day 30 after hindlimbs ischemia induction in mice.
68Ga-sCD146 and 18F-FDG imaging after hindlimb ischaemia. (A) Representative 68Ga-sCD146 PET images of a hindlimb ischaemia model. (B) Representative 18F-FDG PET images of a hindlimb ischaemia model (white arrow: ischaemic hindlimb). (C) 68Ga-sCD146 hindlimb uptake 40 min post-injection expressed as ischaemic-to-contralateral muscle ratio on days 1, 2, 5, 10, 15, 21 and 30 post-ischaemia (*P < 0.05 vs D-1; ***P = 0.0005 vs D-1; n = 7). (D) Hindlimb uptake 40 min post-injection of 18F-FDG expressed as ischaemic-to-contralateral muscle ratio on days -1, 2, 5, 10, 15, 21 and 30 post-ischaemia (*P < 0.05 vs D-1; n = 5).
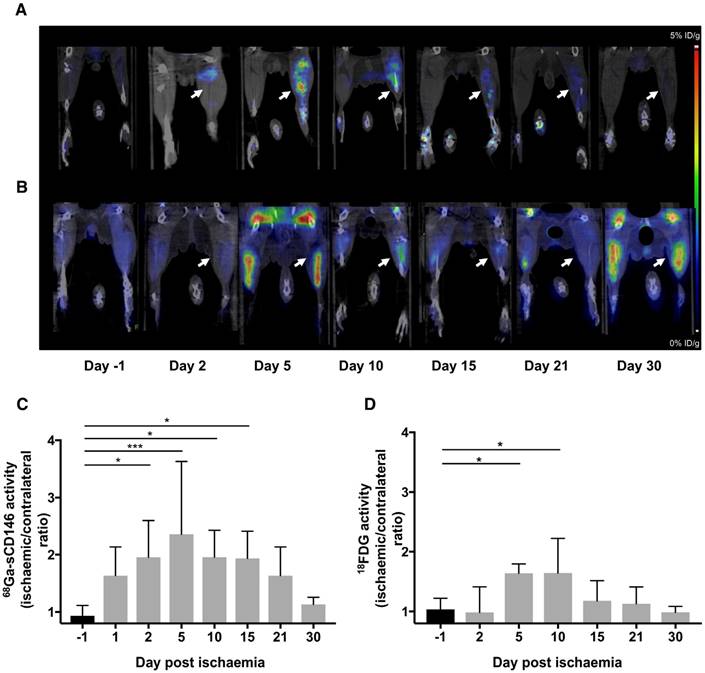
18F-FDG uptake (Table 1) expressed as ischaemic-to-contralateral muscle PET signal ratio was 0.98 ± 0.4, 1.64 ± 0.1, 1.64 ± 0.6, 1.17 ± 0.3, 1.13 ± 0.3 and 0.98 ± 0.1 on days 2, 5, 10, 15, 21 and 30 after ischaemia, respectively (n = 5). Compared to the day before surgery (1.03 ± 0.19; n = 5), the 18F-FDG PET signal ratio was significantly higher on days 5 (P = 0.038) and 10 (P = 0.037). No significant difference was observed on days 1, 15, 21 and 30 after ischaemia (Figure 5B, D).
68Ga-sCD146 signal specificity was confirmed in vivo
A large excess of cold sCD146 (160 μg) administered prior to 68Ga-sCD146 injection significantly decreased the ischaemic muscle uptake from 2.88 ± 0.3 (unblocked) to 1.68 ± 0.1 (blocked), resulting in a 62.57 ± 11% decrease of PET signal (P = 0.032; n = 3) (Figure 4B, D).
68Ga-sCD146 PET signal correlated both with blood perfusion recovery and clinical outcome
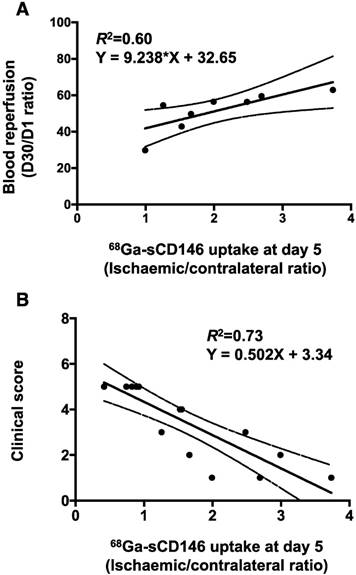
Moreover, a significant positive correlation was found between individual blood perfusion recovery expressed as day 30 to day 1 perfusion ratio, and 68Ga-sCD146 PET signal intensity on day 5 post-ischaemia (Pearson R2 = 0.60; P = 0.024; n = 8).
Most notably, a significant correlation was found between individual the clinical scoring on day 30 and the early 68Ga-sCD146 PET signal on day 5 post-ischaemia (Pearson R2 = 0.73; P < 0.0001; n = 15) (Figure 6A and Figure 5B).
Correlation studies. (A) Correlation between perfusion recovery expressed as day 30 to day 1 ratio, and 68Ga-sCD146 uptake by PET imaging on day 5 post-ischaemia. (P = 0.02; n = 8). (B) Correlation between clinical scoring of mice at the end of experiment and 68Ga-sCD146 uptake by PET imaging on day 5 post-ischaemia. (P < 0.0001; n = 15).
However, no significant correlation was found between individual blood perfusion recovery or clinical scoring on day 30 and early 18F-FDG signal on day 5 post-ischaemia (Pearson R2 = 0.509; P = 0.38; n = 5), (Pearson R2 = 0.315; P = 0.31; n = 5).
Discussion
In this study, we demonstrated formally for the first time an increase in AMOT expression in post-ischaemic conditions. We also reported that expression levels of AMOT can be monitored in murine hindlimb ischaemia by PET imaging with 68Ga-labelled sCD146. Finally, we observed that PET imaging with 68Ga-labelled sCD146 on day 5 post-ischaemia was correlated with delayed blood flow recovery and hindlimb salvage on day 30.
According to recent reports describing AMOT involvement in angiogenic processes [11], in this study we bring a proof of concept using immunohistochemistry and Western blot analysis that AMOT expression is highly upregulated after hindlimb ischaemia in mice in an early and prolonged manner.
These observations may present AMOT as a new key protein in the regulation of tissue adaptation from perfusion defect in post-ischaemic conditions.
Our observations are in agreement with recent arguments describing an involvement of AMOT in post-ischaemic situations. In fact, Wu et al. [27] identified, after genotype analysis of data generated from dogs conditioned to high altitude, five genes related to hypoxia-adaptation signatures on the X chromosome, among which was the AMOT gene. At the clinical stage, an increase of AMOT p130 expression has been reported in a group of patients suffering from obstructive sleep apnoea [28], confirming the implication of AMOT in chronic intermittent hypoxia with re-oxygenation. Overexpression of p80 and p130 isoforms in this context of revascularisation confirms previous data describing the expression profile of each isoform over the different steps of angiogenesis [29]. In the ischaemic hindlimb on day 5 post-ischaemia, we observed a significant overexpression of p80 isoform involved in new vessel formation and endothelial cell migration, corroborating the AMOT immunohistochemistry signal location within the muscle vascular area [26]. In contrast, we did not observe a significant overexpression of p130 isoform on day 5 post-ischaemia involved in blood vessel stabilisation and maturation [30], a process engaged later in post-ischaemic angiogenesis.
In previous reports, we demonstrated that AMOT mediated the beneficial effects of sCD146 on endothelial progenitor cells, and that a daily sCD146 injection had to be pursued at least for 12 days to generate a lasting beneficial effect on revascularisation and tissue regeneration in a hindlimb ischaemia mouse model [12,15]. This coincides with the long-lasting overexpression of AMOT observed here after ischaemia.
We therefore developed and synthesised 68Ga-sCD146, gaining a 70% radiolabelling yield and a ≥90% radiochemical purity without purification. 68Ga-sCD146 showed biological stability and propitious in vivo biodistribution. The preserved specificity towards AMOT was confirmed by competition studies: ex vivo by autoradiography on muscle sections, and in vivo by microPET imaging with or without blocking with an excess of cold peptide in the hindlimb ischaemia model. Blocking experiments (in vivo and ex vivo) and significant correlations between 68Ga-sCD146 signal intensity and AMOT immunohistochemistry validated PET imaging quantification of AMOT using 68Ga-sCD146.
Even if sCD146 is involved in inflammation, the sCD146/AMOT pathway roles in post-ischaemic conditions have not been clearly identified [31]. 18F-FDG, a highly sensitive and unspecific tracer of inflammation and cell proliferation [32], showed in this study a delayed and lower PET signal intensity than that of 68Ga-sCD146 in the ischaemic limb, which was observed after day 1 post-ischaemia, translating to an initiation of CD146/AMOT pathway before the inflammatory phase. Supported by the positive correlations we observed between 68Ga-sCD146 PET signal intensity on day 5 and both the delayed revascularisation and the clinical score on day 28, we can speculate that 68Ga-sCD146 PET imaging of AMOT overexpression could be an early predictive factor for delayed tissue revascularisation and clinical recovery.
Considering other strategies of molecular imaging of angiogenesis applied to a hindlimb ischaemia model in mice, the i/c ratio observed with 68Ga-sCD146 is at least similar to or greater than those of previous reports targeting integrin αvβ3 [33-35] or VEGFR2 [36]. Likewise, in this model, AMOT imaging led to an early significant PET signal from day 1 post-ischaemia, while αvβ3 integrin imaging did not lead to a positive signal before day 3 using PET imaging [34], and neither did VEGFR using in vivo fluorescence imaging [26]. Those could be related to an earlier post-ischaemic activation of the AMOT pathway compared to αvβ3 integrin or VEGFR upregulation initiation. Among innovative molecular imaging probes applied to angiogenesis, 68Ga-sCD146 can present advantages as a peptide-based strategy, combining high affinity and favourable pharmacokinetics. Others, which use antibodies (TRC105 and YY146) [37-38], suffer from low blood clearance and require long half-life positron emitter radiolabels, such as 64Cu, and days between radiotracer infusion and image processing. Moreover, 68Ga has many advantages in terms of market authorisation, supply and patient radiological protection. Radiolabelled TRC105 and YY146 target, respectively, endoglin and CD146, other molecular proteins of interest in angiogenesis. To date, neither has shown significant correlations between PET signal intensity and post-ischaemic outcome, which constitutes a critical endpoint of a diagnostic imaging agent.
To conclude, this study first demonstrated that AMOT expression in a post-ischaemic situation was early, and intensively and sustainably upregulated. We hence developed and validated in a mouse hindlimb ischaemia model a PET imaging radiotracer of AMOT, 68Ga-sCD146, that presented interesting diagnostic and prognostic properties in post-ischaemic situations. This innovative PET imaging approach would be an asset in the evaluation of patients with ischaemic diseases.
Abbreviations
AMOT : angiomotin; PET : positron emission tomography; TLC : thin layer chromatography; 18F-FDG : 18F-Fluorodeoxyglucose; IV : intravenous; %ID/g : percentage of the injected dose per gram of tissue; p.i. : post-injection; IPSI : ipsilateral; CONTRA : contralateral.
Acknowledgements
We thank Sandrine Pons, Michel Skandalovski and Samy Vigier for technical assistance.
Competing Interests
This work was supported by Fondation de l'Avenir, MSD avenir and a patent (B2444PC00) was registered at the European Patent Office. The authors have declared that no competing interest exists.
References
1. Kalogeris T, Baines CP, Krenz M, Korthuis RJ. Chapter Six - Cell Biology of Ischemia/Reperfusion Injury. In: (ed.) Jeon KWBT. et al. Vol 298. Academic Press. 2012:229-317
2. Benjamin EJ, Blaha MJ, Chiuve SE. et al. Heart disease and stroke statistics—2017 update: a report from the American Heart Association. Circulation. 2017;135:e146-e603
3. Moretti A, Ferrari F, Villa RF. Neuroprotection for ischaemic stroke: current status and challenges. Pharmacol Ther. 2015;146:23-34
4. Zaidi H, Prasad R. Advances in multimodality molecular imaging. J Med Phys. 2009;34:122-128
5. Khalil MM, Tremoleda JL, Bayomy TB, Gsell W. Molecular SPECT imaging: an overview. Int J Mol Imaging. 2011;2011:796025
6. Hendrikx G, Voo S, Bauwens M, Post MJ, Mottaghy FM. SPECT and PET imaging of angiogenesis and arteriogenesis in pre-clinical models of myocardial ischemia and peripheral vascular disease. Eur J Nucl Med Mol Imaging. 2016;43:2433-2447
7. Aase K, Ernkvist M, Ebarasi L. et al. Angiomotin regulates endothelial cell migration during embryonic angiogenesis. Genes Dev. 2007;21:2055-2068
8. Arigoni M, Barutello G, Lanzardo S. et al. A vaccine targeting angiomotin induces an antibody response which alters tumor vessel permeability and hampers the growth of established tumors. Angiogenesis. 2012;15:305-316
9. Levchenko T, Veitonmäki N, Lundkvist A. et al. Therapeutic antibodies targeting angiomotin inhibit angiogenesis in vivo. FASEB J. 2008;22:880-889
10. Lv M, Shen Y, Yang J. et al. Angiomotin family members: Oncogenes or tumor suppressors? Int J Biol Sci. 2017;13:772-781
11. Troyanovsky B, Levchenko T, Månsson G, Matvijenko O, Holmgren L. Angiomotin: an angiostatin binding protein that regulates endothelial cell migration and tube formation. J Cell Biol. 2001;152:1247-1254
12. Stalin J, Harhouri K, Hubert L. et al. Soluble melanoma cell adhesion molecule (sMCAM/sCD146) promotes angiogenic effects on endothelial progenitor cells through angiomotin. J Biol Chem. 2013;288:8991-9000
13. Bardin N, Francès V, Combes V, Sampol J, Dignat-George F. CD146: Biosynthesis and production of a soluble form in human cultured endothelial cells. FEBS Lett. 1998;421:12-14
14. Bardin N, Moal V, Anfosso F. et al. Soluble CD146, a novel endothelial marker, is increased in physiopathological settings linked to endothelial junctional alteration. Thromb Haemost. 2003;90:915-920
15. Harhouri K, Kebir A, Guillet B. et al. Soluble CD146 displays angiogenic properties and promotes neovascularization in experimental hind-limb ischemia. Blood. 2010;115:3843-3851
16. Stalin J, Nollet M, Garigue P. et al. Targeting soluble CD146 with a neutralizing antibody inhibits vascularization, growth and survival of CD146-positive tumors. Oncogene. 2016;35:5489-5500
17. Arrigo M, Truong QA, Onat D. et al. Soluble CD146 is a novel marker of systemic congestion in heart failure patients: an experimental mechanistic and transcardiac clinical study. Clin Chem. 2016;63:386-393
18. Gayat E, Caillard A, Laribi S. et al. Soluble CD146, a new endothelial biomarker of acutely decompensated heart failure. Int J Cardiol. 2015;199:241-247
19. Ito T, Tamura N, Okuda S. et al. Elevated serum levels of soluble CD146 in patients with systemic sclerosis. Clin Rheumatol. 2017;36:119-124
20. Kaspi E, Heim X, Granel B. et al. Identification of CD146 as a novel molecular actor involved in systemic sclerosis. J Allergy Clin Immunol. 2017;140:1448-1451
21. Kubena P, Arrigo M, Parenica J. et al. Plasma levels of soluble CD146 reflect the severity of pulmonary congestion better than brain natriuretic peptide in acute coronary syndrome. Ann Lab Med. 2016;36:300-305
22. Nomikou E, Alexopoulou A, Vasilieva L. et al. Soluble CD146, a novel endothelial marker, is related to the severity of liver disease. Scand J Gastroenterol. 2015;50:577-583
23. Qian YN, Luo YT, Duan HX. et al. Adhesion molecule CD146 and its soluble form correlate well with carotid atherosclerosis and plaque instability. CNS Neurosci Ther. 2014;20:438-445
24. Dogansen S, Helvaci A, Adas M, Onal S. The relationship between early atherosclerosis and endothelial dysfunction in type 1 diabetic patients as evidenced by measurement of carotid intima-media thickness and soluble CD146 levels: a cross sectional study. Cardiovasc Diabetol. 2013;12:153
25. Bardin N, Blot-Chabaud M, Despoix N. et al. CD146 and its soluble form regulate monocyte transendothelial migration. Arterioscler Thromb Vasc Biol. 2009;29:746-753
26. Hamada Y, Gonda K, Takeda M. et al. In vivo imaging of the molecular distribution of the VEGF receptor during angiogenesis in a mouse model of ischemia In vivo imaging of the molecular distribution of the VEGF receptor during angiogenesis in a mouse model of ischemia. Blood. 2011;118:93-101
27. Wu H, Liu Y-H, Wang G-D. et al. Identifying molecular signatures of hypoxia adaptation from sex chromosomes: A case for Tibetan Mastiff based on analyses of X chromosome. Sci Rep. 2016;6:35004
28. Chen Y-C, Chen K-D, Su M-C. et al. Genome-wide gene expression array identifies novel genes related to disease severity and excessive daytime sleepiness in patients with obstructive sleep apnea. PLoS One. 2017;12:e0176575
29. Ernkvist M, Birot O, Sinha I. et al. Differential roles of p80- and p130-angiomotin in the switch between migration and stabilization of endothelial cells. Biochim Biophys Acta - Mol Cell Res. 2008;1783:429-437
30. Ernkvist M, Aase K, Ukomadu C. et al. p130-Angiomotin associates to actin and controls endothelial cell shape. FEBS J. 2006;273:2000-2011
31. Bardin N, Anfosso F, Massé JM. et al. Identification of CD146 as a component of the endothelial junction involved in the control of cell-cell cohesion. Blood. 2001;98:3677-3684
32. Love C, Tomas MB, Tronco GG, Palestro CJ. FDG PET of infection. Radiographics. 2005;25:1357-1368
33. Hua J, Dobrucki LW, Sadeghi MM. et al. Noninvasive imaging of angiogenesis with a 99mTc-labeled peptide targeted at αvβ3 integrin after murine hindlimb ischemia. Circulation. 2005;111:3255-3260
34. Lee KH, Jung KH, Song SH. et al. Radiolabeled RGD uptake and alphav integrin expression is enhanced in ischemic murine hindlimbs. J Nucl Med. 2005;46:472-478
35. Jeong JM, Hong MK, Chang YS. et al. Preparation of a promising angiogenesis PET imaging agent: 68Ga-labeled c(RGDyK)-isothiocyanatobenzyl-1,4,7-triazacyclononane-1,4,7-triacetic acid and feasibility studies in mice. J Nucl Med. 2008;49:830-836
36. Willmann JK, Chen K, Wang H. et al. Monitoring of the biological response to murine hindlimb ischemia with 64Cu-labeled vascular endothelial growth factor-121 positron emission tomography. Circulation. 2008;117:915-922
37. Ferreira CA, Hernandez R, Yang Y, Valdovinos HF, Engle JW, Cai W. ImmunoPET of CD146 in a murine hindlimb ischemia model. Mol Pharm. 2018;15:3434-3441
38. Orbay H, Hong H, Koch JM. et al. Pravastatin stimulates angiogenesis in a murine hindlimb ischemia model: a positron emission tomography imaging study with (64)Cu-NOTA-TRC105. Am J Transl Res. 2013;6:54-63
Author contact
![]() Corresponding authors: Pr Benjamin Guillet. C2VN, Laboratoire de Pharmacodynamie, Faculté de Pharmacie, 27 boulevard Jean Moulin, 13385 Marseille, France. Tel: +33 (0)622919144. Email: benjamin.guilletfr; Dr Anais Moyon (Resident). C2VN, Laboratoire de Pharmacodynamie, Faculté de Pharmacie, 27 boulevard Jean Moulin, 13385 Marseille, France. Tel: +33 (0)658221916. Email: anais.moyonfr
Corresponding authors: Pr Benjamin Guillet. C2VN, Laboratoire de Pharmacodynamie, Faculté de Pharmacie, 27 boulevard Jean Moulin, 13385 Marseille, France. Tel: +33 (0)622919144. Email: benjamin.guilletfr; Dr Anais Moyon (Resident). C2VN, Laboratoire de Pharmacodynamie, Faculté de Pharmacie, 27 boulevard Jean Moulin, 13385 Marseille, France. Tel: +33 (0)658221916. Email: anais.moyonfr