Impact Factor
- Issue 14; 2026
- Issue 13; 2026
- Issue 12; 2026
- Issue 11; 2026
- Issue 10; 2026
- Volume 16; 2026
- Advance Articles
- Past Issues
- Cover Images
- Cover Suggestion
- Index & Coverage
- Special Issues
Introduction
Methods
Results
Discussion
Abbreviations
Acknowledgements
Supplementary Material
References
International Journal of Biological Sciences
International Journal of Medical Sciences
 Global reach, higher impact

Theranostics 2018; 8(19):5289-5306. doi:10.7150/thno.28228 This issue Cite
Research Paper
MICAL2 Mediates p53 Ubiquitin Degradation through Oxidating p53 Methionine 40 and 160 and Promotes Colorectal Cancer Malignance
Jinping Lu1,3*, Yuejin Li1*, Yuanzhong Wu2,*, Shan Zhou1, Chaojun Duan1, Zigang Dong4, Tiebang Kang2 ![]() , Faqing Tang1,3
, Faqing Tang1,3 ![]()
1. Department of Clinical Laboratory, Hunan Cancer Hospital & the Affiliated Cancer Hospital of Xiangya School of Medicine, Central South University, 410013, Changsha, China
2. State Key Laboratory of Oncology in South China and Department of Experimental Research, Sun Yat-sen University Cancer Center, Guangzhou 510060, Guangdong, China
3. Department of Clinical Laboratory and Medical Research Center, Zhuhai Hospital, Jinan University, Zhuhai 519000, Guangdong, China
4. Hormel Institute, University of Minnesota, 801 16th Avenue NE, Austin, MN 55912
*Lu J, Li Y, and Wu Y contributed equally to this work.
Received 2018-7-1; Accepted 2018-9-17; Published 2018-10-22
Abstract

Molecule interacting with CasL2 (MICAL2), a microtubule-associated monooxygenase, is highly expressed in various cancers and is involved in cancer pathogenesis, but the mechanisms underlying its regulation in carcinogenesis are unclear. In this study, we aim to clarify the mechanism by which MICAL2 participates in colorectal cancer (CRC) and identify novel markers for predicting prognosis of CRC patients.
Methods: The value of MICAL2 in CRC prognosis was determined by immunohistochemical analysis of a CRC biopsy array. A short hairpin RNA target MICAL2 (shMICAL2) was designed to knock down MICAL2 expression and observe MICAL2's function on CRC cell growth. mRNA expression array was used to screen target molecules of MICAL2. HCT116 p53+/+ and HCT116 p53-/- cells were used to confirm whether MICAL2 exerts its oncogenic effect through p53. The in vivo effect of MICAL2 on CRC growth was assessed by subcutaneously injecting MICAL2-knockout CRC cells into the dorsal flank of each mouse. Immunofluorescence was used to observe the effect of MICAL2 on p53 cellular location. Reverse-phase nano ESI-LCMS analysis was used to investigate if MICAL2 mediates p53 oxidation.
Results: MICAL2 was found to be highly expressed in CRC tissues, and its expression was associated with CRC carcinogenesis and poor patient outcome. MICAL2-knockdown decreased growth and colony formation of CRC cells, which was linked with cell cycle arrest and apoptosis. MICAL2 physically interacted with p53 and retained p53 in the cytoplasm. MICAL2 shortened the half-life of p53, and ectopic MICAL2 expression decreased p53 protein stability through ubiquitin degradation. MICAL2 was also found to oxidize p53 at methionine 40 and 160, which mediated p53 ubiquitin degradation. MICAL2-promoted CRC growth in vivo was confirmed in nude mice.
Conclusion: MICAL2 binds to p53, retains p53 in the cytoplasm and oxidizes it at Met 40 and 160, promotes p53 ubiquitination, and decreases p53 function. MICAL2-reduced p53 promotes CRC development.
Keywords: MICAL2, colorectal cancer, p53, oxidation, ubiquitin, tumorigenesis
Introduction
Colorectal cancer (CRC) is one of the most common malignancies worldwide, with approximately 1.2 million new cases and 608,700 deaths every year [1]. It is one of the major causes of cancer-related death, and the third most commonly diagnosed cancer in men and the second most commonly diagnosed cancer in women [2]. Various factors are involved in CRC incidence. Sporadic CRCs are caused by somatic mutations, and account for approximately 75% of all CRCs. Hereditary CRCs are by germline-inactivating mutations in oncogenes or tumor suppressor genes, and familial CRCs are caused by minor variant or single nucleotide polymorphisms genes [3-6]. CRC development is characterized by an 'adenoma-carcinoma sequence'. Overexpression of specific oncogenes and/or low expression of tumor suppressor genes in the epithelium result in the formation of a hyperproliferative mucosa, produce a benign adenoma, and eventually form a carcinoma [7-9]. This process is orchestrated by different proteins, such as Wnt, bone morphogenetic protein (BMP) and transforming growth factor (TGF)-β, along with the extracellular matrix and stromal cells that form cell niches [10]. Alterations to molecular pathways, such as Wnt, RAS/MAPK, PI3K, TGF-β, NF-κB pathways and DNA mismatch repair (MMR) genes are involved in CRC onset. These alterations are responsible for colorectal epithelium carcinogenesis, which evenly confer individual susceptibility to cancers when they are germlines [6, 11, 12].
Molecules interacting with CasL (MICALs) are an evolutionary conserved family of multidomain signaling proteins that includes MICAL1, MICAL2 and MICAL3 [13, 14]. In addition to MICALs, MICAL-like protein (MICAL-Ls) and MICAL2 prostate cancer variants (MICAL2-PV) have also been identified [15]. Recent studies have suggested that MICALs regulate actin cytoskeleton dynamics [16, 17]. MICALs have a unique structure containing a N-terminal flavoprotein mono-oxygenase (MO) domain [18, 19] with other protein-protein interaction modules that network with cytoskeletal and signaling partners [13, 14].
MICAL2 is highly expressed in bladder cancer, and is involved in its pathogenesis[20]. MICAL2 is suggested to be an important regulator of epithelial- to-mesenchymal transition and therefore is a promising target for anti-metastatic therapy [21]. MICAL2 promotes breast cancer cell migration through maintaining epidermal growth factor receptor (EGFR) stability and activating EGFR/P38 signaling [22]. MICAL2-PV is involved in prostate cancer progression, and is suggested to be a novel molecular marker and/or target for treating prostate cancers with a high Gleason score [15]. In the present study, we found that MICAL2 is highly expressed in CRC tissues and cells, and its expression was associated with CRC carcinogenesis and poor patient outcome. Further experiments showed that MICAL2 increases CRC cell growth in vitro and in vivo; mechanistically, MICAL2 induces p53 oxidation and ubiquitin degradation.
Methods
All procedures were consistent with the National Institutes of Health Guide and approved by the institutional board with patients' written consent. This study was evaluated and approved by the Ethics Committee of the Affiliated Cancer Hospital of Central South University.
Reagents and antibodies
Chemical reagents for molecular biology were purchased from Sigma-Aldrich (St. Louis, MO). Dulbecco's modified Eagle medium (DMEM) and other supplements were obtained from Life Technologies (Rockville, MD). Antibodies against MICAL2, p53, urine double minute 2 (MDM2), and cyclin-dependent kinase inhibitor 1A (CDKN1A) were purchased from Abnova Company (Shanghai, China). Antibodies against GAPDH, HA and Flag were purchased from Santa Cruz Biotechnology, Inc. (Santa Cruz, CA) and Cell Signal Technology, Inc. (Beverly, MA).
Tissue microarray and immunohistochemical staining
Human tissue microarrays (T14-659) containing 90 pairs of CRC and corresponding adjacent non-tumor tissues were purchased from Outdo Biotech Company (Shanghai, China). 90 patients enrolled in this study with 54 males and 36 females. The median age of the patients was 48.5 years (range 36-78) with 20 patients < 50 years and 51 patients > 50 years. The tumor histology and stages were classified according to the WHO classification and the TNM staging system of the UICC, respectively. 31 patients were T1-T2 stages and 59 patients were T3-T4 stages. 34 patients were N0 stage and 56 patients were N1-N3 stages. 37 patients were M0 stage and 57 patients were M1 stage. The array tissues were stained with MICAL2 antibody (dilution 1:600) as described previously [23]. The stained tissue microarrays were evaluated independently by two pathologists who were blinded to the clinical features and clinical outcome. Immunohistochemical staining for MICAL2 was quantified using the German semiquantitative scoring system. Immunoreactive score (IRS) was determined using the product of the extent score and the staining intensity score.
Cell lines and cell culture
CRC cell lines, HCT116 p53+/+, HCT116 p53-/- and SW480, and HEK293T (an embryonic kidney cell line 293T) were obtained from American Type Culture Collection (Maryland). All the cell lines were grown in DMEM supplemented with 10% fetal bovine serum (FBS) at 37 °C and in 5% CO2.
Plasmids construction
MICAL2 DNA fragment was generated by polymerase chain reaction (PCR) and cloned into pcDNA3.1 containing a FLAG, HA or V5 tag sequence. MICAL2 mutations were generated using Quik-Change Site-Directed Mutagenesis Kit (Stratagene, California), and all the mutations were verified by sequencing. PCR primers used are listed in Table S1. Plasmid (pLVX-sh) expressing shMICAL2 (short hairpin RNA target MICAL2) was obtained from GenePharma (Shanghai, China). shMICAL2 sequence is shown in Table S2. pLVX-shscramble served as the control. p53 plasmid and its mutations were constructed according to our methods described previously [24]. HA-tagged ubiquitin was gifted by Dr Helen Piwnica-Worms (Washington University, St. Louis).
Gene transfection and stable cell transfection
Gene transfection and stable cell line establishment were performed as described previously [25]. Briefly, 1×10⁴ cells of HCT116, SW480, HCT116 p53+/+, and HCT116 p53-/- cell lines were transfected with 2 μg DNA of pLVX-shMICAL2#1, pLVX-shMICAL2#2 or pLVX-shscramble following the manufacturer's suggested protocol. pLVX-shscramble served as a control. The stably transfected cell lines, HCT116-shMICAL2#1, HCT116-shMICAL2#2, HCT116-shcramble, SW480-shMICAL2#1, SW480-shMICAL2#2, and SW480-shcramble were obtained by selection, and further confirmed by assessing MICAL2 expression.
Western blotting and immunoprecipitation
Western blotting and immunoprecipitation were performed as described previously [25]. Briefly, 1×10⁶ cells were lysed with lysis buffer (50 mM Tris, pH 7.4, 150 mM NaCl, 1 mM ethylenediaminetetraacetic acid (EDTA), 1% Nonidet P-40, 0.1% sodium dodecyl sulfate (SDS) and protease inhibitors). Cell lysates obtained were centrifuged, and protein concentration of the clarified lysates was measured. 40 μg supernatant protein was subjected to Western blotting. The clarified supernatants were immunoprecipitated using anti-FLAG-agarose or anti-HA-agarose antibody (Sigma Chemical Co.). MICAL2 or p53 in the immunoprecipitated complexes were respectively determined by Western blotting with anti-MICAL2 or anti-p53 antibody.
MTT and colony formation assays
Cell growth was determined by performing MTT assays as described previously [26]. Briefly, MICAL2-knockdown HCT116, MICAL2-knockdown SW480, MICAL2-knockdown HCT116 p53+/+, and MICAL2-knockdown HCT116 p53-/- cells (1×10³) were seeded in 96-well microplates. The cells were cultured for the indicted time, followed by incubation with MTT for 4 h. Optical density (OD) was determined at 490 nm using a microplate reader. Measurements were acquired once per day for 5 and 6 d. For the colony-formation assay, the cells were plated at a density of 500 cells/well in six-well plates, and were cultured for 12 d. Colonies were fixed in methanol, stained with 0.5% gentian violet, and counted. Results are presented as mean ± SD of three independent experiments.
Real-time PCR
Total RNA of 1×10⁶ cells of MICAL2-knockdown HCT116 or MICAL2-knockdown SW480 was extracted using Trizol reagent (Life Technologies) following the manufacturer's instructions. 1 μg DNase-treated RNA was reverse transcribed using Revert AidTM First-Strand cDNA Synthesis Kit (MBI Fermentas, USA) according to the manufacturer's instructions. The threshold cycle (Ct) value of each sample was determined using Platinum SYBR Green qPCR SuperMix-UDG with ROX (Invitrogen) in ABI 7900HT Real-Time PCR System (Applied Biosystems, Foster City, CA). Sequences of primers used are shown in Table S3. Relative mRNA expression of each target gene was normalized to the expression of the housekeeping gene GAPDH. Relative mRNA level was calculated as two power values of ΔCt (Ct value of GAPDH Ct of target gene).
mRNA expression array analysis
Total RNAs in MICAL2-knockdown HCT116 cells were extracted using Trizol reagent (Life Technologies) according to the manufacturer's instructions, RIN was determined to assess RNA integrity. Qualified total RNA was purified using RNeasy mini kit (QIAGEN) and RNase-free DNase Set (QIAGEN), and was amplified and labeled using Low Input Quick Amp Labling Kit (Agilent technologies) according to the manufacturer's instructions. Each slide was hybridized with Cy3-labled cRNA using Gene Expression Hybridization Kit (Agilent Technologies) according to the manufacturer's instructions. After hybridization, the slides were washed with Gene Expression Wash Buffer Kit (Agilent Technologies) in staining dishes (Thermo, Shandong) according to the manufacturer's instructions. Hybridization data were extracted using Feature Extraction 10.7 software (Agilent technologies). Raw data were normalized using quantile algorithm available in GeneSpring Software 12.6.1 (Agilent technologies). Experimental and control data were compared to identify genes that were significantly differentially expressed with a selection threshold of flag >7 and fold change >1.5. Results of this calculation were sorted. Gene Ontology (GO) analysis and Kyoto Encyclopedia of Genes and Genomes (KEGG) analysis were used to analyze the different genes.
Tumor growth assays in vivo
In vivo tumor growth assays were performed as described previously[27]. Briefly, female BABL/c athymic nude mice (age 4 weeks) were obtained from an animal center of Guangdong Province (Guangzhou, China). All animal experiments were performed according to the National Institutes of Health Animal Use Guidelines on the Use of Experimental Animals. The nude mice were subcutaneously injected with 2×10⁶ cells of shMICAL2#1-HCT116p53+/+, shMICAL2#2-HCT116p53+/+, shMICAL2#1-HCT116p53-/-, and shMICAL2#2-HCT116p53-/- cell lines, 6 mice per group. Tumor size was measured every 2 or 3 days, and tumor volume was estimated. After 17 days, the mice were euthanized, and the tumors were removed and weighed.
Cell synchronization and flow cytometry analysis
The transfected cells (1×10⁴) were seeded on 6-well plates at 30% confluence and synchronized at the G1/S boundary by double thymidine. After being treated with 2 mM thymidine for 16 h, the treated cells were released in fresh medium containing 10% fetal bovine serum (FBS) for 9 h and incubated with 2 mM thymidine for another 16 h. At this point, approximately 90% of the cells were synchronized at G1/S boundary and then released a second time, and cells were collected cells at 0 and 2 h time points. Cycle profiles of the transfected cells were analyzed by flow cytometry. 1×10⁴ of the transfected cells were treated with 5-fluorouracil (5-FU) at 10 μg/mL and then stained with annexin V-EGFP (Enhanced Green Fluorescent Protein) and propidium iodide (KeyGen Biotec). The stained cells were analyzed by flow cytometry.
Immunofluorescence analysis
Immunofluorescence analysis was performed as described previously [28]. 1×10³ of the cells transfected with various plasmids were fixed with 2.0% formaldehyde in PBS for 30 min, washed three times with PBS, and then treated with PBS containing 0.2% Triton X-100 for 10 min. After being washed three times with PBS, the cells were incubated with 0.5% bovine serum albumin (BSA) in PBS. The cells were washed three times with PBS, stained with 5 μg/mL HA- or Flag-antibody (Sigma-Aldrich) for 40 min to detect p53 or MICAL2 respectively, and then examined under a Zeiss Axiophot microscope (Carl Zeiss, Oberkochen, Germany) [28]. 10 fields (about 1000 cells) per group were observed under a microscope. Cells stained with Hochest served as a nucleus control.
Cytoplasmic and nuclear protein extraction
1×10⁷ of the cells transfected with the indicated plasmids were rinsed three times with ice-cold PBS before being lysed with 400 μL lysis buffer. Lysates were kept on ice for 10 min during which they were vibrated 30 s every 5 min. Insoluble material was pelleted at 12,000 ×g for 10 min at 4 °C. Nuclear proteins were extracted following the protocol of a nuclear protein extraction kit (Sangon Biotech). Subcellular fractions of tissues were extracted by Subcellular Proteome Extraction Kit (Merck Millipore). Protein concentration was measured by the Enhanced BCA Protein Assay Kit (Beyotime Biotechnology). The protein samples were subjected to Western-blotting with p53- or MICAL2-antibody.
Protein half-life detection
Protein half-life was determined as described previously [29]. Briefly, 1×10⁶ cells of shscramble-HCT116, shMICAL2#1-HCT116, and shMICAL2#1-HCT116 were treated with indicated concentrations of cycloheximide (CHX), and the cells treated with 10 mg/mL CHX were collected at indicated time points after treatment. 40 μg protein of the treated cells was extracted for performing Western blotting with anti-MICAL2 or anti-p53 antibody. GAPDH was used as an internal control to verify basal level expression and equal protein loading. The abundance ratio to GAPDH was counted. The half-life time of the proteins was calculated.
Ubiquitination assay
In vivo ubiquitination assay was performed as described previously [29, 30]. Briefly, 2×10⁶ cells of HEK293T were transfected with 2 μg DNA of shMICAL2 plasmid. After transfection, the cells were cotransfected with 2 μg 3Flag-p53 and HA-ubiquitin. The transfected cells were lysed in 400 μL lysis buffer. The cell lysates were centrifuged. 100 μg protein of the supernatants was immunoprecipitated with anti-Flag agarose, and 20 μg protein of the immunocomplexes was immunoblotted using anti-HA antibody.
Reverse-phase nano ESI-LCMS analysis and methionine oxidation analysis
1×10⁶ of the transfected cells were lysed in lysis buffer, and 100 μg protein of the clarified lysates was immunoprecipitated with anti-FLAG agarose. 40 μg of the immunoprecipitated proteins was separated on polyacrylamide gel and stained with 0.4% Coomassie brilliant blue. The protein bands on polyacrylamide gel were excised, destained with 50 mM ammonium bicarbonate/acetonitrile, alkylated with iodoacetamide, and dried in a Speedvac. The dried gel spots were rehydrated in a grade porcine trypsin solution (20 µg/mL in 25 mM NH4HCO3) and the rehydrated complexes were centrifuged. Supernatants were harvested, and the gels were extracted with extraction buffer (67% acetonitrile containing 1% trifluoroacetic acid). The extracts and supernatants were combined and completely dried. The dried tryptic peptide samples were resuspended in water containing 0.1% formic acid and 2% acetonitrile, and then were analyzed by TripleTOF 5600 mass spectrometry with a EksigentNano LC-Ultra 1D plus system and nanoelectrospray ionization tandem mass spectrometry. Mass spectra were acquired in Information Dependent Acquisition mode. Survey scan of TOF-MS was acquired at 250 ms, and MS/MS spectra were acquired in high sensitivity mode with an accumulation time of 80 ms/spectra. MS/MS data were analyzed for protein identification and quantification using ProteinPilot Software v.4.5 (AB SciexInc., USA). Local false discovery rate was estimated as 1.0% using the integrated PSPEP tool in the ProteinPilot Software after searching against the Uniprot-human proteome set database. Search parameters included trypsin digestion, fixed modification of cysteine with iodoacetamide, and variable modification of methionine (Met) through searching mode [31].
Results
MICAL2 is highly expressed in CRC and is associated with poor patient outcome
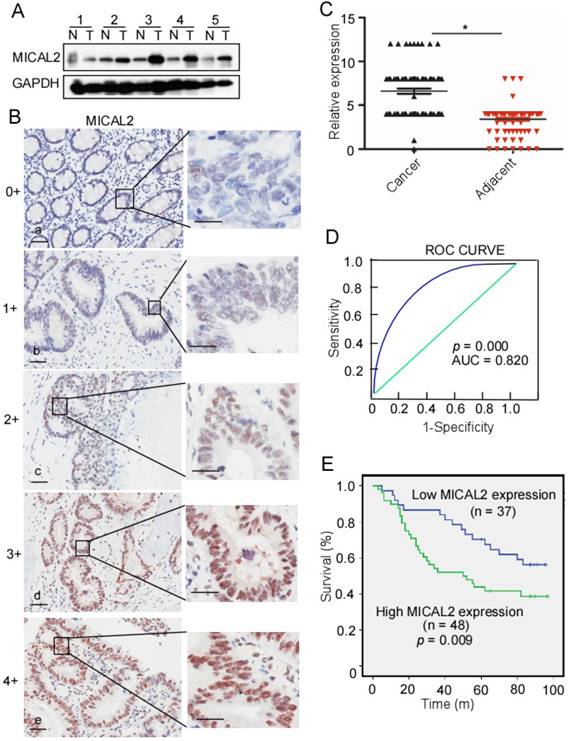
To detect MICAL2 expression in CRC, we collected five pairs of fresh tissues including CRC and adjacent non-tumor tissue specimens, and examined MICAL2 expression using Western blotting. Compared with the non-tumor tissue, MICAL2 protein levels were mostly elevated in CRC tissues (4 out of 5 tissues; Figure 1A), indicating that MICAL2 is highly expressed in CRC. To confirm this finding, MICAL2 expression in a tissue microarray containing 90 pairs of CRC and adjacent non-tumor tissues was detected using immunohistochemistry. The immunohistochemical analysis showed that MICAL2 was significantly high in CRC tissues compared with the matched adjacent normal tissues (Figure 1B-C, p = 0.023). The positive rates of MICAL2 expression were compared in normal colorectal tissues, primary CRC, and metastatic CRC tissues. The positive rates of MICAL2 were 21.1% in normal tissues, 62.3 % in primary CRC and 54.1% in metastatic CRC tissues, respectively (Table 1). MICAL2 was significantly upregulated in primary CRC (Table 1, p = 0.038) and metastatic CRC tissues (Table 1, p = 0.029), whereas there was no difference in MICAL2 between primary CRC and metastatic CRC tissues. MICAL2 expression may be used for diagnosis, so the area under the curve (AUC) was calculated. The cut-off of MICAL2 was 4 (Figure 1D, AUC = 0.820, p = 0.000). Our results also showed that high MICAL2 was correlated with significantly shorter overall survival than low MICAL2 expression (Figure 1E, p = 0.009). Additionally, the association of MICAL2 expression with CRC stages was analyzed. MICAL2 expression was not correlated with T stage (original tumor size and nearby tissue invasion) (Table 2, p = 0.812), N stage (lymph node metastasis) (Table 2, p = 0.910), nor M stage (distant metastasis) (Table 2, p = 0.896). These data strongly suggest that high MICAL2 increased oncogenic potency and is associated with poor outcome.
MICAL2 expression in normal colorectal, primary CRC, and metastatic CRC tissues.
| MICAL2 | |||||
|---|---|---|---|---|---|
| n | - | + | % | p | |
| NC | 90 | 71 | 19 | 21.1 | |
| CRC | 53 | 22 | 33 | 62.3 | 0.038* |
| MCRC | 37 | 17 | 20 | 54.1 | 0.029# |
NC : normal colorectal tissue; CRC: primary CRC; MCRC: metastatic CRC tissues. *, CRC versus NC; #, MCRC versus NC.
MICAL2 expression in CRC and relationship with CRC patient outcome. (A) MICAL2 expression in five pairs of CRC tissues and their corresponding adjacent non-tumor tissues detected by performing Western blotting. T: CRC tissue; N: non-tumor tissue. (B) MICAL2 expression in CRC tissues microarray detected using immunohistochemistry (IHC). (a) negative, scored as 0; (b) weakly positive, scored as 1; (c) moderately positive, scored as 3; (c) positive, scored as 4; (e) strongly positive, scored as 5. (C) MICAL2 expression level was quantified using a German semiquantitative scoring system. Relative expressions in CRC tissues and non-tumor tissues were statistically analyzed using Mann-Whitney U test (*, p < 0.05). The dots represent scores. (D) The cut-off value of MICAL2 immunoreactive score is 4 according to the ROC curve, and the AUC is 0.820. ROC: receiver operating characteristic; AUC: area under the curve. (E) The overall survival of patients with CRC showing high or low MICAL2 expression.
MICAL2 expression in CRC samples at various clinical stages.
| Characteristic | Cases | MICAL2 expression | p | |
|---|---|---|---|---|
| low | high | |||
| All patients | ||||
| Gender | ||||
| Male | 54 | 25 (46.7%) | 29 (53.3%) | 0.997 |
| Female | 36 | 17 (47.2%) | 19 (52.8%) | |
| Age (y) | ||||
| < 50 | 29 | 14 (48.3%) | 15 (51.7%) | 0.970 |
| ≥ 50 | 51 | 25 (49.0%) | 26 (51.0%) | |
| T stage | ||||
| T1-T2 | 31 | 14 (45.2%) | 17 (54.8%) | 0.812 |
| T3-T4 | 59 | 24 (40.7%) | 35 (59.3%) | |
| N stage | ||||
| N0 | 34 | 12 (35.3%) | 22 (64.7%) | 0.910 |
| N1-N3 | 56 | 19 (33.9%) | 37 (66.1%) | |
| M stage | ||||
| M0 | 37 | 19 (51.4%) | 18 (48.6%) | 0.896 |
| M1 | 53 | 26 (49.1%) | 27 (50.9%) | |
T: original tumor size and nearby tissue invasion; N: lymph node metastasis; M: distant metastasis
Oncogenic properties of MICAL2 in CRC
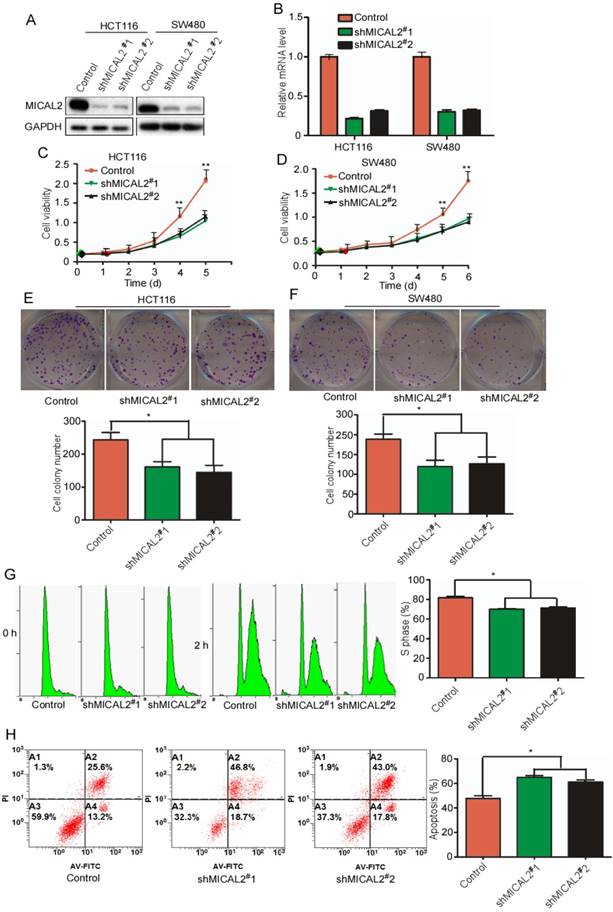
To determine MICAL2 functions in CRC, we generated two specific stable shRNA, namely, shMICAL2#1 and shMICAL2#2, for targeting MICAL2. CRC cell lines HCT116 and SW480 were infected with pLVX-shMICAL2#1 or pLVX-shMICAL2#2, and stable cell lines, HCT116-shMICAL2#1, HCT116-shMICAL2#2, SW480-shMICAL2#1, and SW480-shMICAL2#2 were established. Western blotting and real-time PCR were performed to evaluate the efficiency of shMICAL2#1 and shMICAL2#2 on MICAL2 gene. The results showed that shMICAL2#1 and #2 effectively blocked MICAL2 protein (Figure 2A) and mRNA expression (Figure 2B). To determine the effects of shMICAL2#1 and shMICAL2#2 on CRC cell growth, we determined the viabilities of the cells infected with shMICAL2#1 or shMICAL2#2 by performing MTT [3-(4,5-dimethyl-2-thiazolyl)-2,5-diphenyl-2-H-tetrazolium bromide] assay. MICAL2-knockdown supperssed the growth kinetics of HCT116 and SW480 cells (Figure 2C-D, p<0.01). Moreover, MICAL2-knockdown suppressed colony formation of HCT116 and SW480 cells (Figure 2E-F, p < 0.05). Next, we synchronized HCT116-shMICAL2#1 and HCT116-shMICAL2#2 with thymidine to determine cell cycle progression, and found that most of the cells were arrested in G1 phase. The percentage of HCT116 cells at S phase decreased in MICAL2-knockdown cells after release from thymidine for 2 h (Figure 2G, p<0.05), suggesting that MICAL2-knockdown supperssed G1/S transition. The inhibitory effect of MICAL2 on CRC cell apoptosis was measured by treating MICAL2-knockdown HCT116 cells with 5-FU. As expected, MICAL2-knockdown promoted the apoptosis of 5-FU-treated HCT116 cells (Figure 2F, p < 0.05). Therefore, we concluded that MICAL2 may be an oncogenic driver in CRCs.
MICAL2 knockdown decreases CRC cell growth and induces cell apoptosis. HCT116 and SW480 cells were transfected with shMICAL2#1 or shMICAL2#2. Shscramble RNA served as a control. (A) MICAL2 expression in the transfected cells was detected using Western blotting. (B) MICAL2 mRNA was detected using real-time PCR. (C) Viability of the transfected HCT116 cells was measured using MTT. (D) Viability of the transfected SW480 cells was measured. (E) Colony formation of the transfected HCT116 cells was detected using colony formation assay. (F) Colony formation of the transfected SW480 cells was detected. (G) The cells stably transfected with the indicated plasmids were synchronized at G1/S boundary by double thymidine, and then were released in fresh medium. Cell cycle profiles were analyzed by flow cytometry. (H) The stably transfected cells were treated with 5-fluorouracil (5-FU) and then stained with annexin V-EGFP (Enhanced Green Fluorescent Protein) and propidium iodide (KeyGen Biotec). The stained cells were analyzed by flow cytometry. All experiments were repeated three times. Data are presented as mean ± S.D. of three independent experiments and were statistically analyzed using Student's t-test. *, p < 0.05; **, p < 0.01.
MICAL2 regulates the expression of p53 target genes
The above results suggested that MICAL2 is associated with proliferation and apoptosis of CRC cells. We next investigated the mechanisms underlying MICAL2-regulated proliferation and apoptosis. We performed an unbiased gene array analysis to measure gene expression changes in MICAL2-knockdown cells. GO analysis showed that 120 and 227 genes were upregulated and downregulated, respectively, by >1.5-fold in MICAL2-knockdown HCT116 cells (Figure 3A). KEGG pathway analysis implied that p53 pathway was involved in the upregulation of 120 genes (Figure 3B). The down-stream genes of p53 transcriptional targets were CDKN1A, SERPINB5, SESN1, IGFBP3, and FAS. Further, mRNA transcripts of CDKN1A, SERPINB5, SESN1, IGFBP3, and FAS were detected using qRT-PCR. The data showed that CDKN1A, SERPINB5, SESN1, and FAS were increased in MICAL2-knockdown cells (Figure 3C, p < 0.01), while TP53 mRNA level did not change (Figure 3C). Simultaneously, we detected that the protein expressions of p53 and CDKN1A, p53 and CDKN1A were increased in MICAL2-knockdown cells (Figure 3Da-b).
mRNA expression array analysis of shMCIAL2#1 and p53 target gene expressions. (A-B) Total RNA in the stably transfected cells was extracted, amplified and labeled. Each slide was hybridized with the labeled cRNA. Hybridization data were extracted and analyzed. Experimental and control data were compared to identify genes that were significantly differentially expressed. (C) mRNA transcripts of CDKN1A, SERPINB5, SESN1, IGFBP3, and FAS in the transfected cells were detected using qRT-PCR. Relative mRNA expression of each target gene was normalized to the expression of the housekeeping gene GAPDH. Relative mRNA level was calculated as two power values of ΔCt (Ct value of GAPDH Ct of target gene CDKN1A, SERPINB5, SESN1, IGFBP3, and FAS). (D) HCT 116 and SW480 cells were transfected with shMICAL2#1 and 2, and then MICAL2, p53, and CDKN1A expressions were detected with Western blotting (a). The abundance ratio of MICAL2, p53, and CDKN1A to GAPDH were calculated (b). (E) HCT116 p53+/+ and HCT116 p53-/- cells were transfected with shMICAL2#1. The mRNA expressions of MICAL2, CDKNIA, SERPINB5, SESN1, IGFBP3 and FAS in HCT116 p53+/+-shMICAL2#1 (a) and HCT116 p53-/--shMICAL2#1 cells (b) were detected using real-time PCR. Relative mRNA expression was calculated using the 2-ΔΔCt method. (F) MICAL2, p53, and CDKN1A expressions in HCT116 p53+/+ and HCT116 p53-/- cells were detected with Western blotting (a). GAPDH served as a loading control; the abundance ratio to GAPDH was calculated (b). (G) HCT116 cells were treated with Doxorubicin at 1, 2 μM for 24 h (a), and treated at 1 μM for 16, 24 h (b). MICAL2 and p53 expressions were detected using Western blotting.
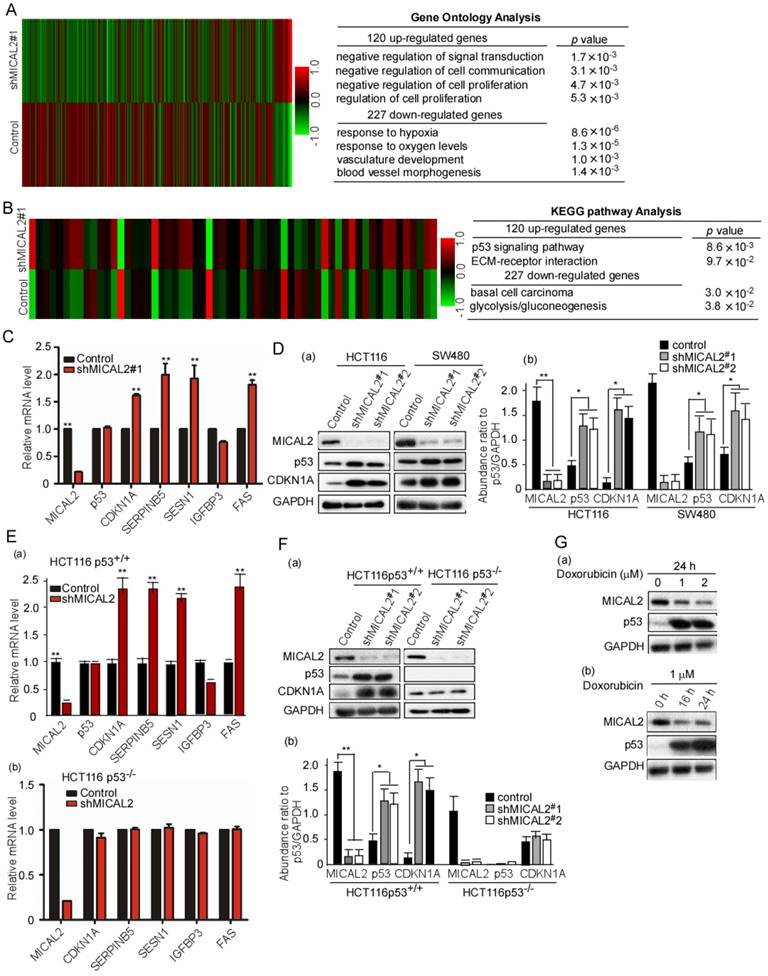
Next, we focused on MICAL2 regulation on p53 and its molecular mechanism. HCT116 p53+/+ and HCT116 p53-/- cells were used to determine whether MICAL2 regulates p53 transcriptional targets. We obtained consistent results in HCT116 p53+/+ cells as the above results: the mRNA expressions of CDKN1A, SERPINB5, SESN1, and FAS were increased with MICAL2-knockdown (Figure 3Ea, p < 0.01), but unchanged in HCT116 p53-/- cells (Figure 3Eb). Also, the protein expressions of p53 and CDKN1A were detected; p53 and CDKN1A were increased in HCT116 p53+/+ cells when MICAL2 was knocked down (Figure 3Fa-b, p < 0.05; p < 0.01), but not in HCT116 p53-/- cells (Figure 3Fa-b). This implied that MICAL2 downregulates p53 expression. Doxorubicin is a DNA damaging agent that has been documented to induce p53 expression. To further confirm the relationship between MICAL2 and p53 expression, we used doxorubicin to induce p53 expression, and observed MICAL2 expression. In the experiments of doxorubicin-induced DNA damage, p53 expression was increased, but MICAL2 expression was decreased (Figure 3Ga-b). These results showed that MICAL2 expression is negatively associated with p53 expression.
MICAL2 exerts tumor-promoting effects through p53
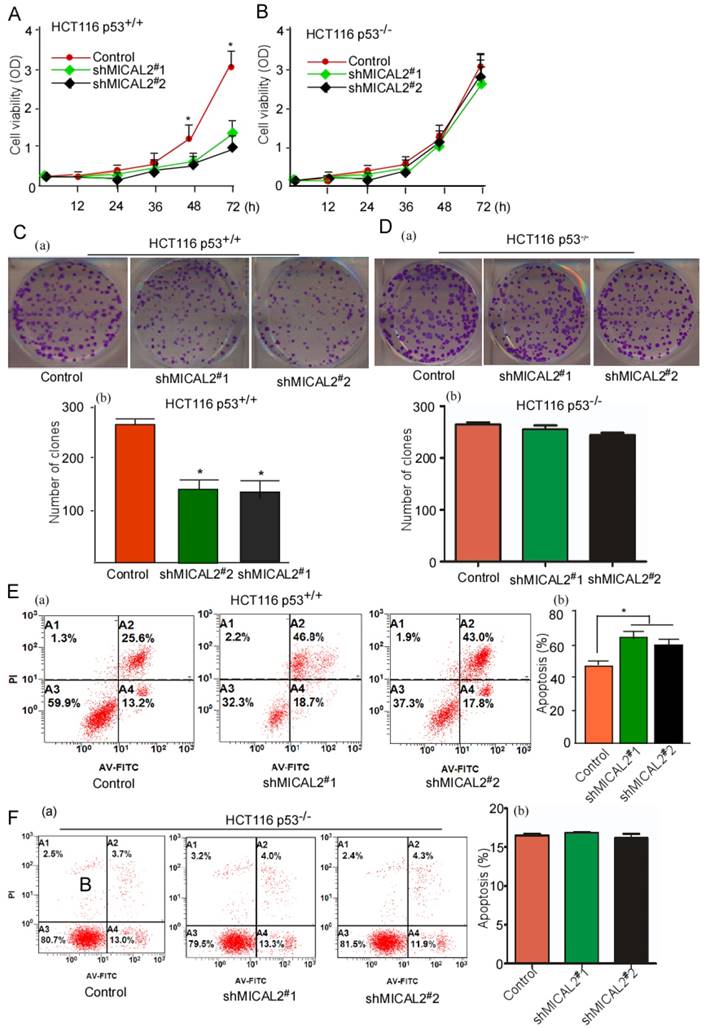
We used HCT116 p53+/+ and HCT116 p53-/- cells to determine whether p53 gene is essential for the oncogenic role of MICAL2. Cell growth and colony formation were tested in HCT116 p53+/+ and HCT116 p53-/- cells with MICAL2-knockdown. MICAL2-knockdown deceased the cell growth kinetics (Figure 4A, p < 0.05) and colony formation (Figure 4C, p < 0.05) in HCT116 p53+/+ cells, but not in HCT116 p53-/- cells (Figure 4B, D). These data suggested that MICAL2-promoted cell proliferation and colony formation is associated with p53. Simultaneously, apoptosis in MICAL2-knockdown cells was also detected; there was no difference (data not shown). So, 5-FU was used to treat MICAL2-knockdown cells, and cell apoptosis was detected. The data showed that apoptosis was increased in HCT116 p53+/+ cells when MICAL2 was knocked down (Figure 4E, p < 0.05), while in HCT116 p53-/- cells, there was no difference in apoptosis between MICAL2-knockdown and control (Figure 4F). This result showed that MICAL2 mediates cell apoptosis inhibition through p53.
MICAL2 exerts tumor-promoting effects in vitro through p53. MICAL2 in HCT116 p53+/+ and HCT116 p53-/- cells was knocked down using shMICAL2#1 or shMICAL2#2. ShMICAL2 stably expressing HCT116 p53+/+ and HCT116 p53-/- cell lines were obtained. Viabilities of shMICAL2-HCT116p53+/+ (A) and shMICAL2-HCT116p53-/- cells (B) were detected using MTT assay. (C) Colony formations of shMICAL2-HCT116p53+/+ were measured using cell colony formation assay (a). The number of colonies was calculated (b). (D) Colony formations of shMICAL2- HCT116p53-/- were measured using cell colony formation assay (a). The number of colonies was calculated (b). (E) shMICAL2-HCT116p53+/+ cells were treated with 5-FU. (F) shMICAL2-HCT116p53-/- cells were treated with 5-FU. The treated cells were analyzed using flow cytometry (a), and the percentage of apoptotic cells was calculated (b). Data are presented as mean ± S.D. of three independent experiments and statistically analyzed using Student's t-test. *, p < 0.05.
MICAL2 knockdown suppresses tumor growth through p53 in vivo
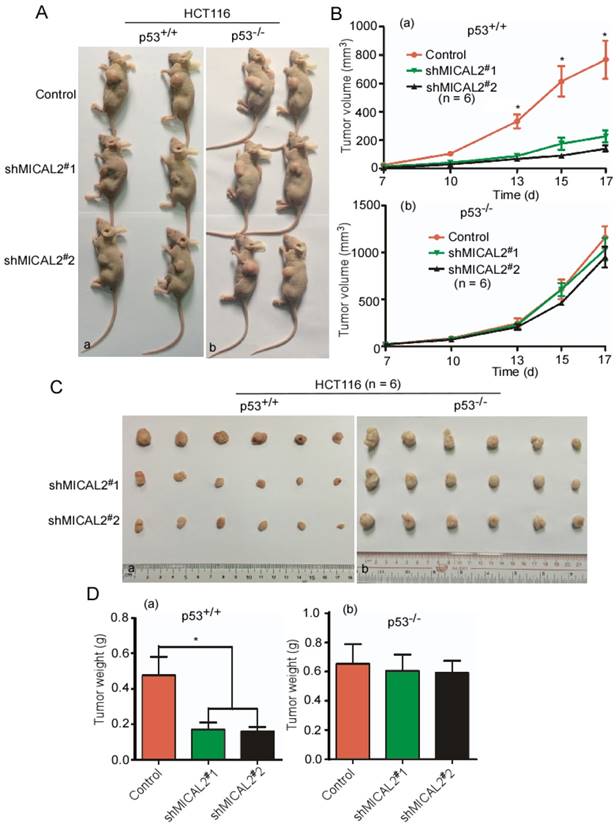
To confirm whether MICAL2 exerts its oncogenic effect through p53 in vivo, shMICAL2#1-HCT116p53+/+, shMICAL2#2-HCT116p53+/+, shMICAL2#1-HCT116p53-/-, and shMICAL2#2-HCT116p53-/- cells were subcutaneously injected into the dorsal flanks of mice. Shscramble-HCT116p53+/+ and -HCT116p53-/- served as the controls. After 17 days, the mice were euthanized, and tumor sizes and tumor weights were measured. Data showed that tumors of mice injected with MICAL2-knockdown HCT116 p53+/+ cells were smaller than those of the control mice (Figure 5Aa). However, tumors of mice injected with MICAL2-knockdown HCT116 p53-/- cells showed no significant difference compared with the control mice (Figure 5Ab). Consistently, the growth curve of xenografts indicated that tumors of mice injected with MICAL2-knockdown HCT116p53+/+ more slowly grew than those of the control mice (Figure 5Ba, p < 0.05). In contrast, the tumor growth kinetics of mice injected with HCT116 p53-/- cells were no different from those of controls (Figure 5Bb). Tumors of mice injected with MICAL2-knockdown HCT116 p53+/+ cells were lighter than those of control mice (Figure 5C-Da, p < 0.05). No difference was observed in tumor weights of mice injected with MICAL2-knockdown HCT116 p53-/- cells and controls (Figure 5C-Db).
MICAL2 exerts tumor-promoting effects in vivo through p53. HCT116 p53+/+ and HCT116 p53-/- cells were transfected with pLVX-shMICAL2#1 or pLVX-shMICAL2#2. pLVX-shcramble served as a control. The stable cell lines, shMICAL2#1-HCT116p53+/+ and shMICAL2#1-HCT116p53-/-, shMICAL2#2-HCT116p53+/+ and shMICAL2#2-HCT116p53-/- were established. (A) MICAL2-knocked down HCT116 p53+/+ (a) and HCT116 p53-/- cells (b) were subcutaneously injected into the dorsal flanks of mice. After 17 days, the mice were euthanized. Representative images are shown. (B) The tumor growth of MICAL2-knockdown HCT116 p53+/+ (a) and HCT116 p53-/- cells (b) in vivo was calculated by the increase of tumor volume. (C) After euthanization, the tumors of mice were removed. (D) The removed tumors were weighed. (a) HCT116 p53+/+ cells; (b) HCT116 p53-/- cells. *, p < 0.05.
MICAL2 interacts with p53
The above results suggested that MICAL2-knockdown increases p53 protein level, while p53 mRNA level did not change, indicating MICAL2 might regulate p53 at the post-transcriptional level. We first performed an endogenous immunoprecipitation assay to examine whether MICAL2 directly interacts with p53, and found that MICAL2-immunoprecipitated complexes contained p53, and p53 immunocomplexes contained MCIAL2 (Figure 6A). This suggested that MICAL2 interacts with p53. To confirm this interaction, exogenous Flag-MICAL2 and HA-p53 were co-transfected into HEK293T cells, and Flag or HA were respectively immunoprecipitated; the results showed that exogenous MICAL2 and p53 could also be co-immunoprecipitated reciprocally (Figure 6B-C).
MICAL2 interacts with p53. (A) Lysates of HEK293T cells were immunoprecipitated using anti-IgG, anti-MICAL2 or anti-p53 antibody, and immunoprecipitation products were analyzed by Western blotting with the indicated antibody. (B) HEK293T cells were transfected with the indicated plasmids, and were lysed with the lysis buffer. Immunoprecipitation was performed using anti-Flag antibody, and immunoprecipitation products were detected using Western blotting with the indicated antibody. (C) HEK293T cells were transfected with the indicated plasmids, and were lysed with the lysis buffer. Immunoprecipitation was performed using anti-HA antibody, and immunoprecipitation products were detected using Western blotting with the indicated antibody. (D) Schematic representation of p53 domains (a). HEK293T cells were co-transfected with Flag-MICAL2 and various p53 mutants as the indicated vectors, and the transfected cells were lysed with the lysis buffer and were analyzed using Western blotting (b). (E) Schematic representation of MICAL2 domains (a). HEK293T cells were co-transfected with HA-p53 and various MICAL2 mutants as the indicated vector and were analyzed using Western blotting (b). IP: immunoprecipitation; WCL: whole cell lysate; FL: full length MICAL2.
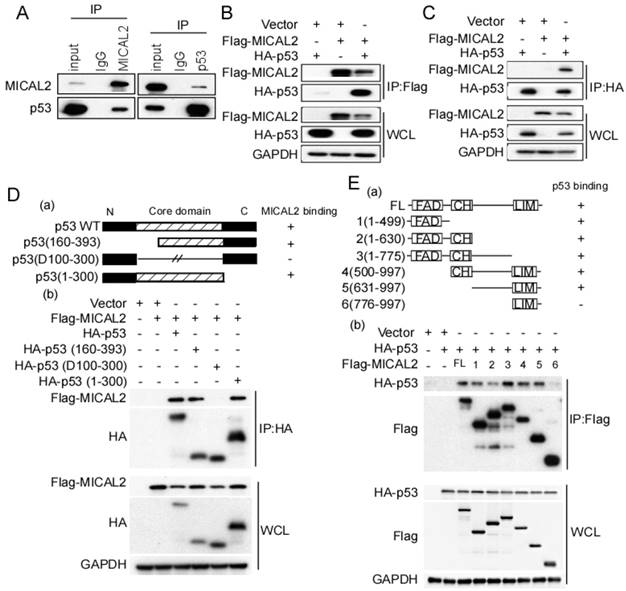
Next, we determined the domains of MICAL2 and p53 involved in this interaction using p53- and MICAL2-expressing plasmids. The plasmids expressing mutant p53 (Figure 6Da) or MICAL2 (Figure 6Ea) containing different domains were constructed. HEK293T cells were transfected with the indicated plasmids, and co-immunoprecipitation was performed to identify the interacting domains of MICAL2 and p53. The core domain of p53 (residues 100-300) was necessary and sufficient for binding to MICAL2 (Figure 6Db). Interestingly, except MICAL2 mutant containing LIM and C-terminal domains (residues 776-997; Figure 6Ea-b), all MICAL2 mutants interacted with p53 (Figure 6Eb). MICAL2 mutant (resides, 1-630) containing FAD and CH domain coprecipitated with p53 more weakly than other mutants (Figure 6Eb). MICAL2 mutants (1-775) containing MICAL2 domains except LIM domain displayed a strong interaction with p53. Moreover, MICAL2 mutant (776-997) containing LIM and C-terminal domains did not interact with p53 (Figure 6Eb). These findings indicated that FAD and CH domains of MICAL2 interact with p53. Since MICAL2 is thought to be a globular protein [18], multiple residues located across the region spanning FAD and LIM domains may interact with p53 rather than a specific linear chain of amino acids.
MICAL2 interacting with p53 remains in the cytoplasm
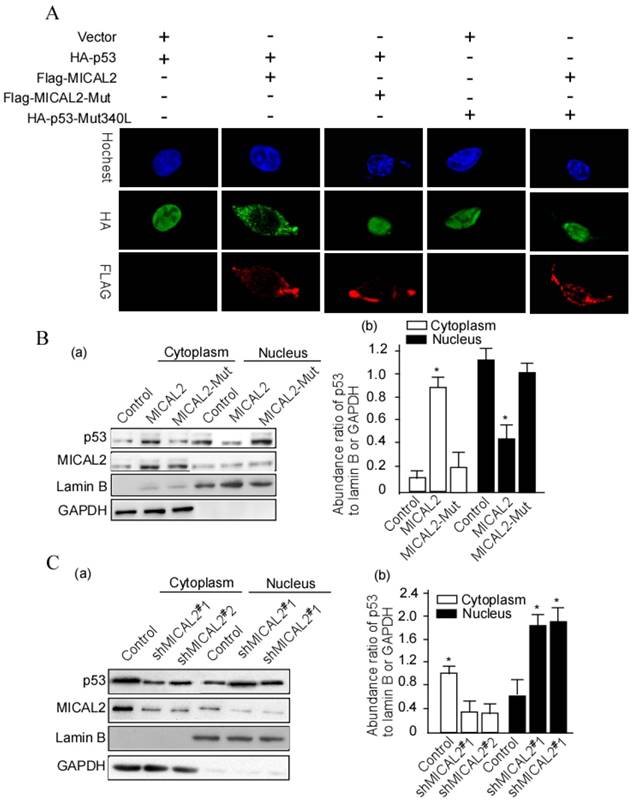
The above results showed that MICAL2 interacts with p53. In the next step, we wanted to further probe whether this interaction affects p53 cellular location. HEK293T cells were transfected with HA-p53 or HA-p53Mut (mutant), Flag-MICAL2 and MICAL-Mut. Flag was detected using immunofluorescence. The immunofluorescence results showed that p53 stayed in the cytoplasm of cells following MCIAL2 transfection, but did not when the cells were transfected with MICAL2-Mut or untransfected (Figure 7A). To confirm this finding, cytoplasmic and nuclear proteins of the transfected cells were respectively extracted, and p53 was tested in the extractions. p53 was significantly increased in the cytoplasm of cells transfected with MICAL2, and was decreased in the nucleus when compared with the control and MICAL2-Mut-transfected cells (Figure 7B, p < 0.05). The next step was to investigate whether MICAL2 knockdown decreases p53 in the cytoplasm. The results showed that p53 was decreased in the cytoplasm and increased in the nucleus of cells transfected with shMICAL2 compared with the control (Figure 7C, p < 0.05). This suggests that MICAL2 modulates p53 cytoplasm location.
MICAL2 retains p53 in the cytoplasm. (A) HEK293T cells were transfected with the indicated plasmids. MICAL2 and p53 were detected using immunofluorescence with the indicated antibody. Hochest served as a nucleus control. (B) HEK293T cells were transfected with MICAL2 or MICAL2-Mut plasmid. (C) HEK293T cells were transfected with shMICAL2#1 or shMICAL2#2. Cytoplasmic and nuclear proteins in the transfected cells were separated. p53 in the separated components was detected using Western blotting (a). Lamin B served as a nuclear protein control. GAPDH served as a cytoplasmic protein control. The abundance ratio to GAPDH or Lamin B was calculated (b). *, p < 0.05.
MICAL2 promotes ubiquitin degradation of p53
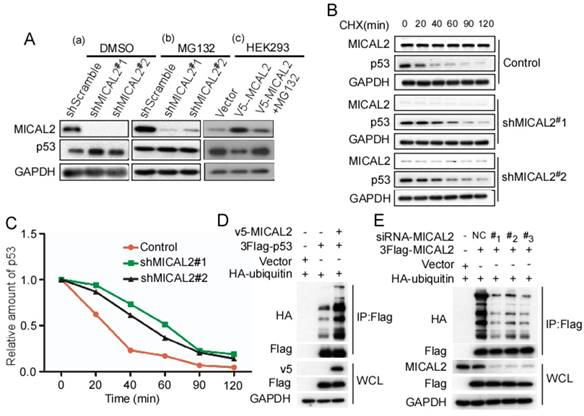
Based on the above findings that MICAL2 binds to and decreases p53 expression, we speculated that MICAL2 affects p53 proteolysis. To confirm this, MICAL2-knockdown HCT116 p53+/+ cells were treated with MG132, a specific proteasome inhibitor, and p53 expression was detected. As we speculated, MG132 substantially rescued the increased p53 protein expression caused by MICAL2-knockdown in HCT116 p53+/+ cells (Figure 8A). Additionally, HEK293T cells with low MICAL2 expression were transfected with MICAL2, and then treated with MG132. p53 expression significantly decreased following MICAL2 transfection, while p53 increased again after treatment with MG132 (Figure 8A). MG132 substantially rescued the decreased p53 expression caused by MICAL2 overexpression. These results suggest that MICAL2 promotes p53 degradation by the proteasome. Next, HCT116 p53+/+ cells were treated with CHX, and the half-life of endogenous p53 was measured. The half-life of endogenous p53 protein was longer in MICAL2-knockdown cells than in the control (Figure 8B-C). Ubiquitin-proteasome is a highly effective protein degradation pathway in eukaryotic cells [32-34]. We next determined whether MICAL2 affects p53 ubiquitination. The results showed that p53 poly-ubiquitination was upregulated in HEK293T cells with MICAL2 overexpression (Figure 8D). To further confirm whether MICAL2 regulates p53 ubiquitination, HEK293T cells were transfected with MICAL2-siRNAs. We observed that MICAL2 decrease downregulated p53 poly-ubiquitination (Figure 8E). Collectively, these results indicate that MICAL2 increases p53 ubiquitination, thus promoting its proteasomal degradation.
MICAL2 promotes p53 ubiquitin-degradation. HCT116 p53+/+ cells were stably transfected with pLVX-shMICAL2#1 or pLVX-shMICAL2#2. (A) MICAL2-knochdown HCT116 p53+/+ cells were treated with dimethyl sulfoxide (DMSO) and MG132. DMSO served as a control. HKE293T cells were transfected with v5-MICAL2, and then treated with MG132. MICAL2 and p53 levels in the treated cells were detected using Western blotting. GAPDH served as the loading control. (B) MICAL2-knochdown HCT116 p53+/+ cells were treated with 20 mg/mL CHX at the indicated time points. MICAL2 and p53 levels were detected using Western blotting. (C) p53 level was quantitatively analyzed by Western blotting and the half-life of p53 was calculated. (D) HEK293T cells were transfected with HA-ubiquitin, v5-MICAL2, 3Flag-p53 or vector. Flag was immunoprecipitated using anti-Flag antibody, and p53 ubiquitination was detected using Western blotting with the indicated antibody. (E) HEK293T cells were co-transfected with HA-ubiquitin and siRNA-MICAL2, 3Flag-p53 or vector. Flag was immunoprecipitated using anti-Flag antibody, and p53 ubiquitination was detected. All experiments were performed in triplicate and representative data are shown.
MICAL2 promotes p53 ubiquitination by oxidizing p53 at Met 40 and 160
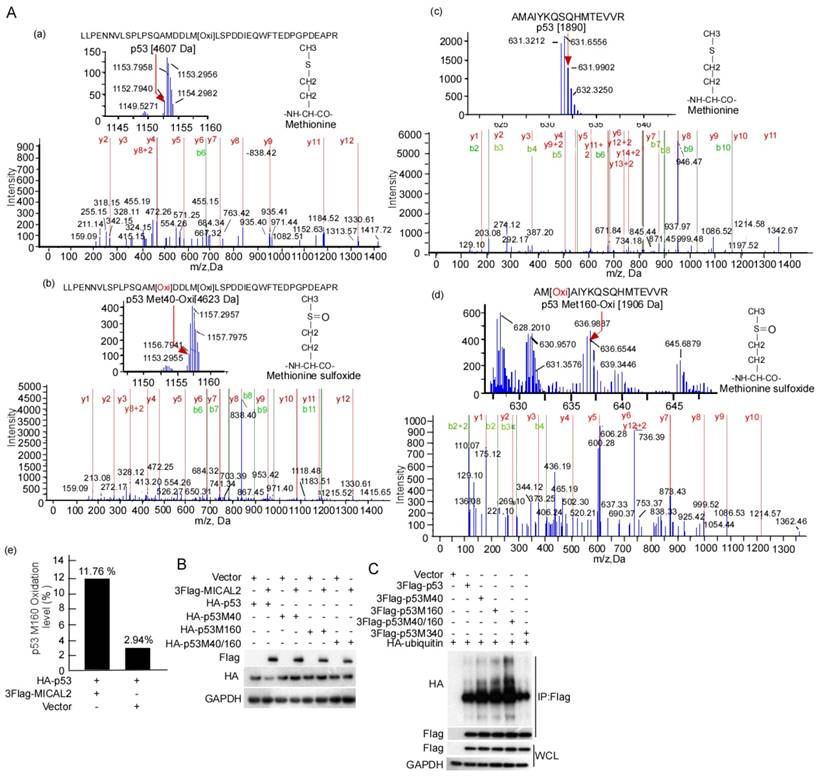
E3 ubiquitin ligase MDM2 is the most critical negative regulator of p53 protein stability. MDM2 binds to p53 and ubiquitinates it for proteasomal degradation [35-37]. Therefore, we tested the effect of MICAL2 on the binding of MDM2 and p53. MDM2 interaction with p53 did not change in the cells with MICAL2 transfection (Figure S1A). We speculated that MICAL2-mediated p53 ubiquitination may be not dependent on MDM2. To confirm this speculation, the transfected cells were treated with nutlin, a special inhibitor of MDM2, and then p53 ubiquitination was tested. p53 ubiquitin degradation was unchanged when cells were treated with nutlin compound RG7388 (Figure S1B). This result showed that MICAL2 mediate p53 ubiquitination not through MDM2. It has been reported that p53 oxidation at Met decreases its function [38]. As a microtubule-associated monooxygenase, MICAL2 oxidizes Met residues [16, 39]. Therefore, we speculated that MICAL2 may oxidize p53 at Met and regulate its function. Met residues at positions 40, 44, 66, 133, 160, 169, 237, 243, 246, 340 and 384 in p53 may be oxidized. To confirm whether MICAL2 regulates p53 through these Met residues, we mutated Met residues at 40, 44, 66, 133, 160, 169, 237, 243, 246, 340 and 384 to Leucine (Leu), and tested the effect of MICAL2 on p53 expression. The results showed that p53 could not be downregulated by MICAL2 in Met 40 and 160 mutations (Figure S2). p53 oxidation in cells with MICAL2 and p53 cotransfection was detected using mass spectrometry. Mass spectrometry data showed that p53 Met 40 was oxidized when cells were transfected with MICAL2 (Figure 9Ab). Although p53 Met 160 oxidation was observed without MICAL2 transfection, Met 160 oxidation increased from 2.94% to 11.76% after transfection with MICAL2 (Figure 9Ad-e). These results suggest that MCIAL2 promotes p53 Met 40 and 160 oxidation in vivo. We further mutated Met 40 and 160 into Leu, and investigated whether these mutants affect p53 expression. p53 expression was not changed when mutating Met 40 and 160 (Figure 9B). To probe whether p53 oxidations at Met 40 and 160 promote p53 ubiquitination and degradation, we mutated p53 at Met 40 and 160 into glutamine (Gln) to mimic its oxidation, and assessed p53 ubiquitin degradation. The results showed that oxidation mimics at Met 40 and 160 significantly increased p53 ubiquitination (Figure 9C). Moreover, double mutants showed higher ubiquitination, while oxidation mimic at Met 340 did not increase p53 ubiquitination (Figure 9C). Together, these results indicated that MICAL2 oxidizes p53 at Met 40 and 160, and increases p53 ubiquitin degradation.
MICAL2 increases p53 ubiquitin degradation though oxidizing Met 40 and 160. (A) HEK239T cells were cotransfected with plasmids expressing MICAL2 or p53. Oxidation of p53 residues was detected using mass spectrometry. (a) Met 40 in the transfect with p53 plus vector; (b) Met 40 in the transfect with p53 plus MICAL2; (c) Met 160 in the transfect with p53 plus vector; (d) Met 160 in the transfect with p53 plus MICAL2; (e) Met 160 oxidation comparison of (c) and (d). (B) Met 40 or 160 was individually mutated into Leu, and both Met 40 and 160 were mutated. The p53 mutants and MICAL2 were cotransfected into HEK239T cells and p53 expression was detected. (C) Met 40 or 160 were individually mutated into Gln, and both Met 40 and 160 were mutated. The p53 mutants and MICAL2 were cotransfected with ubiquitin, and p53 ubiquitination was detected using immunoprecipitation and Western blotting.
Discussion
A multistage theory of CRC carcinogenesis known as the adenoma-carcinoma sequence proposes that mutations activating multiple oncogenes and inactivating tumor-suppressor genes accumulate in normal colonic epithelial cells and cause adenomas [9]. Results of the present study showed that MICAL2 is a novel oncogene in CRC pathogenesis. We concluded this based on the following three results. (1) MICAL2 was highly expressed in CRC cells, and its expression was associated with advanced CRC development and low 5-year survival rate. (2) MICAL2-knockdown decreased CRC malignant activity. (3) In vivo, MICAL2-knockdown increased tumor growth. These results suggested that MICAL2 promotes CRC development. Determination of the underlying mechanism indicated that MICAL2 promotes CRC development through regulating p53.
TP53 gene is a tumor suppressor gene encoding p53, whose primary function is to promote cell-cycle arrest and induce apoptosis when necessary [40]. p53, which is known as the guardian of the genome [41], plays a critical role in inducing apoptosis and preventing oncogenesis [42]. p53 is frequently dysregulated in CRC tissues. Moreover, p53 is associated with CRC pathogenesis and advanced TNM stage, lymph nodes metastasis, and low 5-year survival rate [43, 44]. Of the well-known functions of p53, the mostly highlighted ones are the regulation of cell cycle checkpoints and inducing apoptosis under cellular stress [45]. Loss of p53 often induces oncogenesis [46-48], and promotes tumor initiation and progression [49-51]. In the present study, we found that MICAL2 shortened p53 half-life and decreased p53 level, suggesting that MICAL2 promoted CRC carcinogenesis through decreasing p53 function. Determination of the underlying mechanism indicated that (1) MICAL2 promotes cell cycle progression and inhibits apoptosis through downregulating p53 and (2) MICAL2 regulates the expression of p53 target genes, including CDKN1A, SERPINB5, SESN1 and FAS, and the protein expression of CDKN1A. Interestingly, MICAL2 interacted with p53 and promoted p53 ubiquitination and degradation. Thus, MICAL2-mediated p53 degradation may be critical for CRC initiation and progression.
p53 activity can be regulated through ubiquitination, oxidation, phosphorylation, acetylation and methylation [52-55]. The key to the regulation of p53 activity is the regulation of its stability, which is mainly orchestrated through a network of ubiquitination reactions [52, 53]. Among numerous proteins involved in p53 regulation, MDM2 is the major negative regulator of p53 level and activity [35, 56]. MDM2 physically interacts with p53 and represses p53-mediated transcriptional activation [36, 37] and induce p53 ubiquitination. The E3 ubiquitin ligase MDM2 is the most important regulator of ubiquitin-mediated degradation of p53 [56]. MDM2 binds to p53 and ubiquitinates it proteasomal degradation [35-37]. In the present study, MICAL2- knockdown or knockin had no effect on the interaction between MDM2 and p53; inhibiting MDM2 did not affect MICAL2-mediated p53 ubiquitination. However, MICAL2-knockin directly increased p53 ubiquitination, and MICAL2-knockdown decreased p53 ubiquitination. These results suggest that MICAL2-mediated p53 ubiquitination may not be through MDM2. p53 oxidation decreases its function [38]. We found that MICAL2 induced p53 oxidation at Met 40 and 160, and increased p53 ubiquitination. As a microtubule-associated monooxygenase, MICAL2 may directly oxidize p53 Met residues and promote ubiquitin-mediated degradation of p53. We think that MICAL2 is a novel regulator of p53 degradation.
In summary, the results indicate that MICAL2 binds to p53, retains p53 in the cytoplasm and oxidizes it at Met 40 and 160, promotes p53 ubiquitination, and decreases p53 expression. MICAL2-induced p53 decrease inhibits CRC cell apoptosis and increases CRC cell growth both in vitro and in vivo, and finally promotes CRC development.
Abbreviations
BMP: bone morphogenetic protein; CDKN1A: cyclin-dependent kinase inhibitor 1A; CHX: cycloheximide; CRC: colorectal cancer; DMEM: dulbecco's modified eagle medium; Gln: glutamine; GO: Gene Ontology; KEGG: kyoto encyclopedia of genes and genomes; Leu: leucine; MDM2: urine double minute 2; Met: methionine; MICAL2: molecule interacting with CasL2; MMR: DNA mismatch repair; MO: mono-oxygenase; shMICAL2: short hairpin RNA target MICAL2; TGFβ: transforming growth factor-β.
Acknowledgements
This work was supported in part by the National Natural Science Foundation of China (81872226, 81372282, 81402368, 81402265, 81502346), Program for New Century Excellent Talents in University, NCET (NCET-06-0685), and Guangdong Natural Science Foundation (S2013010013360). We thank various members in Professor Tiebang Kang's Laboratory for contributions and helpful discussion. We appreciate the contributions and helpful discussion of various members in the Clinical Laboratory of the Affiliated Cancer Hospital, Central South University.
Supplementary Material
Supplementary figures and tables.
Competing Interests
The authors have declared that no competing interest exists.
References
1. Jemal A, Bray F, Center MM, Ferlay J, Ward E, Forman D. Global cancer statistics. CA Cancer J Clin. 2011;61:69-90
2. Baena R, Salinas P. Diet and colorectal cancer. Maturitas. 2015;80:258-64
3. Jasperson KW, Tuohy TM, Neklason DW, Burt RW. Hereditary and familial colon cancer. Gastroenterology. 2010;138:2044-58
4. Duraturo F, Liccardo R, Cavallo A, De Rosa M, Grosso M, Izzo P. Association of low-risk MSH3 and MSH2 variant alleles with Lynch syndrome: probability of synergistic effects. Int J Cancer. 2011;129:1643-50
5. Rustgi AK. The genetics of hereditary colon cancer. Genes Dev. 2007;21:2525-38
6. De Rosa M, Pace U, Rega D, Costabile V, Duraturo F, Izzo P. et al. Genetics, diagnosis and management of colorectal cancer (Review). Oncol Rep. 2015;34:1087-96
7. Pancione M, Remo A, Colantuoni V. Genetic and epigenetic events generate multiple pathways in colorectal cancer progression. Patholog Res Int. 2012:509348 24
8. Ewing I, Hurley JJ, Josephides E, Millar A. The molecular genetics of colorectal cancer. Frontline Gastroenterol. 2014;5:26-30
9. Vogelstein B, Fearon ER, Hamilton SR, Kern SE, Preisinger AC, Leppert M. et al. Genetic alterations during colorectal-tumor development. N Engl J Med. 1988;319:525-32
10. Medema JP, Vermeulen L. Microenvironmental regulation of stem cells in intestinal homeostasis and cancer. Nature. 2011;474:318-26
11. Markowitz SD, Bertagnolli MM. Molecular origins of cancer: Molecular basis of colorectal cancer. N Engl J Med. 2009;361:2449-60
12. Najdi R, Holcombe RF, Waterman ML. Wnt signaling and colon carcinogenesis: beyond APC. J Carcinog. 2011;10:1477-3163
13. Terman JR, Mao T, Pasterkamp RJ, Yu HH, Kolodkin AL. MICALs, a family of conserved flavoprotein oxidoreductases, function in plexin-mediated axonal repulsion. Cell. 2002;109:887-900
14. Suzuki T, Nakamoto T, Ogawa S, Seo S, Matsumura T, Tachibana K. et al. MICAL, a novel CasL interacting molecule, associates with vimentin. J Biol Chem. 2002;277:14933-41
15. Ashida S, Furihata M, Katagiri T, Tamura K, Anazawa Y, Yoshioka H. et al. Expression of novel molecules, MICAL2-PV (MICAL2 prostate cancer variants), increases with high Gleason score and prostate cancer progression. Clin Cancer Res. 2006;12:2767-73
16. Hung RJ, Pak CW, Terman JR. Direct redox regulation of F-actin assembly and disassembly by Mical. Science. 2011;334:1710-3
17. Hung RJ, Yazdani U, Yoon J, Wu H, Yang T, Gupta N. et al. Mical links semaphorins to F-actin disassembly. Nature. 2010;463:823-7
18. Nadella M, Bianchet MA, Gabelli SB, Barrila J, Amzel LM. Structure and activity of the axon guidance protein MICAL. Proc Natl Acad Sci U S A. 2005;102:16830-5
19. Siebold C, Berrow N, Walter TS, Harlos K, Owens RJ, Stuart DI. et al. High-resolution structure of the catalytic region of MICAL (molecule interacting with CasL), a multidomain flavoenzyme-signaling molecule. Proc Natl Acad Sci U S A. 2005;102:16836-41
20. Ho JR, Chapeaublanc E, Kirkwood L, Nicolle R, Benhamou S, Lebret T. et al. Deregulation of Rab and Rab effector genes in bladder cancer. PLoS One. 2012;7:19
21. Mariotti S, Barravecchia I, Vindigni C, Pucci A, Balsamo M, Libro R. et al. MICAL2 is a novel human cancer gene controlling mesenchymal to epithelial transition involved in cancer growth and invasion. Oncotarget. 2016;7:1808-25
22. Wang Y, Deng W, Zhang Y, Sun S, Zhao S, Chen Y. et al. MICAL2 promotes breast cancer cell migration by maintaining epidermal growth factor receptor (EGFR) stability and EGFR/P38 signalling activation. Acta Physiol (Oxf). 2018:222
23. Hong J, Hu K, Yuan Y, Sang Y, Bu Q, Chen G. et al. CHK1 targets spleen tyrosine kinase (L) for proteolysis in hepatocellular carcinoma. J Clin Invest. 2012;122:2165-75
24. Xu S, Wu Y, Chen Q, Cao J, Hu K, Tang J. et al. hSSB1 regulates both the stability and the transcriptional activity of p53. Cell Res. 2013;23:423-35
25. Kang T, Wei Y, Honaker Y, Yamaguchi H, Appella E, Hung MC. et al. GSK-3 beta targets Cdc25A for ubiquitin-mediated proteolysis, and GSK-3 beta inactivation correlates with Cdc25A overproduction in human cancers. Cancer Cell. 2008;13:36-47
26. Tang J, Wang G, Zhang M, Li FY, Sang Y, Wang B. et al. Paradoxical role of CBX8 in proliferation and metastasis of colorectal cancer. Oncotarget. 2014;5:10778-90
27. Tang FQ, Duan CJ, Huang DM, Wang WW, Xie CL, Meng JJ. et al. HSP70 and mucin 5B: novel protein targets of N,N'-dinitrosopiperazine-induced nasopharyngeal tumorigenesis. Cancer Sci. 2009;100:216-24
28. Tang F, Wang D, Duan C, Huang D, Wu Y, Chen Y. et al. Berberine inhibits metastasis of nasopharyngeal carcinoma 5-8F cells by targeting Rho kinase-mediated Ezrin phosphorylation at threonine 567. J Biol Chem. 2009;284:27456-66
29. Xu S, Feng Z, Zhang M, Wu Y, Sang Y, Xu H. et al. hSSB1 binds and protects p21 from ubiquitin-mediated degradation and positively correlates with p21 in human hepatocellular carcinomas. Oncogene. 2011;30:2219-29
30. Johmura Y, Sun J, Kitagawa K, Nakanishi K, Kuno T, Naiki-Ito A. et al. SCF(Fbxo22)-KDM4A targets methylated p53 for degradation and regulates senescence. Nat Commun. 2016;7:10574
31. Binolfi A, Limatola A, Verzini S, Kosten J, Theillet FX, Rose HM. et al. Intracellular repair of oxidation-damaged alpha-synuclein fails to target C-terminal modification sites. Nat Commun. 2016;7:10251
32. Hochstrasser M. Ubiquitin, proteasomes, and the regulation of intracellular protein degradation. Curr Opin Cell Biol. 1995;7:215-23
33. Ciechanover A. The ubiquitin-proteasome proteolytic pathway. Cell. 1994;79:13-21
34. Orlowski RZ, Dees EC. The role of the ubiquitination-proteasome pathway in breast cancer: applying drugs that affect the ubiquitin-proteasome pathway to the therapy of breast cancer. Breast Cancer Res. 2003;5:1-7
35. Wade M, Li YC, Wahl GM. MDM2, MDMX and p53 in oncogenesis and cancer therapy. Nat Rev Cancer. 2013;13:83-96
36. Momand J, Zambetti GP, Olson DC, George D, Levine AJ. The mdm-2 oncogene product forms a complex with the p53 protein and inhibits p53-mediated transactivation. Cell. 1992;69:1237-45
37. Oliner JD, Pietenpol JA, Thiagalingam S, Gyuris J, Kinzler KW, Vogelstein B. Oncoprotein MDM2 conceals the activation domain of tumour suppressor p53. Nature. 1993;362:857-60
38. Nomura T, Kamada R, Ito I, Chuman Y, Shimohigashi Y, Sakaguchi K. Oxidation of methionine residue at hydrophobic core destabilizes p53 tetrameric structure. Biopolymers. 2009;91:78-84
39. Lundquist MR, Storaska AJ, Liu TC, Larsen SD, Evans T, Neubig RR. et al. Redox modification of nuclear actin by MICAL-2 regulates SRF signaling. Cell. 2014;156:563-76
40. Wang X, Simpson ER, Brown KA. p53: Protection against tumor growth beyond effects on cell cycle and apoptosis. Cancer Res. 2015;75:5001-7
41. Efeyan A, Serrano M. p53: guardian of the genome and policeman of the oncogenes. Cell Cycle. 2007;6:1006-10
42. Meulmeester E, Jochemsen AG. p53: a guide to apoptosis. Curr Cancer Drug Targets. 2008;8:87-97
43. Bartek J, Bartkova J, Vojtesek B, Staskova Z, Lukas J, Rejthar A. et al. Aberrant expression of the p53 oncoprotein is a common feature of a wide spectrum of human malignancies. Oncogene. 1991;6:1699-703
44. Wen S, Gao J, Zhang L, Zhou H, Fang D, Feng S. p53 increase mitochondrial copy number via up-regulation of mitochondrial transcription factor A in colorectal cancer. Oncotarget. 2016;7:12514
45. Levine AJ. p53, the cellular gatekeeper for growth and division. Cell. 1997;88:323-31
46. Sarasqueta AF, Forte G, Corver WE, de Miranda NF, Ruano D, van Eijk R. et al. Integral analysis of p53 and its value as prognostic factor in sporadic colon cancer. BMC Cancer. 2013;13:1471-2407
47. Liu BW, Liu Y, Liu JR, Feng ZX, Liu T. Prognostic effect of p53 expression in patients with completely resected colorectal cancer. Tumour Biol. 2014;35:9893-6
48. Stefancikova L, Moulis M, Fabian P, Vasova I, Zedek F, Ravcukova B. et al. Prognostic impact of p53 aberrations for R-CHOP-treated patients with diffuse large B-cell lymphoma. Int J Oncol. 2011;39:1413-20
49. Harvey M, McArthur MJ, Montgomery CA Jr, Bradley A, Donehower LA. Genetic background alters the spectrum of tumors that develop in p53-deficient mice. FASEB J. 1993;7:938-43
50. Jacks T, Remington L, Williams BO, Schmitt EM, Halachmi S, Bronson RT. et al. Tumor spectrum analysis in p53-mutant mice. Curr Biol. 1994;4:1-7
51. Strong LC. General keynote: hereditary cancer: lessons from Li-Fraumeni syndrome. Gynecol Oncol. 2003;88:S11-3
52. Hock AK, Vousden KH. The role of ubiquitin modification in the regulation of p53. Biochim Biophys Acta. 2014;1:137-49
53. Pant V, Lozano G. Limiting the power of p53 through the ubiquitin proteasome pathway. Genes Dev. 2014;28:1739-51
54. Tang Y, Zhao W, Chen Y, Zhao Y, Gu W. Acetylation is indispensable for p53 activation. Cell. 2008;133:612-26
55. Chuikov S, Kurash JK, Wilson JR, Xiao B, Justin N, Ivanov GS. et al. Regulation of p53 activity through lysine methylation. Nature. 2004;432:353-60
56. Kruse JP, Gu W. Modes of p53 regulation. Cell. 2009;137:609-22
Author contact
![]() Corresponding authors: Dr. Faqing Tang, Hunan Cancer Hospital & the Affiliated Cancer Hospital of Xiangya School of Medicine, Central South University, 410013, Changsha, China. E-mail: tangfaqing33com; Tel.: 86-731-89762688; Fax: 86-731-89762688; Dr. Tiebang Kang, State Key Laboratory of Oncology in South China and Department of Experimental Research, Sun Yat-sen University Cancer Center, Guangzhou 510060, Guangdong, China. E-mail: kangtbsysu.edu.cn.
Corresponding authors: Dr. Faqing Tang, Hunan Cancer Hospital & the Affiliated Cancer Hospital of Xiangya School of Medicine, Central South University, 410013, Changsha, China. E-mail: tangfaqing33com; Tel.: 86-731-89762688; Fax: 86-731-89762688; Dr. Tiebang Kang, State Key Laboratory of Oncology in South China and Department of Experimental Research, Sun Yat-sen University Cancer Center, Guangzhou 510060, Guangdong, China. E-mail: kangtbsysu.edu.cn.