Impact Factor
- Issue 14; 2026
- Issue 13; 2026
- Issue 12; 2026
- Issue 11; 2026
- Issue 10; 2026
- Volume 16; 2026
- Advance Articles
- Past Issues
- Cover Images
- Cover Suggestion
- Index & Coverage
- Special Issues
Introduction
Methods
Results and Discussion
Conclusions
Abbreviations
Acknowledgements
Supplementary Material
References
International Journal of Biological Sciences
International Journal of Medical Sciences
 Global reach, higher impact

Theranostics 2018; 8(20):5548-5561. doi:10.7150/thno.29214 This issue Cite
Research Paper
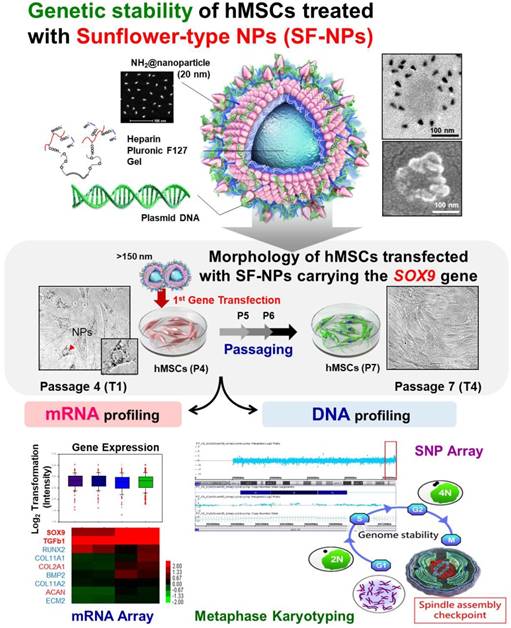
Verification of Long-Term Genetic Stability of hMSCs during Subculture after Internalization of Sunflower-Type Nanoparticles (SF-NPs)
Ji Sun Park1*, Se Won Yi1*, Hye Jin Kim1, Hyun Jyung Oh1, Jung Sun Lee1, Minyeon Go2, Sung Han Shim2 ![]() , Keun-Hong Park 1
, Keun-Hong Park 1 ![]()
1. Laboratory of Nano-regenerative Medical Engineering, Department of Biomedical Science, College of Life Science, CHA University, 618, CHA Biocomplex, Sampyeong-Dong, Bundang-gu, Seongnam-si, 13488, Republic of Korea.
2. Laboratory of Molecular Genetics, Department of Biomedical Science, College of Life Science, CHA University, 629, CHA Biocomplex, Sampyeong-Dong, Bundang-gu, Seongnam-si, 13488, Republic of Korea.
*These authors contributed equally to this work.
Received 2018-8-4; Accepted 2018-10-19; Published 2018-11-5
Abstract

Background: For many years, researchers have sought to overcome major challenges in the use of nanoparticles as therapeutics, including issues related to intracellular delivery, biocompatibility, and activation. In particular, the genetic stability of cells treated with nanoparticles has become increasingly important in the context of stem cell therapy.
Methods: Functional nanoparticles (Sunflower typed nanoparticles; SF-NPs) were fabricated by coating heparin pluronic F127 gels with quantum dot nanoparticles (QDs), and then bound the SOX9 gene to the QD nanogels. The resultant nanoparticles were transferred into stem cells, and the effect on genetic stability was monitored. To determinate gene delivery efficacy and long-term genomic stability of cells transfected with QD nanogels, hMSCs were transfected with nanogels at passage 4 (T1; Transfected cells 1) and then sub-cultured to passage of (T4). Following transplantation of transfected T1-T4 cells, the cells were monitored by in vivo imaging. The genetic stability of cells treated with nanoparticles was confirmed by chromosomal analysis, copy number variation (CNV) analysis, and mRNA profiling.
Results: After 21 days of pellet culture after sub-culture from T1 to T4, hMSCs treated with QD nanogels complexed with SOX9 plasmid DNA (pDNA) significantly increased expression of specific extracellular matrix (ECM) polysaccharides and glycoproteins, as determined by Safranin O and Alcian blue staining. Moreover, the T4 hMSCs expressed higher levels of specific proteins, including collagen type II (COLII) and SOX9, than P4 hMSCs, with no evidence of DNA damage or genomic malfunction. Microarray analysis confirmed expression of genes specific to matured chondrocytes. Stem cells that internalized nanoparticles at the early stage retained genetic stability, even after passage. In in vivo studies in rats, neuronal cartilage formation was observed in damaged lesions 6 weeks after transplantation of T1 and T4 cells. The degree of differentiation into chondrocytes in the cartilage defect area, as determined by mRNA and protein expression of COLII and SOX9, was higher in rats treated with SF-NPs.
Conclusion: The QD nanogels used in this study, did not affect genome integrity during long-term subculture, and are thus suitable for multiple theranostic applications.
Keywords: quantum dot, Sunflower-type nanoparticle, genomic stability, single-nucleotide polymorphism, karyotyping, mRNA/DNA profile
Introduction
Nanoparticles (NPs), including carbon nanotubes as well as graphene, silica, magnetic, and quantum dots (QDs), are increasingly being applied in nanomedicine and nanotechnology [1-4]. Although these materials have therapeutic and diagnostic potential, their clinical usage has been hampered by their cytotoxicity [5]. For examples, the cores of QDs contain cadmium (Cd)[6], and their outer shells contain several types of inorganic or organic materials suitable for applications of interest. Although these compounds aid in imaging when QDs are used in cells or in vivo [7, 8], the accumulation of these materials in the body can cause toxicity [9, 10]. Therefore, degradation and release of inorganic nanoparticles, including QDs, are very important to their ultimately clinical utility; accordingly, it is essential to perform quantitative research on the properties of inorganic nanoparticles in long-term culture [11, 12].
Based on the current state of this technology, many researchers avoid using QDs in human patients despite their therapeutic and diagnostic potential [13, 14]. However, most studies to date have examined cytotoxicity only over short periods, rather than over the course of long-term culture or following implantation. Long-term implantation is critical for the success in clinical trials. Micro-environmental conditions are important factors governing the transplantation and survival of materials in the body over long periods of time [15, 16]. Consequently, many researchers have studied the cellular effects of treatment with multiple types of materials [17, 18].
In a previous study, we investigated the potential of QDs for tracking or gene delivery in human mesenchymal stem cells (hMSCs) [19]. We found that internalized QDs modified with several kinds of polymers could serve as useful tools for imaging and gene delivery; however, we only examined these features over short timescales. In addition, we explored the use of poly(ethyleneimine) (PEI) to organize QDs into larger bundled structures, for use as a multifunctional imaging platform for translational research in stem cells. Although we showed that QDs did not damage DNA, we did not follow their long-term effects on cells [20]. In the context of clinical usage, QDs have been investigated over long periods of time.
Mesenchymal stem cells (MSCs) are stem cells that can differentiate into musculoskeletal tissues such as muscle, fat, bone, and cartilage. These cells are easily cultured in vitro and have high proliferative capacity; accordingly, they are widely used to treat damage to joint cartilage, such as occurs in degenerative arthritis and rheumatic diseases. SOX9, an essential transcription factor for cartilage differentiation, has been used as a therapeutic agent for cartilage damage by binding the SOX9 gene to SF-NPs.
In this study, we again tried to fabricate genetically stable NPs harboring multifunctional nanocarriers that could be used to simultaneously track hMSCs and deliver genes into these cells. In these experiments, we transfected hMSCs with Sunflower-type NPs (SF-NPs) complexed with DNA bearing target genes of interest. The cells were cultured after transfection (T1 cells) and later subcultured through several passages (T4 cells). The T1 and T4 cells were studied to assess cytotoxicity, as well as the fates of SF-NPs and the exogenous genes conjugated to them. Following internalization of SF-NPs complexed with SOX9 plasmid DNA (pDNA) into hMSCs, we assessed DNA damage, proliferation, differentiation, and senescence. DNA damage in cells (T1, T2, T3, and T4) was subjected to single-nucleotide polymorphism (SNP) analysis; cells not treated with SF-NPs were used as controls. Genomic abnormalities were monitored by DNA fingerprint analysis. Expression of genes related to proliferation, differentiation, apoptosis, and senescence was monitored by microarray analysis. The fates of internalized SF-NPs were investigated by FACS and confocal laser microscopy. In addition, we compared chondrogenesis between T1 and T4 cells transfected with SF-NPs complexed with SOX9; no cytotoxicity or genomic abnormalities were detected. We also assessed chondrogenesis by cells treated with different nanocarriers or genes, again comparing T1 and T4 cultures.
To generate suitable cellular material for cell therapy, the culture method must be capable of obtaining large numbers of genetically stable cells. In this study, we achieved this goal by culturing stem cells transfected with NPs. The results of our stability studies indicate that such genetically engineered stem cells could be of great clinical value as cell therapy agents.
Methods
Materials
Qdot® 655 ITK amino (PEG) QDs were purchased from Thermo Fisher Scientific (Waltham, MA, USA). Pluronic F127 (PEO-PPO-PEO; molecular weight, 12,600 Da) was purchased from BASF Corp. (Seoul, Korea). Heparin (165 IU/mg) was purchased from Acros (Pittsburgh, PA, USA). Linear PEI (25 kDa) was purchased from Polysciences (Warrington, PA, USA). All other chemicals and organic reagents were purchased either from Sigma-Aldrich (St. Louis, MO, USA) or Thermo Fisher Scientific. hMSCs (Cat. No. PT-2501) and MSCGM™ BulletKit™ mesenchymal stem cell growth medium (Cat. No. PT-3001) were purchased from Lonza (Walkersville, MD, USA).
Synthesis of the pDNA-coupled SF-NPs
Synthesis of heparin Pluronic F127 gels was carried out as described previously[20]. For preparation of SF-NPs, the ratio of heparin Pluronic F127 gel to QDs was 2:1. Heparin Pluronic F127 gel (10 mg) was dissolved in 1 ml of de-ionized water, and then combined with 0.5 ml of QDs, 1 ml of PEI, and 20 μg of pDNA; the sample was mixed by stirring for 10 sec and incubated for 15 min prior to transfection.
Characterization of pDNA-coupled SF-NPs
Transmission electron microscope (TEM) images were acquired on a Hitachi H7600 (Hitachi, Tokyo, Japan) at an acceleration voltage of 80 kV. AFM topography images of samples were obtained using a NanoWizard II atomic force microscope (JPK Instruments, Berlin, Germany). Fluorescence intensity was measured on a Tecan Infinite® F200 fluorescence spectrophotometer (Männedorf, Switzerland). Fluorescence images of injected nude mice were obtained using an IVIS Imaging System 200 (Perkin Elmer, Santa Clara, CA, USA). DLS analysis was performed on a Zetasizer Nano series instrument (Malvern Inst. Ltd., Malvern, UK).
Cell culture
hMSCs were cultured in MSCGM™ BulletKit™ medium at 37°C in a 5% CO2 atmosphere. More than 90% of cells were positive for surface markers, CD105 (sc51594, Ms, Santa Cruz), CD90 (sc53116, Ms, Santa Cruz), and CD73 (sc32299, Ms, Santa Cruz) of the cultured stem cells (Lot. #: 0000605220), and fewer than 10% were positive for negative surface markers CD34 (sc51540, Ms, Santa Cruz) and CD45 (sc18901, Ms, Santa Cruz). Stem cells with this phenotype can be differentiated into bone, cartilage, and fat.
Intracellular trafficking of pDNA-coupled SF-NPs during passage from T1 to T4
hMSCs (3 × 10⁵ cells/well) were seeded in 6-well plates and cultured at 37 °C in a 5% CO2 atmosphere, after which they were rinsed twice and pre-incubated for 0.5 h at 37 °C in 2 ml of Opti-MEM medium. pDNA-coupled SF-NPs were added to the cells and incubated for 30 min to 6 h. Thereafter, the cells were detached to obtain SF-NP-treated T1 cells, and the remaining T1 cells were subcultured three times to obtain T4 cells.
For TEM, cells were collected by centrifugation at 850 g and fixed with 2.5% glutaraldehyde. The fixed cells were subjected to dehydration using a graded ethanol series (20%, 40%, 60%, 80%, and 100%), and then embedded in Epon 812 resin. The resin blocks were sectioned using a microtome and imaged on a JEOL 200CX TEM (80 kV) microscope equipped with an AMT (Advanced Microscopy Techniques) camera system.
For confocal microscopy, the cells were fixed with 4% paraformaldehyde, mounted in Fluorescence Mounting Medium (Dako Cytomation, Hamburg, Germany), and visualized on an LSM 880 Meta confocal laser-scanning microscope (Zeiss, Oberkochen, Germany). Fluorescence was monitored in appropriate channels to detect CellLight® Early Endosomes-GFP (excitation, 485 nm; emission, 520 nm) and SF-NPs (excitation, 610 nm; emission, 655 nm).
Evaluation of transfection efficiency during passage from T1 to T4
hMSCs (3 × 10⁵ cells/well) were seeded in 6-well plates and cultured at 37 °C in a 5% CO2 atmosphere, after which they were rinsed twice and pre-incubated for 1 h with 2 ml of Opti-MEM medium at 37 °C. pDNA-coupled SF-NPs were added to the cells and incubated for 6 h at 37 °C. The hMSCs were then washed three times with 1 ml of PBS to remove any free gene complexes, suspended in PBS, and incubated for 24 h. The cells were detached to obtain SF-NP-treated T1 cells, and the remaining T1 cells were subcultured three times to obtain T4 cells. To determine transfection efficiency, the cells were harvested and analyzed using a flow cytometer (Guava Technologies, Hayward, CA, USA) equipped with a 488/642-nm excitation laser. Data shown are the mean fluorescent signals for 10,000 cells.
For confocal microscopy, the cells were fixed with 4% paraformaldehyde, mounted in Fluorescence Mounting Medium (Dako Cytomation), and visualized on an LSM 880 Meta confocal laser-scanning microscope (Zeiss). Fluorescence was monitored in appropriate channels to detect DAPI (4′,6-diamidino-2-phenylindole; excitation, 358 nm; emission, 461 nm), EGFP (excitation, 488 nm; emission, 530 nm), and SF-NPs (excitation, 610 nm; emission, 655 nm).
hMSC transplantation and in vivo imaging during passage from T1 to T4
hMSCs (3 × 10⁵ cells/well) were seeded in 6-well plates, after which they were rinsed twice, and pDNA-coupled SF-NPs were added. After 6 h, the cells were detached to obtain SF-NP-treated T1 cells, and the remaining T1 cells were subcultured three times to obtain T4 cells. To evaluate cellular tracking of hMSCs transfected with pDNA-coupled SF-NPs, T1, T2, T3, and T4 cells (3 × 10⁶ cells) were xenotransplanted into 7-week-old male BALB/c nude mice (Orient-Bio, Seongnam, Korea). Specifically, transfected hMSCs were suspended in 50 µl of DPBS and subcutaneously injected into the flank using a 29-gauge Ultra-Fine™ insulin syringe (#320320, Becton-Dickinson, NE, USA). The animal study was approved by the Institutional Animal Care and Use Committee (IACUC) of CHA. For in vivo optical imaging, the transplanted mice were imaged with an IVIS Imaging System 200 (Perkin Elmer, Santa Clara, CA, USA).
Chromosome analysis
Cells were allowed to grow to 80% confluence. Mitotic division was arrested by treating the cells with 10 μl/ml Colcemid® for 4 h. Following treatment, cells were harvested with Trypsin-EDTA, treated with a hypotonic solution, and then fixed in methanol/acetic acid (3:1). Chromosome analysis was performed by the Giemsa (GTG) banding technique according to standard protocols[21]. When a chromosome abnormality was identified in a single cell out of the 20 cells examined, up to 100 additional cells were analyzed to rule out low-level mosaicism.
SNP microarray
CNVs and SNVs were analyzed using Affymetrix CytoScan® High-Density Arrays, which consist of 2.6 million SNP and CNV markers with an average inter-marker distance of 500-600 bases. All experimental procedures were performed according to the manufacturer's recommendations (Affymetrix, Santa Clara, CA, USA). Briefly, 250 ng of genomic DNA was digested with Nsp1 restriction endonuclease. Adaptor sequence was added to the DNA fragments, which were then amplified by PCR. Amplicons were labeled with biotinylated nucleotides using terminal deoxynucleotide transferase. Biotinylated DNA (200 ng) was hybridized to an array chip at 50 °C for 16 h. After washing and scanning the chip, CEL files were imported into Chromosome Analysis Suite 2.1.0.16 (Affymetrix) for CNV analysis. For SNVs, genotyping of SNP sites was performed using the BRLMM-P algorithm described by Rabbee et al. [22].
Gene expression profiling of hMSCs with SF-NPs
Total RNA was extracted from control and SF-NP pellets from T1 and T4 cultures using TRIzol (Thermo Fisher Scientific, Waltham, MA, USA). Gene expression was analyzed using GeneChip® Human Gene 2.0 ST Arrays (Thermo Fisher Scientific), which contain >30,000 coding transcripts and >11,000 long intergenic non-coding transcripts. Each gene is represented by 11 pairs of oligonucleotide probes, which are synthesized in situ on the arrays.
Fragmented and labeled ssDNA was prepared from 500 ng of total RNA according to the standard Affymetrix protocol (GeneChip® WT PLUS Reagent Kit Manual, 2017, Thermo Fisher Scientific). Following fragmentation, 3.5 µg of ssDNA was hybridized onto GeneChip® Human Gene 2.0 ST Arrays; the hybridizations were run for 16 h at 45 °C and 60 rpm. GeneChips were washed and stained in an Affymetrix Fluidics Station 450. GeneChips were scanned using the Affymetrix GeneChip Scanner 3000Dx v2. Data were analyzed by Robust Multichip Analysis (RMA) using default settings; the normalization method was global scaling. The trimmed mean target intensity of each array was arbitrarily set to 100. The normalized and log-transformed intensity values were then analyzed using GeneSpring GX 13.1.1 (Agilent Technologies, Santa Clara, CA, USA). Genes present at ≥200% or <50% of the corresponding control levels were defined as up-regulated and down-regulated, respectively. Hierarchical clustering was performed using the Cluster 3.0 program, using the Euclidean distance algorithm with average linkage.
Chondrogenic differentiation in 3D pellets
The protocol for chondrogenic differentiation was based on a procedure described in our previous study[23]. SF-NP-treated T1 cells were detached after 6 h and pelleted; T4 cells were pelleted after three additional passages. T1 and T4 pellets were maintained in DMEM/High media for 21 days, with media replaced every 3 days. Chondrogenic pellets were harvested and lysed with TRIzol, and mRNA was extracted. cDNAs were synthesized using the cDNA synthesis kit from Invitrogen (Carlsbad, CA, USA). Chondrogenic markers were confirmed by RT-PCR using primers for SOX9 and COL2A1. RT-PCR products were subjected to electrophoresis on 1.2% agarose gels, which were stained with ethidium bromide. Protein extracts (lysates) were resuspended in 100 μl of RIPA buffer, and then subjected to electrophoresis on 8-10% (w/v) SDS-PAGE gels. Western blots were conducted using a semidry system. Primary antibodies were diluted in blocking solution (COLII, 1:1000; SOX9, 1:5000), and incubated with the blots for 4 h at 37 °C. Antibodies were purchased from Santa Cruz Biotechnology (Dallas, TX, USA) or Abcam (Cambridge, MA, USA). Blots were incubated with secondary antibodies for 1 h at RT. Binding was detected on film using the Amersham ECL reagent (GE Healthcare, Pittsburgh, PA, USA). Protein bands were quantified using the Image Lab™ software (version 4.0; Bio-Rad, Hercules, CA, USA) and normalized against the loading control, β-actin.
Generation of the rat model of articular cartilage defect
The partial cartilage defect was introduced along the bilateral leg patellar groove of 8-week-old Sprague Dawley (SD) rats by biopsy punch (1.0-mm diameter, BP-10F, Kai Corporation, Tokyo, Japan) 200 µm × 9 mm2 in size (depth × area). After that, fibrin hydrogels (Beriplast-P Combi-set, CSL Behring, Marburg, Germany) with T1 hMSCs (group 1), T1 hMSCs treated with SF-NPs carrying SOX9 pDNA (group 2), T4 hMSCs (group 3), or T4 hMSCs treated with SF-NPs carrying SOX9 pDNA (T4, group 4) were embedded into the defect site in each leg. In each group, three rats (n=6) were sacrificed at 6 weeks after transplantation, and the legs were carefully excised for subsequent biological examinations. Regeneration of transplanted hMSCs was evaluated by RT-PCR and western blot.
Immunofluorescence analysis
Cryosections (10 μm) from T1 and T4 3D pellets were incubated for 1 h at 4 °C with primary antibodies against COLII (1:200 dilution, MAB 1330, Ms, Millipore) and SOX9 (1:500 dilution, AB5535, Rb, Abcam). Antibodies conjugated with Alexa Fluor 488 and Alexa Fluor 555 (Thermo Fisher Scientific) were used as secondary antibodies for COLII and SOX9, respectively. Sections were mounted in mounting medium (Dako Cytomation) and visualized on an LSM 880 Meta confocal microscope. Fluorescence was monitored in the appropriate channels to detect Alexa Fluor 555 (1:1000 dilution, A21429, excitation, 555 nm; emission, 565 nm), Alexa Fluor 488 (1:1000 dilution, A21202, excitation, 495 nm; emission 519 nm), and DAPI (excitation, 358 nm; emission, 461 nm).
Statistical methods
Data are shown as representative results or means of at least three independent experiments ± SD. Statistical analyses were performed using the two-tailed Student's t-test; differences were considered significant at p ≤ 0.05, and p-values are shown in the figures as needed.
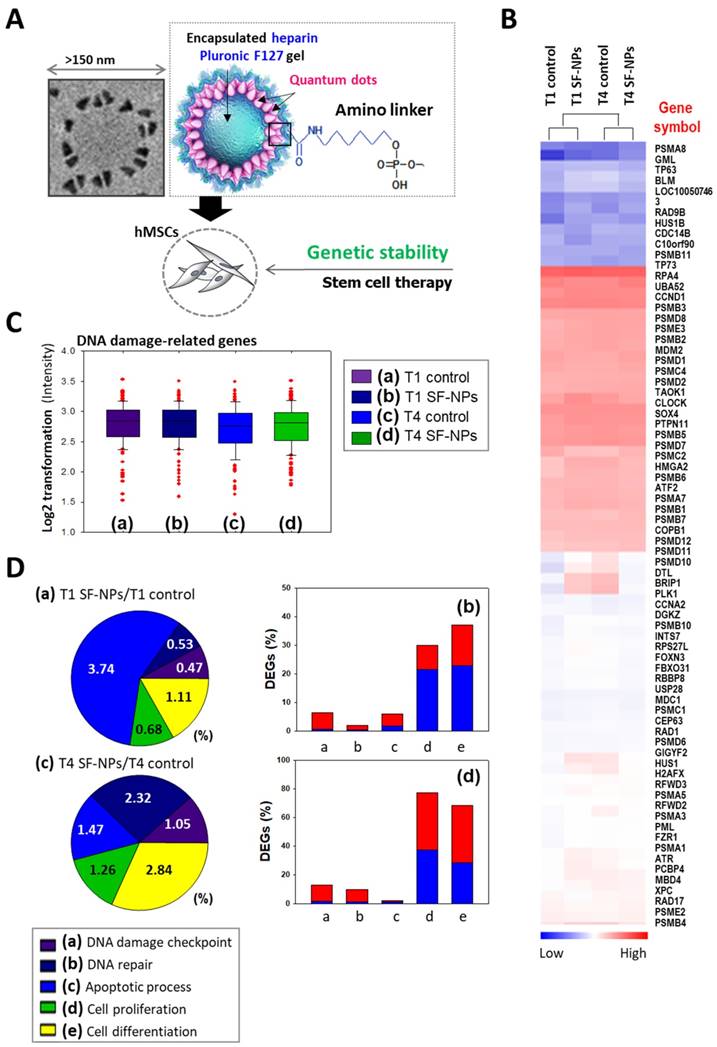
Illustration of heparinized nanogels encapsulating QDs within their cores, and relocation of QDs to the nanogel surface, where they undergo complexation with pDNA. For gene delivery, Sunflower-type nanogels were complexed with pDNA and internalized by hMSCs.
Results and Discussion
Characterization of Sunflower-type nanoparticles (SF-NPs)
In a previous study, we fabricated two kinds of QDs: QD-encapsulated nanogels and nanoparticles with QDs on the outside petals[20]. The morphologies and characteristics of these QDs were imaged and monitored via their intrinsic fluorescence, observed by transmission electron microscopy (TEM), and detected by bioimaging analysis. The QDs were easily encapsulated within or exposed on nanogels, and higher levels of QDs could be achieved by increasing the nanogel concentration. Higher levels of QDs increased fluorescence intensities by promoting interactions with nanogels.
In this study, we fabricated Sunflower-type nanogels capable of being delivered into hMSCs. We confirmed the formation of NPs by dynamic light scattering (DLS), atomic force microscopy (AFM), and scanning electron microscopy (SEM) analyses, (Fig. 1A). QDs complexed with pDNA were ~115 nm in diameter, whereas SF-NPs were ~160 nm in diameter (Fig. 1A, a1 & b1). AFM and SEM images showed particle sizes consistent with those obtained by DLS analysis (Fig. 1A, a2, 3 & b2, 3). Although nano-sized structures were observed, we could not determine whether they were Sunflower-type nanogels. Hence, we sought to determine their sizes and exact morphologies by TEM analysis (Fig. 1A, a4 & b4). The TEM results clearly confirmed the presence of Sunflower-type nanogels. The pDNA was bound to the outer amine-functionalized QD nanoparticles via PEI, allowing the gene to be delivered more efficiently than by QD nanoparticles in the encapsulated state. QDs were positioned on the nanogels and did not exceed 200 nm in diameter, the optimal size for entering hMSCs. In vitro imaging (Fig. 1B) revealed that fluorescence intensity did not differ between QDs complexed with nanogels and QDs alone. This result also confirmed that QDs, which interact strongly with nanogels, can be detected by fluorescence imaging. We also measured the fluorescence intensities of QDs, both alone and in SF-NPs. The fluorescence intensities of SF-NPs did not differ from those of QDs alone: the excitation wavelength of QDs was 655 nm, and the spectra of QDs alone and SF-NPs nearly overlapped. We also imaged QDs complexed with pDNAs and SF-NPs complexed with pDNAs after they were injected into nude mice (Fig. 1C). No fluorescence signal was detected when pDNA alone was introduced into hMSCs, followed by transplantation of the cells into nude mice (Fig. 1C). By contrast, fluorescence from hMSCs treated with SF-NPs could be detected in mice (Fig. 1C, c). The QDs concentration due to interaction with SF-NPs was slightly increased, and QDs and SF-NP both emitted high levels of fluorescence in both groups in nude mice (Fig. 1c, c). Therefore, different forms of QDs can be internalized into hMSCs, and SF-NPs are suitable nanocarriers in stem cells.
Characterization of QDs exposed on nanogels complexed with plasmid DNA (pDNA) for the purpose of gene delivery. (A) Sizes and morphologies of QD NPs complexed with pDNA, as well as QDs exposed on nanogels complexed with pDNA, as determined by dynamic light scattering (DLS), atomic force microscopy (AFM), scanning electron microscopy (SEM), and transmission electron microscopy (TEM). (a) QD655 NPs complexed with pDNA; (b) SF-NPs with pDNA. (a1) and (b1) show DLS and AFM; (a2), (a3), (b2), and (b3) show SEM images; and (a4) and (b4) show TEM images. (B) Fluorescence emitted by QD655 NPs alone and SF-NPs. (a) Fluorescence image of distilled water. (b) Fluorescence image of QD655 NPs. (c) Fluorescence images of SF-NPs. (C) Fluorescence and luminescence intensities of QD655 NPs complexed with pDNA and QDs exposed on nanogels complexed with pDNA. (a), (d), and (g) Fluorescence image of distilled water. (b), (e), and (h) Fluorescence image of QD655 NPs. (c), (f), and (i) Fluorescence images of SF-NPs. (j), (k), and (l) Quantitative analysis of mean fluorescence intensity. (D) FTIR spectra of SF-NPs with SOX9-pDNA: red, orange, green, and blue line is QD 655, PEI, heparin pluronic F127 gel and pDNA each.
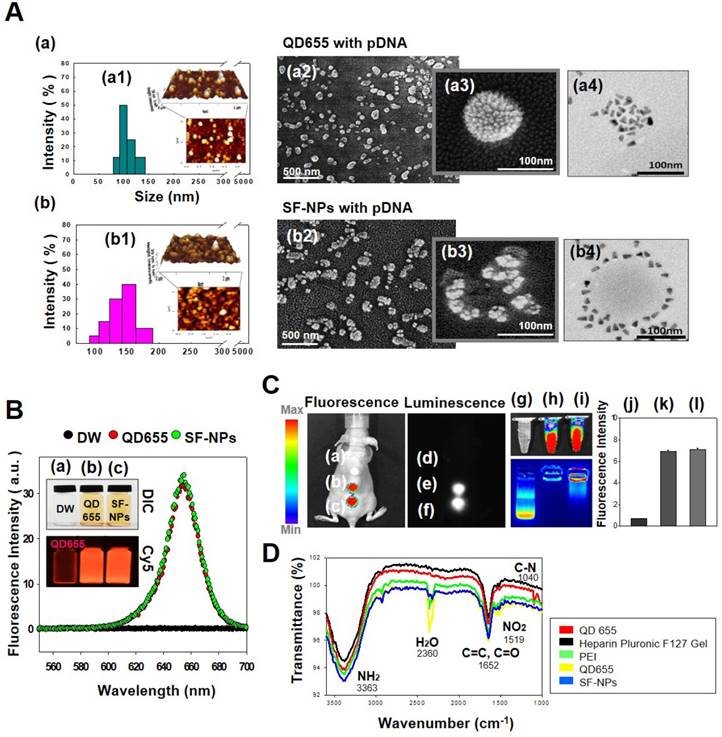
In addition, we investigated the tight complexation of genes with QDs alone and SF-NPs (Fig. 1C, g-i). Following complexation, tight coupling between genes and carriers could be detected by gel retardation (Fig. 1C, h & i). FT-IR results shows that SF-NP was successfully cross-linked to pDNA and did not alter its components after cross-linking (Fig.1D). QD nanogels exerted no cytotoxicity when introduced into hMSCs (Fig. S2), as determined by cell viability using CCK8 assays. Therefore, QD-modified nanogels are suitable for use as gene delivery vehicles. In the subsequent experiments in this study, we investigated the use of QDs exposed on nanogels (SF-NPs) to deliver genes into hMSCs.
Confirmation of cellular internalization of SF-NPs after subculture from T1 to T4
To assess cytotoxicity and genomic abnormallities, we performed TEM analysis on hMSCs that had been treated with SF-NPs complexed with EGFP pDNA, and then subjected to long-term culture (Fig. 2A). Following internalization into hMSCs, QDs were localized near the nucleus (Fig. 2A, b & b-1). After internalization, the cells were subcultured for at least three passages. During long-term culture, internalized QDs were not as easily detectable as in the initially treated cells (Fig. 2A, d & d-1). To more clearly determine the cellular locations of QDs, we monitored SF-NP-treated cells by confocal laser microscopy (Fig. 2B, a). Following internalization into cells, QDs were concentrated near the nucleus (Fig. 2B, a). Examination at higher magnification revealed that the QDs (red) and early endosomes (green) were mingled in the cytosol (Fig. 2B, b). In contrast to early time points after treatment, QDs were not detectable in long-term cultured cells (Fig. 2B, c), and higher magnification revealed neither early endosomes (green) nor QDs (red) (Fig. 2B, d). Thus, the QDs disappeared when the cells were subcultured.
Cellular uptake and bioimaging of SF-NPs in in vitro, and in vivo tests of long-term culture of hMSCs after transfection. (A) Cellular uptake of SF-NPs, as determined by TEM. (a) Control (non-transfected cells: NT1 cells); (b) SF-NP-transfected hMSCs (T1 cells), near the cell membrane; (b-1) SF-NP-transfected hMSCs (T1 cells), near early endosomes; (c) control (non-transfected cells: NT4 cells); (d) SF-NP-transfected hMSCs (T4 cells), near the cell membrane; (d-1) SF-NP-transfected hMSCs (T4 cells), near early endosomes. Red arrows indicate QDs. Bar, 500 nm. (B) Cellular uptake of SF-NPs, as determined by confocal laser microscopy. (a) SF-NP-transfected hMSCs (T1 cells), near the cell membrane; (b) SF-NP-transfected hMSCs (T1 cells), near early endosomes; (c) Control (T1 cells); (d) SF-NP-transfected hMSCs (T1 cells), near early endosomes. Red particles indicate QDs. Bar, 20 μm. (C) Green fluorescent protein (GFP)-tagged SOX9 expressed on hMSCs, and remaining QDs in hMSCs after SF-NP transfection. (a) Control cells (NT1 cells); (b) GFP-expressing hMSCs (green) and remaining QDs (red) (T1 cells); (c) control (NT4 cells); (d) GFP-expressing hMSCs (green) and remaining QDs (red) (T4 cells). Bar, 20 μm. (D) QDs remaining in hMSCs after transfection, as determined by FACS analysis. (a) Control cells (NT1 cells); (b) GFP-expressing hMSCs and remaining QDs (T1 cells); (c) control (NT4 cells); (d) GFP-expressing hMSCs and remaining QDs (T4 cells). (E) Fluorescence intensities of EGFP and QDs expressed in hMSCs, and bioimaging of hMSCs after transplantation. (a) Fluorescence intensities of EGFP and QDs in hMSCs (T1, T2, T3, and T4 cells). (b) SF-NP-transfected hMSCs (T1 cells). Bar, 20 μm. (c) SF-NP-transfected hMSCs (T4 cells). Bar, 20 μm. (d) Bioimaging of QDs transfected into hMSCs (T1 cells), which were then transplanted into a nude mouse. (e) Bioimaging of QDs transfected into hMSCs (T4 cells), which were then transplanted into a nude mouse.
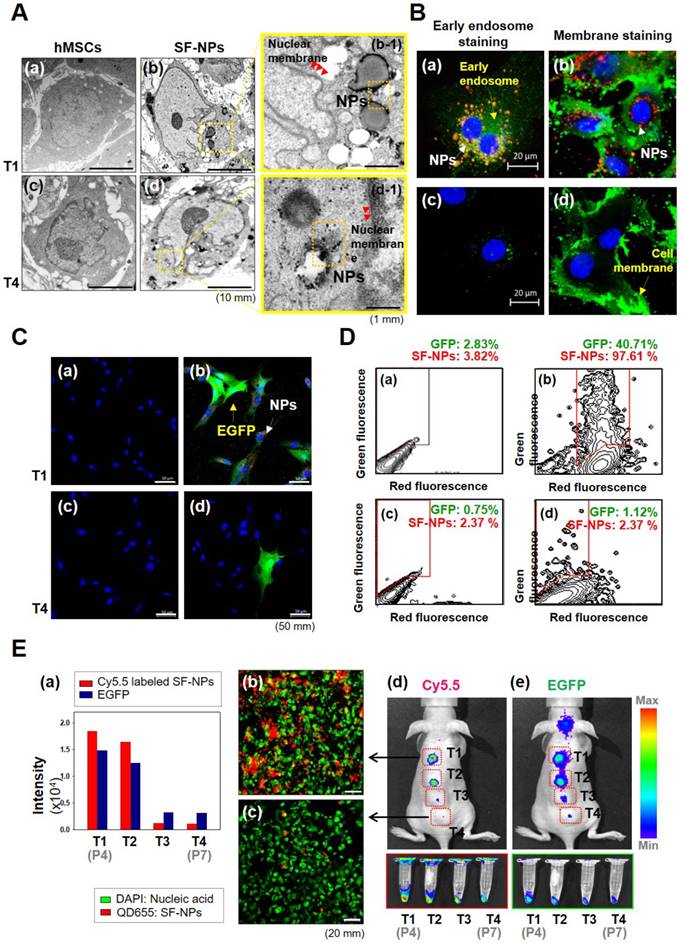
We also investigated the expression of EGFP. For this purpose, cells treated with SF-NPs were imaged at the early stage, as well as after subculture (Fig. 2C). Early-stage cells contained QDs and expressed EGFP (Fig. 2C, b), whereas long-term subcultured cells did not (Fig. 2C, d). In addition, at early time points, almost 90% of cells contained QDs, and almost 30% expressed EGFP, as determined by FACS (Fig. 2D). By contrast, in cells subjected to long-term subculture, QDs and EGFP gene expression were present in only 2.37% and 1.12% of cells, respectively (Fig. 2D, d).
We also assessed transfection and uptake efficiency by confocal laser microscopy (Fig. S3A). The results revealed that PEI or SF-NPs complexed with SOX9 pDNA tagged with EGFP, or EGFP alone, could deliver genes into cells (Fig. S3A, b-d); however, the green fluorescence had disappeared by passage 7 (Fig. S3A, f-h). Furthermore, we assessed the presence of QDs in hMSCs by FACS analysis (Fig. S3B & S3C). Internalized QDs were present in up to 99% of T1 cells (passage 4) (Fig. S2B, c & d), but had largely disappeared by passage 7 (Fig. S3B, g & h). In subcultured cells, QDs and EGFP expression persisted until passage 5, but disappeared by passages 6 and 7 (Fig. 2E, a). Red luminescence in hMSCs, indicating QD uptake, was very bright in passage 4 cells (Fig. 2E, b), but had almost disappeared by passage 7 (Fig. 2E, c). Thus, QDs internalized into cells were still present at passage 5, but disappeared suddenly by passage 6 (T3). It is likely that cell division diluted the QDs until they were no longer detectable in the hMSC cytosol. Thus, at passage 7 (T4), the cells can be considered as safe and stable for use in cell therapy.
To test their suitability for in vivo applications, we transplanted cells transfected with QDs complexed with EGFP DNA into nude mice, and the monitored fluorescence from EGFP and QDs (Fig. 2E, d & e). In T1 and T2 cells (passages 4 and 5), Xenogen imaging revealed that QD-transfected cells exhibited vivid fluorescence, indicating that EGFP and QDs were present in T1 and T2 hMSCs. However, the T3 and T4 cells did not emit fluorescence, indicating that EGFP and internalized QDs disappeared when the transfected cells were used for stem cell therapy.
We also investigated QD internalization and EGFP expression after cell aggregates transfected with PEI and QD nanogels were transplanted into nude mice (Fig. S4). Distinct bioimaging patterns were observed between T1 and T4. T1 cells (passage 4) clearly contained internalized QDs in the cytosol (Fig. 3A, a & b), whereas T4 cells did not (Fig. 3A, c & d). These findings indicate that the internalized QDs disappeared as the cells underwent multiple divisions.
Morphology, karyotyping, and CNV analysis of several types of NPs. (A) Morphology of hMSCs transfected with or without QD nanogels. (a) Control cells (NT1 cells); (b) GFP-expressing hMSCs and remaining QDs (T1 cells); (c) control (NT4 cells); (d) GFP-expressing hMSCs and remaining QDs (T4 cells). (B) Distribution of CNVs in hMSCs. (a) Control cells (NT1 cells); (b) P4 hMSCs treated with SF-NPs (T1); (c) control (NT4 cells); (d) P7 hMSCs treated with SF-NPs (T4). (C) Karyotyping of hMSCs. (a) Control cells (NT1 cells); (b) P4 hMSCs treated with SF-NPs (T1); (c) Control (NT4 cells); (d) P7 hMSCs treated with SF-NPs (T4).
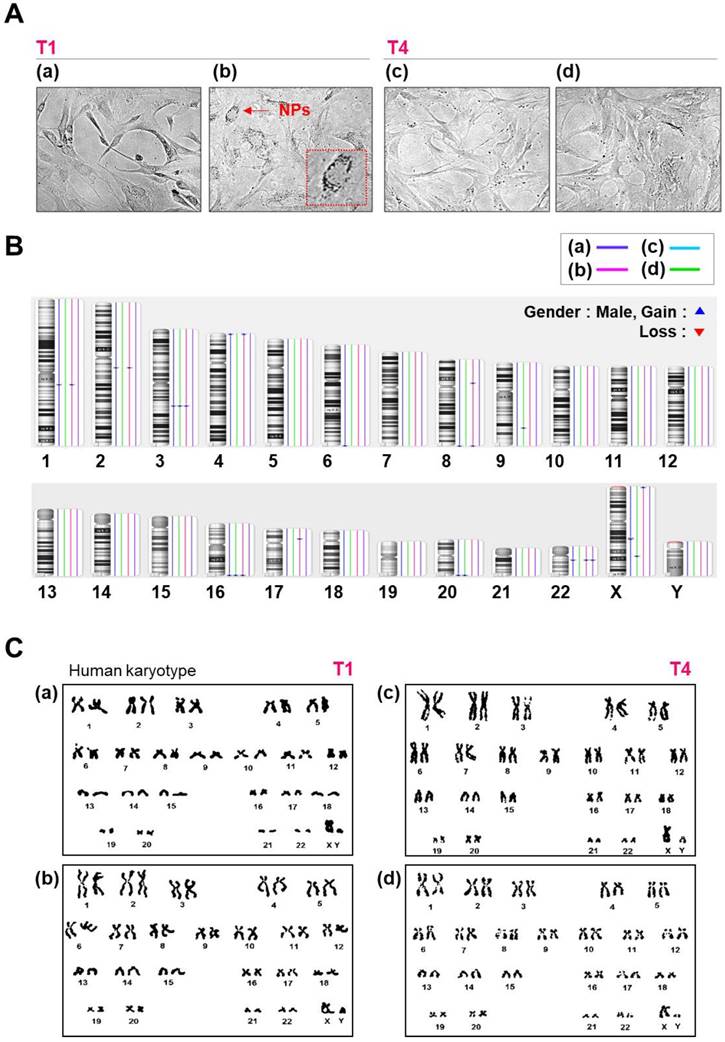
Some inorganic particles, such as metals and ceramics, have poor biocompatibility; in such cases, metabolism of the xenobiotic occurs, resulting in release after a certain period of time. After intracellular uptake, SF-NPs are slowly degraded, releasing heparin gel, polymers, and genes into the cells, and QD-NPs are released through the lysosomes. Before entering the lysosomes, the nanoparticles rapidly enter early endosomes. When the cell divides, most of the nanoparticles enter one daughter cell, although some enter the secondary daughter cell. Via this process, QD-nanoparticles gradually disappear from hMSCs over the course of serial subculture [24].
Copy number variation (CNVs) and single-nucleotide variation (SNV) analysis
To further investigate whether SF-NPs affect genomic stability, we analyzed copy number variations (CNVs) and single-nucleotide variations (SNVs) in SF-NP-treated and control cell lines. Figure 3B summarizes the CNVs detected, as a function of cell culture procedure and SF-NP treatment. We observed 11 CNV changes between T1 and T4: six in controls and five in SF-NP-treated cells. The CNVs were between 105 and 260 kb in size and contained very few genes (Table 1); moreover, none of them are associated with pathogenic conditions. Small numbers of CNVs have been identified in other stem cell cultures[25-27], potentially resulting from unequal recombination between sister chromatids during mitosis.
Single-nucleotide variations detected using SNP microarrays.
| A. SNP call rate | ||||||||
| T1 Control | T4 Control | T1 Sf-Nps/SOX9 | T4 SF-NPs/SOX9 | |||||
| Total SNP | 749,157 | 749,157 | 749,157 | 749,157 | ||||
| SNP call | 734,149 | 731,302 | 730,230 | 740,213 | ||||
| Analyzed SNP | 720,725 | 720,725 | 724,697 | 724,697 | ||||
| Matched SNP | 720,725 | 711,655 | 724,697 | 717,816 | ||||
| Matched % | 100% | 98.74% | 100% | 99.05% | ||||
| B. Different SNP annotation | ||||||||
| Different SNP | Intron | Missense | Coding- synon | Intergenic | ||||
| T4 Control | 9070 | 3808 | 36 | 37 | 5189 | |||
| T4 SF-NPs/SOX9 | 6881 | 2787 | 22 | 27 | 4045 | |||
In the SNP analysis, we examined approximately 750,000 sites. As shown in Table 1, SNPs did not differ significantly between the two groups (controls vs. SF-NP-treated cells) after passage, and about 1% of all SNP sites had changed. Most SNP changes were found in non-coding regions (intergenic and intronic regions), but a very small fraction of SNVs were found in gene-coding regions; these included 36 and 22 missense variations (i.e., mutations causing amino acid changes) in control and SF-NP-treated cell lines, respectively. None of these missense variations were identified as disease-causing mutations. In addition, performed chromosome analyses on cells treated with SF-NPs or control conditions, with different vehicles and different pDNAs, at T1 and T4 (Fig.S5 and Fig.3). As shown in Figure S5 and Figure 3C, no numerical or structural abnormalities were identified. Although this observation cannot exclude all types of genotoxicity over long-term culture, it does rule out genome abnormalities at the chromosome level.
mRNA profiling after subculture from T1 to T4
To evaluate DNA damage caused by transfection of SF-NPs, we examined the epigenetic differences between control and SF-NP-transfected cells (Fig. 4). For this purpose, we transfected SF-NPs into hMSCs; passaged the cells to yield T1, T2, T3, and T4 cultures; and then evaluated changes in gene expression (Fig. 4A & B). Gene Ontology (GO) analysis of differentially expressed genes revealed enrichment in functions associated with DNA damage checkpoints, DNA repair, cell death, cellular senescence, and chondrogenic differentiation. mRNA levels of genes encoding DNA damage response factors did not differ between control and QD nanogel-treated cells, nor did they differ between T1 and T2 cultures of SF-NP-transfected cells (Fig. 4C, D). Many researchers have expressed concern that QDs are highly toxic compounds that could cause cellular damage[28, 29]. Consequently, although QDs have potential for use in cell therapy, their clinical applications have been limited.
Microarray analysis of hMSCs transfected with SF-NPs and cultured for 7 days in a 3D system. (A) Schematic illustration of the microarray analysis. (B) Heatmap showing expression levels of genes related to DNA damage in each group of transfected hMSCs, relative to the levels in non-treated hMSCs. (C) Log2 fold changes in expression of DNA damage-related genes. (D) DNA damage-related gene expression in hMSCs, comparing T1 cells vs. T1 cells after transfection with SF-NPs. (a) and (c) Pie charts showing the percentages of differentially expressed genes (DEGs) associated with GO terms “DNA damage checkpoint,” “DNA repair,” “apoptosis process,” “cell proliferation,” and “cell differentiation”; (b) and (d) Bar graphs of the percentages of DEGs that were up- (red) and down-regulated (blue) in each comparison.
Evaluating the level of chondrogenic differentiation of hMSCs treated with by SF-NPs with pSOX9, in vitro and in vivo
To examine stem cell differentiation, we introduced specific transcription factors into hMSCs in vitro (Fig. 5A). Induction of gene expression by SOX9 causes stem cells to undergo chondrogenic differentiation. Accordingly, transfection with SOX9 increased expression of COL2A1 (collagen II), a factor involved in chondrogenesis. Both mRNA (Fig. 5B) and protein (Fig. 5C) of these marker genes were expressed in T4 and T1 cultures. SOX9 and COL2A1 are important in chondrogenesis because SOX9 target genes are involved in downstream signaling pathways, and COL2A1 encodes an essential component of the extracellular matrix (ECM). The level of chondrogenic differentiation was similar between T1 and T4.
Effect of SF-NPs carrying SOX9 pDNA transfected hMSCs, in T1 and T4, in in vitro and in vivo systems. (A) Brief schematic of the in vitro study. (B and C) mRNA levels (B) and protein levels (C) of chondrogenesis-related markers in transfected hMSCs (T1 and T4 cells) in vitro, as assessed by RT-PCR and western blot. (D) Heatmap of mRNA array results shows the expression of COL1A1, COL1A2, ACAN (aggrecan), COMP, and SOX9 in each group of hMSCs relative to non-treated hMSCs (N = 5). (E) Immunohistological analysis of cell aggregates transfected with SF-NPs complexed with SOX9 pDNA. Bars, 100 μm and 50 μm. (F) Brief schematic of the in vivo study. (G and H) Samples collected from the defect sites were analyzed by RT-PCR (G) and western blot (H). (I) Representative macroscopic observation images of rat knees from each group * p <0.05. (a) control T1 hMSCs; (b) T1 hMSCs transfected with SF-NPs complexed with pSOX9; (c) T4 control hMSCs; (d) T4 SF-NPs transfected with SF-NPs complexed with pSOX9; (e) magnified image of (b); (f) magnified image of (d).
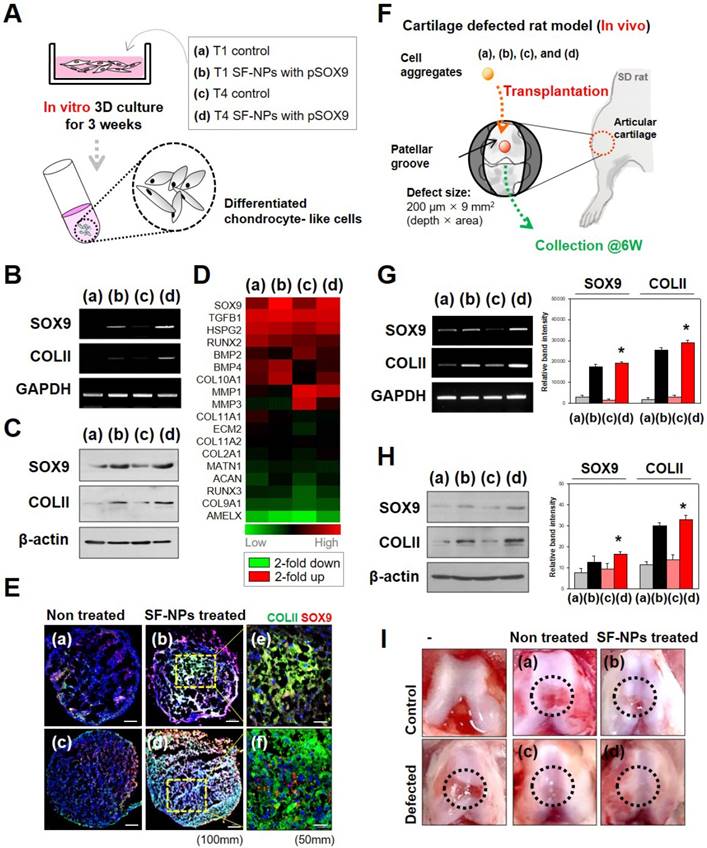
Gene expression profiling revealed that chondrocyte-associated genes, such as SOX9 and TGFβ1 (encoding TGF-β), were highly expressed in hMSCs transfected with SOX9 pDNA-coupled SF-NPs (Fig. 5D). Expression of SOX9 and TGFβ1 was as active in T4 cells as in T1 cells. By contrast, osteogenesis-related genes, such as RUNX2 and BMP2, were barely expressed in the transfected hMSCs. Again, expression of RUNX2 and BMP2 was comparably active in T4 and T1 cells. Thus, transfection of hMSCs with SOX9 pDNA-coupled SF-NPs promoted chondrogenic differentiation and suppressed osteogenic differentiation; these effects were comparable between T4 and T1 cells.
We then performed RT-PCR to compare chondrogenic differentiation of T1 and T4 cells in response to SF-NPs carrying SOX9 pDNA with different vehicles and different pDNAs (Fig. S6). These experiments yielded two main results. First, SF-NPs carrying SOX9 pDNA strongly induced chondrogenic differentiation by T1 hMSCs, and a similar outcome was observed in T4 cells. To further characterize chondrogenic differentiation between the groups, we examined the morphology, cellular distribution, and ECM production of transplanted cell aggregates (Fig. S7 and S8). The high expression of SOX9 and COLII following transfection of SF-NPs carrying SOX9 pDNA indicated that chondrogenic differentiation was induced, as reflected by the compact cell distribution and vivid red and blue staining representing specific ECM molecules (Fig. S7A d and h). Again, T4 cells behaved similarly to T1 cells (Fig. S7B d and h). In addition, we visualized the chondrocyte-related proteins SOX9 and COLII by confocal laser microscopy (Fig. S8). COLII, represented by green fluorescence, and SOX9, represented by red fluorescence, were strongly expressed in aggregates of T1 and T4 cells (Figure 5E).
Finally, to confirm the therapeutic effect in vivo, we applied out SF-NPs to the rat model of articular cartilage defect. A schematic of this experiment is provided in Figure 5F. By comparing the mRNA (Figure 5G) and protein (Figure 5H) levels in hMSCs pellets from the defected sites at 6 weeks after transplantation, we confirmed that rats that received hMSCs transfected with SF-NPs carrying SOX9 pDNA expressed COLII more strongly than those transplanted with non-treated hMSCs. T4 cells transfected with SF-NPs expressed COLII at levels similar to those in T1 cells. Consequently, animals that received hMSCs transfected with SF-NPs carrying SOX9 pDNA, whether the cells were at T1 or T4, recovered to a greater extent than animals receiving non-treated hMSCs, as confirmed by macroscopic observation (Figure 5I).
In all of these experiments, hMSCs treated with SF-NPs carrying SOX9 pDNA were capable of undergoing chondrogenic differentiation without DNA damage, senescence, or cell death. Based on these observations, our experimental approach could provide a basis for overcoming a major limitation of stem cell therapy. The use of stem cells as therapeutics is constrained by their proliferation efficiency, which decreases as they undergo multiple passages. In our hands, however, the cells exhibited no loss of viability even as they underwent subculture. Furthermore, the ability to differentiate was maintained from passage 4 (T1, the time of transfection with SF-NPs carrying SOX9 pDNA) to passage 7 (T4). Taken together, our observation confirms that stem cells could be used in cell therapy.
The properties of nanoparticles are strongly influenced by their size and surface characteristics, and surface-modified nanoparticles can be more efficiently transferred into stem cells than unmodified particles. In the future, further modifications, including penetrating peptides, lipids, and multifunctional polymers, could be used to improve targeting. Moreover, it may also be possible to use nanoparticles to introduce genes into reproductive cells and embryos, which are difficult to penetrate using existing technologies [30-32].
Conclusions
We successfully fabricated SF-NPs coupled to SOX9 pDNA, which triggered chondrogenic differentiation when they were transfected into hMSCs. At passage 7, the transfected hMSCs underwent more extensive differentiation. Although SOX9 pDNA-coupled SF-NPs were initially present in transplanted cells, they eventually disappeared. Furthermore, the inorganic materials used in this study did not affect genome integrity or increase the mutation rate, even over long-term subculture. These novel SF-NPs could be used as a platform for numerous theranostic applications.
Abbreviations
SF-NP: Sunflower-type nanoparticle; QD: quantum dot; hMSCs: human mesenchymal stem cells; CNV: copy number variation; SNP: single-nucleotide polymorphism.
Acknowledgements
This work was supported by grants from the National Research Foundation (NRF) of Korea (NRF-2017R1A2A1A05001264, 2017M3A9C6061360, 2017M3A9B4031169, and NRF-2018R1D1A1B07040353), funded by the Korean Government.
Supplementary Material
Supplementary figures and tables.
Competing Interests
The authors have declared that no competing interest exists.
References
1. Chen Y, Shi J. Chemistry of Mesoporous Organosilica in Nanotechnology: Molecularly Organic-Inorganic Hybridization into Frameworks. Adv Mater. 2016;28:3235-72
2. Chen WH, Luo GF, Qiu WX, Lei Q, Liu LH, Wang SB. et al. Mesoporous silica-based versatile theranostic nanoplatform constructed by layer-by-layer assembly for excellent photodynamic/chemo therapy. Biomaterials. 2017;117:54-65
3. Mai HD, Rafiq K, Yoo H. Nano Metal-Organic Framework-Derived Inorganic Hybrid Nanomaterials: Synthetic Strategies and Applications. Chemistry. 2017;23:5631-51
4. Falagan-Lotsch P, Grzincic EM, Murphy CJ. New Advances in Nanotechnology-Based Diagnosis and Therapeutics for Breast Cancer: An Assessment of Active-Targeting Inorganic Nanoplatforms. Bioconjug Chem. 2017;28:135-52
5. Richards D, Ivanisevic A. Inorganic material coatings and their effect on cytotoxicity. Chem Soc Rev. 2012;41:2052-60
6. Choi H, Nicolaescu R, Paek S, Ko J, Kamat PV. Supersensitization of CdS quantum dots with a near-infrared organic dye: toward the design of panchromatic hybrid-sensitized solar cells. ACS Nano. 2011;5:9238-45
7. Jatana S, Palmer BC, Phelan SJ, Gelein R, DeLouise LA. In vivo quantification of quantum dot systemic transport in C57BL/6 hairless mice following skin application post-ultraviolet radiation. Part Fibre Toxicol. 2017;14:12
8. Li X, Yang X, Yuwen L, Yang W, Weng L, Teng Z. et al. Evaluation of toxic effects of CdTe quantum dots on the reproductive system in adult male mice. Biomaterials. 2016;96:24-32
9. de Carvalho SM, Mansur AAP, Mansur HS, Guedes M, Lobato ZIP, Leite MF. In vitro and in vivo assessment of nanotoxicity of CdS quantum dot/aminopolysaccharide bionanoconjugates. Mater Sci Eng C Mater Biol Appl. 2017;71:412-24
10. Soenen SJ, Montenegro JM, Abdelmonem AM, Manshian BB, Doak SH, Parak WJ. et al. The effect of nanoparticle degradation on amphiphilic polymer-coated quantum dot toxicity: the importance of particle functionality assessment in toxicology [corrected]. Acta Biomater. 2014;10:732-41
11. Mazuel F, Espinosa A, Luciani N, Reffay M, Le Borgne R, Motte L. et al. Massive Intracellular Biodegradation of Iron Oxide Nanoparticles Evidenced Magnetically at Single-Endosome and Tissue Levels. ACS Nano. 2016;10:7627-38
12. Mazuel F, Espinosa A, Radtke G, Bugnet M, Neveu S, Lalatonne Y. et al. Magneto-Thermal Metrics Can Mirror the Long-Term Intracellular Fate of Magneto-Plasmonic Nanohybrids and Reveal the Remarkable Shielding Effect of Gold. Advanced Functional Materials. 2017;27:1605997
13. Tang Y, Han S, Liu H, Chen X, Huang L, Li X. et al. The role of surface chemistry in determining in vivo biodistribution and toxicity of CdSe/ZnS core-shell quantum dots. Biomaterials. 2013;34:8741-55
14. Wang D, Chen H, Li H, He Q, Ding X, Deng L. Detection of Staphylococcus aureus carrying the gene for toxic shock syndrome toxin 1 by quantum-dot-probe complexes. J Fluoresc. 2011;21:1525-30
15. Zhao Y, Goncharova LV, Zhang Q, Kaghazchi P, Sun Q, Lushington A. et al. Inorganic-Organic Coating via Molecular Layer Deposition Enables Long Life Sodium Metal Anode. Nano Lett. 2017;17:5653-9
16. Mrakovcic M, Absenger M, Riedl R, Smole C, Roblegg E, Frohlich LF. et al. Assessment of long-term effects of nanoparticles in a microcarrier cell culture system. PLoS One. 2013;8:e56791
17. Cheng LC, Jiang X, Wang J, Chen C, Liu RS. Nano-bio effects: interaction of nanomaterials with cells. Nanoscale. 2013;5:3547-69
18. Mendes PM. Cellular nanotechnology: making biological interfaces smarter. Chem Soc Rev. 2013;42:9207-18
19. Yang HN, Park JS, Jeon SY, Park W, Na K, Park KH. The effect of quantum dot size and poly(ethylenimine) coating on the efficiency of gene delivery into human mesenchymal stem cells. Biomaterials. 2014;35:8439-49
20. Park JS, Yi SW, Kim HJ, Kim SM, Shim SH, Park KH. Sunflower-type nanogels carrying a quantum dot nanoprobe for both superior gene delivery efficacy and tracing of human mesenchymal stem cells. Biomaterials. 2016;77:14-25
21. De Vuyst L, Camu N, De Winter T, Vandemeulebroecke K, Van de Perre V, Vancanneyt M. et al. Validation of the (GTG)(5)-rep-PCR fingerprinting technique for rapid classification and identification of acetic acid bacteria, with a focus on isolates from Ghanaian fermented cocoa beans. Int J Food Microbiol. 2008;125:79-90
22. Rabbee N, Speed TP. A genotype calling algorithm for affymetrix SNP arrays. Bioinformatics. 2006;22:7-12
23. Park JS, Yi SW, Kim HJ, Kim SM, Kim JH, Park KH. Construction of PLGA Nanoparticles Coated with Polycistronic SOX5, SOX6, and SOX9 Genes for Chondrogenesis of Human Mesenchymal Stem Cells. ACS Appl Mater Interfaces. 2017;9:1361-72
24. Yan Y, Lai ZW, Goode RJ, Cui J, Bacic T, Kamphuis MM. et al. Particles on the move: intracellular trafficking and asymmetric mitotic partitioning of nanoporous polymer particles. ACS Nano. 2013;7:5558-67
25. Martins-Taylor K, Xu RH. Concise review: Genomic stability of human induced pluripotent stem cells. Stem Cells. 2012;30:22-7
26. Wu H, Kim KJ, Mehta K, Paxia S, Sundstrom A, Anantharaman T. et al. Copy number variant analysis of human embryonic stem cells. Stem Cells. 2008;26:1484-9
27. DeBoever C, Li H, Jakubosky D, Benaglio P, Reyna J, Olson KM. et al. Large-Scale Profiling Reveals the Influence of Genetic Variation on Gene Expression in Human Induced Pluripotent Stem Cells. Cell Stem Cell. 2017;20(e7):533-46
28. Lewinski N, Colvin V, Drezek R. Cytotoxicity of nanoparticles. Small. 2008;4:26-49
29. Manshian BB, Soenen SJ, Brown A, Hondow N, Wills J, Jenkins GJ. et al. Genotoxic capacity of Cd/Se semiconductor quantum dots with differing surface chemistries. Mutagenesis. 2016;31:97-106
30. Dowaidar M, Abdelhamid HN, Hallbrink M, Freimann K, Kurrikoff K, Zou X. et al. Magnetic Nanoparticle Assisted Self-assembly of Cell Penetrating Peptides-Oligonucleotides Complexes for Gene Delivery. Sci Rep. 2017;7:9159
31. Sanwlani S, Rawat K. et al. Cellular uptake induced biotoxicity of surface-modified CdSe quantum dots. Journal of Nanoparticle Research. 2014;16:2382
32. Zhao W, Jin L, Yuan H, Tan Z, Zhou C, Li LS. et al. Targeting human embryonic stem cells with quantum dot-conjugated phages. Sci Rep. 2013;3:3134
Author contact
![]() Corresponding authors: Prof. Sung Han Shim (shshimac.kr) and Prof. Keun-Hong Park (pkh0410ac.kr)
Corresponding authors: Prof. Sung Han Shim (shshimac.kr) and Prof. Keun-Hong Park (pkh0410ac.kr)