Impact Factor
- Issue 14; 2026
- Issue 13; 2026
- Issue 12; 2026
- Issue 11; 2026
- Issue 10; 2026
- Volume 16; 2026
- Advance Articles
- Past Issues
- Cover Images
- Cover Suggestion
- Index & Coverage
- Special Issues
Introduction
Methods
Results
Discussion
Abbreviations
Supplementary Material
Acknowledgements
References
International Journal of Biological Sciences
International Journal of Medical Sciences
 Global reach, higher impact

Theranostics 2018; 8(20):5690-5702. doi:10.7150/thno.28742 This issue Cite
Research Paper
Clinical significance of PD-1/PD-Ls gene amplification and overexpression in patients with hepatocellular carcinoma
Li-Jie Ma1*, Fei-Ling Feng2*, Liang-Qing Dong1*, Zhao Zhang1, Meng Duan1, Long-Zi Liu1, Jie-Yi Shi1, Liu-Xiao Yang1, Zhi-Chao Wang1, Shu Zhang1, Zhen-Bin Ding1, Ai-Wu Ke1, Ya Cao3, Xiao-Ming Zhang4, Jian Zhou1,5, Jia Fan1,5, Xiao-Ying Wang1 ![]() , Qiang Gao1,6
, Qiang Gao1,6 ![]()
1. Department of Liver Surgery and Transplantation, Liver Cancer Institute, Zhongshan Hospital, Fudan University; Key Laboratory of Carcinogenesis and Cancer Invasion of Ministry of Education, Shanghai, China
2. Department of Biliary Surgery, Eastern Hepatobiliary Surgical Hospital, Naval Military Medical University, Shanghai 200082, China
3. Key Laboratory of Carcinogenesis and Invasion, Chinese Ministry of Education, Xiangya Hospital, Central South University, Changsha 410078, China
4. Key Laboratory of Molecular Virology and Immunology, Institute Pasteur of Shanghai, Chinese Academy of Sciences, Shanghai 200032, China
5. Key Laboratory of Medical Epigenetics and Metabolism, Institutes of Biomedical Sciences, Fudan University, Shanghai, China
6. State Key Laboratory of Genetic Engineering, Fudan University, Shanghai 200433, China
* These authors contributed equally to this work.
Received 2018-7-24; Accepted 2018-10-4; Published 2018-11-10
Abstract

Background: The remarkable clinical activity of PD-1 antibody in advanced hepatocellular carcinoma (HCC) highlights the importance of PD-1/PD-L1-mediated immune escape as therapeutic target in HCC. However, the frequency and prognostic significance of PD-Ls genetic alterations in HCC remain unknown.
Methods: Fluorescence in situ hybridization were used to determine PD-Ls genetic alterations, and qPCR data coupled with immunofluorescence were used to measure the mRNA and protein levels of PD-Ls. Clinical relevance and prognostic value of 9p24.1 genetic alterations were investigated on tissue microarray containing three independent cohorts of 578 HCC patients. The results were further validated in an independent cohort of 442 HCC patients from The Cancer Genome Atlas (TCGA) database.
Results: In total, 7.1%-15.0% for amplification and 15.8%-31.3% for polysomy of 9p24.1 were revealed in three cohorts of HCC patients, similar to the objective response rate of PD-1 antibody in HCC. Patients with 9p24.1 genetic alterations significantly and independently correlated with unfavorable outcomes than those without. FISH and qPCR data coupled with immunofluorescence revealed that genetic alterations of 9p24.1 robustly contributed to PD-L1 and PD-L2 upregulation. In addition, increased expression of PD-L1 instead of PD-L2 also predicted poor survival by multivariate analyses. Meanwhile, high infiltration of PD-1+ immune cells also indicated dismal survival in HCC.
Conclusions: Amplification or higher expression of PD-L1 significantly and independently correlated with unfavorable survival in HCC patients, authenticating the PD-1/PD-L1 axis as rational immunotherapeutic targets for HCC.
Keywords: hepatocellular carcinoma, PD-Ls, genetic alteration, FISH, prognosis
Introduction
Hepatocellular carcinoma (HCC) is the sixth most common cancer and the second leading cause of cancer mortality globally [1]. Limited treatment options and high recurrence rate pose an imminent need for the discovery of new therapeutic interventions [2]. Targeted therapy has so far been deplorable in HCC, with limited objective response rates in first-line sorafenib (2-3%) and second-line regorafenib (7%) [3]. Recent breakthroughs in cancer immunotherapy have revolutionized the way of cancer treatment, including HCC, in the era of precision medicine [4].
Indeed, immune-checkpoint inhibitor targeting PD-1 and PD-L1 has been a promising therapeutic approach in the treatment of various human cancers, resulting in durable objective responses and prolonged survival [5-7]. PD-1 engages its ligands, PD-L1 and PD-L2, delivers inhibitory signals that regulate the balance between T-cell exhaustion, tolerance, and immunopathology [8]. Tumor cells expressing PD-1 ligands on their surface use the PD-1 pathway to attenuate tumor immunity and facilitate tumor progression [9]. The critical importance of PD-1/PD-L1-mediated immune escape was acknowledged in HCC after the successful treatment of nivolumab in advanced HCC patients, achieving an objective response rate of 15-20% [10]. Nevertheless, the off-target effect and relatively low response rate remains a major obstacle. Therefore, identification of predictors of response is a priority for personalized anti-PD-1/PD-L1 therapy in HCC.
Among others, PD-L1 expression by immunohistochemistry has been advocated as a predictor to response of anti-PD-1 therapy and incorporated as a biomarker in clinical trials [9]. We and others have previously shown that elevated PD-L1 expression in HCC significantly correlated dismal survival and tumor aggressiveness [11-14]. However, conflicting data also existed, reporting high expression of PD-L1 in HCC as a prognosticator for better survival [15, 16]. This discrepancy may be ascribed to differences in patient cohorts, antibodies used, IHC platforms and scoring systems. Moreover, elevated PD-L1 expression within tumor cells or tumor microenvironment is dynamic result of cell intrinsic and extrinsic events [17]. For example, amplification of chromosome 9p24.1 containing PD‑L1 and PD-L2 genes positively correlated with PD-L1 expression and predicted clinical outcome in both hematological and solid tumors [18, 19]. However, the prevalence and clinical significance of genetic alterations of PD-1 ligands loci in HCC have yet to be clarified.
To give a comprehensive view of 9p24.1/PD-L1/PD-L2 alterations in HCC, herein, we combined fluorescent in situ hybridization (FISH), multiplex immunofluorescence and real-time RT-PCR (qPCR) in three independent cohorts comprising 578 resected HCC patients. We assessed the consistency and reproducibility of genetic, transcriptomic and proteomic analyses of PD-1 ligands and their association with patients' clinical outcomes. This strategy provides a novel orientation for the discovery and validation of targeted immunotherapy for HCC.
Methods
Study population
Two independent cohorts of HCC patients underwent primary resection at Zhongshan Hospital of Fudan University in 2006 (training cohort, n = 240) and 2010 (validation cohort, n = 258) respectively were retrospectively analyzed and enrolled in this study (Table S1). The inclusion and exclusion criteria of patients, postoperative surveillance, and treatment modalities have been described previously [20]. Overall survival (OS) and time to recurrence (TTR) were defined as the interval from the date of surgery to death and tumor recurrence, respectively. Patients without recurrence or death were censored at the last follow-up. No significant differences in the clinic-pathologic features were found between the training and validation cohorts. No significant differences were found between 9p24.1 amplification and any post-operative treatments. The study was approved by the Research Ethics Committee of Zhongshan Hospital, with written informed consent obtained from each patient. For further validation in an external independent cohort, a series of 80 HCC patients treated from Jan 2007 to Mar 2008 at Eastern Hepatobiliary Surgery Hospital, Naval Military Medical University was enrolled, with a median follow-up of 32 months (range, 1.0-105.0; SD, 27.6). Clinical data sets in 442 HCC patients were publicly obtained from The Cancer Genome Atlas (TCGA) project: http://www.cbioportal.org.
Tissue microarray construction
Tissue microarrays (TMA) were produced as previously described [11]. All HCC cases enrolled were histologically inspected by H&E staining and representative areas were premarked on the paraffin blocks, away from necrotic and hemorrhagic regions. Duplicates of 1-mm-diameter cylinders from two different areas, tumor center and noncancerous liver (designated as intratumor and peritumor, respectively; a total of four cores) were included in each case, along with different controls, to ensure reproducibility and homogenous staining of the slides. Sections of 4 μm thickness were placed on 3-aminopropyltriethoxysilane-coated slides (Shanghai Biochip).
Fluorescence in situ hybridization (FISH)
FISH was performed according to the manufacturer's protocols. The Red-labeled CD274/PD-L1, Green-labeled CD273/PD-L2, and Aqua-labeled CEN9q, a control centromeric probe that maps to 9q21 (CD274/CD273/CEN9q FISH Probe, FG0191, Abnova), were applied as locus specific FISH probes. 4',6-diamidino-2-phenylindole DAPI (FG0191, Abnova) was used for nuclear staining. All probes were validated by hybridization to the chromosomal metaphase of lymphocytes to confirm chromosomal numbers and loci. Briefly, after deparaffinization and hydration, sections were immersed in 1× paraffin pretreatment solution (FFPE FISH Pretreatment kit1, KA2375, Abnova) at 95°C for 30 minutes, 2 × saline-sodium citrate buffer (SSC) for 5 minutes two times, and then underwent proteolytic digestion by protease solution (FFPE FISH Pretreatment kit1, KA2375, Abnova) at 37°C for 15 minutes. After gradient immersion in 2 × SSC, 70% ethanol and 100% ethanol, slides were co-denatured at 75°C for 5 minutes, hybridized 48 hours at 37°C in a darkened humid chamber. Finally, slides were mounted and counterstained with DAPI before being analyzed with an Olympus BX51 fluorescence microscope. Individual images were captured using an Applied Imaging system running CytoVision Genus version 4.6. Nuclei with a PD-L1 or PD-L2: CEN9q ratio of 1:1 was defined as normal copy number (disomy), 2-3:1 as polysomy, and >=3:1 as amplification. At least 100 nuclei were evaluated for each case, and cases were classified by the highest level of 9p24.1 alterations, which were called when exceeding a 20% threshold in the number of nuclei [21].
Multiplexed immunofluorescence staining
Multiplex immunofluorescence staining was performed according to the manufacturer's protocol. Triple staining of PD-1 (clone NAT105, Biolegend), PD-L1 (clone SP142, Genetech) and PD-L2 (clone D7U8C™, Cell Signaling Technology) was performed by the Vectra Automated Quantitative Pathology Imaging and Analysis platform through multispectral imaging system and inForm™ image analysis software from PerkinElmer's phenoptics research solution. Slides were first deparaffinized and rehydrated, followed by microwave antigen retrieval (pH = 9.0, ADI-950-274-0500, ENZO). After blocking endogenous peroxidase and nonspecific binding sites (ZAE-ICT-6295-L100, ENZO), primary Abs and secondary HRP-conjugated polymers (MPX-2402, Vectorlabs) were applied. Each HRP-conjugated polymer covalently binds a distinct fluorophore using tyramide signal amplification (Opal 7-color Fluorophore TSA plus Fluorescence Kit (NEL 797001KT; PerkinElmer)). This covalent reaction was followed by additional antigen retrieval (pH = 6.0, ADI-950-270-0500, ENZO) to remove background signal before next step. The process was conducted for the following antibodies/fluorescent dyes, in order: anti-PD-L1/Opal-570, anti-PD-1/Opal-690, anti-PD-L2/Opal-520. After three sequential reactions, slides were counterstained with DAPI (D9542, Sigma) and mounted with fluorescence mounting medium (S3023, Dako).
Multispectral imaging, spectral unmixing and analysis
A workflow enabling simultaneous evaluation of multiple biomarkers on TMA was established. Slides from full HCC FFPE blocks were utilized in the initial optimization of the multiplex tissues, using the spleen and tonsil as positive controls (Figure S1). Schematic overview of 4-colors sequential immunofluorescence and image visualization protocol was summarized in Figure S2. Briefly, multiplex stained TMA slides were scanned using the Vectra multispectral automated microscope (PerkinElmer), where original images comprising four combined 200 multispectral image cubes. Multispectral images for each TMA core was created by stitching images captured every 10 nm across the range of five filter cubes comprising DAPI (440-680 nm), FITC (520 nm-680 nm), Cy3 (570-690 nm), Texas Red (580-700 nm) and Cy5 (670-720 nm). A spectral library was produced by the supervised machine learning algorithms within Inform 2.1 (PerkinElmer). Individual components were separated from each multispectral image by this spectral library (spectral unmixing). The spectrally unmixed and segmented images were subjected to a distinctive phenotyping algorithm for identification of each DAPI-stained cell according to each fluorophore expression and nuclear/cell morphological features. For each marker (PD-1/PD-L1/PD-L2), the cutoff for positivity was decided according to the staining pattern and intensities on all images. All quantifications were evaluated blinded to patient clinical outcomes. The modified H-scores for PD1, PD-L1 and PD-L2 (percentage of tumor cells with positive staining multiplied by the average intensity of positive staining) were divided into four equally sized groups (quartiles).
RNA isolation and real-time reverse transcription polymerase chain reaction
Total RNA was extracted and purified from fresh frozen tissues (n=192) using the Trizol reagent (15596026; Invitrogen) and reverse transcribed to cDNA with PrimeScript RT reagent kit (DRR037A; Takara). For q-RT-PCR, SYBR Premix ExTaq (DRR081; Takara) was used according to the manufacturer's instructions with Applied Biosystems 7900HT Sequence Detection System, and triplicate reactions were performed. Sequence of primers for qPCR are designed as: PD-1 forward primer: 5'-CCCAAGGCGCAGATCAA-3', reverse primer: 5'-GCACTTCTGCCCTTCTCTCTGT-3'; PD-L1 forward primer: 5'-GGTGCCGACTACAAGCGAAT-3', reverse primer: 5'-AGCCCTCAGCCTGACATGTC-3'; PD-L2 forward primer: 5'-TGGCATTTGCTGACGCATTT-3', reverse primer: 5'-TGCAGCCAGGTCTAATTGTTTT-3'; GAPDH forward primer: 5'-ACAACTTTGGTATCGTGGAAGG-3', reverse primer: 5'-GCCATCACGCCACAGTTTC-3'.
Statistical analysis
Data were expressed as the means ± SEM, and error bars refer to SEM in figures. The association between variables was analyzed using Spearman's rank correlation, Student's t test, chi-square test, Fisher exact test, Kruskal-Wallis test, or one-way ANOVA when appropriate. Two-sided P < 0.05 was considered statistically significant. The survival curves were estimated by the Kaplan-Meier method and compared by the log-rank test. Multivariable Cox proportional hazards models were performed to analyze the independent prognostic factors. Statistical analyses were conducted with SPSS version 20.0 (IBM), Matlab_R2015b and GraphPad Prism 6.0.
Results
Genetic Analyses of the CD274 (PD-L1) and CD273 (PD-L2) Loci in HCC
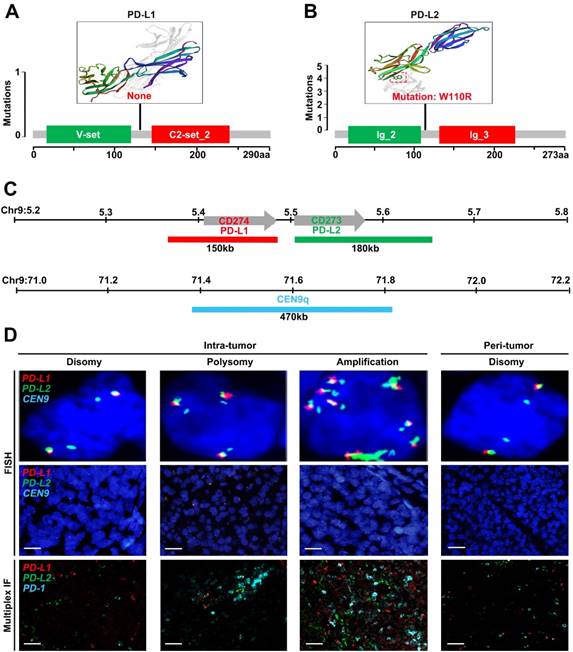
We first sought for mutations affecting the CD274 or CD273 gene from The Cancer Genome Atlas (TCGA) database. However, no somatic mutations in CD274 were found among 442 HCC samples (Figure 1A), and only one mutation in CD273 was detected (Figure 1B). To further characterize genetic alterations of PD-L1/PD-L2 in HCC, we examined copy number variations of CD274 and CD273 (Figure 1C). Tumor cells were checked and classified by the highest observed level of 9p24.1 alterations, and then scored as disomy, polysomy and amplification. Representative FISH images were shown in Figure 1D, with corresponding multispectral immunofluorescence images of PD-L1/PD-L2/PD1 in the bottom panel, which had concordant alterations with the PD-L1 and PD-L2 loci.
Genetic and immunofluorescence analyses of the PD-L1 and PD-L2 loci and PD-1 ligand expression in HCC. (A-B) Distribution of mutation identified in three-dimensional structures on the protein sequence and domain structure of PD-L1 and PD-L2, is detected and depicted from 442 HCC tumor tissues in TCGA database. Hotspot mutation of W110R in PD-L2 is shown in red. (C) Location and color labeling of the CD274/CD273/CEN9q probe on 9p24.1 used for fluorescent in situ hybridization (FISH). The red-labeled CD274/PD-L1, green-labeled CD273/PD-L2 and aqua-labeled CEN9q, a control centromeric probe that maps to 9q21. (D) The top panel shows representative images of FISH results for the various categories, scored as disomy, polysomy, amplification in tumor tissue and disomy in peritumor tissue. PD-L1 in red, PD-L2 in green, fused signals in yellow, and centromeric probe (CEP9q) in aqua. The bottom panel shows corresponding multispectral immunofluorescence (mIF) of PD-L1 (red)/PD-L2 (green)/PD-1(aqua) in the HCC cases with 9p24.1 disomy, polysomy and amplification from top panel. Scale bar=100 μm.
Frequency of the 9p24.1 alterations in HCC
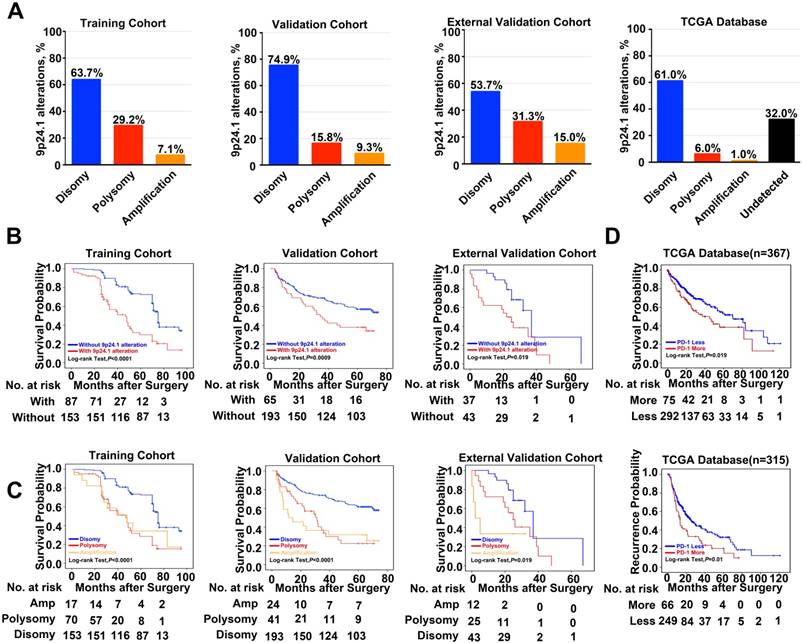
A total of 578 HCC patients, derived from three independent cohorts, were analyzed. 9p24.1 alterations were not evenly scattered in HCC cells throughout vast majority of cases, similar to their variation fashion in gastric cancer [22] and glioblastoma [23]. However, 9p24.1 amplification was only detected in tumor cells, but not in infiltrating immune cells. Among all 240 cases in the training cohort, 153 patients (63.7%) had normal 9p24.1 copy number (disomy), 70 patients (29.2%) had polysomy of 9p24.1, and 7.1% (17 patients) had 9p24.1 amplification. In the validation cohort (n=258), the case numbers were 24 (9.3%) for amplification, 41 (15.8%) for polysomy, and 193 (74.9%) for disomy regarding the status of 9p24.1 alterations. In the external independent cohort (n = 80), similar frequencies of disomy (53.7%), polysomy (31.3%), and amplification (15.0%) in 9p24.1 were observed. These findings were also validated by genomic sequencing data from 442 HCC patients in TCGA database, confirming the presence of 9p24.1 alterations and its potential value in HCC (Figure 2A).
Frequency and prognostic significance of the 9p24.1 alterations in HCC. (A) 9p24.1 alterations evaluated in training, validation, external validation cohorts and TCGA database. HCC are classified by the highest observed level of 9p24.1 alteration in tumor cells: disomy (blue), polysomy (red), amplification (gold) and undetected (black). Percentages of patients with 9p24.1 disomy, polysomy, amplification were summarized. (B) Kaplan-Meier curves showing dismal survival in patients with (red) 9p24.1 alterations than those without (blue) in three independent cohorts. (C) Kaplan-Meier curves showing poorest survival in patients with 9p24.1 amplification (gold) than those with polysomy (red) or disomy (blue) in three independent cohorts. (D) Kaplan-Meier curves showing significant unfavorable survival (n = 367) and increased recurrence (n = 315) in patients with more PD-1 copy number (red) than those with less PD-1 copy number (blue) in TCGA database.
Prognostic significance of 9p24.1 alterations in HCC
Next, we assessed potential associations of 9p24.1 alterations with clinical risk factors and patient outcomes. First, postoperative outcomes were compared between patients with and without 9p24.1 alterations. In training cohort, patients with 9p24.1 alterations had significantly poorer OS (48.5 months versus 71.6 months, P < 0.001; Figure 2B), but not TTR (55.9 months versus 63.1 months, P = 0.392; Table S2), than those without 9p24.1 alterations. Similarly, in validation cohort, patients with 9p24.1 alterations showed both increased recurrence and dismal survival (OS, 34.4 months; TTR, 38.5 months) than those without 9p24.1 alterations (OS, 46.7 months, P = 0.0009; TTR, 72.0 months, P = 0.024). Likewise, in external validation cohort, patients with 9p24.1 alterations showed shorter median OS and TTR than those without 9p24.1 alterations in OS (22.9 months versus 54.9 months, P = 0.019), but not in TTR (15.2 months versus 32.7 months, P = 0.843). Furthermore, using median as the cutoff value, we investigated the prognostic significance of PD-Ls' relative linear copy number values in 129 HCC cases from TCGA database, and difference in OS was revealed but not reached statistical significance (63.1 months versus 78.9 months, P = 0.273, log-rank test; data not shown), possibly owing to different specimen sources and therapeutic schedules.
Then, patients were further classified into three groups according to disomy, polysomy and amplification of 9p24.1 in each cohort. Patients with polysomy or amplification had significantly poorer OS than those with disomy (training cohort, P < 0.0001; validation cohort, P < 0.0001; external validation cohort, P = 0.019; log-rank test; Figure 2C). Intriguingly, differences did not reach statistical significance between polysomy and amplification groups in each cohort, indicating that 9p24.1 alterations were highly detrimental to patient prognosis irrespective of dosage. In addition, we also investigated the associations between genetic alteration of PD-1 and patient outcome in TCGA database. Patients with PD-1 alterations (more copy number) had significantly poorer prognosis than PD-1 copy normal patients in OS (n = 367, 49.7 months versus 65.7 months, P = 0.019; log-rank test), and also in TTR (n = 315, 25.6 months versus 42.4 months, P = 0.01; log-rank test) (Figure 2D).
Moreover, on multivariate analysis, status of 9p24.1 alterations were defined to be an independent prognostic factor for OS rather than TTR. Patients with 9p24.1 alterations were nearly two times more likely to suffer from death than patients without 9p24.1 alterations [training cohort: hazard ratio (HR), 1.54; 95% confidence interval (95% CI), 1.27-1.87, P < 0.001; validation cohort: HR, 2.01; 95% CI, 1.35-3.00, P = 0.001, Table 1].
Multivariate analysis of factors associated with OS and TTR.
| OS | TTR | |||||||||||
|---|---|---|---|---|---|---|---|---|---|---|---|---|
| Training cohort | Validation cohort | Training cohort | Validation cohort | |||||||||
| Characteristics | HR | 95%CI | P | HR | 95%CI | P | HR | 95%CI | P | HR | 95%CI | P |
| Serum AFP, ng/ml (>20 vs. ≤20) | NA | NA | NA | 1.70 | 1.01-2.87 | 0.046 | NA | NA | NA | 1.43 | 0.92-2.21 | 0.120 |
| Serum γ-GT, U/L (>54 vs. ≤54) | 1.54 | 1.05-2.26 | 0.026 | 0.97 | 0.47-1.99 | 0.928 | 1.21 | 0.78-1.86 | 0.393 | NA | NA | NA |
| Tumor size (cm) (>5 vs. ≤5) | 1.93 | 1.29-2.88 | 0.001 | 1.29 | 0.77-2.16 | 0.336 | 1.50 | 0.96-2.35 | 0.077 | 0.96 | 0.60-1.54 | 0.870 |
| Tumor multiplicity (multiple vs. single) | 0.99 | 0.63-1.54 | 0.956 | NA | NA | NA | 1.21 | 0.75-1.94 | 0.437 | NA | NA | NA |
| Tumor differentiation (poor vs. well) | 1.54 | 1.05-2.32 | 0.028 | 1.56 | 1.06-2.28 | 0.024 | 1.80 | 1.15-2.82 | 0.010 | 1.18 | 0.79-1.75 | 0.416 |
| Tumor encapsulation (yes vs. no) | 0.70 | 0.49-1.02 | 0.064 | 1.09 | 0.74-1.60 | 0.671 | NA | NA | NA | 1.09 | 0.74-1.59 | 0.669 |
| Vascular invasion (yes vs. no) | 1.34 | 0.89-2.02 | 0.157 | 1.34 | 0.85-2.10 | 0.205 | NA | NA | NA | 1.41 | 0.88-2.24 | 0.149 |
| TNM stage (III-II vs. I) | 1.48 | 0.92-2.36 | 0.103 | 1.50 | 0.94-2.39 | 0.089 | 0.93 | 0.55-1.59 | 0.798 | 1.72 | 1.08-2.73 | 0.023 |
| BCLC stage (B-C vs. 0-A) | 0.89 | 0.55-1.44 | 0.630 | 3.25 | 1.66-6.34 | 0.001 | 1.89 | 1.08-3.30 | 0.026 | 2.23 | 1.22-4.06 | 0.009 |
| 9p24.1 alteration (with vs. without) | 1.54 | 1.27-1.87 | <0.001 | 2.01 | 1.35-3.00 | 0.001 | NA | NA | NA | 1.43 | 0.92-2.21 | 0.112 |
NOTE: *Cox proportional hazards models in SPSS was performed to accomplish multivariate analysis.
Abbreviations: OS, overall survival; TTR, time to recurrence; AFP, alpha-fetoprotein; γ-GT, γ-glutamyltransferase; TNM, tumor-node-metastasis; BCLC, Barcelona Clinic Liver Cancer; NA, not applicable.
Furthermore, we evaluated the association of status of 9p24.1 alterations with patient clinicopathologic features. In training cohort, patients with 9p24.1 alterations positively correlated with high level of serum γ-GT (P = 0.007), larger tumor size (P = 0.011), and advanced TNM (P < 0.0001) or BCLC stages (P = 0.046) (Table 2). Likewise, in validation cohort, patients with 9p24.1 alterations positively correlated with larger tumor size (P = 0.015), presence of vascular invasion (P = 0.007), and advanced TNM (P = 0.015) or BCLC stages (P = 0.002) (Table 2). Therefore, 9p24.1 alterations in HCC may signify a dismal clinical outcome and tumor aggressiveness.
Correlations of clinic-pathologic characteristics with 9p24.1 alteration in HCC patients from training cohort (n = 240) and validation cohort (n = 258).
| Training cohort | Validation cohort | |||||
|---|---|---|---|---|---|---|
| Characteristics | With alteration | Without alteration | P* | With alteration | Without alteration | P* |
| Age, years | ||||||
| ≤51 | 33 | 60 | 0.844 | 38 | 93 | 0.152 |
| > 51 | 54 | 93 | 27 | 100 | ||
| Gender | ||||||
| Female | 16 | 32 | 0.638 | 7 | 31 | 0.297 |
| Male | 71 | 121 | 58 | 162 | ||
| HBsAg | ||||||
| Negative | 4 | 14 | 0.307† | 4 | 5 | 0.236† |
| Positive | 83 | 139 | 61 | 188 | ||
| HBcAb | ||||||
| Negative | 16 | 18 | 0.157 | 4 | 5 | 0.236† |
| Positive | 71 | 135 | 61 | 188 | ||
| AFP (ng/ml) | ||||||
| ≤20 | 36 | 55 | 0.404 | 27 | 72 | 0.544 |
| >20 | 51 | 98 | 38 | 121 | ||
| ALT (U/L) | ||||||
| ≤75 | 70 | 132 | 0.235 | 57 | 169 | 0.976 |
| >75 | 17 | 21 | 8 | 24 | ||
| γ-GT (U/L) | ||||||
| ≤54 | 35 | 89 | 0.007 | 15 | 36 | 0.438 |
| >54 | 52 | 64 | 50 | 157 | ||
| Liver cirrhosis | ||||||
| No | 13 | 25 | 0.776 | 8 | 23 | 0.933 |
| Yes | 74 | 128 | 57 | 170 | ||
| Tumor size (cm) | ||||||
| ≤5 | 41 | 98 | 0.011 | 21 | 96 | 0.015 |
| >5 | 46 | 55 | 44 | 97 | ||
| Tumor number | ||||||
| Single | 64 | 120 | 0.391 | 52 | 156 | 0.884 |
| Multiple | 23 | 33 | 13 | 37 | ||
| Vascular invasion | ||||||
| No | 53 | 100 | 0.491 | 32 | 131 | 0.007 |
| Yes | 34 | 53 | 33 | 62 | ||
| Tumor encapsulation | ||||||
| None | 38 | 56 | 0.280 | 24 | 86 | 0.282 |
| Complete | 49 | 97 | 41 | 107 | ||
| Tumor differentiation | ||||||
| I+II | 55 | 105 | 0.393 | 38 | 138 | 0.051 |
| III+IV | 32 | 48 | 27 | 55 | ||
| TNM stage | ||||||
| I | 72 | 89 | <0.0001 | 43 | 156 | 0.015 |
| II+III | 15 | 64 | 22 | 37 | ||
| BCLC stage | ||||||
| 0-A | 30 | 73 | 0.046 | 14 | 83 | 0.002 |
| B-C | 57 | 80 | 51 | 110 | ||
NOTE: *The Pearson Chi square test was applied. †Chi-square with Yates' correction was applied.
Abbreviations: HCC, hepatocellular carcinoma; HBsAg, hepatitis B surface antigen; HBcAb, hepatitis B center antibody; AFP, alpha-fetoprotein; ALT, alanine transaminase; γ-GT, γ-glutamyltransferase; TNM, tumor-node-metastasis; BCLC, Barcelona Clinic Liver Cancer.
PD-Ls' mRNA expression correlated with genetic alteration and immunostaining intensity
Various signaling pathways and transcriptional factors were involved in regulating PD-Ls' expression [24]. To explored whether 9p24.1 alterations could lead to up-regulation of PD-Ls transcription in HCC, we assessed the relationship between 9p24.1 alterations and mRNA expression of PD-Ls. The mRNA expression data were available for a subset of 192 cases from training cohort (192/240). Indeed, mRNA expression of PD-Ls significantly and positively correlated with 9p24.1 polysomy/amplification (Figure 3A). These results were validated by relative linear copy number values obtained from TCGA database (n = 364) (Figure 3B). In addition, significantly negative correlations were observed between PD-1/PD-Ls DNA methylation and mRNA expression in HCC from TCGA database (n = 373) (Figure S3A).
Descriptive and correlational analyses of transcriptional/translational level of PD-L1/PD-L2 and 9p24.1 copy number alterations in HCC patients. (A) The distribution of transcriptional level in each group of the 9p24.1 copy number alterations (n = 192). The y-axis shows relative mRNA level of PD-Ls; the x-axis indicates status of 9p24.1 alterations. A statistically significant increase in relative mRNA level was found in the 9p24.1 amplification subgroups than those in polysomy or disomy. (B) The distribution features of transcriptional level in each group of the PD-L1/PD-L2/PD-1 copy number alterations are validated by RNA seq data from TCGA database (n = 363). The y-axis shows mIF H-score; the x-axis indicates status of 9p24.1 alterations. Data were presented as means ± SEM. *P < 0.05, **P < 0.01, and ***P < 0.001; two-tailed Student's t test. (C) Correlation analysis of PD-L1/PD-L2/PD-1 translational levels and corresponding transcriptional levels in training cohort (n = 192). Significant positive correlations are found between the mIF H-score and relative mRNA level in PD-L1/PD-L2/PD-1. (D) Significant positive correlations are uncovered between PD-Ls and PD-1 in mRNA levels in training cohort (n = 192). Pearson correlation analysis.
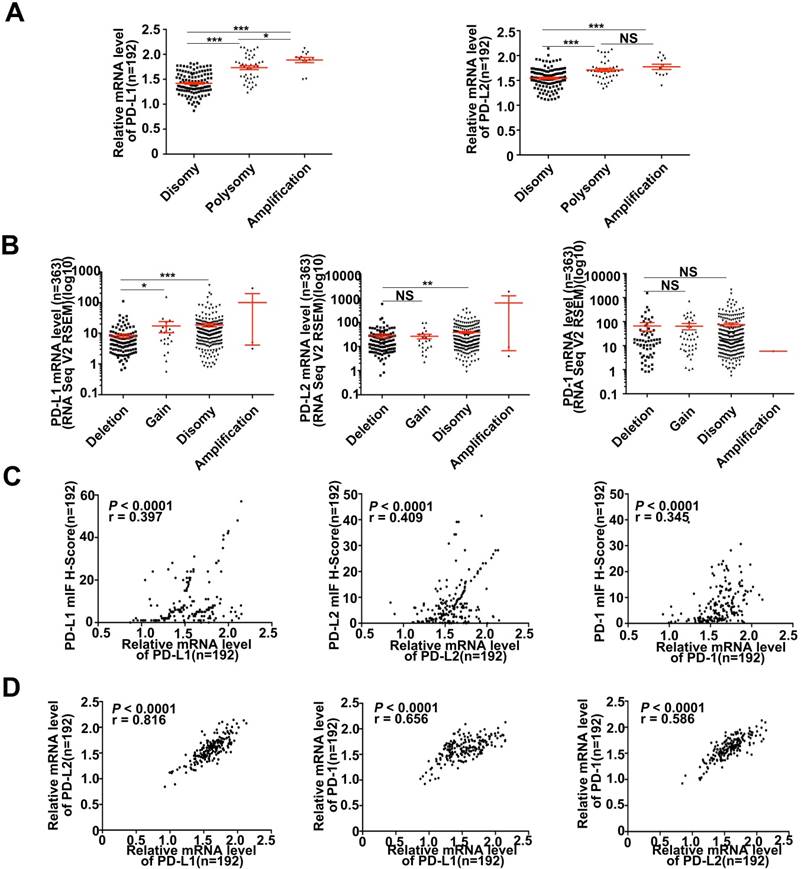
Likewise, significant positive correlations were found between PD-Ls mRNA levels and protein expression determined by multi-immunostaining (PD-L1, P < 0.0001, r = 0.397; PD-L2, P < 0.0001, r = 0.409; PD-1, P < 0.0001, r = 0.345; n = 192) (Figure 3C). Interestingly, markedly positive correlations were also observed among mRNA expression of PD-1 and PD-Ls, as well as between PD-L1 and PD-L2 (PD-L1/PD-1, P < 0.0001, r = 0.656; PD-L2/PD-1, P < 0.0001, r = 0.586; PD-L1/PD-L2, P < 0.0001, r = 0.816; n = 192; Figure 3D). In line with our results, transcriptome sequencing data obtained from TCGA database (n = 364) validated these findings (Figure S3B and 3C).
Considering the positive correlation between PD-Ls' mRNA with genetic alteration and immunostaining intensity, we further evaluated the influence of their mRNA expression on patient outcome. Patients were classified into two subgroups (high expression and low expression) according to the optimal cutoff determined by ROC curve. However, differences in both OS and TTR were not significant between these two groups (data not shown).
Prognostic value and relationship with genetic alterations of PD-Ls' protein expression
In this study, we find that PD-Ls proteins can be expressed in both tumor cells and infiltrating immune cells in tumor tissues. However, 9p24.1 amplification was only detected in tumor cells, but not in infiltrating immune cells. In that case, we only focused on PD-Ls expression in tumor cells. We further assessed the relationship between genetic alterations and immunostaining intensity of PD-Ls (Figure S3). Significant positive correlations were detected between increased PD-Ls' protein expression and 9p24.1 amplification/polysomy in training, validation and external independent cohorts (Figure 4A-C).
Prognostic value and relationship with genetic alterations of PD-Ls/PD-1' protein expression. (A-C) The distribution of PD-Ls' translational level in each group of the 9p24.1 copy number alterations evaluated in training, validation and external validation cohorts. Data were presented as means ± SEM. *P < 0.05, **P < 0.01, and ***P < 0.001; two-tailed Student's t test. (D-F) Kaplan-Meier curves showing dismal survival and increased recurrence in patients with high PD-Ls expression (red) than those with low (blue) in three independent cohorts. (G) Kaplan-Meier curves showing poorer survival and increased recurrence in patients with high-dense PD-1+ immunocytes infiltration (red) than those with low-dense (blue) in training and validation cohorts. P values were determined by the log-rank test.
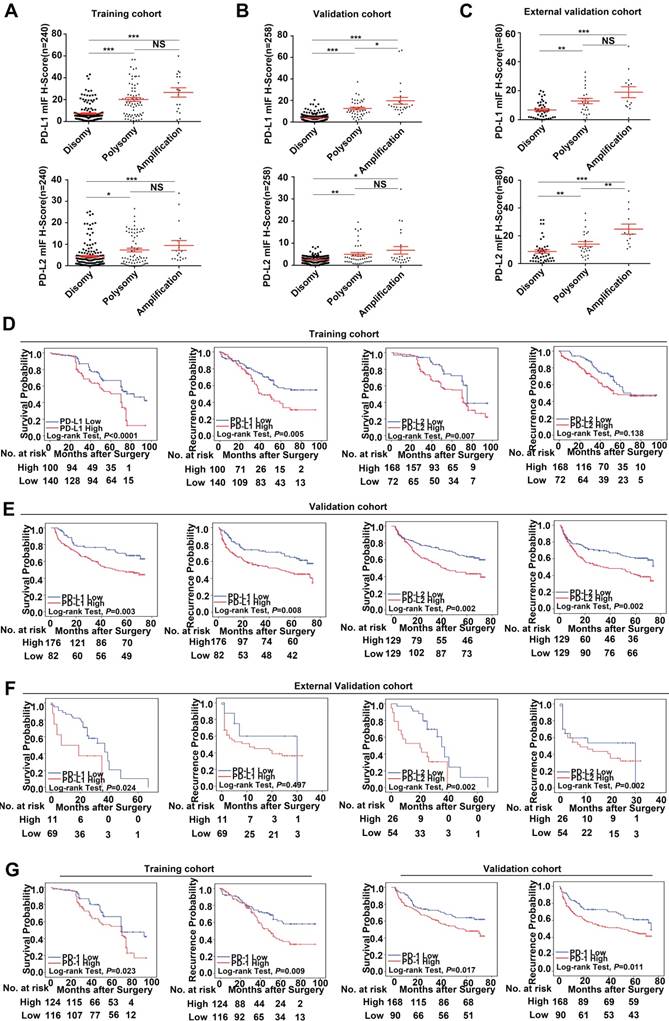
Using the optimal cutoff values determined by ROC curves from the modified H-scores of PD-1, PD-L1 and PD-L2 in training cohort respectively, OS and TTR were assessed in each cohort. In training cohort, patients with high expression of PD-Ls had significant inferior outcomes compared with those with low expression (OS, PD-L1, 56.3 months versus 70.9 months, P < 0.0001; PD-L2, 61.2 months versus 72.3 months, P = 0.007; log-rank test) (TTR, PD-L1, 52.4 months versus 66.8 months, P = 0.005; PD-L2, 59.1 months versus 67.4 months, P = 0.138; log-rank test; Figure 4D), as expected. Likewise, in validation cohort, patients with high expression of PD-Ls also had significant unfavorable outcomes compared with those with low expression (OS, PD-L1, 45.9 months versus 57.7 months, P = 0.003; PD-L2, 44.0 months versus 55.1 months, P = 0.002; log-rank test) (TTR, PD-L1, 42.3 months versus 54.2 months, P = 0.008; PD-L2, 40.0 months versus 51.7 months, P = 0.002; log-rank test; Figure 4E). Similarly, in external validation cohort, patients with high PD-Ls' expression had a poorer prognosis than those with low expression in OS as well (PD-L1, 17.2 months versus 30.0 months, P = 0.024; PD-L2, 19.1 months versus 36.3 months, P = 0.002; log-rank test), but not in TTR (PD-L1, 15.0 months versus 19.8 months, P = 0.497; PD-L2, 14.5 months versus 17.3 months, P = 0.378; log-rank test) (Figure 4F).
We also investigated the impact of PD-1 expression on patient outcome, and the results indicated that patients with high density of PD-1+ lymphocytes infiltration had shorter median OS and TTR than those with low infiltration (training cohort, OS, 59.3 months versus 70.6 months, P = 0.023; TTR, 55.1 months versus 68.1 months, P = 0.009; validation cohort, OS, 46.8 months versus 54.9 months, P = 0.017; TTR, 42.1 months versus 53.2 months, P = 0.011, Figure 4G; external validation cohort, OS, 19.5 months versus 34.1 months, P = 0.011; TTR, 15.2 months versus 15.3 months, P = 0.811; log-rank test, data not shown).
Moreover, multivariate analyses indicated that high expression of PD-L1 was an independent prognostic index for dismal OS and TTR in both training and validation cohorts [OS, training cohort: HR, 2.11; 95% CI, 1.45-3.09, P < 0.001; validation cohort: HR, 2.16; 95% CI, 1.38-3.38, P = 0.001; external validation cohort, HR, 2.75; 95% CI, 1.09-6.93, P = 0.032; TTR, training cohort: HR, 1.78; 95% CI, 1.17-2.71, P = 0.007; validation cohort: HR, 2.16; 95% CI, 1.38-3.38, P = 0.001; external validation cohort, HR, 0.72; 95% CI, 0.25-2.03, P = 0.529] (Table S3). However, for PD-L2, no significant differences in OS nor TTR were uncovered on multivariate analysis (Table S4). Furthermore, staining of PD-Ls showed a minimal intensity in peritumor liver, compared with the obvious up-regulation in tumor tissues, and no significant differences on patient outcome were found between PD-Ls expression status in peritumor tissues (data not shown).
Prognostic value of combination of PD-L1 expression and 9p24.1 alterations
We then investigated combined PD-L1 expression and 9p24.1 alterations on patient outcome. Patients were divided into three groups: (a) both high expression of PD-L1 and 9p24.1 amplification/polysomy (training cohort, n = 54; validation cohort, n = 24; external validation cohort, n = 6), (b) either high expression of PD-L1 or 9p24.1 amplification/polysomy (training cohort, n = 144; validation cohort, n = 197; external validation cohort, n = 37), and (c) both low expression of PD-L1 and 9p24.1 disomy (training cohort, n = 42; validation cohort, n = 37; external validation cohort, n = 37). Significant differences in recurrence and survival were found between groups I and III as well as between groups II and III. For training cohort, the median OS and TTR were 81.7 and 76.5 months for group III, 67.1 and 59.1 months for group II, 42.3 and 51.6 months for group I, respectively (OS, P < 0.0001; TTR, P = 0.019; log-rank test, Figure S5A). Similarly, in validation cohort, group III had the best prognosis, compared with groups II and I (OS, 64.1 versus 49.1 versus 30.0 months, P < 0.0001; TTR, 61.4 versus 45.3 versus 25.7 months, P < 0.0001; log-rank test, Figure S5B). Likewise, group I had the worst prognosis, compared with groups II and groups III in OS in the external validation cohort (8.7 versus 25.8 versus 40.0 months, P = 0.009), but not significant in TTR (13.3 versus 16.5 versus 22.7 months, P = 0.475; log-rank test, Figure S5C). Furthermore, multivariate analysis revealed that the differences was significant between groups I and III in OS, and also had a tendency toward statistical significance in TTR (training cohort, OS, P < 0.0001 and TTR, P = 0.069; validation cohort, OS, P = 0.001 and TTR, P = 0.001) (Table S5).
PD-Ls/PD-1 expression and clinicopathological features
We further investigated the relationship of PD-Ls and PD-1 expression with clinic-pathological features (Table S6). In training cohort, patients with high PD-L1 expression positively correlated with high level of serum AFP (P = 0.022), larger tumor size (P = 0.036), and advanced TNM (P = 0.024) or BCLC stages (P = 0.036), whereas patients with high PD-L2 expression harbored larger tumor size (P = 0.008), poor differentiation (P = 0.001) and advanced TNM stage (P < 0.001). Meanwhile, high-dense PD-1+ immunocytes infiltration was more common in patients with larger tumor size (P = 0.002) and advanced TNM stage (P < 0.001). Likewise, in validation cohort, patients with high PD-L1 expression positively correlated with high level of serum AFP (P = 0.038) and advanced TNM (P = 0.047) or BCLC stages (P = 0.043), whereas patients with high PD-L2 expression harbored larger tumor size (P = 0.004), more presence of vascular invasion (P = 0.028) and advanced BCLC stage (P = 0.003). For PD-1, patients with high-dense PD-1+ immunocytes infiltration were more likely to exhibit aggressive clinicopathologic features: presence of vascular invasion (P = 0.028) and advanced TNM (P = 0.041) or BCLC stages (P < 0.001). Therefore, high PD-Ls expression and high-dense PD-1+ immunocytes infiltration in HCC may also signify a dismal clinical outcome and tumor aggressiveness.
Discussion
Evading of immune surveillance is a hallmark of cancer [25], and accumulating evidences have emphasized the anticancer efficacy of inhibiting PD-1/PD-L1 axis. In this study, we evaluated the prognostic impact of PD-1/PD-Ls gene amplification, mRNA and protein expression in three cohorts containing a total of 578 resected HCC patients from two large volume centers. We demonstrated for the first time that 9p24.1 alterations positively correlated with transcriptional and translational levels of PD-Ls, and increased copy numbers of PD-Ls were significantly associated with unfavorable prognosis in HCC. Blockade of the PD-1 and PD-L1 interaction using monoclonal antibodies produces durable clinical responses in patients with diverse advanced tumor types [26]. Considering PD-L1 expression, studies have shown significantly increased response rates in PD-L1 expressers over non-expressers [27]. However, conflicting data also existed, a significant proportion of patients with negative PD-L1 are also effective [28]. Since PD-L1 expression is associated with clinical efficacy. Moreover, PD-L1 amplification is positively correlated with its high expression. Therefore, there is reason to believe that PD-L1 amplification is related to efficacy. Considering that PD-1/PD-L1-targeting antibodies have proved to be a novel immunotherapy strategy for HCC, we speculate that HCC tumors with 9p24.1 amplification may be particularly sensitive to therapeutic PD-1/ PD-L1 inhibition.
Immunohistochemical detection of PD-L1 expression has undergone extensive assessment with respect to its value to predict therapeutic efficacy in anti-PD-1/PD-L1 immunotherapy in clinical trials [29]. As shown in a many cancer types, patients with tumor PD-L1 positive have a higher objective response rate and improved outcomes as compared to those negative [30]. However, recent studies triggered an unexpected concern about this approach following the observation of patient responding to PD-1/PD-L1 inhibition without detectable PD-L1 by immunohistochemistry [31]. A straightforward mechanism that attracted little attention until now is PD-Ls' genetic alterations, which could be easily achieved through sequencing or FISH analyses [32]. Several studies have indicated a crucial role of PD-L1 amplification in tumor progression, including breast, gastric, and lung cancer [33-35], since the original work proposed in hematological tumors [18, 19]. Here, we reported that a subset (7.1%-15%) of HCC cases bear focal and high-level amplification of CD274, along with 16.3%-31.3% harboring low-level amplification (polysomy). Both of them resulted in high expression of PD-L1, in line with the finding that 9p24.1 amplification may trigger a tumor cell-dependent enhancement in immune checkpoints [36]. In addition, PD-L2 is always co-deleted or co-amplified with PD-L1 [37], and our data indicated a positive correlation between PD-L2 amplification and expression. However, it was reported that CD274 was the most highly expressed and appeared to be the main target of 9p24.1 amplification compared with others in the region [38]. Meanwhile, 9p24.1 amplification was also occurred in other cancers according to a TCGA pan-cancer analysis [39] and comprehensive genomic profiling analysis [40], including mixed hepatocellular cholangiocarcinoma (10.5%), ovarian (10.7%), lung (9.8%), head and neck (8.6%) and bladder (8.3%) cancer. Thus, CD274 amplification could be a universal mechanism that leads to PD-L1 overexpression in human cancers, and may serve as a genetic marker for tumor immune evasion.
In addition to genetic amplification, we found that epigenetic alterations collectively governed the expression of PD-Ls in HCC, where copy number of PD-L1 positively, while its DNA hypermethylation negatively, correlated with PD-L1 transcriptional level. Indeed, tumor PD-L1 levels were determined by a complex regulatory network, also involving inflammatory milieu, oncogenic signaling, and post-translational modulation [41]. Deep insights into the biology of PD-L1 regulation may inform the development of more effective cancer immune checkpoint therapies. As kinetics and turnover of translational and transcriptional levels might be different, clinical biomarker evaluation usually determines protein levels instead of mRNA levels [39]. In fact, we found that increased PD-L1 copy number and protein expression in HCC both significantly correlated with dismal survival, but not mRNA expression.
For immunohistochemical detection of PD-L1, different antibody clones tested by different staining platforms and scoring systems have raised arguments about their consistency and interchangeability, among which three drug-specific tests are FDA approved diagnostics [42]. Nivolumab was used in the Dako/Agilent 28-8 assay; pembrolizumab was used in the Dako/Agilent 22c3 assay, whereas the test for atezolizumab used the Ventana SP142. We identified that, among others, SP142 antibody showed an outstanding performance that detected a notable PD-L1 expression in both HCC cells and immune cells. Previously, studies investigating the relationship between PD-L1 expression and prognosis in HCC have reported conflicting results [11-15], probably due to different antibodies, specimen sources, therapeutic schedules and scoring methods [43]. Herein, using PerkinElmer's phenoptics system that could phenotype and extract single-cell multiparameter data based on expression and contextual spatial information, we could conduct a more precise analysis of their impacts on patient prognosis. Indeed, in a total of 578 patients form three independent cohorts; we clearly demonstrated that PD-L1 expression was a prognostic biomarker for unfavorable outcome in HCC. On the basis of the efficacy of PD-1 inhibition in PD-L1 amplified lymphoma [44] and the notable response rate of nivolumab in advanced HCC [10], our findings of 9p24.1 amplification were likely to be translated into HCC clinical practice. In addition, our single-cell images also indicated that PD-L1 overexpression and 9p24.1 alterations were subclonal events that occurred in intratumoral subsets of HCC cells, consistent with the well-known intratumoral heterogeneity in HCC [45, 46].
In conclusion, for the first time we provided a detailed landscape of PD-Ls alterations in HCC patients, and determined the prognostic relevance of PD-Ls at genetic, transcriptional and translational levels. Our results described a cell intrinsic mechanism, the genetic alterations that regulated PD-Ls expression and correlated with patient clinical outcomes. Furthermore, we established a foundation for further investigation on genetic alterations of PD-Ls and their clinical and biological relevance in HCC patients.
Abbreviations
HCC: hepatocellular carcinoma; TCGA: The Cancer Genome Atlas; FISH: fluorescent in situ hybridization; OS: overall survival; TTR: time to recurrence.
Supplementary Material
Supplementary figures and tables.
Acknowledgements
This work was supported by the National Natural Science Foundation of China (Nos. 81572292 and 81522036), Shanghai Sailing Program, Grant number: 17YF1401900. Basic Research Project from Technology Commission of Shanghai Municipality (No. 17JC1402200), and National Program for Special Support of Eminent Professionals and Science. “Interdisciplinary Innovation Team, Frontier Science Key Research Project (QYZDB-SSW-SMC036), and the Strategic Priority Research Program (No. XDPB0303), Chinese Academy of Sciences”.
Competing Interests
The authors have declared that no competing interest exists.
References
1. Ferlay J, Soerjomataram I, Dikshit R. et al. Cancer incidence and mortality worldwide: sources, methods and major patterns in GLOBOCAN 2012. Int J Cancer. 2015;136:E359-E386
2. Knox JJ, Cleary SP, Dawson LA. Localized and systemic approaches to treating hepatocellular carcinoma. J Clin Oncol. 2015;33:1835-1844
3. Greten TF, Wang XW, Korangy F. Current concepts of immune based treatments for patients with HCC: from basic science to novel treatment approaches. Gut. 2015;64:842-848
4. Chen J, Jiang CC, Jin L, Zhang XD. Regulation of PD-L1: a novel role of pro-survival signalling in cancer. Ann Oncol. 2016;27:409-416
5. Hui R, Garon EB, Goldman JW. et al. Pembrolizumab as first-line therapy for patients with PD-L1-positive advanced non-small cell lung cancer: a phase 1 trial. Ann Oncol. 2017;28:874-881
6. Ott PA, Piha-Paul SA, Munster P. et al. Safety and antitumor activity of the anti-PD-1 antibody pembrolizumab in patients with recurrent carcinoma of the anal canal. Ann Oncol. 2017;28:1036-1041
7. Zhu AX, Finn RS, Edeline J. et al. Pembrolizumab in patients with advanced hepatocellular carcinoma previously treated with sorafenib (KEYNOTE-224): a non-randomised, open-label phase 2 trial. Lancet Oncol. 2018
8. Errico A. Immunotherapy: PD-1-PD-L1 axis: efficient checkpoint blockade against cancer. Nat Rev Clin Oncol. 2015;12:63
9. Topalian SL, Drake CG, Pardoll DM. Immune checkpoint blockade: a common denominator approach to cancer therapy. Cancer Cell. 2015;27:450-461
10. El-Khoueiry AB, Sangro B, Yau T. et al. Nivolumab in patients with advanced hepatocellular carcinoma (CheckMate 040): an open-label, non-comparative, phase 1/2 dose escalation and expansion trial. Lancet. 2017;389:2492-2502
11. Gao Q, Wang XY, Qiu SJ. et al. Overexpression of PD-L1 significantly associates with tumor aggressiveness and postoperative recurrence in human hepatocellular carcinoma. Clin Cancer Res. 2009;15:971-979
12. Sideras K, Biermann K, Verheij J. et al. PD-L1, Galectin-9 and CD8(+) tumor-infiltrating lymphocytes are associated with survival in hepatocellular carcinoma. Oncoimmunology. 2017;6:e1273309
13. Chen J, Li G, Meng H. et al. Upregulation of B7-H1 expression is associated with macrophage infiltration in hepatocellular carcinomas. Cancer Immunol Immunother. 2012;61:101-108
14. Calderaro J, Rousseau B, Amaddeo G. et al. Programmed death ligand 1 expression in hepatocellular carcinoma: Relationship With clinical and pathological features. Hepatology. 2016;64:2038-2046
15. Chen CL, Pan QZ, Zhao JJ. et al. PD-L1 expression as a predictive biomarker for cytokine-induced killer cell immunotherapy in patients with hepatocellular carcinoma. Oncoimmunology. 2016;5:e1176653
16. Kurebayashi Y, Ojima H, Tsujikawa H. et al. Landscape of immune microenvironment in hepatocellular carcinoma and its additional impact on histological and molecular classification. Hepatology. 2018
17. Ritprajak P, Azuma M. Intrinsic and extrinsic control of expression of the immunoregulatory molecule PD-L1 in epithelial cells and squamous cell carcinoma. Oral Oncol. 2015;51:221-228
18. Georgiou K, Chen L, Berglund M. et al. Genetic basis of PD-L1 overexpression in diffuse large B-cell lymphomas. Blood. 2016;127:3026-3034
19. Kataoka K, Shiraishi Y, Takeda Y. et al. Aberrant PD-L1 expression through 3'-UTR disruption in multiple cancers. Nature. 2016;534:402-406
20. Xie DY, Ren ZG, Zhou J. et al. Critical appraisal of Chinese 2017 guideline on the management of hepatocellular carcinoma. Hepatobiliary Surg Nutr. 2017;6:387-396
21. Roemer MG, Advani RH, Ligon AH. et al. PD-L1 and PD-L2 Genetic Alterations Define Classical Hodgkin Lymphoma and Predict Outcome. J Clin Oncol. 2016;34:2690-2697
22. Saito R, Abe H, Kunita A. et al. Overexpression and gene amplification of PD-L1 in cancer cells and PD-L1(+) immune cells in Epstein-Barr virus-associated gastric cancer: the prognostic implications. Mod Pathol. 2017;30:427-439
23. Stieber D, Golebiewska A, Evers L. et al. Glioblastomas are composed of genetically divergent clones with distinct tumourigenic potential and variable stem cell-associated phenotypes. Acta Neuropathol. 2014;127:203-219
24. Garcia-Diaz A, Shin DS, Moreno BH. et al. Interferon Receptor Signaling Pathways Regulating PD-L1 and PD-L2 Expression. Cell Rep. 2017;19:1189-1201
25. Hanahan D, Weinberg RA. Hallmarks of cancer: the next generation. Cell. 2011;144:646-674
26. Topalian SL, Hodi FS, Brahmer JR. et al. Safety, activity, and immune correlates of anti-PD-1 antibody in cancer. N Engl J Med. 2012;366:2443-2454
27. Topalian SL, Sznol M, McDermott DF. et al. Survival, durable tumor remission, and long-term safety in patients with advanced melanoma receiving nivolumab. J Clin Oncol. 2014;32:1020-1030
28. Topalian SL, Sznol M, McDermott DF. et al. Survival, durable tumor remission, and long-term safety in patients with advanced melanoma receiving nivolumab. J Clin Oncol. 2014;32:1020-1030
29. Aguiar PJ, Perry LA, Penny-Dimri J. et al. The effect of PD-L1 testing on the cost-effectiveness and economic impact of immune checkpoint inhibitors for the second-line treatment of NSCLC. Ann Oncol. 2017;28:2256-2263
30. Fehrenbacher L, Spira A, Ballinger M. et al. Atezolizumab versus docetaxel for patients with previously treated non-small-cell lung cancer (POPLAR): a multicentre, open-label, phase 2 randomised controlled trial. Lancet. 2016;387:1837-1846
31. Ilie M, Long-Mira E, Bence C. et al. Comparative study of the PD-L1 status between surgically resected specimens and matched biopsies of NSCLC patients reveal major discordances: a potential issue for anti-PD-L1 therapeutic strategies. Ann Oncol. 2016;27:147-153
32. Zarrei M, MacDonald JR, Merico D, Scherer SW. A copy number variation map of the human genome. Nat Rev Genet. 2015;16:172-183
33. Ali HR, Glont SE, Blows FM. et al. PD-L1 protein expression in breast cancer is rare, enriched in basal-like tumours and associated with infiltrating lymphocytes. Ann Oncol. 2015;26:1488-1493
34. The Cancer Genome Atlas Research Network. Comprehensive molecular characterization of gastric adenocarcinoma. Nature. 2014;513:202-209
35. Goldmann T, Kugler C, Reinmuth N. et al. PD-L1 copy number gain in nonsmall-cell lung cancer defines a new subset of patients for anti PD-L1 therapy. Ann Oncol. 2016;27:206-207
36. Kleffel S, Posch C, Barthel SR. et al. Melanoma Cell-Intrinsic PD-1 Receptor Functions Promote Tumor Growth. Cell. 2015;162:1242-1256
37. Iwakawa R, Takenaka M, Kohno T. et al. Genome-wide identification of genes with amplification and/or fusion in small cell lung cancer. Genes Chromosomes Cancer. 2013;52:802-816
38. George J, Saito M, Tsuta K. et al. Genomic Amplification of CD274 (PD-L1) in Small-Cell Lung Cancer. Clin Cancer Res. 2017;23:1220-1226
39. Budczies J, Bockmayr M, Denkert C. et al. Pan-cancer analysis of copy number changes in programmed death-ligand 1 (PD-L1, CD274) - associations with gene expression, mutational load, and survival. Genes Chromosomes Cancer. 2016;55:626-639
40. Goodman AM, Piccioni D, Kato S. et al. Prevalence of PDL1 Amplification and Preliminary Response to Immune Checkpoint Blockade in Solid Tumors. JAMA Oncol. 2018
41. Sun C, Mezzadra R, Schumacher TN. Regulation and Function of the PD-L1 Checkpoint. Immunity. 2018;48:434-452
42. Rimm DL, Han G, Taube JM. et al. A Prospective, Multi-institutional, Pathologist-Based Assessment of 4 Immunohistochemistry Assays for PD-L1 Expression in Non-Small Cell Lung Cancer. JAMA Oncol. 2017;3:1051-1058
43. Herbst RS, Soria JC, Kowanetz M. et al. Predictive correlates of response to the anti-PD-L1 antibody MPDL3280A in cancer patients. Nature. 2014;515:563-567
44. Zinzani PL, Ribrag V, Moskowitz CH. et al. Safety and tolerability of pembrolizumab in patients with relapsed/refractory primary mediastinal large B-cell lymphoma. Blood. 2017;130:267-270
45. Duan M, Hao J, Cui S. et al. Diverse modes of clonal evolution in HBV-related hepatocellular carcinoma revealed by single-cell genome sequencing. Cell Res. 2018;28:359-373
46. Gao Q, Wang ZC, Duan M. et al. Cell Culture System for Analysis of Genetic Heterogeneity Within Hepatocellular Carcinomas and Response to Pharmacologic Agents. Gastroenterology. 2017;152:232-242
Author contact
![]() Corresponding author: Qiang Gao, Department of Liver Surgery and Transplantation, Liver Cancer Institute, Zhongshan Hospital, Fudan University, 180 Fenglin Road, Shanghai 200032, China. E-mail: gaoqiangedu.cn; Xiao-Ying Wang, Liver Cancer Institute, Zhongshan Hospital, Fudan University, 180 Fenglin Road, Shanghai 200032, China. E-mail: wang.xiaoying1sh.cn.
Corresponding author: Qiang Gao, Department of Liver Surgery and Transplantation, Liver Cancer Institute, Zhongshan Hospital, Fudan University, 180 Fenglin Road, Shanghai 200032, China. E-mail: gaoqiangedu.cn; Xiao-Ying Wang, Liver Cancer Institute, Zhongshan Hospital, Fudan University, 180 Fenglin Road, Shanghai 200032, China. E-mail: wang.xiaoying1sh.cn.