Impact Factor
- Issue 14; 2026
- Issue 13; 2026
- Issue 12; 2026
- Issue 11; 2026
- Issue 10; 2026
- Volume 16; 2026
- Advance Articles
- Past Issues
- Cover Images
- Cover Suggestion
- Index & Coverage
- Special Issues
Introduction
Materials and Methods
Results
Discussion
Abbreviations
Supplementary Material
Acknowledgements
References
International Journal of Biological Sciences
International Journal of Medical Sciences
 Global reach, higher impact

Theranostics 2018; 8(20):5744-5757. doi:10.7150/thno.28898 This issue Cite
Research Paper
A Positive Feedback Loop of SLP2 Activates MAPK Signaling Pathway to Promote Gastric Cancer Progression
Wenhui Ma1,2,3,4*, Zhuoluo Xu1,2,3,4*, Yutian Wang2,3,4*, Wenyi Li2,3,4, Zhigang Wei1, Tao Chen1, Tingyu Mou1, Mingzhen Cheng2,3,4, Jun Luo1, Tingyue Luo1,2,3,4, Yuehong Chen1,2,3,4, Jiang Yu1,2 ![]() , Weijie Zhou2,3,4
, Weijie Zhou2,3,4 ![]() , Guoxin Li1,4
, Guoxin Li1,4 ![]()
1. Department of General Surgery, Nanfang Hospital, Southern Medical University, Guangzhou, China
2. Departments of Pathology, School of Basic Medical Science, Southern Medical University, Guangzhou, China
3. Department of Pathology, School of Basic Medical Sciences, Southern Medical University, Guangzhou, Guangdong, China
4. Guangdong Provincial Key Laboratory of Molecular Tumor Pathology, Guangzhou, Guangdong, China
*Wenhui Ma, Zhuoluo Xu and Yutian Wang contributed equally.
Received 2018-7-31; Accepted 2018-10-16; Published 2018-11-10
Abstract

Rationale: This study is to validate the clinicopathologic significance and potential prognostic value of SLP2 in gastric cancer (GC), to investigate the biological function and regulation mechanism of SLP2, and to explore potential therapeutic strategies for GC.
Methods: The expression of SLP2 in GC tissues from two cohorts was examined by IHC. The biological function and regulation mechanism of SLP2 and PHB was validated via loss-of-function or gain-of-function experiments. In vitro proliferation detection was used to evaluate the therapeutic effects of Sorafenib.
Results: We validated that SLP2 was significantly elevated in GC tissues and its elevation was associated with poor prognosis of patients. Loss of SLP2 drastically suppressed the proliferation of GC cells and inhibited the tumor growth, while SLP2 overexpression promoted the progression of GC. Mechanistically, SLP2 competed against E3 ubiquitin ligase SKP2 to bind with PHB and stabilized its expression. Loss of SLP2 significantly suppressed phosphorylation of Raf1, MEK1/2, ERK1/2 and ELK1. Furthermore, phosphorylated ELK1 could in turn activate transcription of SLP2. Finally, we demonstrated that a Raf1 inhibitor, Sorafenib, was sufficient to inhibit the proliferation of GC cells.
Conclusion: Our findings demonstrated a positive feedback loop of SLP2 which leads to acceleration of tumor progression and poor survival of GC patients. This finding also provided evidence for the reason of SLP2 elevation. Moreover, we found that sorafenib might be a potential therapeutic drug for GC and disrupting the interaction between SLP2 and PHB might also serve as a potential therapeutic target in GC.
Keywords: gastric cancer, SLP2, PHB, ELK1, positive feedback loop.
Introduction
Gastric cancer (GC) is one of the most common human malignant diseases and the third leading cause of cancer death worldwide [1]. Especially in China, more than 80% of patients are diagnosed at advanced stages which are prone to recurrence and distant metastasis, leading to poor prognosis [2, 3]. The genesis and progression of GC is a multistep and multifactorial process related to genetic variation and epigenetic modification that induce multiple molecular alterations including the activation of various oncogenes and inactivation of tumor suppressor genes [4]. Previously we applied two-dimensional polyacrylamide gel electrophoresis and mass spectrometry analysis to compare the protein pattern of GC tissues with paired normal tissues and stomatin-like protein 2 (SLP2) was screened as a potential oncogene and proved to be up-regulated and associated with poor prognosis in patients with GC [5].
SLP2, also known as STOML2, originally identified as a membrane protein in human erythrocytes and many other tissues, shares a similar signature sequence with stomatin but does not contain an NH2-terminal hydrophobic domain, which distinguishes it from other members of the stomatin family [6]. Previously, using two-dimensional gel electrophoresis and mass spectrometry analysis, SLP2 was screened as a caveolae resident in human endothelial cell plasma membrane [7]. Lately, SLP2 was identified as a protein associated with the inner mitochondrial membrane and faces the intermembrane space that probably regulates the biogenesis and the activity of mitochondria [8], and binds cardiolipin-enriched membrane to stimulate cardiolipin biosynthesis and increase intracellular ATP stores [9]. In human T cells, SLP2 was screened as a lipid rafts associated protein and participates in the organization of functional domains at the plasma membrane and plays a role in T-cell activation through association with the T-cell receptor signaling complex [10-12].
In 2006, a cDNA microarray that revealed the elevation of SLP2 in human esophageal squamous cell carcinoma [13] opened an era to investigate its role in various types of cancer. Successively, it is reported that SLP2 was up-regulated in endometrial adenocarcinoma [14], glioma cells [15], papillary thyroid cancer [16], cervical cancer [17], epithelial ovarian cancer [18] and rectal cancer [19]. In addition, we previously revealed that the expression of SLP2 was elevated in GC and associated with poor prognosis [5]. Although a growing body of evidence suggests that SLP2 is associated with prognosis of cancer patients, the biological function and regulation mechanism of SLP2 was still poorly understood, especially in GC.
Herein, we demonstrated that SLP2 knockout dramatically inhibited proliferation of GC cell and tumor growth in vivo and reported the positive feedback loop of SLP2 in GC cell. Moreover, we provide potential therapeutic strategies for GC management.
Materials and Methods
Tissue specimens
Human tissue samples for internal validation were collected from Department of Pathology, Nanfang Hospital, Southern Medical University (Guangzhou, China) and tissue microarray slide for external validation was obtained from Shanghai outdo biotechnology Co., Ltd. None of these patients received chemotherapy or radiotherapy before operation. The use of human samples was approved by the Ethics Committee of Nanfang Hospital, Southern Medical University.
Cell culture
Human normal gastric cell line (GES-1) and GC cell lines (MGC803, 7901, MKN45, BGC-823, AGS) were purchased from Cell Resource Center, Shanghai Institute of Biochemistry and Cell Biology at the Chinese Academy of Sciences (Shanghai, China) and maintained at the Department of Pathology, Southern Medical University (Guangzhou, China). All cell lines were cultured in RPMI-1640 medium, containing 10% fetal bovine serum (Gibco) at 37 °C in an atmosphere of 5% CO2.
Animals
NCG mice, which were CRISPR/Cas9-edited to knockout Prkdc and IL2RG genes directly in NOD/ShiLtJNju mice, were purchased from Nanjing University Model Animal Institute. All interventions and animal care procedures were performed in accordance with the Guidelines and Policies for Animal Surgery provided by Nanfang Hospital. All treatments described were approved by the Animal Ethics Committee of Nanfang Hospital, Southern Medical University (Guangzhou China).
Immunohistochemistry and Immunofluorescence
For immunohistochemistry staining, anti-SLP2 (1:1000, Proteintech, Wuhan, China), anti-PHB (1:200; Gentex, CA, USA), anti-p-ERK1/2 (1:50, Cell Signaling Technology, MA, USA), anti-ELK1 (1:50, Novus Biologicals, CO, USA) was incubated overnight at 4 °C. For negative controls, the antibodies were replaced with normal non-immune serum. The sections were scored by two independent observers, based on percentage of positive cells and the degree of positive staining. The cells at each intensity of staining were recorded on a scale of 0 (no staining), 1 (weak staining = light yellow), 2 (moderate staining = yellowish brown), and 3 (strong staining = brown). An intensity score of ≥2 with at least 50% of malignant cells with positive SLP2 staining was classified as tumors with high expression of SLP2, and <50% of malignant cells with nuclear staining or <2 intensity score was classified as tumors with low expression of SLP2. For cell immunofluorescence staining, secondary fluorescent antibodies were applied for 1 hr at room temperature and sections counterstained with DAPI. For tissue immunofluorescence staining, OpalTM 4-Color Manual IHC Kit was used followed the instruction of manufacture. Images were shot and saved by Olympus Software.
Generation of transient and stable transfectants
Cells were seeded in 6-well plates at a density of 2*105 cells per well 24 hrs before transfection. Vectors and small interference RNAs (siRNAs) transfection was carried out by using Lipofectamine 3000 (Invitrogen) according to the instructions. For the generation stable transfected cells, MGC803 cells were infected with lentiviral shRNA or scramble (Scr) shRNA (GENECHEM, Shanghai, China) while AGS cells infected with SLP2 overexpression lentivirus or control lentivirus (mock) (GENECHEM, Shanghai, China). Real-time quantitative PCR (RT-Q-PCR) and immunoblot analysis were done to confirm the expressive alterations of target genes in the transfected cells. CRISPR/Cas9 genome-editing system was applied to knock out SLP2 in MGC803 cell. Cas9 and (small guide RNA) sgRNA lentivirus transfected cell was cloned by limiting dilutions and clones were randomly picked. By PCR and DNA sequencing, 3 clones with frame shift mutation were selected for further studies.
Total RNA extraction and real-time quantitative PCR
Total RNA was extracted with TRIzol reagent (TaKaRa, Dalian China) following manufacturer's instruction. cDNA synthesis was carried out with PrimeScript™ RT reagent Kit (TaKaRa, Dalian China). Real-time RT-PCR was carried out using SYBR Premix Ex Taq™ II (TaKaRa, Dalian China) and 7500-fast instrument (Applied BioSystems). Data were normalized to the mean Ct values of housekeeping gene GAPDH and presented as 2-ΔΔCt. Sequences of the primers are summarized in Table S1.
Cell proliferation and colony formation assay
For the Cell Counting Kit-8 (CCK8) assay, Cells were seeded in 96-well plates at a density of 5000 cells per well 1 day before proliferation assay. The medium of each well was replaced by CCK-8 regent following the manufacturer's instruction 2 hours before testing. The absorbance value was detected at 450nm wavelength by Microplate Reader (Perkin Elmer, MA, USA). The detection was continuously carried out for 5 days.
For the colony formation assay, Cells were well-distributed in 6-well plates with 3 ml complete medium. After 14-day incubation at 37°C in an atmosphere of 5% CO2, the colonies formed by single cells were fixed in 75% ethanol and stained with Giemsa for quantification.
Immunoblot
Cultured cells were lysed with SDS lysis buffer (PMSF, Protease and Phosphatase Inhibitor added) Cocktail. Equal amounts of protein extracts were separated by electrophoresis in SDS-PAGE gel and then transferred to PVDF membrane. After BSA blocking, the protein-loading membrane were incubated with the primary antibody. Images were captured and analyzed using the Image Lab Software (Bio-Rad, CA, USA).
Chromatin immunoprecipitation and co-immunoprecipitation assay
Approximately 5×10⁷ cells were harvested for ChIP assay according to the chromatin immunoprecipitation assay kit (Cell Signaling Technology, MA, USA). Briefly, crosslinked cells were lysed. The DNA was sheared by sonication and enzyme-digested to length between 200 and 500 base pairs. Protein-DNA complexes were precipitated by anti-ELK1 antibody (Abcam, MA, USA), anti-Histone H3 or control anti-IgG antibody. After dissociation of the protein-Ig-DNA complexes, the DNA fragment enriched by anti-ELK1 antibody was eluted and detected by RT-Q-PCR. Sequences of the primers are summarized in Table S1.
For immunoprecipitation assay, cell was lysed and incubated with 50 μl protein-A Sepharose beads (Santa Cruz Biotechnology, TX, USA), anti-PHB-Ab (1:50, Genetex, CA, USA) or anti-SLP2 (1:100, Proteintech, Wuhan, China) antibody at 4 °C overnight with gentle mixing and anti-IgG (Santa Cruz Biotechnology, TX, USA) was set as a control. Then the samples were washed and denaturized for western blotting.
Dual luciferase reporter assay
Promoter of SLP2 was cloned into pGL3 luciferase reporter plasmid and ELK1 was cloned into pENTER plasmid, pRL-TK was used as internal control. Then the three plasmids were co-transfected into 293T cell line. Forty-eight hours after transfection with or without EGF stimulation, cell lysates were subjected to luciferase assay and the relative luciferase activity was detected through spectrophotometer following the manufacturer's instruction (Promega, WI, USA).
Statistical Analysis
Data were all presented as mean ± standard deviation (SEM). Statistical analysis was performed by two-tail unpaired Student's t test for experiments where two means were compared. One-way analysis of variance (ANOVA) was used to compare means of three or more experimental groups. Factorial design ANOVA was used to analyze experiments with two independent variables. Statistical analyses were performed using GraphPad Prism software 5.0 (GraphPad Software, CA, USA) and SPSS software (Version 22.0, IL, USA).
Results
SLP2 is overexpressed in GC tissues and associated with poor survival of patients
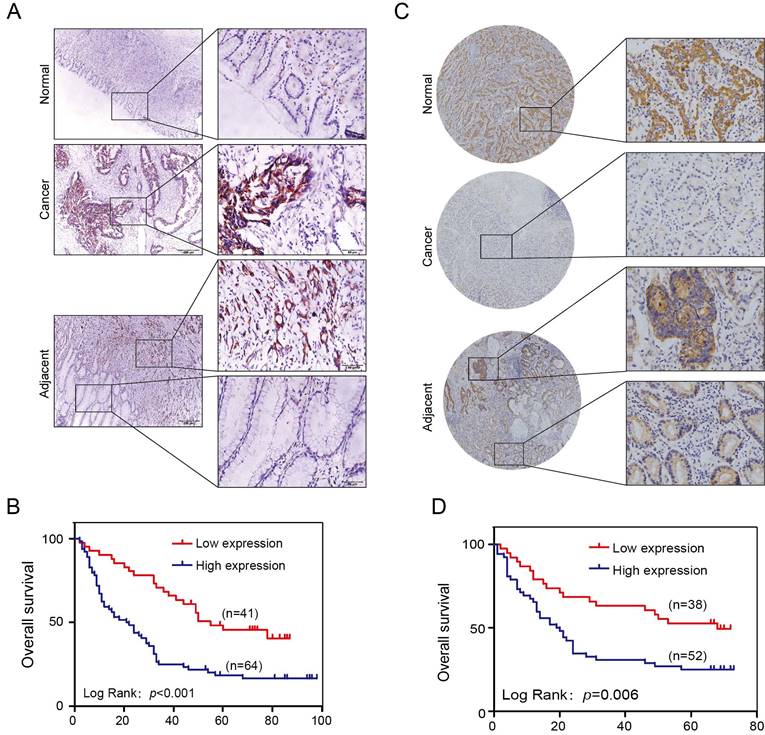
One hundred and five cases of GC patients were enrolled between January 2008 and December 2009 with up to 5 years of follow-up data in our hospital as internal validation cohorts for our previous discoveries. The SLP2 expression level was significantly elevated in 75.2% (79/105) of the tumors compared with that of the matched normal tissues (Figure 1A). We also found that the high SLP2 expression group showed a greater depth of invasion (p = 0.004), increased lymph node metastasis (p = 0.002) and distant metastasis (p = 0.037) accompanied by more advanced AJCC stage (p = 0.001) (Table 1). Log-rank analysis revealed that high expression of SLP2 protein was associated with reduced overall survival in this cohort (p < 0.001) (Figure 1B).
SLP2 is upregulated in human GC tissues and associated with poor prognosis of patients. A, representative images of SLP2 staining in GC, paired normal and adjacent tissues of internal cohort. B, Kaplan-Meier tumor-free survival curves for GC patients with different SLP2 expression levels in internal cohort. The p value was determined using a log-rank test C, representative images of SLP2 staining in GC, paired normal and adjacent tissues of external cohort. D, Kaplan-Meier tumor-free survival curves GC patients with different SLP2 expression in external cohort. The p value was determined using a log-rank test.
The correlation between expression of SLP2 and clinical pathological features in internal cohort.
| SLP2 | ||||
|---|---|---|---|---|
| Valuables | All cases (n = 105) | Low expression (n = 41) (%) | High expression (n = 64) (%) | p value |
| Sex | 0.276 | |||
| Male | 73 | 26 (35.6) | 47 (64.4) | |
| Female | 32 | 15 (46.9) | 17 (53.1) | |
| Age | 0.158 | |||
| ≤55 | 50 | 16 (32.0) | 34 (68.0) | |
| >55 | 55 | 25 (45.5) | 30 (54.5) | |
| Differentiation | 0.875 | |||
| Well+ Moderate | 40 | 16 (40.0) | 24 (60.0) | |
| Poor and undifferentiated | 65 | 25 (38.5) | 40 (61.5) | |
| T Classification | 0.004 | |||
| T1+T2 | 21 | 14 (66.7) | 7 (33.3) | |
| T3+T4 | 84 | 27 (32.1) | 57 (67.9) | |
| Lymph node metastasis | 0.002 | |||
| Absent (N0) | 22 | 15 (68.2) | 7 (31.8) | |
| Present (N1-3) | 83 | 26 (31.3) | 57 (68.7) | |
| Distant metastasis | 0.037 | |||
| Absent (M0) | 81 | 36 (44.4) | 45 (55.6) | |
| Present (M1) | 24 | 5 (20.8) | 19(79.2) | |
| AJCC stage | 0.001 | |||
| I+II | 19 (63.3) | 11 (36.7) | ||
| III+IV | 22 (29.3) | 53 (70.7) | ||
Tissue microarray slide containing benign and primary cancer tissues obtained from 90 GC patients was set as an external validation group. We found 73.3% (66/90) of paired tissues showed higher SLP2 expression in tumor (Figure 1C). High SLP2 expression in GC was positively correlated with depth of invasion (p = 0.003), lymph node metastasis (p = 0.036), and AJCC stage (p = 0.037) (Table 2) and these patients showed shorter survival time (p = 0.006) (Figure 1D). Therefore, both internal and external specimens validated our previous results and SLP2 is a biomarker overexpressed in human GC tissue and correlates with poor survival.
The correlation between expression of SLP2 and clinical pathological features in external cohort.
| SLP2 | ||||
|---|---|---|---|---|
| Valuables | All cases (n = 90) | Low expression (n = 38) (%) | High expression (n = 52) (%) | p value |
| Sex | 0.787 | |||
| Male | 53 | 23 (43.4) | 30 (56.6) | |
| Female | 37 | 15 (46.9) | 22 (53.1) | |
| Age | 0.501 | |||
| ≤62 | 44 | 17 (38.6) | 27 (61.4) | |
| >62 | 46 | 21 (45.7) | 25 (54.3) | |
| T Classification | 0.003 | |||
| T1+T2 | 14 | 11 (71.6) | 3 (28.4) | |
| T3+T4 | 76 | 27 (35.5) | 49 (64.5) | |
| Lymph node metastasis | 0.036 | |||
| Absent (N0) | 23 | 14 (60.9) | 9 (39.1) | |
| Present (N1-3) | 67 | 24 (35.8) | 43 (64.2) | |
| Distant metastasis | 0.476 | |||
| Absent (M0) | 86 | 37 (43.0) | 49 (57.0) | |
| Present (M1) | 4 | 1 (25.0) | 3 (75.0) | |
| AJCC stage | 0.037 | |||
| I+II | 36 | 20 (55.6) | 16 (44.4) | |
| III+IV | 54 | 18 (33.3) | 36 (66.7) | |
SLP2 promotes GC cells proliferation both in vitro and in vivo
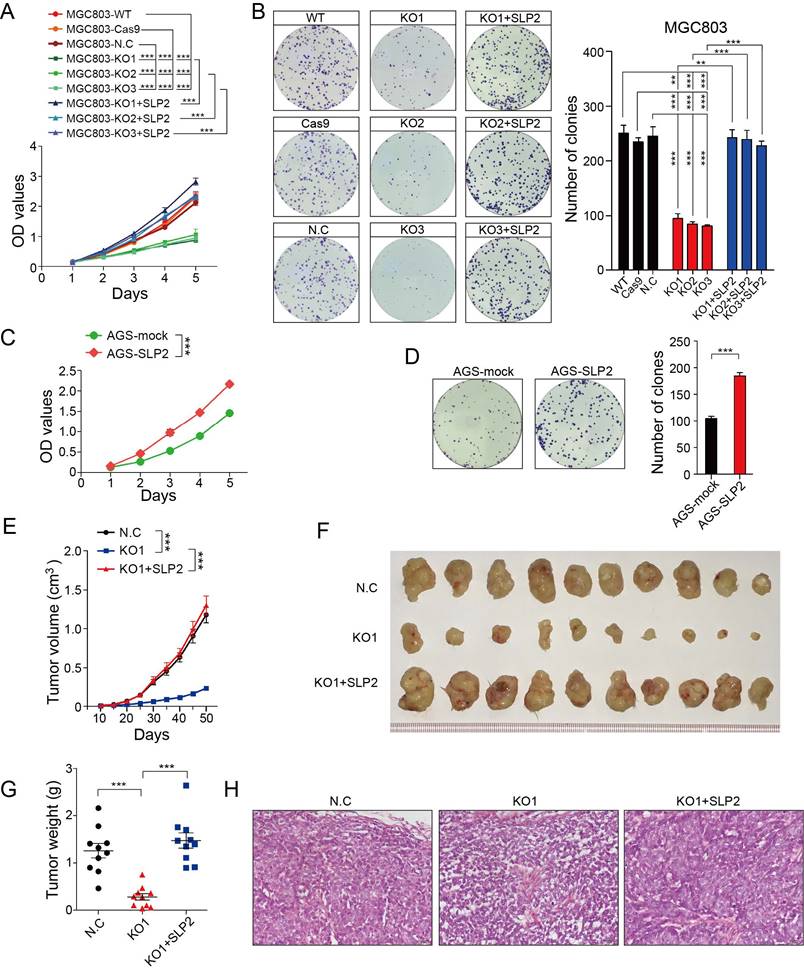
We performed Gene Set Enrichment Analysis (GSEA) to identify association between expression of SLP2 and biological progression in a set of GC (GSE15460, n = 200). Result showed that gene sets of cell cycle were enriched in samples with high expression of SLP2 (Figure S1A). Then, we conducted cell cycle analysis and found that percentage of G1 phrase cells were increased in SLP2 knockdown (KD) MGC803 cell while both G2 and S phrase cells were decreased (Figure S1E). As normal cells cycle is critical for normal cell proliferation machinery, we detected the growth rate by means of CCK8 and colony formation assay. It turned out that SLP2 deficiency significantly suppressed the proliferation of GC cell and inhibited the colony forming rate (Figure S2F and G). To confirm this, we deleted SLP2 in MGC803 cells using CRISPR (clustered regularly interspaced short palindromic repeats)/Cas9 genome-editing technology. We obtained multiple independent SLP2 knockout (KO) clones verified by PCR and sequencing (Figure S1H and I). Three different clones generated by sgRNA were used for further study. We found that cell proliferation and colony formation of SLP2 KO MGC803 cell were drastically suppressed, whereas the capabilities of proliferation and colony formation were recovered after SLP2 restoration (Figure 2A and B). Conversely, overexpression of SLP2 accelerated cell proliferation and promoted colony formation of AGS cell (Figure C and D). To elucidate the role of SLP2 in tumor growth in vivo, we subcutaneously inoculated equal numbers of normal control or SLP2 KO cells into the hind limps of NCG mice and monitored their growth. It showed that deletion of SLP2 strongly inhibited tumor growth in vivo while SLP2-restored cells subsequently re-accelerated tumor progression (Figure 2E-H). Taken together, our data demonstrate that deletion of SLP2 in tumor cells promotes GC cell growth both in vitro and in vivo.
SLP2 promotes proliferation and colony formation rate of GC cell in vitro and tumor growth in vivo. A, proliferation rates of SLP2 knocked-out and restored MGC803 cells measured by CCK8 assay, 5000 indicated cells were plated in 96 culture-plates. MGC803-N.C group were transfected with Cas9 lentivirus and then non-target sgRNA lentivirus. Data are presented as means ± SEM from five independent experiments. The p values were determined using a two-way ANOVA test. ***p < 0.001, B, 500 indicated cells were plated in 6 well culture-plates and the colonies were stained with Giemsa for quantification. Data presented as means ± SEM from three independent experiments. ** p < 0.01, ***p < 0.001, one-way ANOVA test. C, optical density (OD) value of SLP2 overexpressed and mock lentivirus transfected AGS cells measured. 5000 indicated cells were plated in 96 culture-plates. Data presented as means ± SEM from five independent experiments. ***p < 0.001, two-way ANOVA test. D, 500 indicated cells were plated in 6 well culture-plates for colony formation. Data presented as means ± SEM from three independent experiments. ***p < 0.001, unpaired t test. E, 1×10⁶ cell were transplanted into NCG mice (N.C: non-target sgRNA transfected), and tumor growth was monitored after the indicated times. Data are presented as means ± SEM; n = 10 tumors for each group. ***p < 0.001, two-way ANOVA test. F, tumors derived from hind limbs of NCG mice 50 days after subcutaneous injection of indicated cells. G, tumor weight was determined 50 days after transplantation. Data are presented as means ± SEM; n = 10 for each group. p < 0.001, one-way ANOVA test. H, representative H&E staining of primary tumors.
SLP2 competes against E3 ubiquitin ligase SKP2 to bind with PHB and decreases the ubiquitination level of PHB
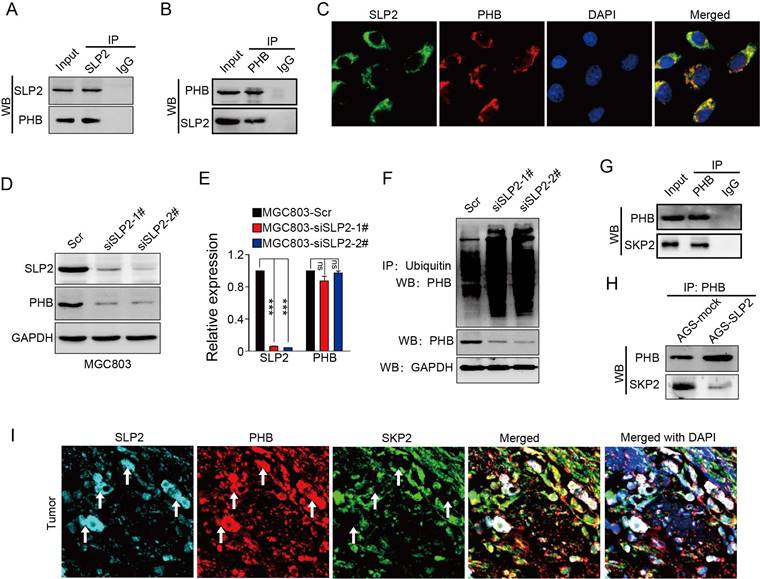
We analyzed the potential proteins that interconnect with SLP2 in String database and predicted 10 potential binding partners (Figure S2A), among which we noticed a protein, prohibitin (PHB), which was also screened as an oncogene in GC [20]. Both SLP2 and PHB belong to a family of proteins that share an evolutionarily conserved stomatin/prohibitin/flotillin/HflK/C (SPFH) domain [21]. Data from TCGA and GEO database showed mRNA levels of SLP2 and PHB are positively correlated (Figure S2B and C). We performed co-immunoprecipitation using antibodies against SLP2 in cell extracts from MGC803 and showed that PHB could be precipitated by SLP2 (Figure 3A), and vice versa (Figure 3B). Immunofluorescence staining showed that SLP2 and PHB co-localized distinctly in MGC803 cells, suggesting the interaction between SLP2 and PHB (Figure 3C). Moreover, we found that expression of PHB was decreased in either SLP2 KO or KD MGC803 cell (Figure 3D). However, silence of SLP2 did not affect the mRNA level of PHB in MGC803 cells (Figure 3E), suggesting that SLP2 might affect PHB expression at the posttranscriptional level. Based on analysis of posttranslational modification pattern of PHB in PTMfunc database, we noticed it had multiple target sites for ubiquitination (Figure S3B). We measured the ubiquitination of PHB in MGC803 cell and found that loss of SLP2 increased the ubiquitination level of PHB (Fig 3F). Next, we predicted 20 potential E3 ligases that might interact with PHB (Figure S3C). A co-immunoprecipitation assay revealed that SKP2 could bind to PHB (Figure 3G) but failed to bind with SLP2 (Figure S3D). Furthermore, we found that level of SKP2 precipitated by PHB was decreased in SLP2 overexpressed AGS cell (Figure 3H). Moreover, immunofluorescence staining showed that the SLP2 highly expressed loci were always accompanied with higher density of PHB staining where SKP2 staining was week or absent (Figure 3I white arrow), while where PHB expressed moderately is co-localized with SKP2 but failed to stain SLP2 (Figure 3I). These results suggested that SLP2 could compete against SKP2 to bind with PHB and stabilize its expression.
SLP2 competes against SKP2 to bind with PHB and stabilizes its expression. A and B, total cell lysates from MGC803 cell were immunoprecipitated (IP) with anti-SLP2 or anti-PHB and subjected to immunoblot anti-indicated antibody. C, immunofluorescence staining of SLP2 and PHB in MGC803 cells. D, immunoblot analysis of indicated protein in SLP2 KD MGC803 cells. E, mRNA levels of SLP2 and PHB measured by RT-Q-PCR in indicated cells. Data presented as means ± SEM from three independent experiments. ***p < 0.001, ns = not significance, one-way ANOVA test. F, expression vector for HA-ubiquitin combined with Scr or siRNAs were transfected into MGC803 cells. Total cell lysates prepared from the transfected cells stimulated with MG132 (20 μM) for 8h, were precipitated with anti-ubiquitin and subjected to immunoblot with anti-PHB. G, total cell lysates from AGS cell were precipitated with anti-PHB and subjected to immunoblot with anti-PHB and anti-SKP2 antibody. H, concentration of total cell lysates from AGS-mock and AGS-SLP2 cells were measured. Same mass of protein in each group was precipitated with anti-PHB and subjected to immunoblot with anti-PHB and anti-SKP2 antibody. I, Immunofluorescence staining of SLP2, PHB and SKP2 in GC tissue.
PHB is essential for SLP2-induced activation of MAPK signaling pathway and acceleration of tumor growth
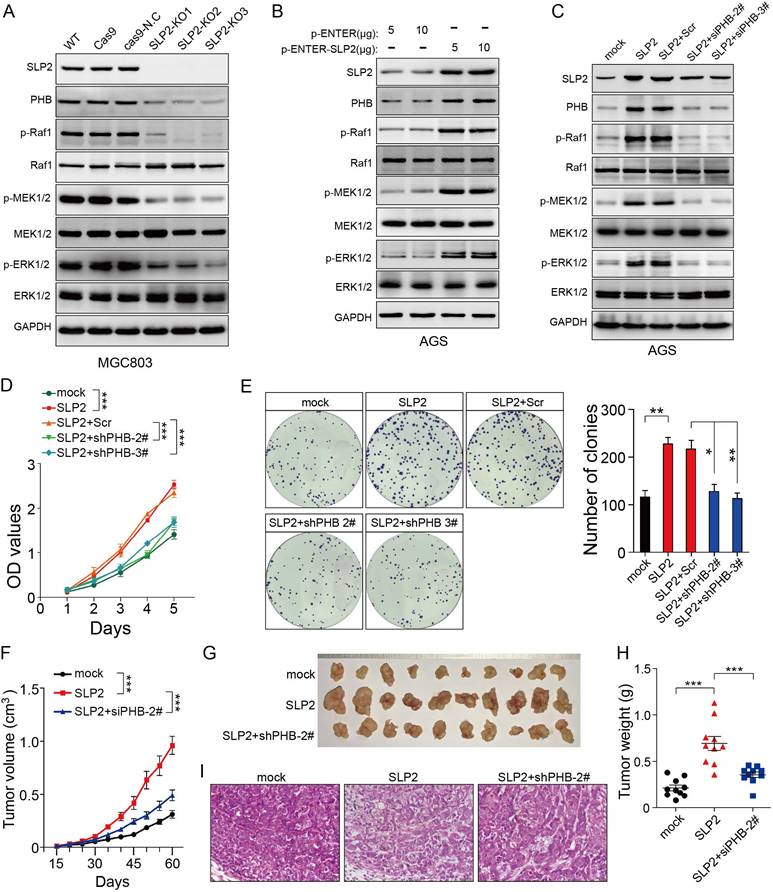
Although we found that SLP2 contributed to the stabilization of PHB, the role of PHB in cancer remains controversial. So we intended to determine the function of PHB in GC. Tumor tissues and paired normal tissues in 114 cases of GC patients were stained with PHB. It turned out that 69.3% (79/114) of GC tissues showed higher level than paired normal tissues (Figure S4A) and patients with relatively higher PHB expression underwent poor survival (Figure S4B). We investigated the potential effect of PHB on gastric cancer in vitro and in vivo. The results showed that knockdown of PHB suppressed cell proliferation, colony formation and tumor growth in mouse xenograft models (Figure S4F-I). In addition, PHB silence inhibited activation of MAPK signaling pathway (Figure S4J), which was consistent with its role in cervical cancer cell [22]. These observations prompted us to hypothesize that SLP2 might promote tumor growth through MAPK signaling pathway. Therefore, we examined the activity of MAP kinase and found that either SLP2 KO or KD inhibited the phosphorylation levels of Raf1, MEK1/2 and ERK1/2 (Figure 4A and Figure S3A), while SLP2 up-regulation promotes their phosphorylation (Figure 4B). Furthermore, we silenced PHB in SLP2 up-regulated AGS cell and revealed SLP2 induced increase of p-Raf1, p-MEK1/2 and p-ERK1/2 were inhibited when PHB was knocked down (Figure 4C). Moreover, cell proliferation, colony formation and xenograft tumor growth promoted by SLP2 overexpression were attenuated when PHB expression was inhibited (Figure 4D-I). Thus, we concluded that PHB is essential for SLP2-induced activation of MAPK signaling pathway and acceleration of tumor growth.
PHB is essential for the MAPK signaling pathway activation and tumor growth induced by SLP2. A, B and C, Total cell lysates prepared from the indicated cells were subjected to immunoblot with different antibodies. D, 5000 indicated cells were plated in 96 culture-plates and OD values were measured. Data presented as means ± SEM from five independent experiments. ***p < 0.001, two-way ANOVA test. E, 500 indicated cells were plated in 6 well culture-plates for colony formation. Data presented as means ± SEM from three independent experiments. * p < 0.05, ** p < 0.01, ***p < 0.001, one-way ANOVA test. F, indicated cells (1×10⁶) were transplanted into NCG mice, and tumor growth was monitored. Data are presented as means ± SEM; n = 10 tumors for each group. ***p < 0.001, two-way ANOVA test. G and H, image and weights of tumors derived from hind limbs of NCG mice 60 days after subcutaneous injection of indicated cells (1×10⁶). Data are presented as the means ± SEM (n = 10). ***p < 0.001, Mann-Whitney test. I, representative H&E staining of primary tumors.
ELK1 binds to the promoter region of SLP2 and SLP2 induced phosphorylation of ELK1 could promote transcription of SLP2
Gene set enrichment analysis showed that genes potentially regulated by ELK1 were significantly enriched in SLP2 highly expressed tissues compare to lower ones (Figure 5A). Unexpectedly, we noticed that SLP2 was a potential gene regulated by ELK1 (Figure 5B). To further investigate the regulatory mechanism between ELK1 and SLP2, we searched for possible binding sites for ELK1 in SLP2 promoter region in Consite (http://consite.genereg.net/) and Jaspar (http://jaspardev.genereg.net/) database. As is shown in figure 5C-E and figure S5A-F, we derived the position frequency matrix of ELK1 binding sites, and found 4 sets of DNA alignment that showed high comparability with sequence logo for ELK1 in the promoter region of SLP2 in Consite database and 2 binding sites in Jaspar database. We conducted a chromatin immunoprecipitation (ChIP) assay to detect the binding capacity of ELK1 on SLP2 promoter. It reported that ELKl and SRF transcription factors form a ternary complex at the c-fos serum response element [23], so we set enrichment level of c-fos promoter as positive control. ChIP assays revealed that SLP2 only directly bound to position 4 binding site of the SLP2 promoter among the four predicted sites (Fig 5F).
ELK1 binds to the promoter region of SLP2 and phosphorylation of ELK1 promotes transcription of SLP2. A and B, gene set enrichment analysis showed enrichment of potential genes regulated by ELK1 in SLP2 highly expressed tissues. C, sequence logo for ELK1 binding derived from Consite database. D and E, prediction of potential ELK1 binding sites in SLP2 promoter region. F, total cell lysates from MGC803 cell were immunoprecipitated (IP) with anti-Histone H3 (positive control), anti-IgG (negative control) and ELK1 and subjected to RT-Q-PCR. Enrichment of c-fos promoter was set as a positive control for ELK1 binding. Data are presented as the means ± SEM from three independent experiments. ***p < 0.001, unpaired t test. G, indicated vectors were co-transfected into 293T cells and cells were stimulated with or without EGF for 48 hr and cell lysates were subjected to luciferase assay. Data are presented as the means ± SEM from three independent experiments. **p < 0.01, ***p < 0.001, one-way ANOVA. H-J, western blot to detect total ELK1 and phosphorylated ELK1 in indicated cells. K, indicated vectors and siRNAs were co-transfected into 293T cells and cell lysates were subjected to luciferase assay. Data are presented as the means ± SEM from three independent experiments. **p < 0.01, ***p < 0.001, one-way ANOVA.
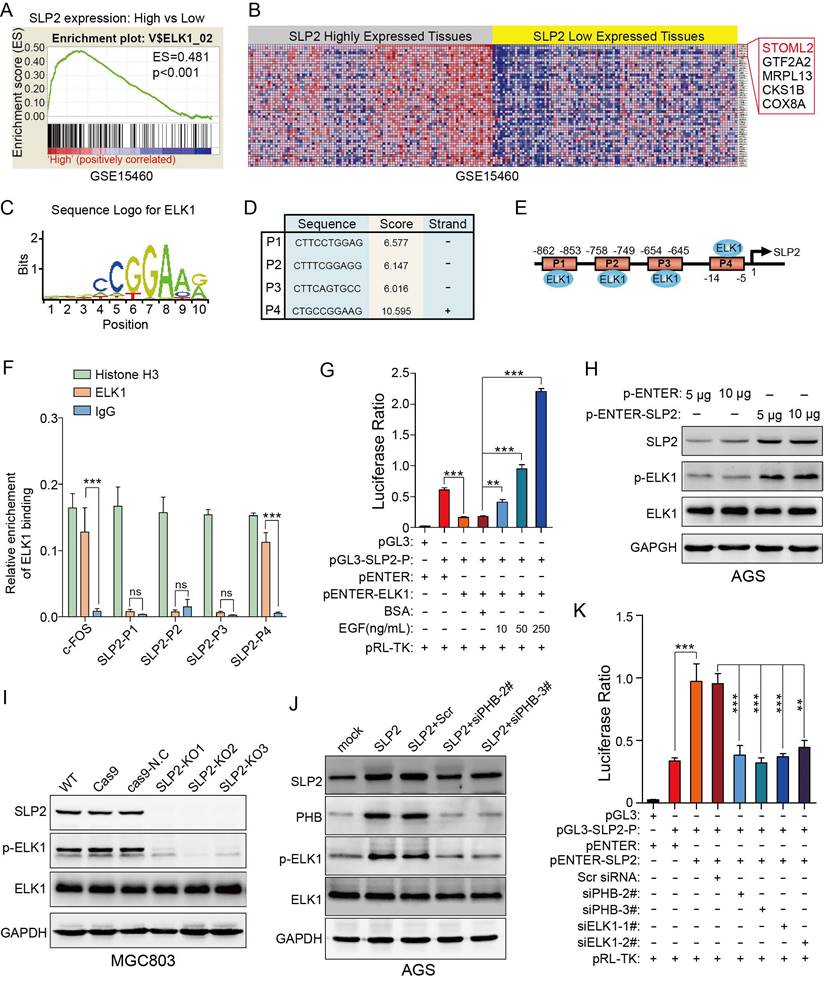
Next, we performed a dual luciferase reporter assay to assess its transcriptional activity. Surprisingly, the luciferase ratio was abnormally declined in cells transfected with pENTER-ELK1 and pGL3-SLP2-Promoter vectors (Fig 5G). It was reported that phosphorylation of ERK, which could be induced by EGF stimulation or gain-function mutation of Kras, was critical for ELK1-mediated ternary complex formation and transactivation [24, 25]. So we added EGF to the culture medium to promote phosphorylation of ELK1 and noticed that the luciferase ratio was dramatically increased in dose-dependent manner (Figure 5G). Taken together, these results suggest that dephosphorylated ELK1 may have dominant negative effect on SLP2 promoter and p-ELK1 is sufficient to promote SLP2 transcription.
It is documented that ELK1 could be modified by p-ERK1/2 in phosphorylated manner and we have showed that SLP2 positively regulated phosphorylation of ERK1/2 [24, 25]. Next, the effect of SLP2 on phosphorylation of ELK1 was investigated and it revealed that overexpression of SLP2 promoted ELK1 phosphorylation (Figure 5H); whereas knockout of SLP2 suppressed ELK1 phosphorylation in GC cells (Figure 5I). Moreover, silence of PHB in SLP2 overexpressed AGS cell inhibits phosphorylation of ELK1 (Figure 5J). Thus, SLP2 could promote phosphorylation of ELK1 through MAPK signaling pathway.
Taken together, we revealed a positive feedback loop between SLP2 and ELK1, in which SLP2 could promote ELK1 phosphorylation and phosphorylated ELK1 could in turn promote transcription of SLP2. To verify this, we overexpressed SLP2 in cell transfected with pGL3-SLP2-Promoter to evaluate the luciferase activity. We found that SLP2 elevation enhanced luciferase ratio, while either knockdown of PHB or ELK1 was sufficient to inhibit the transcription activity (Figure 5K). Nevertheless, we constructed a plasmid that tagged triple flag label to SLP2 and transfected it into AGS cell line to distinguish exogenous and endogenous expression of SLP2. We noticed that endogenous expression of SLP2 was increased notably when 3×flag-SLP2 plasmid was transfected (Figure S5H). Gene set enrichment analysis also revealed that ELK1 regulated genes, including SLP2, were significantly enriched in PHB high-expressed tissues (Figure S5I and J). In addition, both mRNA and protein levels of SLP2 were suppressed in PHB knockdown cell (Figure S5K and L). All above, SLP2 contributes to the stabilization of PHB and phosphorylation of ELK1 which could in turn promote SLP2 transcription.
Sorafenib abrogates the accelerated cell proliferation induced by SLP2 elevation through inhibiting activation of MAPK signaling pathway
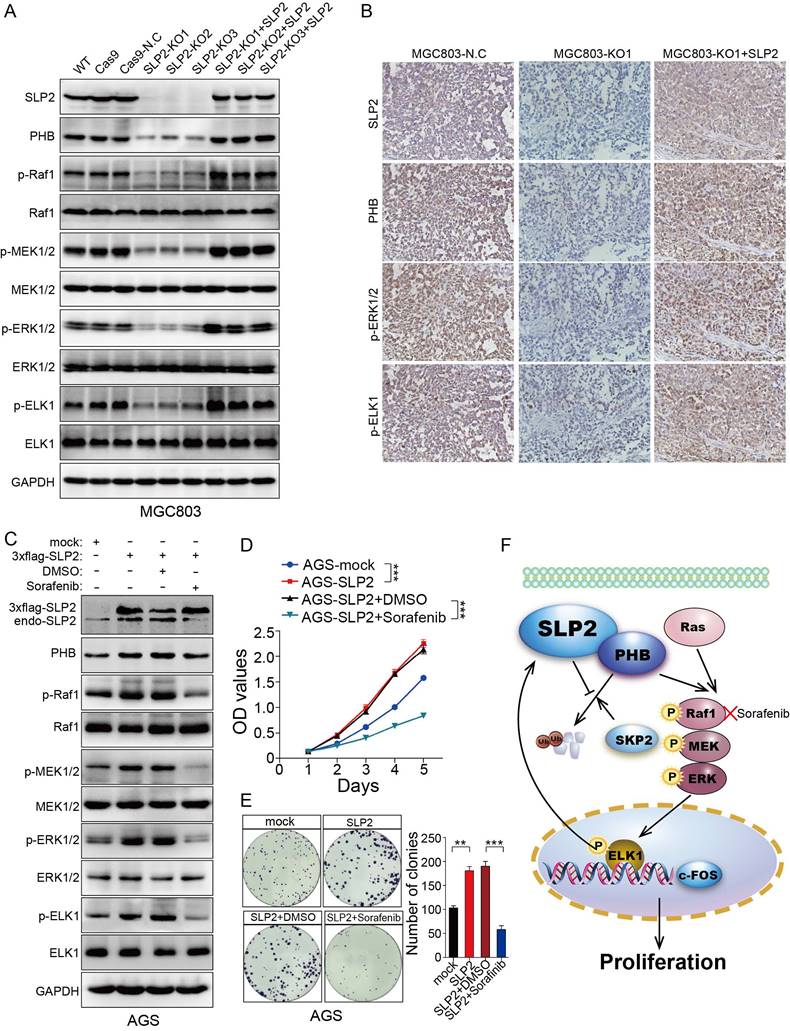
We restored SLP2 expression in SLP2-KO MGC803 cells and found PHB, p-Raf1, p-MEK1/2, p-ERK1/2 and p-ELK1 positively correlated with SLP2 variation (Figure 6A). Moreover, PHB, p-ERK1/ 2 and p-ELK1 expression were also suppressed in SLP2 knockout tumor tissue and reactivated after SLP2 restoration based on IHC staining of serial sections (Figure 6B). These results indicate critical role of SLP2 for the activation of MAPK signaling pathway and motivate us to explore potential reagent to control GC progression by targeting this pathway. Sorafenib, a Raf1 inhibitor which has been administrated in several types of carcinoma [26, 27], was added into the medium of SLP2 overexpressed AGS cell. We noticed that Sorafenib significantly inhibited phosphorylation of Raf1, MEK1/2, ERK1/2 and ELK1 (Figure 6C). Interestingly, Sorafenib also inhibits endogenous SLP2 expression while it has no influence on exogenous 3×flag-SLP2 level (Figure 6C), which indicated that MAPK signaling pathway and ELK1 activation is critical for the elevation of SLP2. Moreover, Sorafenib drastically suppressed the proliferation and colony formation rate of SLP2 overexpressed cells (Figure 6D and E). We concluded that Sorafenib was able to abrogate the accelerated proliferation induced by SLP2 in GC cell. Afterwards, we investigated the anti-proliferative effects of Sorafenib on MGC803 cell and found that proliferation and colony formation rate of MGC803 cell was significantly suppressed in vitro (Figure S6A and B). Furthermore, Sorafenib also inhibited the MGC803 xenograft tumor growth (Figure S6C-E). Thus, Sorafenib might be an alternative strategy for the management of GC.
Sorafenib abrogates the accelerated cell proliferation induced by SLP2 elevation through inhibiting activation of MAPK signaling pathway. A, indicated proteins detected by immunoblot in SLP2 knocked-out and restored MGC803 cells. B, IHC analysis of indicated proteins in tumor tissues derived from NCG mice xenograft model. C, indicated proteins of AGS/Vector and AGS/SLP2 combined with treatment of Sorafenib analyzed by western blot. D, 5000 indicated cells were plated in 96 culture-plates and OD values were measured. Data presented as means ± SEM from five independent experiments. ***p < 0.001, two-way ANOVA test. E, 500 indicated cells were plated in 6 well culture-plates for colony formation. DMSO or sorafenib (10 μM) were added to the culture medium. Data presented as means ± SEM from three independent experiments. **p < 0.01, ***p < 0.001, one-way ANOVA test. F, diagrammatic sketch of the downstream and role of SLP2 in GC.
Discussion
Preliminarily, we explored the expression level and clinical significance of SLP2 in GC [5]. However, its biological function and regulation mechanism was still undisclosed that propelled us to explore the role of SLP2 in GC especially when we noticed the growing evidence of its correlation with clinical outcome in several types of malignancy. We demonstrate that SLP2 expression is significantly correlated with cell cycle and loss of SLP2 induce cell arrest in G1 phase. Evidence so far has illustrated that cell-cycle dysregulation will result in uncontrolled cell proliferation and promote tumor development by initiating unscheduled cell division [28]. We reveal that deletion of SLP2 drastically suppresses cell proliferation in cultured cells and tumor growth in xenograft implants. Mechanistically, we discover that SLP2 competes against SKP2 to bind with PHB and enhances its stability to activate MAPK signaling pathway. Overexpression of SLP2 also promotes phosphorylation of ELK1 which could in turn bind to the promoter of SLP2 and promote its transcription (Figure 6F). Moreover, we found that Sorafenib, which specifically inhibits phosphorylation of Raf1, could attenuate accelerated proliferation rate by SLP2 up-regulation in GC cell.
As an interaction protein of SLP2, the role of PHB in cancer remains controversial. PHB was originally thought to be a tumor suppressor that played a central role in the inhibition of cell-cycle progression through interacting with p53 and retinoblastoma tumor suppressor protein (RB) in the nucleus [29, 30]. Further evidences showed the anti-tumorigenic effect of PHB in prostate cancer [31] and liver cancer [32]. As for GC, Down-regulation of PHB by miR-27a was thought to explain why suppression of miR-27a can inhibit gastric cancer cell growth [33]. Despite PHB was reported with anti-tumorigenic properties, there were mounting evidence indicating its pro-tumorigenic role. PHB expression was increased in tumor tissues of the cervix [34], esophagus [35], breast [36], lung [37], bladder [38], thyroid [39], ovary [40], and prostrate [41]. Down-regulation of PHB expression drastically reduced the rate of cell division and capability to exhibit anchorage-independent growth in certain cancer cell lines [42] and PHB was shown to be necessary for the activation of Raf1 by the oncogene Ras in HeLa cells [22]. Furthermore, three independent researches revealed that GC tissues also showed higher expression compared to paired normal tissue [20, 43, 44]. In our study, we found that loss of PHB inhibited cell proliferation and tumor growth and provided unprecedented evidence between PHB level and prognosis of GC patients. Moreover, we show that PHB is indispensable for SLP2 to activate MAPK signaling pathway. Reassessing the paradoxical reports of PHB, we notice that PHB is identified to be a tumor suppressor especially if the level of PHB is increased in the nucleus which might interact with p53 and RB [29, 30], whereas elevated PHB in cytoplasm and cytomembrane, documented in many reports, may facilitate tumorigenesis [34-41]. Further studies are needed to clarify the distinct function of intracellular sub-localization of PHB during the progression of cancer. As is displayed in our report, SLP2 level was mostly elevated in cytoplasm which competed against E3 ubiquitin ligase SKP2 to bind with PHB and stabilized expression of PHB. SLP2 not only contributed to the stability of PHB but also retained PHB in cytoplasm that might be the most important factor to induce the dysfunction of this loop.
Surprisingly, we discovered that transcription factor ELK-1, which could activate multiple oncogenes, was capable to bind to the promoter of SLP2. However, only transfection of vector with ELK-1 open reading frames suppressed transcription of SLP2. Previous works showed that phosphorylated C-terminal region of ELK-l by p-ERK1/2 or epidermal growth factor (EGF) stimulation was critical for ELK-1-meditated transcriptional activation [24, 25]. In our study, ELK1 overexpression combined with EGF stimulation significantly promoted SLP2 transcription, which indicated potential dominant negative role of dephosphorylated ELK1 to SLP2 promoter. This unexpected role of phosphorylated ELK1 on SLP2 activation along with the regulation of SLP2 on ELK1 through MAP kinase activation suggested a positive feedback loop of SLP2-ELK1 in GC progression. Moreover, we revealed that exogenous SLP2 overexpression followed with elevation of endogenous SLP2 and inhibition of MAP kinase activity suppressed endogenous SLP2 expression. Together, these results provide evidence to elucidate the up-regulation mechanism of SLP2 in GC.
Our current study represents the first comprehensive investigation into the functional relationship and regulation mechanism between SLP2 and GC. SLP2 suppresses proteolysis of PHB which is also demonstrated to be an oncogene in GC in this work. This provides a novel mechanism of tumor promoting role of SLP2-PHB complex and disrupting their connection may be an attractive target for future therapeutic strategies in GC management. Furthermore, sorafenib induced inhibition of Raf1 phosphorylation similarly suppressed cell proliferation in SLP2 overexpressed cells. Therefore, Raf1 inhibitors would be a novel and exciting therapeutic approach for SLP2 highly expressed GC.
Abbreviations
GC: gastric cancer; CCK8: cell counting kit 8; GSEA: gene set enrichment analysis; KD: knockdown; KO: knockout; siRNA: small interference RNA; sgRNA: small guide RNA.
Supplementary Material
Supplementary figures and tables.
Acknowledgements
This work was supported by the National Natural Science Foundation of China (81672446, 81573015, 81600496), State's Key Project of Research and Development Plan (2017YFC0108300), Guangdong Provincial Science and Technology Key Project (2014A020215014), Guangdong Provincial natural Science Foundation for Distinguished Young Scientists (2015A030306048), Guangzhou science and technology collaborative innovation major projects (201704020071), Research Fund of Public Welfare in the Health Industry, National Health and Family Planning Commission of China (201402015), Southern Medical University Clinical Research Start-Up Project (LC2016ZD003), Key Clinical Specialty Discipline Construction Program ((2012)121) and the Natural Science Foundation of Guangdong Province (No. 2017A030310115 and No. 2015A030313252).
Competing Interests
The authors have declared that no competing interest exists.
References
1. Torre LA, Bray F, Siegel RL, Ferlay J, Lortet-Tieulent J, Jemal A. Global cancer statistics, 2012. CA Cancer J Clin. 2015;65:87-108
2. Hu Y, Huang C, Sun Y, Su X, Cao H, Hu J. et al. Morbidity and Mortality of Laparoscopic Versus Open D2 Distal Gastrectomy for Advanced Gastric Cancer: A Randomized Controlled Trial. J Clin Oncol. 2016;34:1350-7
3. Chen W, Zheng R, Baade PD, Zhang S, Zeng H, Bray F. et al. Cancer statistics in China, 2015. CA Cancer J Clin. 2016;66:115-32
4. Cancer Genome Atlas Research N. Comprehensive molecular characterization of gastric adenocarcinoma. Nature. 2014;513:202-9
5. Liu D, Zhang L, Shen Z, Tan F, Hu Y, Yu J. et al. Increased levels of SLP-2 correlate with poor prognosis in gastric cancer. Gastric Cancer. 2013;16:498-504
6. Wang Y, Morrow JS. Identification and Characterization of Human SLP-2, a Novel Homologue of Stomatin (Band 7.2b) Present in Erythrocytes and Other Tissues. J Biol Chem. 2000;275:8062-71
7. Sprenger RR, Speijer D, Back JW, De Koster CG, Pannekoek H, Horrevoets AJ. Comparative proteomics of human endothelial cell caveolae and rafts using two-dimensional gel electrophoresis and mass spectrometry. Electrophoresis. 2004;25:156-72
8. Hajek P, Chomyn A, Attardi G. Identification of a novel mitochondrial complex containing mitofusin 2 and stomatin-like protein 2. J Biol Chem. 2007;282:5670-81
9. Christie DA, Lemke CD, Elias IM, Chau LA, Kirchhof MG, Li B. et al. Stomatin-like protein 2 binds cardiolipin and regulates mitochondrial biogenesis and function. Mol Cell Biol. 2011;31:3845-56
10. Bini L, Pacini S, Liberatori S, Valensin S, Pellegrini M, Raggiaschi R. et al. Extensive temporally regulated reorganization of the lipid raft proteome following T-cell antigen receptor triggering. Biochem J. 2003;369:301-9
11. Kirchhof MG, Chau LA, Lemke CD, Vardhana S, Darlington PJ, Marquez ME. et al. Modulation of T Cell Activation by Stomatin-Like Protein 2. J Immunol. 2008;181:1927-36
12. Christie DA, Kirchhof MG, Vardhana S, Dustin ML, Madrenas J. Mitochondrial and plasma membrane pools of stomatin-like protein 2 coalesce at the immunological synapse during T cell activation. PLoS One. 2012;7:e37144
13. Zhang L, Ding F, Cao W, Liu Z, Liu W, Yu Z. et al. Stomatin-like protein 2 is overexpressed in cancer and involved in regulating cell growth and cell adhesion in human esophageal squamous cell carcinoma. Clin Cancer Res. 2006;12:1639-46
14. Cui Z, Zhang L, Hua Z, Cao W, Feng W, Liu Z. Stomatin-like protein 2 is overexpressed and related to cell growth in human endometrial adenocarcinoma. Oncol Rep. 2007;17:829-33
15. Song L, Liu L, Wu Z, Lin C, Dai T, Yu C. et al. Knockdown of stomatin-like protein 2 (STOML2) reduces the invasive ability of glioma cells through inhibition of the NF-kappaB/MMP-9 pathway. J Pathol. 2012;226:534-43
16. Liu Z, Yang Y, Zhang Y, Ye X, Wang L, Xu G. Stomatin-like protein 2 is associated with the clinicopathological features of human papillary thyroid cancer and is regulated by TGF-beta in thyroid cancer cells. Oncol Rep. 2014;31:153-60
17. Xiao B, Xie Z, Guo L, Wu J, Zhang H. Stomatin-like protein 2 expression is associated with clinical survival in patients with cervical cancer. Int J Clin Exp Pathol. 2015;8:1804-9
18. Sun F, Ding W, He JH, Wang XJ, Ma ZB, Li YF. Stomatin-like protein 2 is overexpressed in epithelial ovarian cancer and predicts poor patient survival. BMC Cancer. 2015;15:746
19. Zhang L, Liu F. Expression of SLP-2 gene and CCBE1 are associated with prognosis of rectal cancer. Eur Rev Med Pharmacol Sci. 2017;21:1214-8
20. Ryu JW, Kim HJ, Lee YS, Myong NH, Hwang CH, Lee GS. et al. The proteomics approach to find biomarkers in gastric cancer. J Korean Med Sci. 2003;18:505-9
21. Theiss AL, Sitaraman SV. The role and therapeutic potential of prohibitin in disease. Biochim Biophys Acta. 2011;1813:1137-43
22. Rajalingam K, Wunder C, Brinkmann V, Churin Y, Hekman M, Sievers C. et al. Prohibitin is required for Ras-induced Raf-MEK-ERK activation and epithelial cell migration. Nat Cell Biol. 2005;7:837-43
23. Latinkic BV, Zeremski M, Lau LF. Elk-1 Can Recruit SRF to Form a Ternary Complex Upon the Serum Response Element. Nucleic Acids Research. 1996;24:1345-51
24. Marais R, Wynne J, Treisman R. The SRF accessory protein Elk-1 contains a growth factor-regulated transcriptional activation domain. Cell. 1993;73:381-93
25. Gille H, Kortenjann M, Thomae O, Moomaw C, Slaughter C, Cobb M. et al. ERK phosphorylation potentiates Elk-1-mediated ternary complex formation and transactivation. EMBO J. 1995;14:951-62
26. Duffy AG, Ma C, Ulahannan SV, Rahma OE, Makarova-Rusher O, Cao L. et al. Phase I and Preliminary Phase II Study of TRC105 in Combination with Sorafenib in Hepatocellular Carcinoma. Clin Cancer Res. 2017;23:4633-41
27. Wilson MA, Zhao F, Khare S, Roszik J, Woodman SE, D'Andrea K. et al. Copy Number Changes Are Associated with Response to Treatment with Carboplatin, Paclitaxel, and Sorafenib in Melanoma. Clin Cancer Res. 2016;22:374-82
28. Lapenna S, Giordano A. Cell cycle kinases as therapeutic targets for cancer. Nat Rev Drug Discov. 2009;8:547-66
29. Fusaro G, Dasgupta P, Rastogi S, Joshi B, Chellappan S. Prohibitin induces the transcriptional activity of p53 and is exported from the nucleus upon apoptotic signaling. J Biol Chem. 2003;278:47853-61
30. Wang S, Nath N, Adlam M, Chellappan S. Prohibitin, a potential tumor suppressor, interacts with RB and regulates E2F function. Oncogene. 1999;18:3501-10
31. Dart DA, Spencer-Dene B, Gamble SC, Waxman J, Bevan CL. Manipulating prohibitin levels provides evidence for an in vivo role in androgen regulation of prostate tumours. Endocr Relat Cancer. 2009;16:1157-69
32. Ko KS, Tomasi ML, Iglesias-Ara A, French BA, French SW, Ramani K. et al. Liver-specific deletion of prohibitin 1 results in spontaneous liver injury, fibrosis, and hepatocellular carcinoma in mice. Hepatology. 2010;52:2096-108
33. Liu T, Tang H, Lang Y, Liu M, Li X. MicroRNA-27a functions as an oncogene in gastric adenocarcinoma by targeting prohibitin. Cancer Lett. 2009;273:233-42
34. Tsai HW, Chow NH, Lin CP, Chan SH, Chou CY, Ho CL. The significance of prohibitin and c-Met/hepatocyte growth factor receptor in the progression of cervical adenocarcinoma. Hum Pathol. 2006;37:198-204
35. Ren HZ, Wang JS, Wang P, Pan GQ, Wen JF, Fu H. et al. Increased expression of prohibitin and its relationship with poor prognosis in esophageal squamous cell carcinoma. Pathol Oncol Res. 2010;16:515-22
36. Sato T, Sakamoto T, Takita K, Saito H, Okui K, Nakamura Y. The human prohibitin (PHB) gene family and its somatic mutations in human tumors. Genomics. 1993;17:762-4
37. Nan Y, Yang S, Tian Y, Zhang W, Zhou B, Bu L. et al. Analysis of the expression protein profiles of lung squamous carcinoma cell using shot-gun proteomics strategy. Med Oncol. 2009;26:215-21
38. Wu T, Wu H, Wang Y, Chang T, Chan S, Lin Y. et al. Prohibitin in the pathogenesis of transitional cell bladder cancer. Anticancer Res. 2007;27:895-900
39. Gu Y, Ande SR, Mishra S. Altered O-GlcNAc modification and phosphorylation of mitochondrial proteins in myoblast cells exposed to high glucose. Arch Biochem Biophys. 2011;505:98-104
40. Gregory-Bass RC, Olatinwo M, Xu W, Matthews R, Stiles JK, Thomas K. et al. Prohibitin silencing reverses stabilization of mitochondrial integrity and chemoresistance in ovarian cancer cells by increasing their sensitivity to apoptosis. Int J Cancer. 2008;122:1923-30
41. Ummanni R, Junker H, Zimmermann U, Venz S, Teller S, Giebel J. et al. Prohibitin identified by proteomic analysis of prostate biopsies distinguishes hyperplasia and cancer. Cancer Lett. 2008;266:171-85
42. Sievers C, Billig G, Gottschalk K, Rudel T. Prohibitins are required for cancer cell proliferation and adhesion. PLoS One. 2010;5:e12735
43. He QY, Cheung YH, Leung SY, Yuen ST, Chu KM, Chiu JF. Diverse proteomic alterations in gastric adenocarcinoma. Proteomics. 2004;4:3276-87
44. Kang X, Zhang L, Sun J, Ni Z, Ma Y, Chen X. et al. Prohibitin: a potential biomarker for tissue-based detection of gastric cancer. J Gastroenterol. 2008;43:618-25
Author contact
![]() Corresponding authors: Guoxin Li, M.D. Ph.D. Department of General Surgery, Nanfang Hospital, Southern Medical University, No. 1838 Guangzhou Avenue North, Guangzhou 510515, China. Tel.: (86)2061641682; Fax: (86)2061641683; E-mail: gzliguoxincom OR Weijie Zhou Ph.D. Departments of Pathology, School of Basic Medical Science, Southern Medical University, Guangzhou 510515, China. Tel.: (86)2062789544; Fax: (86)2062789544; E-mail: weijiezhouumcom OR Jiang Yu, M.D. Department of General Surgery, Nanfang Hospital, Southern Medical University, No. 1838 Guangzhou Avenue North, Guangzhou 510515, China. Tel.: (86)2062787170; Fax: (86)2061642148; E-mail: balbccom
Corresponding authors: Guoxin Li, M.D. Ph.D. Department of General Surgery, Nanfang Hospital, Southern Medical University, No. 1838 Guangzhou Avenue North, Guangzhou 510515, China. Tel.: (86)2061641682; Fax: (86)2061641683; E-mail: gzliguoxincom OR Weijie Zhou Ph.D. Departments of Pathology, School of Basic Medical Science, Southern Medical University, Guangzhou 510515, China. Tel.: (86)2062789544; Fax: (86)2062789544; E-mail: weijiezhouumcom OR Jiang Yu, M.D. Department of General Surgery, Nanfang Hospital, Southern Medical University, No. 1838 Guangzhou Avenue North, Guangzhou 510515, China. Tel.: (86)2062787170; Fax: (86)2061642148; E-mail: balbccom