Impact Factor
- Issue 14; 2026
- Issue 13; 2026
- Issue 12; 2026
- Issue 11; 2026
- Issue 10; 2026
- Volume 16; 2026
- Advance Articles
- Past Issues
- Cover Images
- Cover Suggestion
- Index & Coverage
- Special Issues
Introduction
Methods
Results
Discussion
Abbreviations
Supplementary Material
Acknowledgements
References
International Journal of Biological Sciences
International Journal of Medical Sciences
 Global reach, higher impact

Theranostics 2019; 9(3):811-828. doi:10.7150/thno.29271 This issue Cite
Research Paper
RACK1 Promotes Self-Renewal and Chemoresistance of Cancer Stem Cells in Human Hepatocellular Carcinoma through Stabilizing Nanog
Junxia Cao1,*, Min Zhao1,2,*, Jian Liu1,2, Xueying Zhang1, Yujun Pei1, Jingyang Wang1, Xiao Yang3, Beifen Shen1,2, Jiyan Zhang1,2, ![]()
1. Institute of Basic Medical Sciences, 27 Taiping Road, Beijing 100850, China
2. Beijing Institute of Brain Sciences, 27 Taiping Road, Beijing 100850, China
3. State Key Laboratory of Proteomics, Beijing Proteome Research Center, National Center for Protein Sciences (Beijing), Beijing Institute of Lifeomics, Beijing 102206, China
*These authors contributed equally to this work.
Received 2018-8-16; Accepted 2018-12-18; Published 2019-1-24
Abstract

Targeting cancer stem cells (CSCs) has been proposed as a new strategy to eradicate malignancies, including hepatocellular carcinoma (HCC). However, the mechanisms by which CSCs sustain their self-renewal and chemoresistance remain elusive. Nanog is a master transcriptional regulator of stemness, especially in CSCs. Its expression is tightly regulated by the ubiquitin-proteasome system in embryonic stem cells (ESCs). Whether the suppression of Nanog ubiquitination contributes to its over-expression in CSCs has not been explored. In addition, the role of receptor for activated C kinase 1 (RACK1), an adaptor protein implicated in HCC growth, in liver CSC-like traits remains to be determined.
Methods: In vitro and in vivo assays were performed to investigate the role of RACK1 in liver CSC-like phenotype and murine ESC function. How RACK1 regulates Nanog expression was explored by immunoblotting and immunohistochemistry. The interaction of RACK1 with Nanog and the consequent effects on Nanog ubiquitination and stemness were then analyzed.
Results: RACK1 promotes self-renewal and chemoresistance of human liver CSCs and maintains murine ESC function. Consistently, RACK1 enhances the expression of Nanog in human HCC cells and murine ESCs. The protein levels of RACK1 in clinical HCC tissues positively correlate with those of Nanog. Further exploration indicates that RACK1 directly binds to Nanog, which prevents its recruitment of E3 ubiquitin ligase FBXW8 and ubiquitin-dependent degradation. The interaction with Nanog is essential for RACK1 to promote stemness.
Conclusions: Our data provide novel insights into the regulation of Nanog protein levels, as well the key role of RACK1 to enhance self-renewal and chemoresistance of CSCs in human HCC.
Keywords: Nanog, RACK1, CSCs, ESCs, ubiquitination
Introduction
Hepatocellular carcinoma (HCC) is the third leading cause of cancer death worldwide, particularly in the Asia-Pacific region and Africa [1]. The high rate of recurrence and heterogeneity are the two major features of HCC [2]. The concept that tumor arises from a subpopulation of stem-like cells, usually named as cancer stem cells (CSCs) or tumor-initiating cells, accounts for intratumoral heterogeneity [3-6]. Several defined surface markers have been used for the enrichment of CSCs in HCC [7-10]. CSCs have high capability of self-renewal and drug-resistance and, consequently, contribute to tumorigenesis and recurrence. Therefore, targeting CSCs has been proposed as a new strategy to eradicate malignancies, including HCC [3-6]. Despite that, the mechanisms by which CSCs sustain their self-renewal and chemoresistance remain largely unknown.
A small inhibitor of several tyrosine kinases, sorafenib, is the most commonly used monotherapy agent for the treatment of HCC [11]. However, intrinsic or acquired resistance to sorafenib frequently occurs [11]. Sorafenib resistance is positively correlated with stemness-related genes, especially Nanog [12-16]. Nanog knockdown renders HCC cells sensitive to sorafenib [16]. Various microRNAs, transcription factors, and kinases have been revealed to modulate the phenotype of CSCs through mediating the over-expression or silencing of Nanog [3-6]. Therefore, Nanog has been proposed as a central regulator of CSCs [3-6].
While the transcription and epigenetic regulation of Nanog gene have been extensively explored, comparatively little is known about the post-transcriptional regulation of Nanog. In embryonic stem cells (ESCs), Nanog is tightly regulated by the ubiquitin-proteasome system (UPS) through a PEST motif that lies in the N-terminal region [17,18]. F-box protein FBXW8 and deubiquitinase USP21 have been suggested to be the ubiquitin E3 ligase and the deubiquitinating enzyme that govern Nanog stability in ESCs, respectively [19-22]. Furthermore, the phosphorylation of Nanog at Ser/Thr-Pro motifs facilitates its physical interaction with the prolyl isomerase Pin1 in ESCs and, hence, stabilizes Nanog by preventing its degradation through the UPS [18,23]. However, it remains unknown whether the suppression of Nanog ubiquitination contributes to its over-expression in CSCs.
Receptor for activated C kinase 1 (RACK1) was originally identified on the basis of its ability to anchor activated form of protein kinase C (PKC). As a member of the Trp-Asp (WD) repeat protein family, it has been recognized as an adaptor protein involved in multiple intracellular signaling pathways. Elevated levels of RACK1 mRNA [24,25] or protein [26,27] have been observed by different groups in clinical HCC samples. RACK1 expression is well correlated with the clinical stage as well as the poor prognosis [26,27]. Over-expressed RACK1 augments the activity of c-Jun N-terminal protein kinase (JNK) and thus promotes HCC growth through directly binding to JNK specific upstream kinase MKK7 and enhancing its activity [26]. Moreover, ribosomal RACK1 couples with PKCβII to promote the phosphorylation of eukaryotic initiation factor 4E (eIF4E), which leads to preferential translation of the potent factors involved in growth and survival [27]. However, the role of RACK1 in liver CSC-like traits remains to be determined. In this work, we show that RACK1 directly binds to Nanog and thus reduces its ubiquitination, which contributes to the self-renewal and chemoresistance of CSCs in human HCC.
Methods
Plasmids, small-interfering RNAs (siRNAs), and short hairpin RNAs (shRNAs)
7Gli:GFP was a gift from Michael Lewis (Addgene plasmid #110494) [28]. Nanog reporter was kindly provided by Dr. Ping Wang [29]. pcDNA3.1 (+) vector, pEGFP-N1 vector, and pGEX-KG vector were used to construct the other mammalian or prokaryotic expression vectors. PCR-amplified products were cloned into these vectors and confirmed by DNA sequencing. Human RACK1 siRNA (ACCAGGGATGAGACCAACT), human MKK7 siRNA (CGCTCCGGGAACAAGGAGG), human FBXW8 siRNA (GCCTTTCTTTGATATCCAA), and the non-targeting control (NC) siRNA were purchased from Shanghai GenePharma (Shanghai, China). Lentivirus-based human RACK1 shRNA (GGATGAGACCAACTATGGAAT), murine RACK1 shRNAs (1#: GTCCCGAGACAAGACCATAAA, 2#: CCCACTTCGTTAGTGATGTTG), and NC shRNA were ordered from Shanghai GeneChem (Shanghai, China). Another set of lentivirus-based human RACK1 shRNA (RACK1-b) and control lentivirus were ordered from Santa Cruz Biotechnology (Santa Cruz, CA, USA, Cat. No. sc-36354-v). Lentivirus-based Nanog expression vector driven by EF1α promoter and control lentivirus were purchased from Cellomic Technology (Halethorpe, MD, USA, Cat. No. PLV-10075-50).
Cell culture, transfection, and transduction
Human HCC cell lines used in this study have been described previously [26] and were cultured in Dulbecco's modified Eagle's medium (DMEM) supplemented with 10% fetal bovine serum (FBS; HyClone, Logan, UT, USA, Cat. No. SH30070.03), 100 U/ml penicillin, and 100 μg/mL streptomycin. Murine ESCs were grown on feeder layers of γ-irradiated murine embryonic fibroblasts in DMEM supplemented with 15% FBS, 2 mM Glutamine (Hyclone, Cat. No. SH30034.01), 0.1 mM nonessential amino acids (Hyclone, Cat. No. SH3238.01), 0.1 mM β-mercaptoethanol, 100 U/ml penicillin, and 100 μg/ml streptomycin and passaged every 3 days [30]. Transfection was performed with Lipofectamine 2000 (Invitrogen, Carlsbad, CA, USA, Cat. No. 52887). Transduction was performed with lentivirus (multiplicity of infection=10). Stable clones were selected in 600 μg/mL neomycin (Invitrogen, Cat. No. 10131027) or 1 μg/mL puromycin (Sigma-Aldrich, St. Louis, MO, USA, Cat. No. P8833) for approximately 2 months.
Flow cytometry analysis
After HCC cells were digested with trypsin, single-cell suspensions were stained with PE-conjugated CD13 antibody (BD Biosciences, Bedford, MA, USA, Cat. No. 555394) or APC-conjugated CD133 antibody (Miltenyi Biotech, Bergisch Gladbach, Germany, Cat. No. 130-113-668) in PBS containing 0.1% sodium azide and 2% FBS for 30 min on ice in the dark. Samples were washed once in staining buffer. Then, the cells were fixed with 1% (w/v) paraformaldehyde in PBS and preserved at 4 ºC. An isotype antibody was included as negative control. For apoptosis analysis, cells were stained with anti-CD13-PE and Annexin V-FITC (BioLegend, San Diego, CA, USA, Cat. No. 640906) or Annexin V-APC (BioLegend, Cat. No. 640920) resuspended in 300 μL binding buffer containing calcium ion for 30 min on ice in the dark. Samples were washed once in binding buffer. Apoptosis was immediately assessed by flow-cytometric analysis of Annexin-V staining in CD13+ cells. Flow cytometry was performed on a FACSCalibur machine (BD Biosciences).
Sphere formation assays
HCC cells stained with PE-conjugated CD13 antibody were sorted using a FACSVantage (BD Biosciences) and plated into ultra-low attached 96-well plates. Each well was seeded with 100 cells. Cells were cultured in DMEM/F12 media (Invitrogen, Cat. No. 88215) supplemented with B27 (Invitrogen, Cat. No. 12587010), 20 ng/mL epidermal growth factor (PeproTech, Rocky Hill, USA, Cat. No. 37000015), 20 ng/mL of basic fibroblast growth factor (PeproTech, Cat. No. 100-18B), 10 ng/mL hepatocyte growth factor (PeproTech, Cat. No. 100-39). Next, 1% methyl cellulose (Sigma, Cat. No. M7027) was added to prevent cell aggregation, and individual sphere derived from a single cell was confirmed. After 4-5 days, equal fresh media was added. Cells were incubated for 10-14 days and spheres with a diameter of more than 75 μm were counted. Sphere formation ability was calculated as the number of spheres divided by the initial seeding cell number × 100%. For serial passaging, spheres were harvested and dissociated into single cells with trypsin.
Alkaline phosphatase (AP) activity analysis
Single-cell suspensions (1×10⁵/sample) of murine ESCs were subjected to alkaline phosphatase activity analysis with an alkaline phosphatase assay kit (Abcam, Eugene, OR, USA, Cat. No. ab83369) according to the manufacturer's protocol. Measurement was taken at OD405 on a microplate reader.
Immunohistochemistry
Formaldehyde-fixed and paraffin-embedded clinical HCC samples were examined for Nanog (Abcam, Cat. No. ab109250) and RACK1 (BD Bioscience, Cat. No. 610178) staining on tissue microarray slides obtained from US Biomax (see detailed clinicopathological features in Table S1). Patients' consent and approval by the local ethics committee were obtained for the use of the clinical materials in research. Immunohistochemistry was performed using standard protocols with citrate buffer (pH 6.0) pretreatment. Briefly, the sections were incubated with primary antibodies at 4 °C overnight and then with horseradish peroxidase-conjugated secondary antibodies at 37 °C for 30 min. The sections were finally incubated with diaminobenzidine and counterstained with hematoxylin for detection. Staining was assessed by pathologists blinded to the origination of the samples and subject outcome. Each specimen was assigned a score according to the intensity of the staining (no staining = 0; weak staining = 1, moderate staining = 2, strong staining = 3) and the extent of stained cells (0% = 0, 1-24% = 1, 25-49% = 2, 50-74% = 3, 75-100% = 4). The final immunoreactive score was determined by multiplying the intensity score with the extent of score of stained cells, ranging from 0 (the minimum score) to 12 (the maximum score).
Fluorescent multiplex immunohistochemistry (mIHC) with tyramide signal amplification was performed with an Opal 7-Color Manual IHC kit ordered from PerkinElmer (Akron, OH, USA, Cat. No. NEL811001KT) according to the manufacturer's protocol. The aforementioned primary antibodies and secondary antibodies were used. Antibodies against CD13 (Cat. No. 66211-1-Ig) and AFP (Cat. No. 14550-1-Ap) were ordered from Proteintech (Chicago, IL, USA).
In vivo tumorigenicity experiments
Male nonobese diabetic/severe combined immunodeficient (NOD/SCID) mice were purchased from Institutes of Experimental Animals, Academy of Chinese Medical Sciences (Beijing, China) and maintained under specific-pathogen-free conditions. All experiments were performed in accordance with institutional guidelines for animal care. 5,000 or 500 CD13+ HuH7 cells were suspended in 100 μL of DMEM and Matrigel (1:1) (BD Biosciences, Cat. No. 356234) and injected subcutaneously into six-to-eight-week-old NOD/SCID mice. Mice were sacrificed for evaluation of tumor incidence and tumor weight 5 or 7 weeks later.
Glutathione S-transferase (GST) pull-down assays
GST or GST-RACK1 were expressed and purified as previously described [26]. Lysates of HuH7 cells were incubated with GST or GST-RACK1 bound to glutathione-Sepharose beads (Amersham Pharmacia, Pittsburgh, PA, USA, Cat. No. 17-0756-01), and the adsorbed proteins were analyzed by immunoblotting analysis.
Coimmunoprecipitation (Co-IP) and immunoblotting (IB)
Cells were homogenized in RIPA buffer (50 mM Tris-HCl, pH 7.5, 1% NP40, 0.35% DOC, 150 mM NaCl, 1 mM EDTA, 1 mM EGTA, supplemented with protease and phosphatase inhibitor cocktail) or IP lysis buffer (10 mM Tris-HCl, pH 7.5, 2 mM EDTA, 1% NP40, 150 mM NaCl, supplemented with protease and phosphates inhibitor cocktail). Nuclear cytoplasmic fractionation, coimmunoprecipitation, and immunoblotting analysis were performed as previously described [31-33]. Antibodies against Nanog (Cat. No. 4903 and 8822, for IB), Phospho-JNK (Thr183/Tyr185, Cat. No. 4671), Phospho-Akt (Ser473, Cat. No. 4060), Akt (Cat. No. 4691), and MKK7 (Cat. No. 4172) were purchased from Cell Signaling Technology (Danvers, MA, USA). Antibodies against RACK1 (Cat. No. sc-10775, for IP), Nanog (Cat. No. sc-293121, for IP), β-catenin (Cat. No. sc-7963), c-Myc (Cat. No. sc-40), USP21 (Cat. No. sc-79305), and actin (Cat. No. sc-7210) were from Santa Cruz Biotechnology. Antibody against RACK1 (Cat. No. 610178, for IB) was from BD Bioscience. CGP53353 (Cat. No. C7866), cycloheximide (Cat. No. C7698), MG132 (Cat. No. M8699), and antibody against FLAG (M2, Cat. No. F1804) were from Sigma-Aldrich. Antibodies against Myc-tag (Cat. No. M192-3) and GFP (Cat. No. 598) were from MBL International (Woburn, MA, USA). Antibodies against Oct4 (Cat. No. ab19857) and Sox2 (Cat. No. ab97959) were purchased from Abcam. Antibody against Pin 1 (Cat. No. AM2212b-ev) was from Abgent (San Diego, CA, USA). Antibody against FBXW8 (Cat. No. abs127583) was from Absin (Shanghai, China).
In vivo ubiquitination assays
Cells were solubilized in a modified lysis buffer (50 mM Tris-Cl, pH 7.4, 150 mM NaCl, 10% glycerol, 1 mM EDTA, 1 mM EGTA, 1% SDS, 1 mM Na3VO4, 1 mM DTT, and 10 mM NaF) supplemented with protease inhibitor cocktail (Roche Diagnostics). After incubation at 60 ºC for 10 min, the cell lysates were 10 times diluted with the same modified lysis buffer without SDS. Next, immunoprecipitation was performed with an antibody against FLAG, GFP, or Nanog, followed by immunoblotting.
Indirect immunofluorescence analysis
HuH7 cells, grown on cover slides, were washed twice in PBS, fixed with 4% (w/v) paraformaldehyde in PBS for 10 min at room temperature, and then permeabilized with 0.5% Triton X-100 in PBS for 15 min. The nonspecific sites were blocked by incubation with 1% bovine serum albumin in PBS for 30 min at room temperature. Cells were then rinsed in PBS containing 0.05% Tween 20 for 5 min and incubated with an anti-Nanog antibody (Cell Signaling Technology, Cat. No. 4903) and an anti-RACK1 antibody (BD Bioscience, Cat. No. 610178) diluted in blocking buffer for 1 h at room temperature or overnight at 4 °C. After being washed for three times in PBS containing 0.05% Tween 20, the cells were incubated with TRITC-conjugated goat anti-rabbit IgG and FITC-conjugated goat anti-mouse IgG for 45 min at room temperature. The cells were washed again as stated above, incubated with 1 μg/mL 4′,6-diamidine-2-phenylindole, and then observed under a laser scanning confocal microscopy (RADIANCE 2100; Bio-Rad).
Quantitative real-time reverse-transcriptase polymerase chain reaction (qRT-PCR)
RNA was extracted by using TRIzol reagent. cDNA was derived from 1 μg total RNA by reverse transcription using Moloney murine leukemia virus reverse transcriptase and oligo(dT) primer in ReverTra Ace® qPCR RT kit (TOYOBO Life Sciences, Osaka, Japan, Cat. No. FSK-101). Quantitative PCR was performed with SYBR Green Realtime PCR Master Mix (TOYOBO Life Sciences, Cat. No. QPK-201) in a CFX96 Real-Time System (BIO-RAD). For all assays, PCR reaction conditions were 94 °C for 30 s, followed by 40 cycles of amplification (94 ˚C for 5 s, 60 ˚C for 30 s and 72 ˚C for 30 s). GAPDH mRNA was used to normalize RNA inputs. Primers for human multidrug resistance protein 1 (MDR1) were: 5'-CCCATCATTGCAATAGCAGG-3' (forward) and 5'-GTTCAAACTTCTGCTCCTGA-3' (reverse), for human multidrug resistance-associated protein 1 (MRP1) were: 5'-GAAGGACTTCGTGTCAGCC-3' (forward) and 5'-GTCCATGATGGTGTTGAGCC-3' (reverse), for human lung resistance protein (LRP) were: 5'-GGATGTCAAGACCGGAAAGGT-3' (forward) and 5'-TCTTTCTCCCACGGACTTCGT-3' (reverse), for human Nanog were: 5'-TGAACCTCAGCTACAAACAG-3' (forward) and 5'- TGGTGGTAGGAAGAGTAAAG-3' (reverse), and for human GAPDH were: 5'-ACCCACTCCTCCACCTTTGA-3' (forward) and 5'-TCCACCACCCTGTTGCTGTA-3' (reverse).
Migration
10,000 CD13+ or CD13- HCC cells were resuspended in 100 μL serum-free media and seeded onto the inside of a transwell chamber (8.0 μm pore size, Costar Inc., Corning, NY, USA, Cat. No. 3422). A 900-μL DMEM medium with 20% FBS and 10 μg/mL mitomycin C (Sigma-Aldrich, Cat. No. M0503) was added to bottom chamber of each well. After 24 h, the non-migrating cells were removed with cotton buds and the lower cells were fixed with methanol and stained with Giemsa dye.
Reporter assays
For Nanog reporter, HuH7 cells were transfected with the firefly luciferase reporter and the renilla luciferase vector. After 36 h, cells were harvested in lysis buffer (25 mM Tris-Cl (pH7.8), 25 mM DTT, 2 mM 1,2-diaminocyclo-hoxane N,N,N,N'-tetracetic acid, 10% glycerol, 1% Triton X-100), and luciferase assays were performed using the dual-luciferase reporter assay system (Promega, Madison, WI, USA, Cat. No. E1910). For Hedgehog signaling activity, HCC cells were transfected with the 7Gli-GFP reporter. 36 h later, the percentages of GFP+ cells were measured by flow cytometry.
Statistical analysis
Differences between variables were assessed by Spearman, Wilcoxon rank-sum test, Kruskal-Wallis Test, or 2-tailed Student's t-test. Statistical calculations were performed using SPSS 13.0 (SPSS Inc., Chicago, IL, USA). P values of less than 0.05 were considered statistically significant.
Results
RACK1 promotes self-renewal and chemoresistance of human liver CSCs and maintains murine ESC function
Recent evidence indicates hepatic CSCs at the single-cell level are phenotypically, functionally, and transcriptomically heterogeneous [34]. Therefore, the identification and definition of liver cancer stem cells requires both immunophenotypic and functional properties. CD13 has been used by independent groups as a human liver CSC surface marker [7,35-39]. We observed that CD13+ subpopulation in either HuH7 or SMMC-7721 human HCC cell line showed much higher capacity of sphere formation (Figure S1A), sorafenib resistance (Figure S1B), and migration (Figure S1C) than CD13- counterpart. When CD13+ HCC cells were cultivated in 10% serum-supplemented medium, the proportion of CD13+ cells significantly reduced after 10 days (Figure S1D). These data suggest that CD13+ cells could differentiate to CD13- cells in conventional culture conditions. Since it has been reported that CSCs show preferential overexpression of ESC-specific pluripotency transcription factors Nanog, Oct4, and Sox2 [5,12,40], it is possible these proteins are enriched in CD13+ subpopulations. Immunoblotting analysis confirmed this hypothesis (Figure S2A), supporting the notion that CD13 is a marker for CSCs in HCC. In addition, CD133 is another well-characterized surface marker for “CSCs” derived from both HCC lines and patients' samples of HCC [10,41,42]. Flow cytometry revealed that CD133 exhibited certain enrichment in CD13+ subpopulations (Figure S2B). Therefore, we identify CD13+ cells as hepatic CSCs in this study.
As expected, RACK1 protein showed enrichment in CD13+ HCC cells as compared with their CD13- counterparts (Figure S2A). In this scenario, we set out to analyze the effects of RACK1 loss-of-function or gain-of-function on the self-renewal and chemoresistance of human liver CSCs. Efficient knockdown of RACK1 with lentivirus carrying RACK1 shRNA in these two cell lines (Figure 1A and Figure S3A) led to shrinkage of the CD13+ (Figure 1B and Figure S3B) and CD13+CD133+ (Figure 1B) cell pools. Remnant CD13+ cells in RACK1 shRNA group exhibited reduced RACK1 expression, albeit still slightly higher than CD13- cells in NC shRNA group (Figure 1C), which was associated with impaired sphere formation (Figure 1D and Figure S3C), diminished tumorigenicity (Figure 1E), increased sensitivity to the therapeutic agents, etoposide and sorafenib (Figure 1F and Figure S3D), and decreased expression of drug-resistant relative genes MDR1, MRP1, and LRP (Figure 1G).
RACK1 promotes self-renewal and chemoresistance of human liver CSCs and maintains murine ESC function. (A-N) 96 h after HuH7 cells were infected with lentivirus expressing non-targeting control (NC) shRNA or RACK1 shRNA (A-G), or after HuH7 single clone stably expressing FLAG-RACK1 and the mock control were generated (H-N), cells were subjected to the following assays: (A,H) Immunoblotting (IB) analysis of RACK1 expression in total cells. (B,I) Flow cytometric analysis of CD13 and CD133 expression in total cells. (C,J) Immunoblotting analysis of RACK1 expression in sorted CD13+ and CD13- subpopulations. (D,K) Sphere formation assays of sorted CD13+ subpopulation. mean±s.d. (n=3); *P<0.05, **P<0.01. (E,L) In vivo tumorigenicity experiments of sorted CD13+ subpopulation (5000 cells/site, 7 weeks, n=6). (F,M) Etoposide (Etop, 100 μM, 48 h)- or sorafenib (Sora, 50 μM, 24 h)-induced apoptosis of CD13+ subpopulation. mean±s.d. (n=3); Ctrl, control. (G,N) qRT-PCR analysis of sorted CD13+ subpopulation for the expression of the indicated drug-resistant relative genes. mean±s.d. (n=3). (O-Q) 96 h after murine ESCs were infected with lentivirus expressing non-targeting control shRNA or RACK1 shRNAs, cells were subjected to immunoblotting analysis for RACK1 expression (O), colony formation assays (mean±s.d., n=3; scale bar: 1 cm) (P), and alkaline phosphatase (AP) activity assays (mean±s.d., n=3) (Q).
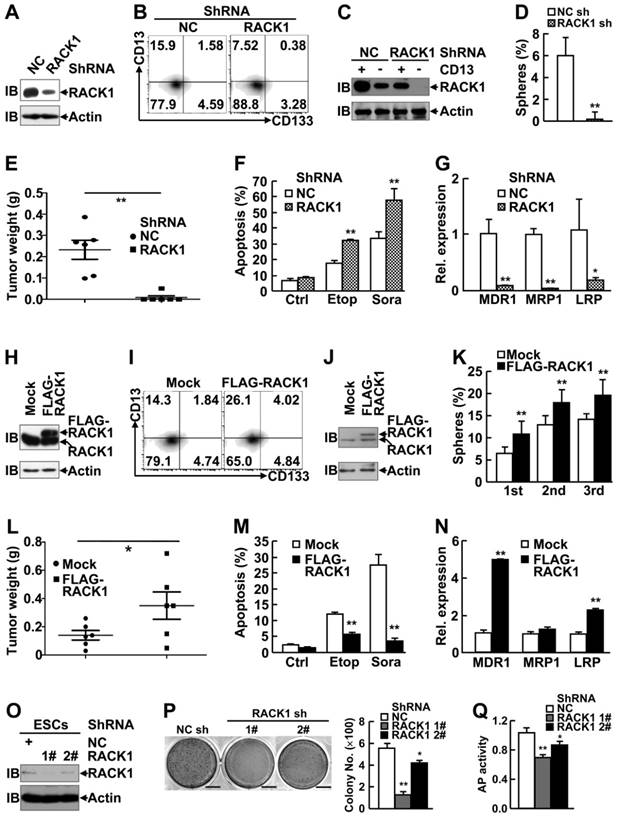
Next, HuH7 single clone, stably expressing FLAG-RACK1, and the mock control were generated (Figure 1H). Flow cytometry revealed that RACK1 over-expression led to expansion of the CD13+ and CD13+CD133+ cell pools (Figure 1I). As expected, CD13+ cells in FLAG-RACK1 group expressed exogenous RACK1 protein (Figure 1J). As for self-renewal capacity, RACK1 over-expression resulted in increased numbers of primary and serially passaged spheroids in CD13+ HuH7 cells (Figure 1K), which was associated with augmented tumorigenicity (Figure 1L and Figure S4). RACK1 over-expression also led to increased resistance to the therapeutic agents, etoposide and sorafenib in CD13+ HuH7 cells (Figure 1M), which might be due to increased expression of drug-resistant relative genes MDR1 and LRP (Figure 1N).
Our aforementioned data suggest that RACK1 be implicated in the regulation of stemness. Thus, it is reasonable to hypothesis that RACK1 might affect ESC function. Indeed, RACK1 knockdown in murine ESCs (Figure 1O) led to impaired ability to form colonies (Figure 1P) with marginal effect on ESC survival (Figure S5), which was associated with reduced alkaline phosphatase activity (Figure 1Q).
Enhancement of Nanog expression by RACK1 in human HCC cells and murine ESCs
The pro-tumorigenic effects of RACK1 in human HCC have been attributed to its ability to augment the activity of MKK7 or PKCβII [26,27]. Indeed, immunoblotting analysis revealed slight enrichment of phosphorylated JNK (indicating MKK7 activity) and significant enrichment of c-Myc (indicating PKCβII activity) in CD13+ HCC cells (Figure S2A). We explored whether these two pathways contribute to RACK1-mediated stemness of HCC cells. While silencing of endogenous RACK1 expression by RACK1 siRNA in HuH7 cells led to shrinkage of the CD13+ cell pool and impaired sphere formation by the remnant CD13+ cells, MKK7 knockdown did not affect the proportion of CD13+ cells and only slightly hindered sorted CD13+ cells to form spheres under the same conditions (Figure S6A-C). Selective PKCβII inhibitor CGP53353 exhibited the same effects (Figure S6D-F). Furthermore, CGP53353 failed to inhibit the expression of drug-resistant relative genes MDR1, MRP1, and LRP (Figure S6G), though RACK1/ PKCβII axis has been implicated in chemoresistance [27]. Instead, CGP53353 enhanced MDR1 expression (Figure S6G).
In addition, RACK1 has been demonstrated to promote β-catenin degradation in gastric cancer and activates sonic hedgehog signaling pathway in non-small-cell lung cancer [43,44]. Therefore, it is of interest to explore whether these CSC-related signaling pathways are regulated by RACK1. However, the protein level of β-catenin in HuH7 cells remained unchanged upon RACK1 knockdown or overexpression (Figure 2A-C). On the other hand, RACK1 knockdown partially suppressed and RACK1 overexpression partially enhanced the transcriptional activity of hedgehog downstream effector Gli1 in HuH7 cells (Figure 2D-E). Despite that, the effects were relatively weak and cannot fully explain RACK1-mediated stemness of HCC cells.
Enhancement of Nanog expression by RACK1 in human HCC cells and murine ESCs. (A-C) Immunoblotting analysis of the expression of the indicated stemness-associated genes upon RACK1 knockdown (A,B) or over-expression (C) in HuH7 cells. (D,E) Analysis of Hedgehog signaling activity upon RACK1 knockdown (D) or over-expression (E) in HuH7 cells as indicated by 7Gli-GFP reporter. mean±s.d. (n=3); *P<0.05, **P<0.01. (F-I) Immunoblotting analysis of Nanog expression upon RACK1 knockdown (F,H,I) or over-expression (G) in sorted CD13+ and CD13- HuH7 subpopulations (F,G), in other human HCC cells (H), or in murine ESCs (I). (J,L) Comparison of Nanog expression by immunoblotting 48 h after SMMC-7721 cells were transfected with the indicated siRNAs and a mammalian expression vector encoding Myr-Akt. (K) Immunoblotting analysis of Nanog expression after SMMC-7721 cells were treated with CGP53353 (0, 5, 10 μM) for 48 h. Numbers below the blots are the density of Nanog quantified by scanning densitometry, normalized to Actin, relative to that of the control group.
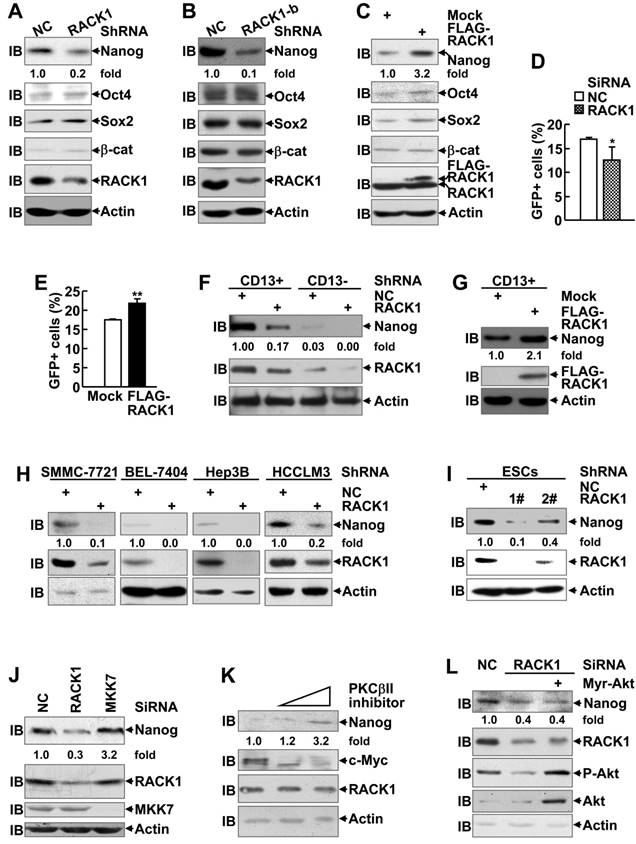
In this scenario, we turned to examine whether the expression of pluripotency transcription factors Nanog, Oct4, and Sox2 is regulated by RACK1 since these proteins are coupled with RACK1 in CD13+ HCC cells (Figure S2A). Immunoblotting analysis revealed silencing of endogenous RACK1 expression in HuH7 cells with two RACK1 shRNAs targeting different sequences led to decreased protein levels of Nanog, but not Oct4 and Sox2 (Figure 2A-B). On the other hand, stable ectopic expression of FLAG-RACK1 in HuH7 cells resulted in opposite effects (Figure 2C). As for the possible correlation with CSC surface marker(s), remnant CD13+ cells in RACK1 shRNA group exhibited reduced Nanog expression, even though still higher than CD13- cells in NC shRNA group (Figure 2F), whereas stable ectopic expression of FLAG-RACK1 further enhanced Nanog expression in CD13+ cells (Figure 2G). These data help explain why the same number of CD13+ sorted cells from different groups display different ability of self-renewal and drug resistance. The reduced levels of Nanog protein upon RACK1 knockdown were also observed in SMMC-7721, BEL-7404, Hep3B, and HCCLM3 human HCC cells (Figure 2H). In addition, RACK1 knockdown resulted in reduced protein level of RACK1 in murine ESCs (Figure 2I).
We also examined the levels of Nanog protein upon silencing of endogenous MKK7 expression or treatment with selective PKCβII inhibitor CGP53353 [27]. As expected, silencing of endogenous RACK1 expression by RACK1 siRNA led to reduced Nanog expression, whereas MKK7 knockdown showed no effect under the same conditions (Figure 2J). Furthermore, administration of selective PKCβII inhibitor CGP53353 failed to inhibit Nanog expression (Figure 2K). By contrast, it enhanced the levels of Nanog protein in a dose-dependent manner, even though c-Myc expression was abolished under the same conditions (Figure 2K). In addition, RACK1 knockdown led to reduced Akt phosphorylation at Ser473 (Figure 2L), which indicates Akt activity, as reported previously [45,46]. As Akt activity contributes to Nanog expression under certain circumstances [47], it is of interest to test whether RACK1 augments Nanog expression via enhancing Akt activity. For this purpose, we used a mammalian expression vector encoding constitutively activated Akt, Myr-Akt [48]. However, Myr-Akt expression failed to rescue the reduction of Nanog expression upon RACK1 knockdown (Figure 2L). Therefore, novel mechanism(s) might be implicated in the enhancement of Nanog expression by RACK1.
The correlation between RACK1 and Nanog expression in clinical HCC tissues
The protein levels of RACK1 and Nanog in clinical HCC tissues were analyzed by immunohistochemical staining on tissue microarray slides. RACK1 protein was mainly localized in the cytoplasm, whereas Nanog protein exhibited nuclear accumulation with a considerable portion distributed in the cytoplasm (Figure 3A). Consistent with previous observations [26,27], clinical HCC tissues exhibited elevated RACK1 expression than peritumoral liver tissues (Figure 3A and Table S2). The levels of RACK1 protein in the 136 HCC tissues were associated with the tumor size and the clinical stage (Table S3). As expected, clinical HCC tissues also exhibited elevated Nanog expression than peritumoral liver tissues (Figure 3A and Table S4). The levels of Nanog in the 136 HCC tissues were associated with the pathological grade (Table S5). More importantly, the protein levels of RACK1 in clinical HCC tissues positively correlated with those of Nanog (Figure 3A-C).
The correlation between RACK1 and Nanog expression in clinical HCC tissues. (A) 136 formaldehyde-fixed and paraffin-embedded clinical HCC samples were subjected to immunohistochemistry for RACK1 and Nanog staining on tissue microarray slides. Representative paired samples are shown. Scale bar: 50 μm. (B) Box plot of Nanog expression in HCC based on RACK1 expression in the tumors as revealed by immunohistochemistry. Kruskal-Wallis P=0.0009. (C) The protein levels of RACK1 positively correlated with those of Nanog in clinical HCC tissues as revealed by immunohistochemistry. Spearman r=0.2921, P=0.0006. (D) Fluorescent multiplex immunohistochemistry (mIHC) with tyramide signal amplification was performed on tissue microarray slides. Representative clinical HCC samples are shown. Scale bar: 400 μm.
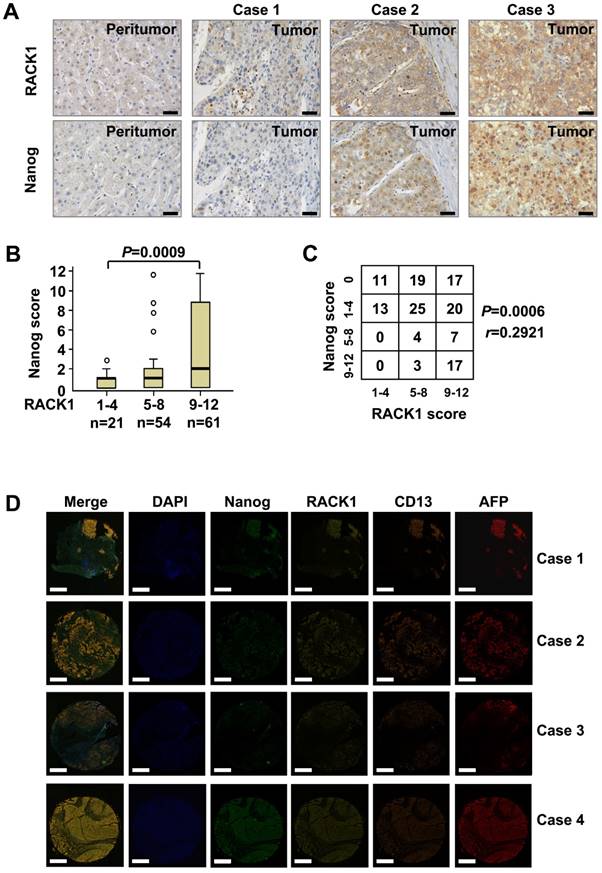
Furthermore, fluorescent multiplex immunohistochemistry (mIHC) with tyramide signal amplification revealed good correlation of RACK1 and Nanog with CD13 in clinical HCC tissues (Figure 3D). Because CD13 was reported to be expressed widely in many normal tissues, including fibroblast, blood cells and epithelium, etc. [49], we employed AFP as a HCC specific marker. As expected, mIHC indicated that RACK1, Nanog, and CD13 were indeed highly expressed in human HCC (Figure 3D).
RACK1 augments Nanog stability through the ubiquitin-proteasome system
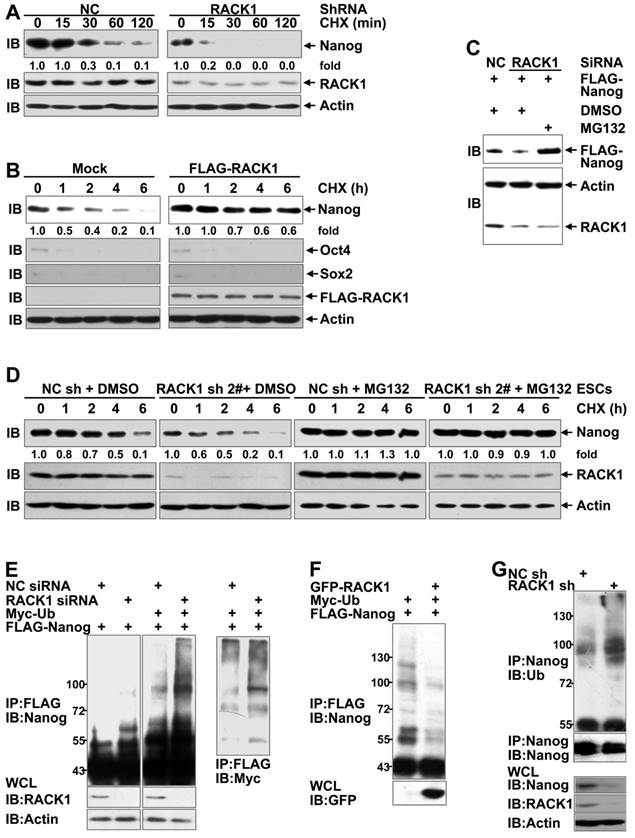
Because the levels of Nanog mRNA were not consistent with those of Nanog protein upon changes in the RACK1 levels (Figure S7), adaptor protein RACK1 might enhance the stability of Nanog. The impact of RACK1 knockdown or over-expression on the stability of Nanog was directly measured by treating human HCC cells with cycloheximide (CHX), which blocks de novo protein synthesis [50]. As expected, silencing of endogenous RACK1 expression shortened the half-life of Nanog protein (Figure 4A) whereas stable ectopic expression of FLAG-RACK1 extended the half-life in HuH7 cells (Figure 4B). By contrast, RACK1 showed no effect on the half-life of Oct4 and Sox2 (Figure 4B). Moreover, RACK1 knockdown reduced the levels of exogenous Nanog protein in human HCC cells (Figure 4C), further suggesting that RACK1 enhances the stability of Nanog. Because the stability of Nanog has been demonstrated to be regulated by the ubiquitin-proteasome system [17-23], we tested whether RACK1 inhibits the degradation of Nanog in a proteasome-dependent manner. The proteasome inhibitor MG132 prevented the reduction of exogenous Nanog protein under the condition of RACK1 knockdown (Figure 4C). Moreover, the shortened half-life of Nanog protein upon RACK1 knockdown also occurred in murine ESCs, but the effects of RACK1 knockdown diminished in the presence of MG132 (Figure 4D). These data suggest that RACK1 might inhibit the ubiquitin-proteasome- dependent degradation of Nanog. Indeed, the ubiquitination of Nanog was significantly increased upon RACK1 knockdown (Figure 4E), whereas ectopic expression of RACK1 resulted in decreased Nanog ubiquitination in in vitro cultured HuH7 cells (Figure 4F). Moreover, the ubiquitination of endogenous Nanog in HuH7 tumors was enhanced upon RACK1 knockdown (Figure 4G). Collectively, these data indicate that RACK1 stabilizes Nanog through down-regulation of Nanog ubiquitination.
RACK1 augments Nanog stability through the ubiquitin-proteasome system. (A) Immunoblotting analysis of the half-life of Nanog protein upon RACK1 knockdown in HuH7 cells with cycloheximide (CHX) treatment for various periods of time. (B) HuH7 single clone stably expressing FLAG-RACK1 and the mock control were treated with cycloheximide for various periods of time. The half-life of Nanog, Oct4, and Sox2 was determined by immunoblotting. (C) HuH7 cells were transfected with the indicated siRNAs and a mammalian expression vector encoding FLAG-Nanog. The protein level of exogenous Nanog was analyzed by immunoblotting with an anti-FLAG antibody. Cells were treated with 20 μM MG132 or equal volume of DMSO for 6 h before cell lysates were harvested. (D) Immunoblotting analysis of the half-life of Nanog protein upon RACK1 knockdown in murine ESCs with cycloheximide treatment for various periods of time in the presence or absence of 20 μM MG132 for 6 h. (E,F) HuH7 cells were transfected with siRNAs and/or mammalian expression vectors as indicated. The ubiquitination of FLAG-Nanog upon RACK1 knockdown (E) or over-expression (F) was analyzed by immunoblotting after immunoprecipitation (IP) with an anti-FLAG antibody. Cells were treated with 20 μM MG132 for 6 h before cell lysates were harvested. WCL, whole-cell lysates; Ub, ubiquitin. (G) The ubiquitination of endogenous Nanog in tumors harvested in Figure 1E was analyzed by immunoblotting after immunoprecipitation with an anti-Nanog antibody. Numbers below the blots are the density of Nanog quantified by scanning densitometry, normalized to Actin, relative to that of the sample without cycloheximide treatment.
RACK1 interacts with Nanog in vitro and in vivo
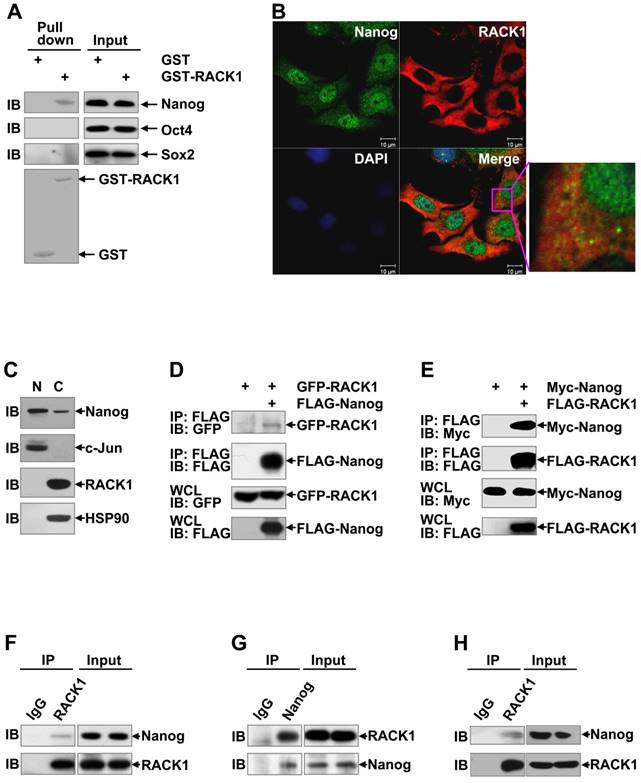
Since RACK1 is an adaptor protein, it is possible that RACK1 reduces Nanog ubiquitination through protein-protein interaction. Previous studies have revealed that various members of the WD repeat protein family might be involved in a Nanog interactome [51,52]. To test whether RACK1 engages a direct interaction with Nanog, we carried out in vitro Glutathione S-transferase pull-down assays. Compared with GST alone, GST-RACK1 specifically precipitated endogenous Nanog, but not Oct4 and Sox2, in lysates of HuH7 cells (Figure 5A). We also checked the possible co-localization of Nanog and RACK1. Consistent with data from clinical HCC tissues (Figure 3A), indirect immunofluorescence analysis revealed that RACK1 was predominantly cytoplasmic, whereas Nanog was predominantly nuclear with a considerable portion distributed in the cytoplasm in HuH7 cells (Figure 5B). Nanog and RACK1 showed co-localization in the cytoplasm (Figure 5B). This notion was confirmed by nuclear cytoplasmic fractionation and subsequent immunoblotting (Figure 5C). The interaction of RACK1 with Nanog was confirmed by coimmunoprecipitation analysis: GFP-RACK1 co-precipitated with co-expressed FLAG-Nanog and Myc-Nanog co-precipitated with co-expressed FLAG-RACK1 in 293T cells (Figure 5D-E). Interestingly, ectopic RACK1 expression failed to enhance exogenous Nanog expression in 293T cells (Figure 5E). In line with this, RACK1 knockdown in 293T cells failed to suppress exogenous Nanog expression (Figure S8). These data suggest that the effects of RACK1 on Nanog expression is cell-type specific. The interaction of RACK1 with Nanog under physiological conditions was then examined. Endogenous Nanog in in vitro cultured HuH7 cells co-precipitated with endogenous RACK1 (Figure 5F). Furthermore, endogenous RACK1 in in vitro cultured HuH7 cells co-precipitated with endogenous Nanog (Figure 5G). The physiological interaction between RACK1 and Nanog was also observed in HuH7 tumors (Figure 5H) and in murine ESCs (Figure S9). Collectively, our data indicate that RACK1 is a direct binding partner for Nanog.
RACK1 interacts with Nanog in vitro and in vivo. (A) GST pull-down assays of the possible direct interaction between RACK1 and core stemness transcription factors. GST-RACK1 or GST bound to glutathione-Sepharose (GSH) beads were incubated with lysates of HuH7 cells. Precipitates were subjected to immunoblotting. (B) HuH7 cells were subjected to indirect immunofluorescence analysis with antibodies against Nanog and RACK1, then counterstained with DAPI followed by confocal microscopy (scale bar: 10 μm). (C) The subcellular localization of Nanog and RACK1 in HuH7 cells was examined by nuclear cytoplasmic fractionation and subsequent immunoblotting. HSP90 was regarded as a cytoplasm (C) marker and c-Jun as a nucleus (N) marker. (D,E) Analysis of the interaction between tagged-RACK1 and tagged-Nanog in 293T cells. 293T cells were transfected with mammalian expression vectors as indicated. Cell lysates were immunoprecipitated with the indicated antibodies. Precipitates were then subjected to immunoblotting. (F-H) Immunoblotting analysis of the interaction between endogenous Nanog and endogenous RACK1 in HuH7 cells (F,G) or tumors harvested in Figure 1E (H) after immunoprecipitation with an anti-RACK1 antibody (F and H, control antibody: rabbit IgG) or an anti-Nanog antibody (G, control antibody: rabbit IgG).
RACK1 reduces Nanog ubiquitination through directly binding to it
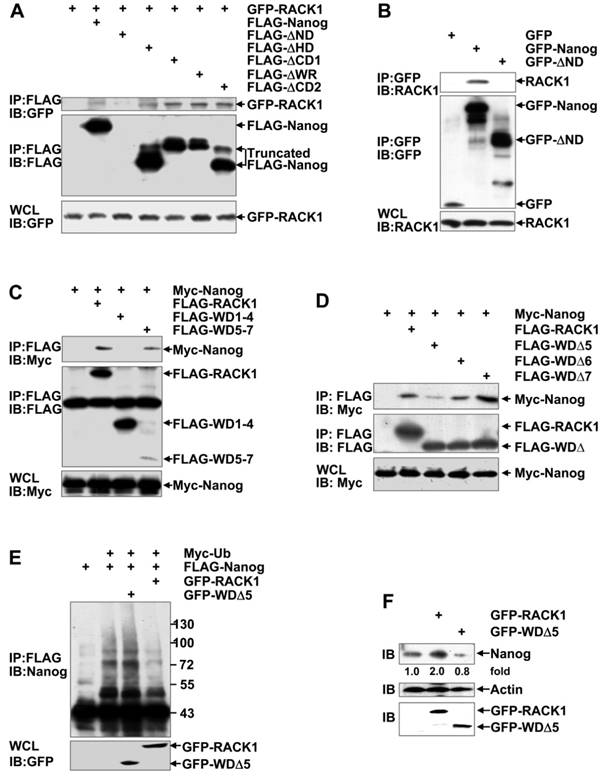
Nanog is composed of an N-terminal domain (ND), a homeodomain (HD), and a C-terminal domain (CD), whereas RACK1 contains seven WD repeats. The CD of Nanog contains a prominent tryptophan-rich (WR) subdomain that divides the CD into three parts (CD1, WR, and CD2). RACK1/Nanog interacting regions were analyzed in 293T cells through generating several deletion mutants followed by coimmunoprecipitation analysis. For some unknown reason(s), we failed to detect the expression of FLAG-tagged ND-truncated Nanog mutant (FLAG-ΔND). However, all the other FLAG-tagged Nanog deletion mutants (FLAG-ΔHD, FLAG-ΔCD1, FLAG-ΔWR, and FLAG-ΔCD2) co-precipitated with co-expressed GFP-RACK1 (Figure 6A). Then, we constructed mammalian expression vectors encoding GFP-Nanog and GFP-ΔND, respectively. Unlike FLAG-ΔND, GFP-ΔND could be detected. Endogenous RACK1 co-precipitated with exogenous GFP-Nanog, but not with exogenous GFP-ΔND (Figure 6B). Nanog mutant lacking the RACK1-binding domain (i.e., the N-terminal domain) undergoes augmented ubiquitination (Figure S10). On the other hand, Myc-Nanog co-precipitated with co-expressed wild type RACK1 and its WD1-4-truncated mutant, but not with co-expressed RACK1 mutant lacking WD5-7 (Figure 6C). Moreover, the RACK1 mutant deficient of WD5 (FLAG-WDΔ5), but not FLAG-WDΔ6 or FLAG-WDΔ7, showed significantly reduced association with co-expressed Myc-Nanog (Figure 6D). Therefore, RACK1 anchors the N-terminal domain of Nanog via its WD5. Deletion of the Nanog-binding domain abrogated the inhibition of Nanog ubiquitination by RACK1 (Figure 6E). Consequently, RACK1 mutant lacking WD5 lost the ability of wild type RACK1 to enhance Nanog expression in HuH7 cells (Figure 6F). By contrast, RACK1 mutant lacking WD5 slightly suppressed the protein level of Nanog in HuH7 cells (Figure 6F). Because RACK1 usually forms a homodimer via its WD4 [53], it is possible that RACK1 mutant lacking WD5 hinders the function of its dimerization partner. Collectively, our data suggest that RACK1 reduces Nanog ubiquitination and thus stabilizes it through direct interaction.
RACK1 reduces Nanog ubiquitination through directly binding to it. (A-D) Mapping RACK1/Nanog interacting regions. 293T cells were transfected with various mammalian expression vectors as indicated. Cell lysates were immunoprecipitated with the indicated antibodies. Precipitates were then subjected to immunoblotting. (E) HuH7 cells were transfected with various mammalian expression vectors as indicated. The ubiquitination of FLAG-Nanog upon over-expression of wild type RACK1 or RACK1 mutant lacking WD5 was analyzed as described in Figure 4E. (F) Endogenous Nanog expression in HuH7 cells upon over-expression of wild type RACK1 or RACK1 mutant lacking WD5 was compared by immunoblotting. Numbers below the blot are the density of Nanog quantified by scanning densitometry, normalized to Actin, relative to that of the control group.
RACK1 prevents the recruitment of FBXW8 by Nanog through directly binding to Nanog
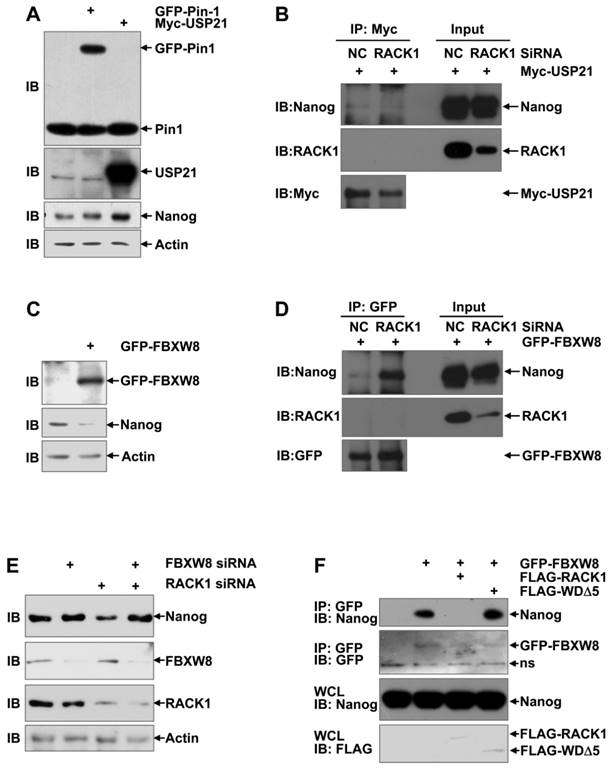
Our aforementioned data show that RACK1 prevents the ubiquitin-dependent degradation of Nanog and their direct interaction is required for this effect. How RACK1 represses the ubiquitination of Nanog is interesting. RACK1 has been reported to either promote or prevent the ubiquitin-proteasome degradation of its interacted proteins, depending on how the interaction might affect the recruitment of the corresponding E3 ubiquitin ligase(s) or deubiquitinase(s) [54-59]. The prolyl isomerase Pin1 and deubiquitinase USP21 have been suggested to stabilize Nanog in ESCs by preventing its degradation through the UPS [18,21-23]. Immunoblotting analysis revealed that ectopic expression of USP21, but not Pin1, significantly enhanced the protein level of Nanog in HuH7 cells (Figure 7A). However, coimmunoprecipitation analysis demonstrated that the interaction between Nanog and USP21 was not suppressed upon RACK1 knockdown (Figure 7B). In this scenario, we turned to the reported Nanog E3 ubiquitin ligase FBXW8 in ESCs [20]. As expected, ectopic expression of FBXW8 led to reduced protein level of Nanog in HuH7 cells (Figure 7C). Importantly, the interaction between Nanog and FBXW8 in HuH7 cells was augmented upon RACK1 knockdown, even though no interaction between RACK1 and FBXW8 was detected under the same conditions (Figure 7D). We then checked whether RACK1 promotes Nanog expression via FBXW8. RACK1 knockdown resulted in diminished protein level of Nanog in HuH7 cells; this effect disappeared upon FBXW8 knockdown (Figure 7E). Furthermore, ectopic expression of wild type RACK1, but not its mutant defective of anchoring Nanog, abrogated the interaction between Nanog and FBXW8 in HuH7 cells (Figure 7F). Together, these data suggest that RACK1 prevents the recruitment of FBXW8 by Nanog through directly binding to Nanog, thereby promoting Nanog expression.
RACK1 prevents the recruitment of FBXW8 by Nanog through directly binding to Nanog. (A,C) HuH7 cells were transfected with mammalian expression vectors as indicated. 24 h later, whole cell lysates were subjected to immunoblotting analysis with antibodies against Pin1, Usp21, GFP, Nanog, and β-actin. (B,D,F) 48 h after HuH7 cells were transfected with the indicated siRNAs and mammalian expression vectors, cells were treated with 20 μM MG132 for 6 h. Cell lysates were immunoprecipitated with the indicated antibodies. Precipitates were then subjected to immunoblotting. (E) HuH7 cells were transfected with the indicated siRNAs. 48 h later, whole cell lysates were subjected to immunoblotting analysis with antibodies against FBXW8, RACK1, Nanog, and β-actin.
RACK1 promotes self-renewal and chemoresistance of human liver CSCs through directly binding to Nanog
It is of importance to analyze the role of Nanog in the enhancement of stemness by RACK1. For this purpose, we restored Nanog expression by lentiviral vector in HuH7 cells expressing RACK1 shRNA. The partially restored Nanog protein level in total cells (Figure 8A) led to partial reversal of the reduced percentage of CD13+ HuH7 cells (Figure 8B). Sorted CD13+ cells showed fully reversed expression of Nanog, even higher than that in NC shRNA group (Figure 8C), which was associated with fully reversed capability of these CSCs to form spheroids (Figure 8D), although the sizes of these spheroids were relatively smaller (data not shown). As for tumorigenicity, the diminished efficiency of tumor formation and the decreased tumor sizes upon RACK1 knockdown was partially reversed (Figure 8E and Figure S11). The increased sensitivity to therapeutic agents and the reduced expression of drug-resistant relative genes upon RACK1 knockdown was significantly reversed (Figure 8F-G).
Elevated Nanog expression plays an essential role in RACK1-regulated HCC CSCs. (A-G) 96 h after HuH7 cells were infected with the indicated lentivirus, cells were subjected to the following assays: (A) Immunoblotting analysis of the expression of Nanog and RACK1 in total cells. (B) Flow cytometric analysis of CD13 expression in total cells. (C) Immunoblotting analysis of the expression of Nanog and RACK1 in sorted CD13+ cells. (D) Sphere formation assays of sorted CD13+ subpopulation. mean±s.d. (n=3); *P<0.05, **P<0.01 (E) In vivo tumorigenicity experiments of CD13+ subpopulation (5000 cells/site, 7 weeks, n=6). (F) Etoposide (Etop, 100 μM, 48 h)- or sorafenib (Sora, 50 μM, 24 h)-induced apoptosis of CD13+ subpopulation. mean±s.d. (n=3). (G) qRT-PCR analysis of sorted CD13+ subpopulation for the expression of the indicated drug-resistant relative genes. mean±s.d. (n=3). (H-K) 24 h after HuH7 cells were transfected with mammalian expression vector encoding GFP-tagged wild type RACK1 or RACK1 mutant lacking WD5, GFP+CD13+ subpopulations were sorted and subjected to immunoblotting (H), sphere formation assays, mean±s.d. (n=3) (I), etoposide (Etop, 100 μM, 48 h)- or sorafenib (Sora, 50 μM, 24 h)-induced apoptosis, mean±s.d. (n=3) (J), and qRT-PCR analysis for the expression of the indicated drug-resistant relative genes. mean±s.d. (n=3) (K).
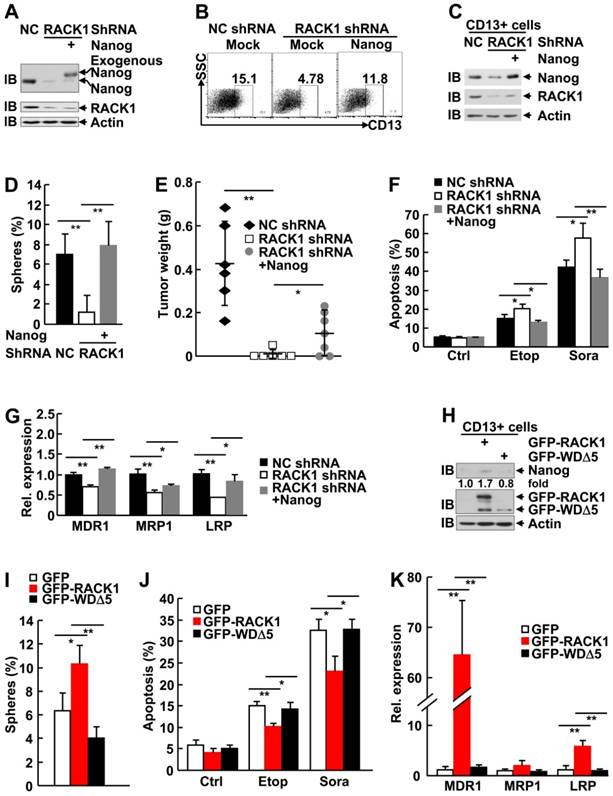
As we failed to generate HuH7 cells stably expressing the RACK1 mutant defective of anchoring Nanog (WDΔ5), we used the strategy of transient transfection with GFP-tagged mammalian expression vectors since the expression levels of wild type RACK1 and its mutant in total HuH7 cells were similar (Figure 6F). Unexpectedly, sorted GFP+CD13+ cells showed much lower level of GFP-WDΔ5 expression, as compared to the wild type protein (Figure 8H). While CD13+ subpopulation expressing GFP-RACK1 exhibited enhanced Nanog expression, enhanced sphere formation, enhanced chemoresistance to etoposide and sorafenib, and enhanced expression of drug-resistant relative genes MDR1 and LRP, no such phenomena occurred in CD13+ subpopulation expressing GFP-WDΔ5 (Figure 8H-K). In line with the data shown in Figure 6F, CD13+ subpopulation expressing this mutant even showed the tendency of reduced Nanog expression (Figure 8H) and sphere formation (Figure 8I). Taken together, these results suggest that RACK1 promotes self-renewal and chemoresistance of human liver CSCs through, at least partially, directly binding to Nanog and thereby maintaining its expression.
Discussion
A possible role of RACK1 in normal stem cells has been suggested in planarians [60]. In line with this, it has been reported that conventional knockout of RACK1 in the mouse is not feasible, due to the reduced ability of ES to go germline [61]. Here, we show that RACK1 directly binds to Nanog, which prevents its recruitment of E3 ubiquitin ligase FBXW8 and ubiquitin-dependent degradation, thereby promoting self-renewal and chemoresistance of human liver CSCs and maintaining murine ESC function. Besides HCC, elevated levels of RACK1 protein were observed in various types of cancers [54]; the regulation of Nanog expression by RACK1 might be a common molecular mechanism for various cancers to maintain stemness. Thus, RACK1 might be an attractive target for directed anti-CSCs therapeutics.
In line with previous studies, our work indicates that CD13 is a surface marker for human liver CSCs. Recently, it has been reported by independent groups that targeting CD13 inhibits human liver cancer growth by killing CSCs [62,63]. Our findings provide novel insight into this strategy. Interestingly, different exogenous proteins show different expression efficiency in CD13+ cells, depending on the function of the individual protein, which might facilitate maintaining the characteristics of CSCs. Similarly, RACK1 shRNA is relatively less efficient in this subpopulation. Indeed, RACK1 is enriched in CD13+ cells and is essential for the self-renewal and chemoresistance of human liver CSCs through stabilization of Nanog. How Nanog promotes CD13 expression remains unknown. Future studies are required to address this issue.
Our work has revealed a novel mechanism underlying Nanog over-expression in CSCs. RACK1 directly binds to Nanog, which might induce conformational changes and consequently prevent its recruitment of E3 ubiquitin ligase FBXW8. Furthermore, our preliminary data suggest that RACK1 also affects the nuclear translocation of Nanog. Nanog was predominantly nuclear in murine ESCs (Figure S12A). Lentivirus carrying RACK1 shRNA not only caused diminished endogenous Nanog but also led to predominantly cytoplasmic localization of remnant Nanog (Figure S12A). Furthermore, exogenous wild type Nanog was almost exclusively nuclear, whereas Nanog mutant lacking the RACK1-binding domain (i.e., the N-terminal domain) exhibited significant cytoplasmic accumulation (Figure S12B). These data suggest that RACK1 promotes the nuclear translocation of Nanog through directly binding to it. As for transactivation of Nanog, RACK1 knockdown significantly suppressed, whereas RACK1 overexpression significantly enhanced, the transactivation of Nanog in HuH7 cells (Figure S13). RACK1 mutant defective of anchoring Nanog lost the ability of wild type RACK1 to enhance the transcriptional activity of Nanog (Figure S13B). By contrast, it showed the tendency to suppress Nanog activity (Figure S13B), in line with its effect on Nanog expression (Figure 6F and Figure 8H). These data suggest that RACK1 promotes the transcriptional activity of Nanog through directly binding to it.
The levels of RACK1 protein are associated with the tumor size and the clinical stage, while those of Nanog are not. Moreover, the diminished self-renewal capability of CSCs upon RACK1 knockdown could not be fully reversed by ectopic Nanog expression (Figure 8D-E). Therefore, Nanog might collaborate with other RACK1-related signaling pathways to promote HCC tumorigenesis and recurrence. Our data suggest that MKK7, PKCβII, Hedgehog, and Akt might contribute to RACK1-mediated self-renewal. Nanog seems to play a predominant role in RACK1-mediated chemoresistance to etoposide and sorafenib and the expression of drug-resistant relative genes MDR1 and LRP because ectopic Nanog expression can fully reverse the corresponding defects upon RACK1 knockdown, at least in vitro. Selective PKCβII inhibitor CGP53353 failed to inhibit the expression of drug-resistant relative genes MDR1, MRP1, and LRP (Figure S6G), though RACK1/ PKCβII axis has been implicated in doxorubicin resistance of HCC [27]. PKCβII inhibitor attenuated, but not completely abolished, RACK1-mediated doxorubicin resistance of HCC [27], suggesting other mechanism(s) collaborate with PKCβII in RACK1-mediated chemotherapy resistance of HCC. Nanog should be such a factor. Another possibility is that different chemotherapy drugs use different mechanism(s) to trigger apoptosis. RACK1/PKCβII axis plays a key role in doxorubicin resistance, whereas RACK1/Nanog axis contributes more to chemoresistance to etoposide and sorafenib. These issues await future studies.
Abbreviations
AP: alkaline phosphatase; CD: C-terminal domain; CHX: cycloheximide; Co-IP: coimmunoprecipitation; CSCs: cancer stem cells; DMEM: Dulbecco's modified Eagle's medium; eIF4E: eukaryotic initiation factor 4E; ESCs: embryonic stem cells; FBS: fetal bovine serum; GST: glutathione S-transferase; HCC: hepatocellular carcinoma; HD: homeodomain; IB: immunoblotting; IgG: immunoglobulin G; JNK: c-Jun N-terminal protein kinase; LRP: lung resistance protein; MDR1: multidrug resistance protein 1; mIHC: fluorescent multiplex immunohistochemistry; MRP1: multidrug resistance-associated protein 1; ND: N-terminal domain; NOD/SCID mice: nonobese diabetic/severe combined immunodeficient mice; PKC: protein kinase C; qRT-PCR: quantitative real-time reverse-transcriptase polymerase chain reaction; RACK1: receptor for activated C kinase 1; shRNA: short hairpin RNA; siRNA: small-interfering RNA; UPS: ubiquitin-proteasome system; WD repeat: Trp-Asp repeat; WR subdomain: tryptophan-rich subdomain.
Supplementary Material
Supplementary figures and tables.
Acknowledgements
The authors thank Mrs. Xiaoling Lang and Qianqian Dai for technical assistance as well as Dr. Chunsheng Gao for assistance of statistics. This work was supported by grants from National Natural Science Foundation of China (81472736, 81625010), Beijing Natural Science Foundation (5174042), and National Key Research and Development Program of China (2016YFC1303402).
Competing Interests
The authors have declared that no competing interest exists.
References
1. Llovet JM, Burroughs A, Bruix J. Hepatocellular carcinoma. Lancet. 2003;362:1907-17
2. Shackleton M, Quintana E, Fearon ER, Morrison SJ. Heterogeneity in cancer: cancer stem cells versus clonal evolution. Cell. 2009;324:1670-3
3. Yamashita T, Wang XW. Cancer stem cells in the development of liver cancer. J Clin Invest. 2013;123:1911-8
4. Gong S, Li Q, Jeter CR, Fan Q, Tang DG, Liu B. Regulation of NANOG in cancer cells. Mol Carcinog. 2015;54:679-87
5. Iv Santaliz-Ruiz LE, Xie X, Old M, Teknos TN, Pan Q. Emerging role of nanog in tumorigenesis and cancer stem cells. Int J Cancer. 2014;135:2741-8
6. Jeter CR, Yang T, Wang J, Chao HP, Tang DG. Concise review: NANOG in cancer stem cells and tumor development: an update and outstanding questions. Stem Cells. 2015;33:2381-90
7. Haraguchi N, Ishii H, Mimori K, Tanaka F, Ohkuma M, Kim HM. et al. CD13 is a therapeutic target in human liver cancer stem cells. J Clin Invest. 2010;120:3326-39
8. Yang ZF, Ho DW, Ng MN, Lau CK, Yu WC, Ngai P. et al. Significance of CD90+ cancer stem cells in human liver cancer. Cancer Cell. 2008;13:153-66
9. Yamashita T, Ji J, Budhu A, Forgues M, Yang W, Wang HY. et al. EpCAM-positive hepatocellular carcinoma cells are tumor-initiating cells with stem/progenitor cell features. Gastroenterology. 2009;136:1012-24
10. Ma S, Tang KH, Chan YP, Lee TK, Kwan PS, Castilho A. et al. miR-130b Promotes CD133(+) liver tumor-initiating cell growth and self-renewal via tumor protein 53-induced nuclear protein 1. Cell Stem Cell. 2010;7:694-707
11. Kuczynski EA, Lee CR, Man S, Chen E, Kerbel RS. Effects of Sorafenib dose on acquired reversible resistance and toxicity in hepatocellular carcinoma. Cancer Res. 2015;75:2510-9
12. Shan J, Shen J, Liu L, Xia F, Xu C, Duan G. et al. Nanog regulates self-renewal of cancer stem cells through the insulin-like growth factor pathway in human hepatocellular carcinoma. Hepatology. 2012;56:1004-14
13. Mani SK, Zhang H, Diab A, Pascuzzi PE, Lefrançois L, Fares N. et al. EpCAM-regulated intramembrane proteolysis induces a cancer stem cell-like gene signature in hepatitis B virus-infected hepatocytes. J Hepatol. 2016;65:888-98
14. Zhang L, Ge C, Zhao F, Zhang Y, Wang X, Yao M. et al. NRBP2 overexpression increases the chemosensitivity of hepatocellular carcinoma cells via Akt signaling. Cancer Res. 2016;76:7059-71
15. Mao J, Yang H, Cui T, Pan P, Kabir N, Chen D. et al. Combined treatment with sorafenib and silibinin synergistically targets both HCC cells and cancer stem cells by enhanced inhibition of the phosphorylation of STAT3/ERK/AKT. Eur J Pharmacol. 2018;832:39-49
16. Chen CL, Uthaya Kumar DB, Punj V, Xu J, Sher L, Tahara SM. et al. NANOG metabolically reprograms tumor-initiating stem-like cells through tumorigenic changes in oxidative phosphorylation and fatty acid metabolism. Cell Metab. 2016;23:206-19
17. Ramakrishna S, Suresh B, Lim KH, Cha BH, Lee SH, Kim KS. et al. PEST motif sequence regulating human NANOG for proteasomal degradation. Stem Cells Dev. 2011;20:1511-9
18. Moretto-Zita M, Jin H, Shen Z, Zhao T, Briggs SP, Xu Y. Phosphorylation stabilizes Nanog by promoting its interaction with Pin1. Proc Natl Acad Sci USA. 2010;107:13312-7
19. Xie X, Piao L, Cavey GS, Old M, Teknos TN, Mapp AK. et al. Phosphorylation of Nanog is essential to regulate Bmi1 and promote tumorigenesis. Oncogene. 2014;33:2040-52
20. Kim SH, Kim MO, Cho YY, Yao K, Kim DJ, Jeong CH. et al. ERK1 phosphorylates Nanog to regulate protein stability and stem cell self-renewal. Stem Cell Res. 2014;13:1-11
21. Jin J, Liu J, Chen C, Liu Z, Jiang C, Chu H. et al. The deubiquitinase USP21 maintains the stemness of mouse embryonic stem cells via stabilization of Nanog. Nat Commun. 2016;7:13594
22. Liu X, Yao Y, Ding H, Han C, Chen Y, Zhang Y. et al. USP21 deubiquitylates Nanog to regulate protein stability and stem cell pluripotency. Signal Transduct Target Ther. 2016;1:16024
23. Kwon SK, Lee DH, Kim SY, Park JH, Choi J, Baek KH. Ubiquitin-specific protease 21 regulating the K48-linked polyubiquitination of NANOG. Biochem Biophys Res Commun. 2017;482:1443-8
24. Yoon SY, Kim JM, Oh JH, Jeon YJ, Lee DS, Kim JH. et al. Gene expression profiling of human HBV- and/or HCV-associated hepatocellular carcinoma cells using expressed sequence tags. Int J Oncol. 2006;29:315-27
25. Bourd-Boittin K, Le Pabic H, Bonnier D, L'Helgoualc'h A, Theret N. RACK1, a new ADAM12 interacting protein: contribution to liver fibrogenesis. J Biol Chem. 2008;283:2600-9
26. Guo Y, Wang W, Wang J, Feng J, Wang Q, Jin J. et al. Receptor for activated C kinase 1 promotes hepatocellular carcinoma growth by enhancing mitogen-activated protein kinase kinase 7 activity. Hepatology. 2013;57:140-51
27. Ruan Y, Sun L, Hao Y, Wang L, Xu J, Zhang W. et al. Ribosomal RACK1 promotes chemoresistance and growth in human hepatocellular carcinoma. J Clin Invest. 2012;122:2554-66
28. Li T, Fan J, Blanco-Sanchez B, Giagtzoglou N, Lin G, Yamamoto S. et al. Ubr3, a novel modulator of Hh signaling affects the degradation of Costal-2 and Kif7 through poly-ubiquitination. PLoS Genet. 2016;12:e1006054
29. Jin J, Liu J, Chen C, Liu Z, Jiang C, Chu H. et al. The deubiquitinase USP21 maintains the stemness of mouse embryonic stem cells via stabilization of Nanog. Nat Commun. 2016;7:13594
30. Yang X, Castilla LH, Xu X, Li C, Gotay J, Weinstein M. et al. Angiogenesis defects and messenchymal apoptosis in mice lacking SMAD5. Development. 1999;126:1571-80
31. Wang J, Tang R, Lv M, Zhang J, Shen B. Selective unresponsiveness to the inhibition of p38 MAPK activation by cAMP helps L929 fibroblastoma cells escape TNF-α-induced cell death. Mol Cancer. 2010;9:6
32. Cui J, Wang Q, Wang J, Lv M, Zhu N, Li Y. et al. Basal c-Jun NH2-terminal protein kinase activity is essential for survival and proliferation of T-cell acute lymphoblastic leukemia cells. Mol Cancer Ther. 2009;8:3214-22
33. Zhang J, Wang Q, Zhu N, Yu M, Shen B, Xiang J. et al. Cyclic AMP inhibits JNK activation by CREB-mediated induction of c-FLIPL and MKP-1, thereby antagonizing UV-induced apoptosis. Cell Death Differ. 2008;15:1654-62
34. Zheng H, Pomyen Y, Hernandez MO, Li C, Livak F, Tang W. et al. Single-cell analysis reveals cancer stem cell heterogeneity in hepatocellular carcinoma. Hepatology. 2018;68:127-40
35. Wang Y, He L, Du Y, Zhu P, Huang G, Luo J. et al. The long noncoding RNA lncTCF7 promotes self-renewal of human liver cancer stem cells through activation of Wnt signaling. Cell Stem Cell. 2015;16:413-25
36. Zhu P, Wang Y, Du Y, He L, Huang G, Zhang G. et al. C8orf4 negatively regulates self-renewal of liver cancer stem cells via suppression of NOTCH2 signalling. Nat Commun. 2015;6:7122
37. Tsai SC, Lin CC, Shih TC, Tseng RJ, Yu MC, Lin YJ. et al. The miR-200b-ZEB1 circuit regulates diverse stemness of human hepatocellular carcinoma. Mol Carcinog. 2017;56:2035-47
38. Zhu P, Wang Y, Huang G, Ye B, Liu B, Wu J. et al. lnc-β-Catm elicits EZH2-dependent β-catenin stabilization and sustains liver CSC self-renewal. Nat Struct Mol Biol. 2016;23:631-9
39. Zhu P, Wang Y, Wu J, Huang G, Liu B, Ye B. et al. LncBRM initiates YAP1 signalling activation to drive self-renewal of liver cancer stem cells. Nat Commun. 2016;7:13608
40. Liu C, Liu L, Shan J, Shen J, Xu Y, Zhang Q. et al. Histone deacetylase participates in self-renewal of liver cancer stem cells through histone modification. Cancer Lett. 2013;339:60-9
41. Song Y, Pan G, Chen L, Ma S, Zeng T, Man Chan TH. et al. Loss of ATOH8 increases stem cell features of hepatocellular carcinoma cells. Gastroenterology. 2015;149:1068-81
42. Sun JC, Pan K, Chen MS, Wang QJ, Wang H, Ma HQ. et al. Dendritic cells-mediated CTLs targeting hepatocellular carcinoma stem cells. Cancer Biol Ther. 2010;10:368-75
43. Deng YZ, Yao F, Li JJ, Mao ZF, Hu PT, Long LY. et al. RACK1suppresses gastric tumorigenesis by stabilizing the β-catenindestruction complex. Gastroenterology. 2012;142:812-23
44. Shi S, Deng YZ, Zhao JS, Ji XD, Shi J, Feng YX. et al. RACK1 promotes non-small-cell lung cancer tumorigenicity through activating sonic hedgehog signaling pathway. J Biol Chem. 2012;287:7845-58
45. Zhang X, Liu N, Ma D, Liu L, Jiang L, Zhou Y. et al. Receptor for activated C kinase 1 (RACK1) promotes the progression of OSCC via the AKT/mTOR pathway. Int J Oncol. 2016;49:539-48
46. Wang F, Yamauchi M, Muramatsu M, Osawa T, Tsuchida R, Shibuya M. RACK1 regulates VEGF/Flt1-mediated cell migration via activation of a PI3K/Akt pathway. J Biol Chem. 2011;286:9097-10106
47. Niwa H, Ogawa K, Shimosato D, Adachi K. A parallel circuit of LIF signaling pathways maintains pluripotency of mouse ES cells. Nature. 2009;460:118-22
48. Man JH, Liang B, Gu YX, Zhou T, Li AL, Li T. et al. Gankyrin plays an essential role in Ras-induced tumorigenesis through regulation of the RhoA/ROCK pathway in mammalian cells. J Clin Invest. 2010;120:2829-41
49. Marusawa H, Chiba T. A marker for dormant cancer stem cells in human hepatocellular carcinoma. Gastroenterology. 2011;140:1353-5
50. Schneider-Poetsch T, Ju J, Eyler DE, Dang Y, Bhat S, Merrick WC. et al. Inhibition of eukaryotic translation elongation by cycloheximide and lactimidomycin. Nat Chem Biol. 2010;6:209-17
51. Gagliardi A, Mullin NP, Ying Tan Z, Colby D, Kousa AI, Halbritter F. et al. A direct physical interaction between Nanog and Sox2 regulates embryonic stem cell self-renewal. EMBO J. 2013;32:2231-47
52. Costa Y, Ding J, Theunissen TW, Faiola F, Hore TA, Shliaha PV. et al. Nanog-dependent function of Tet1 and Tet2 in establishment of pluripotency. Nature. 2013;495:370-4
53. Thornton C, Tang KC, Phamluong K, Luong K, Vagts A, Nikanjam D. et al. Spatial and temporal regulation of RACK1 function and N-methyl-D-aspartate receptor activity through WD40 motif-mediated dimerization. J Biol Chem. 2004;279:31357-64
54. Li JJ, Xie D. RACK1, a versatile hub in cancer. Oncogene. 2015;34:1890-1898
55. Fomenkov A, Zangen R, Huang YP, Osada M, Guo Z, Fomenkov T. et al. RACK1 and stratifin target ΔNp63α for a proteasome degradation in head and neck squamous cell carcinoma cells upon DNA damage. Cell Cycle. 2004;3:1285-95
56. Liu YV, Baek JH, Zhang H, Diez R, Cole RN, Semenza GL. RACK1 competes with HSP90 for binding to HIF-1α and is required for O(2)-independent and HSP90 inhibitor-induced degradation of HIF-1α. Mol Cell. 2007;25:207-17
57. Ruan Y, Guo L, Qiao Y, Hong Y, Zhou L, Sun L. et al. RACK1 associates with CLEC-2 and promotes its ubiquitin-proteasome degradation. Biochem Biophys Res Commun. 2009;390:217-22
58. Marubashi S, Ohbayashi N, Fukuda M. A Varp-binding protein, RACK1, regulates dendrite outgrowth through stabilization of Varp protein in mouse melanocytes. J Invest Dermatol. 2016;136:1672-80
59. Zhang J, Zhu F, Li X, Dong Z, Xu Y, Peng C. et al. Rack1 protects N-terminal phosphorylated c-Jun from Fbw7-mediated degradation. Oncogene. 2012;31:1835-44
60. Labbe RM, Irimia M, Currie KW, Lin A, Zhu SJ, Brown DD. et al. A comparative transcriptomic analysis reveals conserved features of stem cell pluripotency in planarians and mammals. Stem Cells. 2012;30:1734-45
61. Volta V, Beuqnet A, Gallo S, Magri L, Brina D, Pesce E. et al. RACK1 depletion in a mouse model causes lethality, pigmentation deficits and reduction in protein synthesis efficiency. Cell Mol Life Sci. 2013;70:1439-50
62. Toshiyama R, Konno M, Eguchi H, Takemoto H, Noda T, Asai A. et al. Poly(ethylene glycol)-poly(lysine) block copolymer-ubenimex conjugate targets aminopeptidase N and exerts an antitumor effect in hepatocellular carcinoma stem cells. Oncogene. 2019;38:244-60
63. Zheng YB, Gong JH, Liu XJ, Li Y, Zhen YS. A CD13-targeting peptide integrated protein inhibits human liver cancer growth by killing cancer stem cells and suppressing angiogenesis. Mol Carcinog. 2017;56:1395-1404
Author contact
![]() Corresponding author: Jiyan Zhang, Institute of Basic Medical Sciences, 27 Taiping Road, Beijing 100850, P. R. China. Tel: +86 10 68159436; fax: +86 10 68159436; e-mail: zhangjybmi.ac.cn
Corresponding author: Jiyan Zhang, Institute of Basic Medical Sciences, 27 Taiping Road, Beijing 100850, P. R. China. Tel: +86 10 68159436; fax: +86 10 68159436; e-mail: zhangjybmi.ac.cn