Impact Factor
- Issue 14; 2026
- Issue 13; 2026
- Issue 12; 2026
- Issue 11; 2026
- Issue 10; 2026
- Volume 16; 2026
- Advance Articles
- Past Issues
- Cover Images
- Cover Suggestion
- Index & Coverage
- Special Issues
Introduction
Methods
Results
Discussion
Abbreviations
Supplementary Material
Acknowledgements
References
International Journal of Biological Sciences
International Journal of Medical Sciences
 Global reach, higher impact

Theranostics 2019; 9(5):1232-1246. doi:10.7150/thno.25735 This issue Cite
Research Paper
Quantification of human neuromuscular function through optogenetics
Olaia F. Vila1, Sebastien G.M. Uzel2,3, Stephen P. Ma1, Damian Williams4, Joseph Pak1, Roger D. Kamm2, Gordana Vunjak-Novakovic1 ![]()
1. Department of Biomedical Engineering, Columbia University, New York, NY 10032, USA
2. Department of Mechanical Engineering and Biological Engineering, Massachusetts Institute of Technology, Cambridge MA, USA
3. School of Engineering and Applied Sciences, Wyss Institute for Biologically Inspired Engineering, Harvard University, Cambridge, MA 02138
4. Columbia University Stem Cell Core Facility, Department of Rehabilitation and Regenerative Medicine, Columbia University, New York, NY 10032, USA
Received 2018-2-26; Accepted 2018-12-23; Published 2019-1-31
Abstract

The study of human neuromuscular diseases has traditionally been performed in animal models, due to the difficulty of performing studies in human subjects. Despite the unquestioned value of animal models, inter-species differences hamper the translation of these findings to clinical trials. Tissue-engineered models of the neuromuscular junction (NMJ) allow for the recapitulation of the human physiology in tightly controlled in vitro settings.
Methods: Here we report the first human patient-specific tissue-engineered model of the neuromuscular junction (NMJ) that combines stem cell technology with tissue engineering, optogenetics, microfabrication and image processing. The combination of custom-made hardware and software allows for repeated, quantitative measurements of NMJ function in a user-independent manner.
Results: We demonstrate the utility of this model for basic and translational research by characterizing in real time the functional changes during physiological and pathological processes.
Principal Conclusions: This system holds great potential for the study of neuromuscular diseases and drug screening, allowing for the extraction of quantitative functional data from a human, patient-specific system.
Keywords: Tissue Engineering, Induced Pluripotent Stem Cells, Neuromuscular Junctions, Myasthenia Gravis
Introduction
Neuromuscular junctions (NMJs) are the synapses between skeletal fibers and motoneurons, and are disrupted at early stages of various neuromuscular diseases [1, 2] in animal models [3-6]. Our inability to characterize the NMJ before the first symptoms of disease has prevented the observation of these pathophysiologic processes in human patients. Human in vitro models of the NMJ enable controllable studies of NMJ function during physiologic development and pathophysiologic disease, providing the basis for both basic science insights as well as translational studies.
While previous studies have reported in vitro NMJ formation by human motoneurons and muscle fibers [7, 8], neuromuscular function was difficult to quantify, because (i) NMJs were randomly formed between cells from different sources, and (ii) NMJ function was evaluated manually, which is time-consuming and subjective. Therefore, these models have limited utility for systematic studies of neuromuscular physiology and pathology due to biological inconsistencies and inter-observer variation.
In contrast to two-dimensional co-cultures, microfluidic technologies enable the creation of compartmentalized, three-dimensional tissues that better reproduce human physiology, with a space between the neurosphere and the skeletal tissue that enables the visualization of axonal sprouting and recession under biomimetic conditions [9]. Furthermore, individual three-dimensional tissues are easily traceable and measurable, allowing for systematic analysis of functional changes in individual motor units.
The incorporation of optogenetic proteins to generate photosensitive motoneurons is an elegant solution that allows for the specific activation of motoneurons without directly stimulating the skeletal muscle tissue, in contrast with electrical stimulation. Optogenetics has previously been used to generate photosensitive muscle tissues [10], as well as photoactivable NMJs in a murine tridimensional system [9], and in cocultures of human embryonic stem cell derived motoneurons and human myoblasts [8].
Human induced pluripotent stem cells (hiPSCs) [11] can be induced to differentiate towards a variety of cell lineages belonging to the neuromuscular system, including motor neurons [12]. Furthermore, advances in reprogramming techniques now allow for the generation of hiPSCs from multiple sources, including blood [13] and skeletal muscle [14]. Therefore, it is now possible to generate complex tissues involving more than one cell type derived from a single human donor, not only guarantying a perfect match among all the cells types involved, but also allowing for the recapitulation of specific genetic backgrounds.
Here we present a novel platform that overcomes the current limitations in evaluating neuromuscular function in in vitro human systems by combining cell and tissue engineering with optogenetics, microfabrication, optoelectronics and video processing. It is based on an improved version of the platform reported by Uzel et al [9], which allows for the spatially controlled formation of NMJs, and which incorporates a novel optical platform for the controlled stimulation of the NMJ activity. The integration with custom-made video processing software allows for precise measurements of muscle response. Furthermore, by deriving motoneurons and skeletal myotubes from the same donor, we generated a fully human and patient-specific model that will allow for the study of human neuromuscular physiology and pathology in an in vitro setting, filling the gap between animal studies and clinical trials. Donor-specific NMJ models hold great potential for the study of genetic diseases and can be generated even when the specific pathologic mutation is not known.
The result of this integration is the first quantifiable high-throughput system for the automated evaluation of patient-specific human NMJ function. By reducing the requirement for manual analysis, our system enables the analysis of large sample sizes, and eliminates variability and bias in the evaluation.
Here, we show our ability to establish light responsive NMJs between photosensitive motoneurons expressing the optogenetic protein channelrhodopsin-2 (ChR2) [15, 16] and non-optogenetic skeletal muscle tissue were derived from a single donor. We then demonstrate how our custom designed hardware and software can be used for concurrent stimulation of the NMJ and measurement of its functional response. Using this system, we are able to detect neurotoxin-induced disruption of NMJ function, as well as graded functional improvement of neuromuscular connectivity over time. Finally, we show the capacity of the system to detect the presence of myasthenia gravis autoantibodies by incorporation of patient serum, showing differential responses to sera from different donors.
Methods
Cell culture and differentiation
Primary skeletal muscle cells and myotube differentiation. Human skeletal muscle cells from healthy donors were obtained from Cook Myosite and expanded in Myotonic Growth Medium (Cook Myosite #MK-4444) for a maximum of 6 passages. Myoblast fusion was induced by culturing confluent myoblasts in a series of defined media [17]. Briefly, cells were cultured in high-glucose DMEM (ThermoFisher Scientific #11995065) supplemented with 500 μg/ml of bovine serum albumin (Sigma Aldrich # A9576), 10 ng/mL insulin (ThermoFisher Scientific # 12585014, 10 ng/ml Epidermal Growth Factor (ThermoFisher Scientific #PHG0311), and 50 μg/ml Gentamicin (ThermoFisher Scientific # 15750-060). On day 7 after differentiation, the media was changed to differentiation medium 2, consisting of Neurobasal-A (ThermoFisher Scientific #A13710-01) supplemented with Glutamax (ThermoFisher Scientific #35050-061), G-5 (ThermoFisher Scientific #17503-012), B27 (ThermoFisher Scientific #17504-044), 10 ng/ ml glial cell line-derived neurotrophic factor (GDNF, R&D Systems #212-GD-010/CF), 20 ng/ml brain-derived neurotrophic factor (BDNF, R&D Systems #248-BD-025/CF), 50 ng/ml recombinant human sonic hedgehog (Shh, R&D Systems #1845-SH-100), 0.1 μM retinoic acid (Sigma Aldrich #R2625-50), 10 ng/ml insulin growth factor 1(IGF-1, ThermoFisher Scientific #PHG0078), 1 μM cyclic adenosine monophosphate (cAMP, Sigma Aldrich #A9752), 5ng/mL human ciliary neurotrophic factor (CNTF, Miltenyl Biotec #130-096-336), 20 ng/ ml neurothropin-3 (Cell Sciences #CRN500B ), 20 ng/ ml neurothropin-4 (Cell Sciences #CRN501B ), 100 ng/ml vitronectin (Sigma Aldrich # V8379), 4 μg/ml mouse laminin , and 100 ng/ml agrin (R&D Systems # 550-AG-100). Two days later, media was changed to differentiation media 2 without G5. At day 11 after differentiation, media was changed to NbActive4 (BrainBits LLC #Nb4-500) supplemented with 50 U/ml penicillin/streptomycin (ThermoFisher Scientific # 15070063). Media was replaced every 2 days.
Stem cell culture. Stem cells were maintained in mTeSRTM1 (Stemcell Technologies #85850) + 1% v/v penicillin/streptomycin (ThermoFisher Scientific #12430-047). Media was changed daily for three to four days between passages. For passaging, standard 6-well tissue culture plates were pre-coated for stem cell culture with 1mL/well of Matrigel (ThermoFisher Scientific #CB-40230) diluted in DMEM/F12 (ThermoFisher Scientific #11320-033) at a ratio of 1:80. Plates were stored at 4°C for up to two weeks before culture. Prior to passaging, plates were incubated at room temperature for one to four hours. Stem cells were dissociated by incubation with ReLeSR (Stem Cell Technologies #5872) for five minutes followed by rigorous mechanical shearing with a P1000 pipette. Stem cells were seeded at a ratio of 1:12 in mTeSRTM1 + 2µM Y-27632 dihydrochloride (Tocris #1254) in 2mL total volume per well.
Generation of muscle derived-hiPSCs lines. Primary skeletal muscle cells were reprogrammed using CytoTune-iPS 2.0 Sendai Reprogramming Kit (ThermoFisher Scientific #A16517) that contains Sendai viruses for KOS, hc-Myc and hKlf4. Briefly, 1x10⁵ P1 skeletal muscle cells were plated in one well of a 6-well plate one day before infection. Cells were infected the next day at MOI 10:10:6 of for KOS:hc-Myc:hKlf4 viruses and incubated for 24h. After 5 days, cells were trypsinized and plated on top of irradiated mouse embryonic fibroblasts (Globalstem). HiPSCs colonies started forming 2 weeks after transduction. Colonies were then picked and expanded in mouse embryonic fibroblast feeders for 5 additional passages, before switching to matrigel-coated plates.
Karyotyping. At passage 3, muscle-derived hiPSCs were tested for normal karyotype (Cell Line Genetics). Twenty clones from two different lines (forty in total) were tested showing normal phenotype.
LV production and infection. A transgenic cell line was created by infection of the muscle-derived hiPSCs with the pLenti-EF1a-hChR2(H134R)-EYFP-WPRE construct (Addgene #20942). Plasmids were grown in One ShotTM Stbl3TM chemically competent E. coli (ThermoFisher Scientific #C737303) cultured in LB broth (ThermoFisher Scientific #10855), and isolated using E.Z.N.A.® Endo-Free Plasmid Maxi Kit (Omega Biotek #D6926-03). Human embryonic kidney cells HEK-293FT (ThermoFisher Scientific # R700-07) grown in DMEM (ThermoFisher Scientific #) supplemented with 2% v/v of fetal bovine serum (FBS) (Atlanta Biological #S11150) and 50 U/ml penicillin/streptomycin were transfected with 32.73 µg of the ChR2-YFP plasmid, 10.91 µg of viral envelope plasmid (pMD2.G Addgene #12259) and 21.82 µg of packaging construct (pCMV ΔR8.2, Addgene #12263) using polyethyleneimine (Polysciences # 23966). After 60 hours, supernatant was filtered through a 0.45 mm low protein-binding Steriflip-HV, (Millipore #SE1M003M00) and the viral particles were precipitated using the Lenti-X Concentrator (Takara #631231). Viruses were added to the hiPSCs one day after passaging. YFP+ cells were selected by fluorescence-activated cell sorting (BD InfluxTM) and expanded.
Motoneuron differentiation. Motoneurons were derived form ChR2-expressing transgenic hiPSC lines using a protocol adapted form Maury et al [12]. Briefly, on day 0, 4 million hiPSCs were transferred to petri dishes for suspension culture in 10 ml of N2/B27 medium composed of Neurobasal (ThermoFisher Scientific #21103-049) and Advanced DMEM/F12 (ThermoFisher Scientific #12634-020) in a ratio 1:1 and supplemented with B27, N2 (ThermoFisher Scientific #17502-048), Glutamax (ThermoFisher Scientific #35050061), 0.5 μM ascorbic acid (Sigma Aldrich # 49752) , 0.1mM 2-Mercaptoethanol (ThermoFisher Scientific #21985023), and 50 U/ml penicillin/streptomycin. On day 0 N2/B27 was supplemented with 3 μM CHIR99021 (Tocris # 4423/10), 0.2 μM LDN193189 (Miltenyl Biotec #130-103-925), 40 μM SB431542 hydrate (Sigma Aldrich #S4317) and 5μM Y-27632 dihydrochloride. On day 2, neurospheres were isolated using 37 μm reversible strainers (STEMCELL Technologies #27215) and replated in N2/B27 supplemented with 3 μM CHIR99021, 0.2 μM LDN193189, 40 μM SB431542 hydrate, and 0.1 μM retinoic acid. Thereafter, media was replaced for N2/B27 supplemented with 0.5 μM smoothened agonist (SAG, Millipore #566660), 0.2 μM LDN193189, 40 μM SB431542, and 0.1 μM retinoic acid at day 4; 0.5 μM SAG and 0.1 μM retinoic acid at day 7; 10 μM DAPT (R&D Systems # 2634/10) at day 9; and 20 ng/ml BDNF and 10 ng/ml GDNF at day 11.
Neurosphere dissociation. Motoneurons were dissociated for electrophysiological measurements and immunostaining. Briefly, 15 mm rounded glass coverslips were sterilized with 70% ethanol, placed in a 24 multiwell plate and treated with 20 μg/ml of poly-L-ornithine (Sigma Aldrich #P4957-50) for 24h followed by a second 24h treatment with 3 μg/ml laminin in phosphate buffered saline (PBS). Neurospheres were washed with PBS and incubated with Neurosphere Dissociation Media (iXCells Biotechnologies # MD-0021) for 10-20 min at 36C with occasional agitation. Motoneurons were then filtered using a 40 μm cell-strainer to eliminate cell clumps, spun down and resuspended in Neurobasal supplemented with Glutamax, non-essential amino acid solution (ThermoFisher Scientific #11140-050), N2, B27, 10 ng/ml GDNF, 10 ng/ml BDNF, 10 ng/ml IGF-1, 10 ng/ml CNTF, 10 μM ascorbic acid, 25 μM L-Glutamic (Sigma Aldrich # G5889), 25 μM 2-mercaptoethanol, 1 μM retinoic acid, and 1 μM uridine/fluorodeoxyuridine (Sigma Aldrich # U3750 and # F0503).
Electrophysiology. Experiments were carried out on a Nikon Eclipse TE 3500 inverted microscope equipped with a 40× 1.30 NA objective. Neurons were identified using DIC. Conventional voltage and current clamp recordings were performed using a Multiclamp 700B amplifier and a Digidata 1550 digital-to-analog converter (Molecular Devices). The external recording solution contained 145 mM NaCl, 5 mM KCl, 10 mM HEPES, 10 mM glucose, 2 mM CaCl2 and 2 mM MgCl2. The pipette solution contained 130 mM CH3KO3S, 10 mM CH3NaO3S, 1 mM CaCl2, 10 mM EGTA, 10 mM HEPES, 5 mM MgATP and 0.5 mM Na2GTP (pH 7.3, 305 mOsm). Experiments were performed at room temperature (21-23 °C). During current clamp recordings, current was injected to hold the cells at around -60 mV. For current-evoked depolarization, a series of 1 s current steps increasing in amplitude were applied. For calculation of the charge transfer (Q) following activation of ChR2, cells were voltage clamped at -60 mV. Recordings were carried out using the same solutions as those for the current clamp recordings with the addition of 300 nM tetrodotoxin. The area under the current trace during light exposure was normalized to cell capacitance. ChR2 activation was achieved using a Lambda LS light source (Sutter) and fluorescence filter cube containing a 482/35 nm excitation filter (Semrock) mounted to the microscope. Light was delivered through the microscope objective lens. Light intensity was controlled by 1, 5,10 and 25% transmission neutral density filters (Chroma) mounted in a Lambda LS-2 filter wheel (Sutter). Light intensities were measured using a PM100D Photometer (Thorlabs). Quantification was carried out with Igor Pro v. 6.3 (Wavemetrics) and R using custom-written scripts.
Microfluidic devices
Fabrication. The microfluidic device fabrication was adapted from previously reported methods [9, 18]. Device designs were created with AutoCAD (Autodesk) and the patterns were printed to a Mylar transparency mask (FineLine Imaging). Negative molds were fabricated on silicon wafers by multilayer photolithography using SU-8 photoresists (MicroChem). The molds were then surface-treated overnight with (tridecafluoro-1,1,2,2-tetrahydrooctyl)-1-trichlorosilane (United Chemical Technologies). A 10:1 base/curing agent mixture of polydimethylsiloxane (PDMS) (Ellsworth Adhesives) was casted into the mold, degassed, and cured at 80°C for 4 hours, after which the devices were peeled off the molds and cut. At that stage, the pillars serving as muscle attachment did not feature a cap to prevent the slipping of the muscle bundle. To do so, thin squares of PDMS (of dimensions 150×150×25 μm), cut from a membrane obtained by spin coating the elastomer on a Petri dish lid for 30 s at 5000 rpm, were manually glued to the top of each pillar with uncured PDMS and placed in an oven at 80°C to polymerize the glue. In order to increase manufacturing throughput, those modified devices served as templates for negative molds. Those molds were fabricated by pouring a polyurethane 2-part polymer (Smooth-Cast 310, Smooth-on) onto the PDMS devices, degassing the mixture to eliminate bubbles, and letting it polymerize at room temperature for 24h. Once the PDMS templates were extracted, the polyurethane molds were used similarly to the SU-8 molds. Once peeled off their polyurethane molds, the PDMS devices were trimmed to the appropriate size, and gel filling ports and medium ports/reservoirs were formed with 1- and 6-mm-diameter biopsy punches, respectively. To ensure proper contact between the cell-laden hydrogel and the medium dispensed in the cylindrical reservoirs, devices were manually inspected and modified under a stereomicroscope. The devices were then cleaned in an ultrasonic bath (Branson 1800) using 1-hour cycles of soap, isopropanol and distilled water. They were then dried in the oven at 65ºC overnight. The following day the devices were plasma treated (Harrik PDC-32G) and bonded to a glass cover slip. Devices were then autoclaved in water and allow to further dry in the oven at 80°C for several hours.
Pillar stiffness calculation. The geometry of an uncapped pillar was created in Comsol (COMSOL Inc., Burlington, MA). The material was assigned a Young's modulus of 530 kPa, corresponding to 10:1 base: curing agent ratio of Sylgard 184 [19]. The bottom surface of the pillar was fixed while incremental levels of shear stress were applied to its top surface in the direction of muscle tension, yielding in a maximum pillar deflection of approximately 50 µm. The slope of the linear regression performed on the force-displacement curve resulted in a pillar stiffness of 0.347 µN·µm-1.
Pluronic Treatment. The day before seeding, muscle chambers of the microdevices were treated with 1% Pluronic® F-127 (Sigma Aldrich #P2443) for 15 minutes at room temperature to prevent cell adhesion. The chambers were then washed with 300 μL of UltraPure Water (ThermoFisher Scientific # 10977023) and dried in the oven over night.
Tissue seeding and culture. Human skeletal myoblasts were seeded at a concentration of 20 million cells/mL in a 4:1 mix of 3 mg/mL collagen I (Corning #354249) and Matrigel. Briefly, collagen was diluted in PBS with Phenol Red (Sigma Aldrich #P0290) to achieve the desired concentration, and a 10% solution of NaOH was used to neutralize the gel before adding the Matrigel and resuspend the myoblasts. Then, a 2 μl micropipette was used to fill the muscle channel and chamber with the cell-collagen mixture. After 20 min of polymerization at 37C, the media reservoirs were filled with Myotonic Growth Media. Myotube differentiation was initiated the day after seeding. Two weeks after myoblast seeding, the muscle and neurosphere chambers and connecting channel were filled with a 4:1 mixture of collagen I 2 mg/mL and Matrigel. HiPSCs-derived neurospheres in the 200-300 μm range were selected using pluriStrainers (PluriSelect #43-50200-03 and #43-50300-03) and seeded in the motoneuron chamber the same hydrogel. Devices were kept in coculture medium, consisting of NbActiv4 supplemented with 10ng/ml GDNF, 20 ng/ml BDNF, and 50 μM ascorbic acid, from this point, and medium was changed every 2 days.
Optical Stimulation. Measurement of NMJ function was performed using a custom-made optical stimulation platform that uses a 573nm dichroic mirror (Semrock FF573-Di01-25x36) to couple red (627nm light emitting diode (LED) (Luxeon Star SP-05-R5) and 594nm long-pass excitation filter (Semrock BLP01-594R-25)) and blue (470nm LED (Luxeon Star SP-05-B4) 546nm short-pass excitation filter (Semrock FF01-546/SP-25)) light sources together. A 594nm long-pass emission filter distal to the sample (Semrock BLP01-594R-25) was used to filter out blue light for imaging. The LEDs were controlled with an Arduino Uno. For imaging, samples were placed on the stage of an Olympus FSX100 using the red LED from the optical platform as the source of brightfield illumination. The intensity of the 488 nm light used to stimulate the light in this system was 326±8 μW/mm2. The optical stimulation platform was placed on top of the tissue culture plate containing the microfluidic device and aligned so the blue LED was centered on the neurosphere chamber. Movies were acquired using an Andor Zyla 4.2 sCMOS camera through a 10x objective. A ramped stimulation protocol with increasing frequencies (0.2 to 2 Hz in 30 steps) was used to challenge the tissues in terms of number of repetitions and velocity of response in one measurement. Medium was replaced with fresh coculture medium right after optical stimulation.
Electrical Stimulation. Electrical stimulation was performed by placing platinum electrodes (Ladd Research Industries) in both medium reservoirs, connected to an electrical stimulator (Grass s88x). Electrical stimulation was generated by a spatially uniform, pulsatile electrical field (5V intensity, 10 ms in duration, monophasic square waveform) perpendicular to the long axis of the tissue. The parameters were chosen to result in maximum force while avoiding unnecessary electrical tissue damage.
Force calculation. Quantification of the pillar deflection was carried out using the tracking software Tracker (http://physlets.org/tracker). Forces were calculated by multiplying this value by the pillar stiffness.
Contractility analysis. Brightfield movies were processed to extract motion by subtracting every frame from a baseline frame to get a matrix of differences. The amount of motion at any time point was calculated as the average absolute value of the difference matrix across the frame. This value was calculated for all time points to create the trace of contractile activity. This trace was aligned against the stimulation trace by syncing the moment when the red LED was turned on to illuminate the field. Each stimulation pulse was determined as effective if a contraction occurred within 0.1 seconds. The fraction of effective pulses (F) was calculated as the ratio of effective pulses to total light pulses. To account for the possibility that random unstimulated contractions could be correlated with the stimulation pulses by happenstance, an expected fraction of effective pulses (E) was calculated as the expected fraction of pulses to be labeled as effective if the contractions were randomly distributed throughout the time course (total number of contractions x 0.1/total time). The fraction of effective pulses was then corrected and normalized to 1 as (F-E)/(1-E). Code is available upon email request to G.V.N.
Bungarotoxin assay. To prove that contraction of the muscle happens thought the light-activation of NMJ, highly responsive tissues were imaged before and after a 20 min treatment with 5μg/ml of α-bungarotoxin (BTX) (ThermoFisher Scientific, #B35450).
Myasthenia gravis serum treatment. Sera from five myasthenia gravis patients and healthy donors were obtained from Cook Myosite and kept at -80C. Functional tissues at day 15 after motoneuron seeding were incubated in coculture medium supplemented with 20% serum from either myasthenia gravis patients or healthy donors. NMJ function was measured after 48h (day 17), and devices were then washed, filled with fresh medium, and imaged again after 48h (day 19) to measure recovery.
Immunohistochemistry. Briefly, cells or tissues were fixed in 4% paraformaldehyde (Santa Cruz #sc-281692) for 20 min at RT, permeabilized with 0.1% Triton X-100 (Sigma Aldrich # T8787) for 15 min at RT, blocked with 10% goat serum (ThermoFisher Scientific #16210072) for 1 hour at RT, incubated with primary antibodies (Table S1) diluted in blocking solution overnight at 4C, incubated with secondary antibodies (Table S2) for 2 hours at RT and finally, stained with DAPI (#) for 10 min at RT. Cells were rinsed in PBS three times between each step.
Flow cytometry. For flow cytometry analysis, hiPSCs were dissociated and incubated with a conjugated antibody for 1 hour at 37C, 5% CO2. Flow cytometry data was collected on a Bio-Rad S3eTM Cell Sorter. A list of conjugated antibodies can be found in Table S3.
Statistical analysis. One-way ANOVA analysis was performed to compute F-values for each experiment using MATLAB. Post-hoc Tukey test was used for pairwise comparisons between different groups. A statistical significance threshold of 0.05 was used to determine significance. Values are expressed as mean ± SEM.
Results
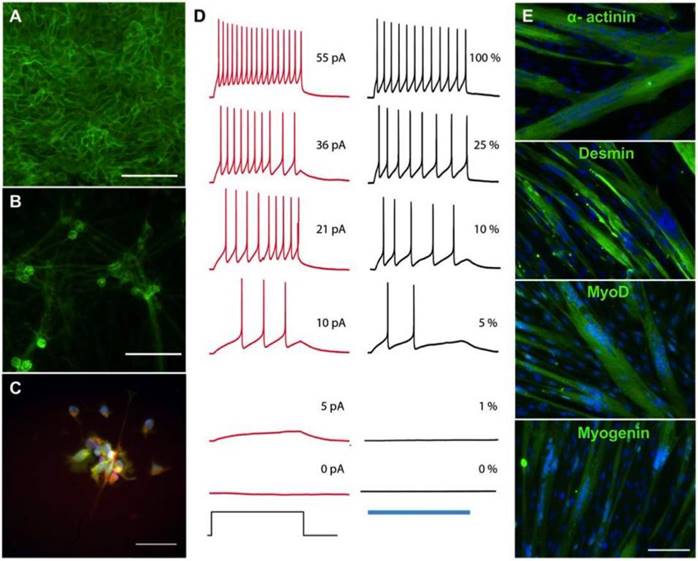
Derivation of skeletal myotubes and optogenetic motoneurons from a single donor. Human primary skeletal myoblasts were reprogrammed into hiPSCs using Sendai viruses containing the pluripotency genes KOS, hc-Myc and hKlf4. Three weeks after the infection, muscle-derived hiPSC colonies expressed the endogenous pluripotency genes NANOG, SSEA4 and TRA-3-60 as shown by flow cytometry (Figure S1). Maintenance of normal karyotype and pluripotency markers NANOG, SOX2 and OCT3/4 was demonstrated after 10 additional passages (Figure S2-3). Following expansion, the muscle-derived hiPSCs were transduced with lentiviruses carrying the fusion protein hChR2(H134R)-EYFP [16]. After infection and selection, ChR2-expressing hiPSCs showed transmembrane localization of the construct (Figure 1A) and maintenance of pluripotency markers NANOG, SOX2 and OCT3/4 (Figure S4). The same cells were used to derive motoneurons [12] that maintained transmembrane localization of the ChR2-eYFP complex (Figure 1B) while also expressing the motoneuron marker HB9 (Figure 2C). Electrophysiological studies of light-evoked action potentials demonstrated the function of ChR2 in a light intensity-dependent manner (Figure 2D, Figures S5-7). To maintain the same genetic background for both component cells of the NMJ, the myotubes were derived from the original human myoblasts in defined media [17]. Immunostaining of the multinucleated myotubes showed expression of the muscle markers α-actinin, MyoD, Desmin and Myogenin (Figure 2E).
Derivation of skeletal myotubes and optogenetic motoneurons from a single donor. (A-B) Membrane expression of the channelrhodopsin 2- yellow fluorescent protein (ChR2-YFP) complex in (A) human induced pluripotent stem cells (hiPSCs) and (B) hiPSC-derived motoneurons. (C) Expression of the motoneuronal marker HB9 (red = HB9: green = ChR2-YFP; blue = DAPI). (D) Representative membrane potential traces from a ChR2-YFP-expressing hiPSC-derived motoneuron in which action potentials are evoked by light or current injection. The column of black traces (right) shows light-evoked action potentials elicited by a 1 s exposure to light of increasing intensities. The relative intensity of light is shown on the right of the trace, and it correspond to light power values of 4519, 1281, 475, 219, 81 and 0 μW/mm2. The blue bar at the base of the column represents the period of light exposure. The column of traces in red (left) are recordings from the same cell with action potentials evoked by a 1 s current injection. The amplitude of current injection is shown on the right of the trace and was chosen to match the action potential firing pattern evoked by light. The current injection step period is shown at the base of the column. (E) Immunostainings showing the formation of multinucleated myotubes expressing the skeletal muscle markers α-actinin, desmin, myoD and myogenin after 2 weeks of differentiation (green = muscle marker, blue = DAPI). Scale bars: 100 μm.
Microfluidic platform for the formation of neuromuscular junctions (NMJs). (A-B) Design of the microfluidic platform and the muscle and neuronal chambers. Scale bar: 1 μm. (C) Fluorescent image showing neurite extension from the optogenetic motoneuron neurosphere to the skeletal microtissue. Scale bar: 500 μm. (D) Evolution of axonal growth from the neurosphere to the muscle tissue during the first week in co-culture (days 1, 2, 3, 5 and 7). (E-F) Confocal images showing innervation of the skeletal micro tissues and muscle striation after 10 (E) and 20 days in co-culture (F) (green = ChR2-YFP, red = α-actinin, blue = DAPI). Scale bars: 100 μm.
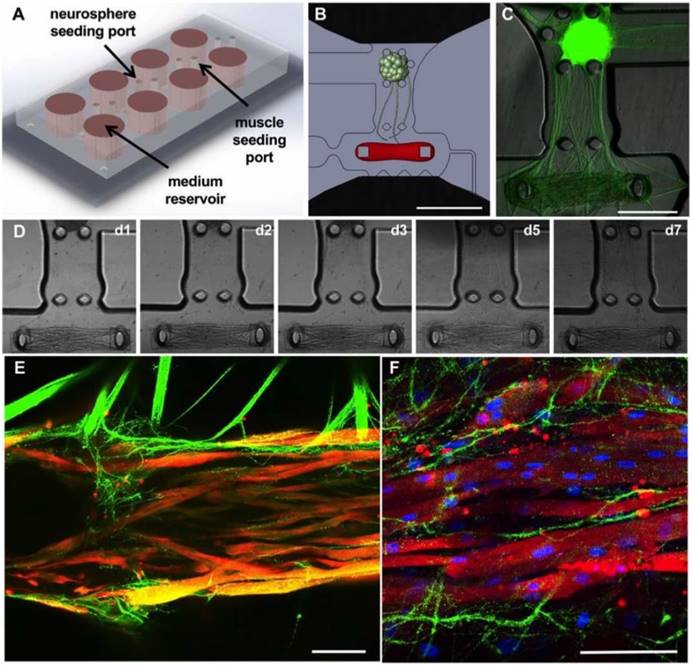
Microfluidic platform for the formation of NMJs. A microfluidic platform for the compartmentalized tridimensional culture of motoneurons and skeletal muscle microtissues was designed to recapitulate physiologic NMJ formation (Figure 2A). The design of the microfluidic platform is an updated version of a compartmentalized NMJ culture system previously published [9]. It consists of two tissue-specific culture chambers separated by a 1-mm gap for axonal sprouting and growth (Figure 2B). The 1.5mm × 0.6m muscle compartment features a set of 2 capped pillars for muscle bundle attachment, 1mm apart, and is lined by an array of posts to ensure confinement of the gel solution upon seeding. The chamber is accessible on one end by a gel filling channel which features a necking region at the entrance to the chamber, which is designed to locally weaken the muscle bundle to separate the muscle in the chamber from the filling channel, resulting in muscle tissue anchored solely to the pillars and capable of freely contracting. On the other end of the muscle chamber, an L-shaped microchannel prevents the trapping of air bubbles as the gel solution is being dispensed. The neuron chamber, also accessible via a gel-filling channel, is delimited by 5 posts forming a 0.5 mm-diameter cup. This design allows for the simple and repeatable seeding of an individual neurosphere aligned with the center of the muscle bundle (Figure 2B-C). The gap region between the cell chambers ensures a clear physical separation between the two tissue types, which allows for axonal outgrowth and visualization. The tissue chambers are flanked by two large open reservoirs with a diameter of 6 mm, positioned to facilitate gel and medium dispensing with a multichannel pipette.
Determining the right ratio between cell and collagen concentrations was critical for the formation of muscle microtissues. The optimal results were achieved using 20 million cells/ml in 3 mg/ml of collagen and 20% matrigel. Stiffer gels (4 mg/ml) prevented myoblast fusion whereas softer gels (2 mg/ml) resulted in fragile tissues that broke after a few days. Skeletal myoblasts were encapsulated in hydrogel and differentiated into myotubes in the muscle chamber using a series of defined media for 3 weeks [17]. In parallel, ChR2-expressing motoneurons were generated from the muscle-derived hiPSCs in suspension culture. After two weeks, a single motoneuron neurosphere was placed into each motoneuron chamber. Initiation of axonal growth was observed after 24 hours, covering the distance between the neurosphere and the muscle tissue in 5 to 7 days (Figure 2D). Immunohistology for α-actinin (red) and the YFP-ChR2 complex showed innervation of the muscle microtissues by day 10 of co-culture (Figure 2E) as well as muscle striations (Figure 2F).
Integration of an optical stimulation platform with custom video processing software for the evaluation of NMJ function. In order to assay NMJ function, we designed an optical stimulation platform with accompanying image-processing code. The platform was equipped with a red 627 nm LED for brightfield illumination, and a blue 488 nm LED for activation of the ChR2 motoneurons. Blue light was filtered before reaching the objective to prevent photostimulation from interfering with the detection of muscle contractions on brightfield imaging. The LEDs were controlled by an Arduino microprocessor for precise control over the timing of light stimulation, and to allow for its correlation with the imaged muscle contractions using image-processing algorithms (Figure 3A, Figure S8).
Integration of an optical stimulation platform and custom video processing software for the evaluation of NMJ function. (A) Design of the optical stimulation platform. (B) Correlation between muscle contraction (black trace) and light pulses (vertical lines) for two different tissues, with and without optical stimulation. Light pulses that are followed by a contraction in the following 100 ms interval are marked as effective (green). Light pulses not followed by a contraction are marked as ineffective (red). (C) Table showing the scoring of the stimulated and non-stimulated tissues with and without correction.
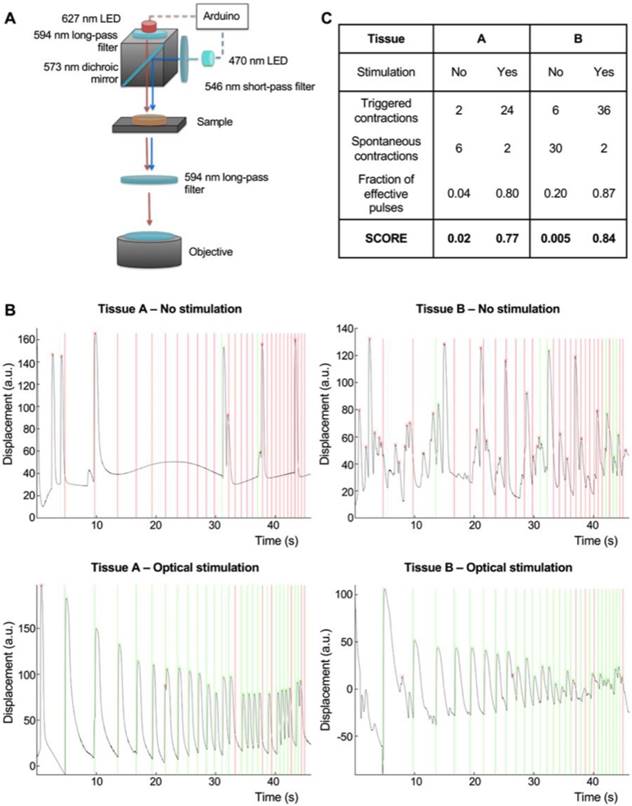
Ramp stimulation regimens consisting of 100-millisecond light pulses delivered at successively higher frequencies were implemented to challenge the tissue in terms of both the number and frequency of repeated contractions. Custom MATLAB code for video processing correlated the light stimulation regimen with the contraction of the muscle tissue (Figure 3B, Movie S1). Stimulation of muscle tissues with blue light in the absence of motoneurons did not evoke any muscle contractions (Movie S2), proving that muscle contraction in the co-cultures was a result of motoneuron activation and not direct muscle response to light.
Based on the electrophysiological analysis of our motoneurons (Figure S6) and the power provided by our optical stimulation system (326 μW/mm2) we expected that 100 ms light pulses would result in the generation of only one action potential. To further test this hypothesis, we compared the tissue response evoked by 1, 10 and 100 ms pulses in the same tissue. Our results showed no differences between the response to 10 and 100 ms pulses, whereas short 1 ms pulses are not enough to cause muscle contraction (Figure S9).
The fraction of effective pulses (the number of light pulses that resulted in muscle contractions) was used as a measure of NMJ function. The probability of contractions randomly happening after a light pulse was calculated based on the total number of contractions during the stimulation time, and used to correct the fraction of effective pulses to obtain a final score (Figure 4B-C). Our algorithm was able to clearly discriminate spontaneous and triggered contractions, as shown in Figure 4B-C for tissues with different levels of spontaneous activities (Non-stimulated tissues scores = 0.02 and 0.005, stimulated scores = 0.77 and 0.84 respectively). This strategy allowed us to evaluate NMJ function and measure changes in an objective, user independent fashion.
Evaluation of the effect of bungarotoxin in NMJ function. (A-B) Contractility traces and light stimulation protocol of a representative tissue before (A) and after (B) 20 min treatment with 5 mg/ml of the neurotoxin α-bungarotoxin (BTX). (C) Quantification of tissue responsiveness to light (score), represented as the corrected fraction of effective light pulses before and after treatment with BTX (n = 6; one-way ANOVA F=9·10-8). (D) Reduction of the number of spontaneous contractions after treatment with BTX (n = 6; one-way ANOVA F=0.03). BTX was added at day 18 after the beginning of the coculture. Error bars represent the standard error of the mean (SEM).
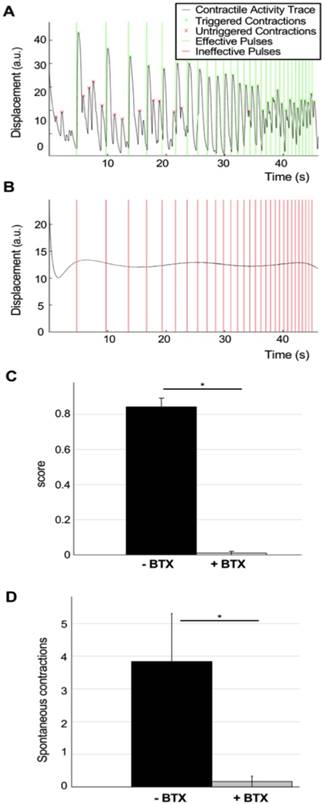
Disruptions of NMJ function due to neurotoxin treatment. With the double purpose of testing our analysis method and to verify that muscle stimulation happens through the NMJs, a set of highly innervated photo-responsive tissues that had been in co-culture for 18 days were selected for analysis using the ramp protocol before (Figure 4A, Movie S1) and after 20 minutes of incubation with 5μg/ml of the neurotoxin α-bungarotoxin (BTX), that binds specifically and irreversibility to the acetylcholine receptors in the NMJ [20] (Figure 4B, Movie S3). BTX completely stopped both light-triggered and spontaneous contractions, proving that light stimulation of the tissues requires a functional NMJ. Quantification of tissue responsiveness to light before and after BTX treatment showed a complete disruption of NMJ function in all the tissues (average score before treatment= 0.84±0.05, after treatment =0.01± 0.01, one-way ANOVA F= 9·10-8) (Figure 4C) as well as suppression of the spontaneous activity of the muscle tissues (average number of spontaneous contractions before treatment= 3.84±1.5, average number of spontaneous contractions after treatment =0.17± 0.17, one-way ANOVA F= 0.03) (Figure 4D).
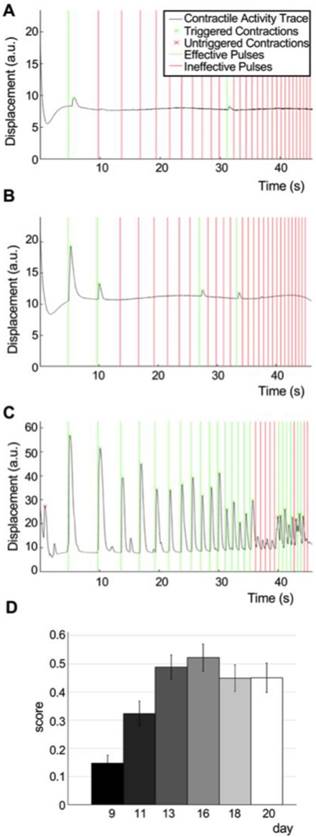
Measurement of physiological changes in NMJ function. To demonstrate the capacity of our system to quantitatively track changes in NMJ function over time, we imaged the same group of tissues for 11 days (day 9 to 20 after motoneuron implantation). Movies and evaluation of a representative tissue at day 9 (Figure 5A, Movie S4, score=0.06), day 13 (Figure 5B, Movie S5, score=0.12) and day 16 (Figure 5C, Movie S6, score=0.71) demonstrate our ability to capture the graded improvements in NMJ function of individual tissues during the physiologic process of innervation. The quantification of movies acquired for 47 tissues in 2 independent experiments documented functional improvement of the neuromuscular synapse during the first week after formation, followed by another week of stable function (average scores: day 9 = 0.15±0.03, day 11 = 0.32±0.04, day 16 = 0.52±0.05) (Figure 5D).
Detection and quantification of physiological changes of NMJ function. (A-C) Contractility traces in response to light stimulation of a representative tissue at day 9 (A, score = 0.06), 11 (B, score=0.12) and 16 (C, score = 0.71). (D) Scoring of tissue responsiveness to light, represented as the corrected fraction of effective light pulses over the first 3 weeks after motoneuron implantation (n = 47, one-way ANOVA p = 1·10-8). Error bars = SEM.
The force generated by the muscle tissues can be calculated as the product of the pillar displacement multiplied by their stiffness. Comparison of the forces generated by the innervated tissues in response to electrical stimulation at early and late stages show no significative differences, whereas light-evoked contractions improve drastically, achieving the same levels as electrically induced forces by day 24 (Figure S10). This suggests that improvement in light responsiveness of the tissue is not due to increased muscular function but to improvement in the neuromuscular connectivity.
Measurement of pathological changes in NMJ function. To demonstrate the translational utility of our system, we recapitulate pathological changes in NMJ function caused by the most common disorder of neuromuscular transmission, myasthenia gravis (MG). MG is an autoimmune disorder caused by autoantibodies against the nicotinic acetylcholine receptors, leading to muscular weakness mediated by a decrease in NMJ function. MG diagnosis is routinely performed based on symptomatology, blood tests for specific antibodies and electrodiagnostic tests. However, the antibody titers correlate poorly with disease severity [21]. Furthermore, since not every antibody involved in MG has been identified, some seronegative patients present with the symptoms of MG without testing positive for any identified antibodies [22]. Electrodiagnosis, on the other hand, is an invasive and painful [23] technique and the results can be confused with other pathologies, such as Lambert-Eaton myasthenic syndrome (LEMS), botulism, or motoneuron disease. Thus, electrodiagnosis cannot be used as a standalone diagnostic tool.
To recapitulate the myasthenic phenotype in our system, we first incorporated pooled sera from 5 patients carrying MG autoantibodies. Steinbeck et al. [8] previously reported the ability to model MG in co-cultures of ESC-derived motoneurons and skeletal myotubes using this approach. However, the reported system was based on manually opening a fluorescent lamp shutter and recording contractions in randomly chosen fields, thus hindering the reproducibility and decreasing the quantitative power of the system.
Our system allowed us to perform repeated precise measurements of the same tissues before exposure (Figure 6A, Movie S7) and after incubation with MG serum (Figure 6B, Movie S8). After washout of the antibodies (Figure 6C, Movie S9), NMJ function was recovered. Quantification of the results for tissues treated with 20% MG serum for 48h showed drastically impaired function (before treatment score mean= 0.43±0.05; after treatment score mean =10-5±0.00) compared to controls treated with serum from healthy donors (before treatment score mean=0.47±0.07; after treatment score=0.40±0.07, p=0.0015) or non-treated tissues (before treatment score mean=0.51±0.05; after treatment score=0.47±0.07, p=3.5·10-6). MG serum was removed and tissues were washed after imaging. Evaluation of tissue function 48h after serum removal showed total functional recovery (recovery score mean =0.39±0.11) (Figure 6D). In an independent experiment, a lower dose of MG serum (10%) with a shorter incubation period of 24h also showed a drastic effect on NMJ function (treated group score=0.04±0.02, control group score=0.60±0.12) (Figure S11). These results demonstrate the capability of our system to detect and quantify changes in NMJ function, and to model human diseases in vitro.
Detection and quantification of pathological changes of NMJ function. (A-C) Contractility traces in response to optical stimulation of a representative tissue before (A, score = 0.78) and after (B, score = 0) 48h of treatment with 20% of myasthenia gravis (MG) serum and 48 after removal of the serum (C, score = 1). (D) Effect of human sera from healthy donors and MG patients on NMJ function (n = 12; after treatment ANOVA F = 0.0002; * p = 0.0015 **p = 3.5·10-6), and recovery after washing. Sera was added at day 18 after the beginning of the coculture. (E) Differential effect of sera from 3 different donors at different concentrations (n = 15; after treatment ANOVA F = 2·10-5; *p< 0.01 vs control group). Treatment was started at day 14 with sequential dose increments at days 16, 18 and 20. Error bars = SEM.
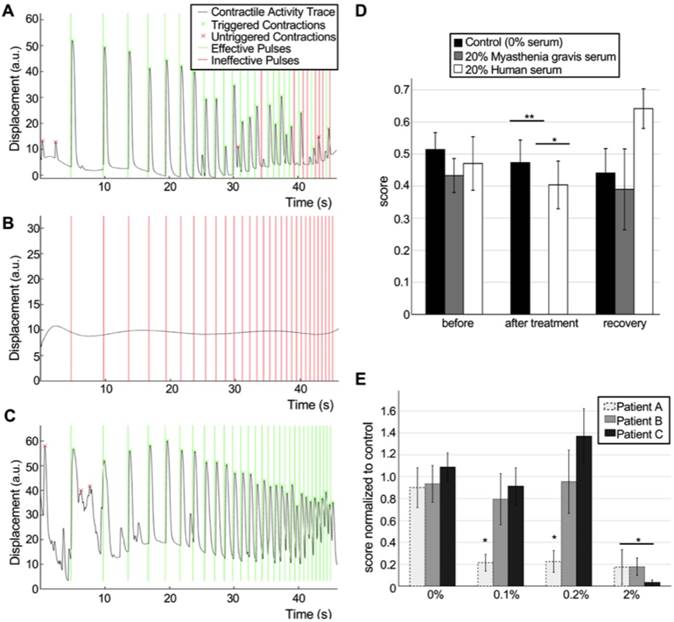
In order to prove the potential of our system as an evaluation tool for myasthenia gravis and other neuromuscular diseases, we then tested individual serum from 3 different patients at successively increasing doses. Our results show that the system is able to detect changes in the NMJ function at doses as low as 0.1% for one of the patients, whereas it is necessary to increment the serum concentration 20 times to be able to see an effect for the other two patients (Figure 6E). These results prove that our system is able to detect differential effects from different patients and suggest that determining the lowest dilution at which the sera has an effect on NMJ function could be a good strategy to evaluate the severity of the disease.
Discussion
The system presented here is the first human three-dimensional NMJ model that allows for automated quantification of function in a user-independent manner, which is accomplished through a unique combination of optogenetics, tissue engineering and image processing. Using this system, we demonstrate the ability to capture graded changes in NMJ function in response to physiologic and pathologic processes such as innervation, neurotoxin exposure, and myasthenia gravis.
The microfluidic device used in this work allowed for the controlled formation of functional NMJs between one human skeletal microtissue and one motoneuron neurosphere growing in separated compartments, allowing for the continued study over time of individual muscle-neutrosphere pairs. Furthermore, the compartmentalized culture mimics human physiology more precisely than simpler coculture systems [8, 24], and will allow for further optimization of the system by incorporation of specific matrices and media for muscle formation, motoneuron maintenance, and axonal growth. Culture of three-dimensional muscle has been previously shown to better recapitulate the organization and function of native muscle [25, 26]. The presence of pillars also allows for the measurement of tissue forces by measuring their displacement. Direct comparison of electrical and optical evoked responses showed that while optical induced contractions are much smaller at early time points, they reached similar values to those evoked by electrical stimulation once the tissue was fully innervated.
The custom-made optical platform allowed for the controlled stimulation of the motoneurons using light pulses of controlled length and frequency. Out results showed that we were able to evoke single actions potentials that resulted in muscle contractions. The ramp protocol used in the experiments reported in this manuscript was 0.2 to 2Hz. It was chosen to provide a good balance between the stimulation time, which directly correlates with the video size and processing time, and the distribution of results over the range of frequencies. This protocol is flexible and can be adapted to the experimental need or the tissue responsiveness. It would be possible to make this protocol more challenging by reaching higher frequencies if we expect or tissues to improve due to some intervention, or to make it less challenging if we are interested on precisely detecting the decrease of function instead.
Our video processing analysis is based on analyzing the response of the whole muscle tissue and not just muscle force. This eliminates the variability caused by small differences during tissue formation that can lead to different tissue geometries and therefore, forces. Our software considers the existence of spontaneous contractions and takes them into account to generate the final score.
Using our system to track individual muscle-neurosphere pairs over time, we were able to detect the gradual improvement of NMJ function during the first 2 weeks of coculture, followed by at least another week of stable function. These results provide insight into the NMJ formation process, and will allow for the screening of interventions that can lead to faster or more complete maturation.
Treatment with BTX, a neurotoxin that binds specifically to the acetylcholine receptors of the NMJ [20], completely stops muscle contractions, both spontaneous and light-induced. This suggests that spontaneous contractions are due to spontaneous activity of the motoneurons and not the muscle and correlates with observations of non-innervated muscle tissues that did not show spontaneous activity.
Finally, we modeled myasthenia gravis by incorporating patient sera in our NMJ model. Our system showed very high sensitivity to the MG antibodies, and was able to clearly discriminate between samples from different patients. Furthermore, after removal of myasthenic antibodies, tissues showed functional recovery, mimicking the effect seen in MG patients when they undergo plasmapheresis [27]. From a clinical standpoint, the ability to recapitulate the myasthenic phenotype not only the study of MG in a human in-vitro model of the NMJ, but also holds great potential as a diagnostic tool for MG and other pathologies such as LEMS. An optogenetic tissue-engineered human system such as ours could be used to evaluate MG and LEMS severity independently of the patient's serotype in a non-invasive way, and help with the differential diagnosis of these diseases in the context of NMJ disorders. In particular, a NMJ model such this should be able to distinguish between post-synaptic diseases such as MG, characterized by increased muscle weakness with repetition, and presynaptic disorders such as LEMS, which present with muscular improvement with repeated stimulation at high frequencies [28] by using a ramp stimulation protocol.
While some limitations remain, our system represents an important step towards the generation of high-throughput, automated tissue-engineered models for preclinical and clinical applications. The use of patient-derived stem cells allows for the study of genetic neuromuscular diseases [29] in a mutation-specific manner, and the development of personalized medicine approaches for diagnosis and treatment. Further improvements in the derivation of motoneurons from stem cells will allow for the generation of more mature NMJ models with adult-like function. On the other hand, further advances in the generation of iPSC-derived skeletal tissues will allow obtaining both cell types form a single iPSC line, easily obtained from blood samples, dramatically increasing the number of genetic diseases that can be studied in the model [30-32].
Moving forward, the incorporation of optogenetic proteins using different wavelengths will allow us to independently stimulate [33] skeletal and neural tissues, and further explore the effects of maturation and disease states in both tissues on NMJ function. Improved spatial control of the light stimulation could be achieved by replacing LEDs by laser beams or by using micromirror technology to project specific illumination patterns [34, 35]. Introducing new cell types such as endothelial cells [36, 37], Schwann cells, or spinal interneurons will allow us to establish more complex models, and will provide key information about their role in these processes. Through the integration of disparate yet complementary technologies, the NMJ model presented here enables a wide variety of applications including drug testing, disease modeling, and personalized medicine.
Abbreviations
BDNF: brain-derived neurotrophic factor; BTX: α-bungarotoxin; ChR2: channelrhodopsin-2; CNTF: ciliary neurotrophic factor; GDNF: glial cell line-derived neurotrophic factor; iPSCs: induced pluripotent stem cells; LED: light emitting diode; LEMS: Lambert-Eaton myasthenic syndrome; MG: myasthenia gravis; NMJ: neuromuscular junction; PBS: phosphate buffered saline; PDMS: polydimethylsiloxane; SEM: standard error of the mean; YFP: yellow fluorescent protein.
Supplementary Material
Supplementary figures, tables and movie legends.
Supplementary movie 1.
Supplementary movie 2.
Supplementary movie 3.
Supplementary movie 4.
Supplementary movie 5.
Supplementary movie 6.
Supplementary movie 7.
Supplementary movie 8.
Supplementary movie 9.
Acknowledgements
We gratefully acknowledge the NIH funding of this work (grant EB002520 to GVN; S10OD20056 to the CCTI Flow Cytometry Core; and support from the National Science Foundation for a Science and Technology Center on Emergent Behaviors of Integrated Cellular Systems, (CBET-0939511) to RDK. We gratefully acknowledge the gift of pLenti-EF1a-hChR2(H134R)-EYFP-WPRE from Karl Deisseroth (Addgene plasmid #20942), and the help of the Columbia Stem Cell Core with cell reprogramming.
Contributions
O.F.V. designed the method and performed the experiments; S.U. designed the microfluidic platform; S.P.M wrote the MATLAB code for analysis and designed the optical platform; D.W. performed the electrophysiological studies; J.P. contributed to the fabrication of devices and cell culture; R.D.K. and G.V.N provided oversight of the study; all authors wrote the manuscript.
Materials and correspondence
Inquiries about optogenetic cell lines and the engineering and characterization of NMJ should be addressed to G.V.N (gv2131@columbia.edu). Inquiries about the microfluidic platform should be addressed to R.D.K. (rdkamm@mit.edu).
Competing Interests
The authors have declared that no competing interest exists.
References
1. Kong L, Wang X, Choe DW. et al. Impaired synaptic vesicle release and immaturity of neuromuscular junctions in spinal muscular atrophy mice. J Neurosci. 2009;29(3):842-851
2. Murray LM, Talbot K, Gillingwater TH. Review: neuromuscular synaptic vulnerability in motor neurone disease: amyotrophic lateral sclerosis and spinal muscular atrophy. Neuropathol Appl Neurobiol. 2010;36(2):133-156
3. Kariya S, Park G-H, Maeno-Hikichi Y. et al. Reduced SMN protein impairs maturation of the neuromuscular junctions in mouse models of spinal muscular atrophy. Hum Mol Genet. 2008;17(16):2552-2569
4. Cifuentes-Diaz C, Nicole S, Velasco ME. et al. Neurofilament accumulation at the motor endplate and lack of axonal sprouting in a spinal muscular atrophy mouse model. Hum Mol Genet. 2002;11(12):1439-1447
5. Frey D, Schneider C, Xu L. et al. Early and Selective Loss of Neuromuscular Synapse Subtypes with Low Sprouting Competence in Motoneuron Diseases. J Neurosci. 2000;20(7):2534-2542
6. Moloney EB, de Winter F, Verhaagen J. ALS as a distal axonopathy: molecular mechanisms affecting neuromuscular junction stability in the presymptomatic stages of the disease. Front Neurosci. 2014 doi:10.3389/fnins.2014.00252
7. Guo X, Gonzalez M, Stancescu M. et al. Neuromuscular junction formation between human stem cell-derived motoneurons and human skeletal muscle in a defined system. Biomaterials. 2011;32(36):9602-9611
8. Steinbeck JA, Jaiswal MK, Calder EL. et al. Functional Connectivity under Optogenetic Control Allows Modeling of Human Neuromuscular Disease. Cell Stem Cell. 2016;18(1):134-143
9. Uzel SGM, Platt RJ, Subramanian V. et al. Microfluidic device for the formation of optically excitable, three-dimensional, compartmentalized motor units. Sci Adv. 2016 doi:10.1126/sciadv.1501429
10. Raman R, Cvetkovic C, Uzel SGM. et al. Optogenetic skeletal muscle-powered adaptive biological machines. Proc Natl Acad Sci USA. 2016;113(13):3497-3502
11. Takahashi K, Tanabe K, Ohnuki M. et al. Induction of pluripotent stem cells from adult human fibroblasts by defined factors. Cell. 2007;131(5):861-872
12. Maury Y, Côme J, Piskorowski RA. et al. Combinatorial analysis of developmental cues efficiently converts human pluripotent stem cells into multiple neuronal subtypes. Nat Biotechnol. 2015;33(1):89-96
13. Loh Y-H, Agarwal S, Park I-H. et al. Generation of induced pluripotent stem cells from human blood. Blood. 2009;113(22):5476-5479
14. Trokovic R, Weltner J, Manninen T. et al. Small molecule inhibitors promote efficient generation of induced pluripotent stem cells from human skeletal myoblasts. Stem Cells Dev. 2013;22(1):114-123
15. Boyden ES, Zhang F, Bamberg E. et al. Millisecond-timescale, genetically targeted optical control of neural activity. Nat Neurosci. 2005;8(9):1263-1268
16. Nagel G, Brauner M, Liewald JF. et al. Light activation of channelrhodopsin-2 in excitable cells of Caenorhabditis elegans triggers rapid behavioral responses. Curr Biol. 2005;15(24):2279-2284
17. Guo X, Greene K, Akanda N. et al. In vitro Differentiation of Functional Human Skeletal Myotubes in a Defined System. Biomater Sci. 2014;2(1):131-138
18. Shin Y, Han S, Jeon JS. et al. Microfluidic assay for simultaneous culture of multiple cell types on surfaces or within hydrogels. Nat Protoc. 2012;7(7):1247-1259
19. Park JY, Yoo SJ, Lee E-J. et al. Increased poly(dimethylsiloxane) stiffness improves viability and morphology of mouse fibroblast cells. BioChip J. 2010;4(3):230-236
20. Lukas RJ, Morimoto H, Hanley MR, Bennett EL. Radiolabeled alpha-bungarotoxin derivatives: kinetic interaction with nicotinic acetylcholine receptors. Biochemistry (Mosc.). 1981;20(26):7373-7378
21. Sanders DB, Burns TM, Cutter GR. et al. Does change in acetylcholine receptor antibody level correlate with clinical change in myasthenia gravis? Muscle Nerve. 2014;49(4):483-486
22. Vernino S. Unraveling the Enigma of Seronegative Myasthenia Gravis. JAMA Neurol. 2015;72(6):630-631
23. Tim RW, Sanders DB. Repetitive nerve stimulation studies in the Lambert-Eaton myasthenic syndrome. Muscle Nerve. 1994;17(9):995-1001
24. Guo X, Gonzalez M, Stancescu M. et al. Neuromuscular junction formation between human stem cell-derived motoneurons and human skeletal muscle in a defined system. Biomaterials. 2011;32(36):9602-9611
25. Madden L, Juhas M, Kraus WE. et al. Bioengineered human myobundles mimic clinical responses of skeletal muscle to drugs. eLife. 2015;4:e04885
26. Ostrovidov S, Ahadian S, Ramon-Azcon J. et al. Three-dimensional co-culture of C2C12/PC12 cells improves skeletal muscle tissue formation and function. J. Tissue Eng. Regen Med. 2017;11(2):582-595
27. Dau PC. Plasmapheresis in myasthenia gravis. Prog Clin Biol Res. 1982;88:265-285
28. Practice parameter for repetitive nerve stimulation and single fiber EMG evaluation of adults with suspected myasthenia gravis or Lambert-Eaton myasthenic syndrome. Summary statement. Muscle Nerve. 2001;24(9):1236-1238
29. Fuller HR, Mandefro B, Shirran SL. et al. Spinal Muscular Atrophy Patient iPSC-Derived Motor Neurons Have Reduced Expression of Proteins Important in Neuronal Development. Front Cell Neurosci. 2015;9:506
30. Maffioletti SM, Sarcar S, Henderson ABH. et al. Three-Dimensional Human iPSC-Derived Artificial Skeletal Muscles Model Muscular Dystrophies and Enable Multilineage Tissue Engineering. Cell Rep. 2018;23(3):899-908
31. Lenzi J, Pagani F, De Santis R. et al. Differentiation of control and ALS mutant human iPSCs into functional skeletal muscle cells, a tool for the study of neuromuscolar diseases. Stem Cell Res. 2016;17(1):140-147
32. Smith AST, Davis J, Lee G. et al. Muscular dystrophy in a dish: engineered human skeletal muscle mimetics for disease modeling and drug discovery. Drug Discov Today. 2016;21(9):1387-1398
33. Klapoetke NC, Murata Y, Kim SS. et al. Independent Optical Excitation of Distinct Neural Populations. Nat Methods. 2014;11(3):338-346
34. Entcheva E, Bub G. All-optical control of cardiac excitation: combined high-resolution optogenetic actuation and optical mapping. J Physiol. 2016;594(9):2503-2510
35. Burton RAB, Klimas A, Ambrosi CM. et al. Optical control of excitation waves in cardiac tissue. Nat Photonics. 2015;9(12):813-816
36. Levenberg S, Rouwkema J, Macdonald M. et al. Engineering vascularized skeletal muscle tissue. Nat Biotechnol. 2005;23(7):879-884
37. Osaki T, Sivathanu V, Kamm RD. Crosstalk between developing vasculature and optogenetically engineered skeletal muscle improves muscle contraction and angiogenesis. Biomaterials. 2018;156:65-76
Author contact
![]() Corresponding author: gv2131edu
Corresponding author: gv2131edu