Impact Factor
- Issue 14; 2026
- Issue 13; 2026
- Issue 12; 2026
- Issue 11; 2026
- Issue 10; 2026
- Volume 16; 2026
- Advance Articles
- Past Issues
- Cover Images
- Cover Suggestion
- Index & Coverage
- Special Issues
Background
Material and Methods
Results
Discussion
Conclusion
Abbreviations
Supplementary Material
Acknowledgements
References
International Journal of Biological Sciences
International Journal of Medical Sciences
 Global reach, higher impact

Theranostics 2019; 9(6):1523-1537. doi:10.7150/thno.32461 This issue Cite
Research Paper
Molecular Imaging of Immune Cell Dynamics During De- and Remyelination in the Cuprizone Model of Multiple Sclerosis by [18F]DPA-714 PET and MRI
Bastian Zinnhardt1,3,4,5, Michaël Belloy2,3, Inga B. Fricke1,3,7, Jasmien Orije2,3, Caroline Guglielmetti2,3, Sven Hermann1, Stefan Wagner5, Michael Schäfers1,5, Annemie Van der Linden2,3, Andreas H. Jacobs1,3,4,6 ![]()
1. European Institute for Molecular Imaging (EIMI), University of Münster, Münster, Germany
2. Bio-Imaging Laboratory, Department of Biomedical Sciences, University of Antwerp, Antwerp, Belgium
3. Imaging Neuroinflammation in Neurodegenerative Diseases (INMIND) EU FP7 consortium
4. PET Imaging in Drug Design and Development (PET3D)
5. Department of Nuclear Medicine, Universitätsklinikum Münster, Münster, Germany
6. Department of Geriatrics, Johanniter Hospital, Evangelische Kliniken, Bonn, Germany
7. Current affiliation: TECHNA Institute for the Advancement of Technology for Health, University Health Network; Institute of Biomaterials and Biomedical Engineering, University of Toronto; both Toronto, Ontario, Canada.
Received 2018-12-21; Accepted 2019-1-7; Published 2019-2-20
Abstract

Background: Activation and dysregulation of innate, adaptive and resident immune cells in response to damage determine the pathophysiology of demyelinating disorders. Among the plethora of involved cells, microglia/macrophages and astrocytes play an important role in the pathogenesis of demyelinating disorders. The in-depth investigation of the spatio-temporal profile of these cell types in vivo may inform about the exact disease state and localization as well as may allow to monitor therapeutic modulation of the components of the neuroinflammatory response during the course of multiple sclerosis (MS).
In this study, we aimed to non-invasively decipher the degree and temporal profile of neuroinflammation (TSPO - [18F]DPA-714 PET) in relation to selected magnetic resonance imaging (MRI) parameters (T2 maps) in the cuprizone (CPZ)-induced model of demyelination.
Methods: C57Bl6 (n=30) mice were fed with a standard chow mixed with 0.2% (w/w) CPZ for 4 (n=10; demyelination) and 6 weeks (n=10; spontaneous remyelination). The degree of neuroinflammation at de- and remyelination was assessed by [18F]DPA-714 PET, multi-echo T2 MRI, autoradiography and immunohistochemistry.
Results: CPZ-induced brain alterations were confirmed by increase of T2 relaxation times in both white and grey matter after 3 and 5 weeks of CPZ. Peak [18F]DPA-714 was found in the corpus callosum (CC, white matter), the hippocampus (HC, grey matter) and thalamus (grey matter) after 4 weeks of CPZ treatment and declined after 6 weeks of CPZ. Ex vivo autoradiography and dedicated immunofluorescence showed demyelination/remyelination with corresponding increased/decreased TSPO levels in the CC and hippocampus, confirming the spatial distribution of [18F]DPA-714 in vivo. The expression of TSPO microglia and astrocytes is time-dependent in this model. Microglia predominantly express TSPO at demyelination, while the majority of astrocytes express TSPO during remyelination.
The combination of PET- and MRI-based imaging biomarkers demonstrated the regional and temporal development of the CPZ model-associated neuroinflammatory response in grey and white matter regions.
Conclusions: The combination of [18F]DPA-714 PET and T2 mapping may allow to further elucidate the regional and temporal profile of inflammatory signals depending on the myelination status, although the underlying inflammatory microenvironment changes. A combination of the described imaging biomarkers may facilitate the development of patient-tailored strategies for immunomodulatory and neuro-restorative therapies in MS.
Keywords: multiple sclerosis, cuprizone, microglia, TSPO, imaging biomarker, neuroinflammation, DPA-714, MRI
Background
Multiple sclerosis (MS) and other demyelinating disorders are characterized by the infiltration of different subsets of T cells, B cells, and a plethora of myeloid cells, as well as activation of innate immune cells, ultimately resulting in demyelination and degeneration of neuronal structures [1].
Microglia, as resident innate immune cells of the brain, play a key role in modulating the inflammatory environment in MS by phagocytosis, antigen presentation and release of pro- and anti-inflammatory cytokines and chemokines. Via para- and autocrine effects, microglia affect disease progression, but also resolution and repair (for review: [1, 2]). Inhibition of their activation has been shown to suppress the development and maintenance of inflammatory lesions in the CNS, indicating their pivotal role in MS disease development [2-4]. The bi-modal function of microglia highlights them as an interesting target for immunomodulatory therapies [5]. In order to depict subtle alterations in microglial activation during inflammation, injury and resolution, new tools to non-invasively asses the microglial response in MS and other neurological diseases are required. The current diagnosis in demyelinating disorders is exclusively relying on magnetic resonance imaging (MRI)-based parameters [6]. However, MRI is lacking molecular information about the inflammatory environment and may miss lesions [7]. Molecular imaging by PET with the second generation translocator protein (TSPO) ligand [18F]DPA-714, in combination with selected MRI parameters (for methodological overview [8]), may represent a novel powerful tool to study microglial activation and general neuroinflammation with high sensitivity, as previously reported in various neurological diseases [9-13].
MS-like disease model recapitulating the phases of de- and remyelination in white and grey matter can be induced in mice by different durations of treatment with the copper chelating agent cuprizone (CPZ) (for review: [14]). Depending on the treatment duration, CPZ administration is associated with a strong inflammatory response, characterized by the activation of microglia, macrophages and astrocytes [15-18], and thus allows to investigate different demyelination and remyelination stages and associated neuroinflammation over time [14, 18, 19].
In this work, we non-invasively examined the spatial and temporal changes of the degree of neuroinflammation and glial activation using the clinically available second generation TSPO PET tracer [18F]DPA-714 in combination with selected MRI parameters during demyelination and spontaneous remyelination. To this end, we performed in vivo [18F]DPA-714 PET in the high resolution quadHIDAC PET system and acquired high resolution and sensitivity T2-weighted anatomical (T2w) and regional T2 relaxation maps during white matter inflammation and demyelination (3-4 weeks of CPZ administration), and spontaneous remyelination (5-6 weeks of CPZ administration). Imaging data were further validated by dedicated, quantitative and regional immunohistochemistry involving specific grey and white matter regions as well as ex vivo autoradiography.
Material and Methods
Experimental design
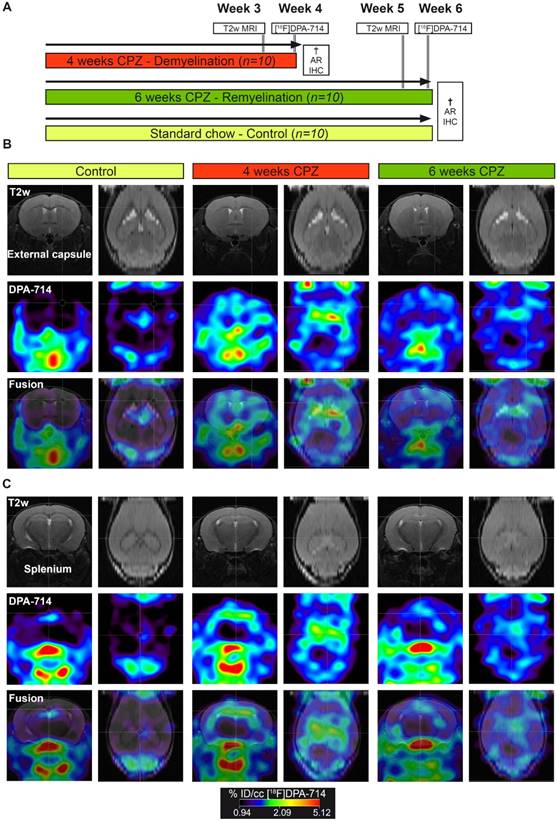
All animal experiments were performed in accordance with the German and Belgian laws for animal protection and were approved by the local bureau for animal care (LANUV, Landesamt für Natur, Umwelt und Verbraucherschutz Nordrhein-Westfalen, Germany) and the committee of Committee on Animal Care and Use at the University of Antwerp, Belgium (2016-44). Experiments have been performed and reported in compliance with the ARRIVE guidelines. n=30 female, 8 weeks old C57Bl6 (weight: 19.8 ± 1.5 g, Charles River Laboratories) were housed at constant temperature (23 °C) and relative humidity (40%), under a 12 h light/12 h dark schedule in a non-SPF environment. Food and water was available ad libitum. In order to assess microglia dynamics in vivo, mice were randomized in to a group fed with a standard rodent chow (n=10; control group) or fed with a standard rodent chow mixed with 0.2% (w/w) CPZ (Sigma-Aldrich, Germany) for 4 (n=10; demyelination) and 6 weeks (n=10; remyelination). First, CPZ-induced brain changes were assessed using T2 relaxation times MRI (Antwerp, week 3 and 5). Next, mice were transferred to Münster and the degree of neuroinflammation at de- and remyelination was assessed by [18F]DPA-714 PET (Münster, week 4 and 6) autoradiography and immunohistochemistry (Figure 1). No animal died during the experiments. All analyses and experimental procedures were performed by researchers blinded for the experimental groups.
In vivo PET/MR imaging of microglial activation in the cuprizone model of demyelination. (A) Experimental design. (B) Representative MR, PET and PET-MR fusion images in the external capsule region. (C) Representative MR, PET and PET-MR fusion images in the external splenium region. Abbreviations: CPZ, cuprizone; IHC, immunohistochemistry
Magnetic resonance imaging
MRI in vivo experiments were conducted on a 9.4T Bruker Biospec system (Biospec 94/20 USR, Bruker Biospin) using a standard Bruker cross coil setup for excitation and a four-channel phased array receive-only cryogenic coil (CryoProbe, Bruker Biospin) for signal detection. During imaging, mice were anesthetized using 2% isoflurane (Isoflo®, Abbot Laboratories Ltd.) in a mixture of 30% O2 and 70% N2 at a flow rate of 600 ml/min. Mice were head-fixed with ear bars and the incisors secured over a tooth bar. Respiratory rate was continuously monitored, and body temperature was measured and maintained constant at 37°C using a feedback coupled warm air system (MR compatible Small Animal Monitoring and Gating System, SA instruments, Inc.).
Anatomical images were acquired using a spin echo Turbo-RARE sequence: field of view (FOV) (20x20) mm2, matrix dimensions (MD) [256x256], repetition time (TR) 3000ms, effective echo time (TE) 33ms, and RARE factor 8. T2 maps were acquired with the multi-slice multi-echo (MSME) sequence that is based on the Carr-Purcell-Meiboom-Gill (CPMG) sequence, where transverse magnetization of a 90° pulse is refocused by a train of 180° pulses generating a series of echoes. The following imaging parameters were used: number of averages (NA) = 1; number of slices (NS) = 6 with a slice thickness of 0.4 mm and an interslice thickness of 0.4 mm; number of echoes = 16 with echo spacing = 7ms (echo times (TE) being 7; 14; 21; 28; 35; 42; 49; 56; 63; 70; 77; 84; 91; 98; 105; 112); a repetition time (TR) = 4000ms; field of view (FOV) = (20x20)mm2; matrix size = [128×128] (this yields an effective in-plane resolution of 0.156 × 0.156 mm).
T2 processing and data analysis
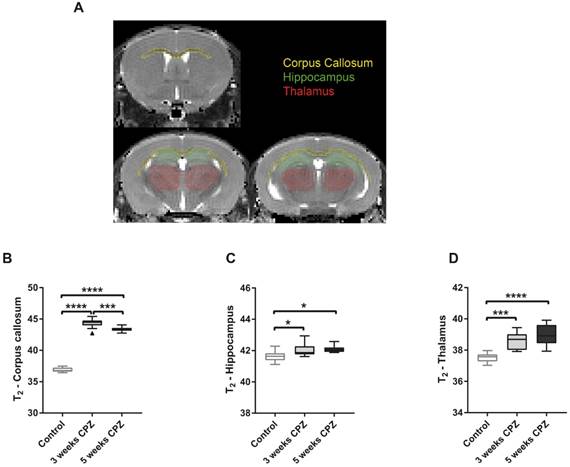
T2 maps were generated with custom-built programmes written in MATLAB (MATLAB R2011b, The MathWorks Inc.) using a monoexponential fit function [y = A + C*exp (-t/T2)], where A = absolute bias, C = signal intensity and T2 = transverse relaxation time. Regions of interest (ROIs) were drawn manually on the T2 maps, according to a mouse brain atlas, with AMIRA software (Mercury Computer systems) and regional average T2 values were calculated. ROIs included the corpus callosum (CC), hippocampus (HC), thalamus, midbrain and somatosensory cortex (Figure 4 and Supplementary Figure 2).
Quantification of mean T2 values for control, CPZ-treated week 3, and CPZ-treated week 5 groups, in different brain regions (A). T2 values were significantly increased in the (B) CC at 3 weeks of CPZ, compared to control, and decreased at 5 weeks of CPZ, compared to 3 weeks of CPZ. In the (C) HC and the (D) thalamus, both week 3 and 5 of CPZ showed elevated T2 values. (n=10; One way ANOVA followed by Tukey multiple comparisons correction; *p ≤ 0.05, **p≤0.01, ***p ≤ 0.001, ****p≤0.0001). Values are presented as Tukey box plots (mean ± SD). Abbreviations: CPZ, cuprizone.
Radiochemistry
[18F]DPA-714 was prepared following the synthesis procedure described in the literature with a radiochemical purity (rcp) of > 99 % and a decay corrected radiochemical yield (rcy) of 16.07 ± 2.34 % (reference substance: [19F]DPA-714, molar activity 45.1-113.2 GBq/µmol; n=4) [20, 21]. [18F]DPA-714 was formulated in saline/EtOH 17/3 (v/v) for injection.
PET imaging
During all imaging experiments, mice were anesthetized with 1.5-2 % isoflurane (Abbott Animal Health, Illinois, USA) in 100% O2. For tracer injection, the lateral tail vein was cannulated using a 26 Ga catheter (Vasculon Plus, BD, Heidelberg, Germany) connected to a 15-cm polyethylene tubing (27 Ga, Smith Medical, Kent, UK). As described before, [18F]DPA-714 PET images were acquired 45-55 min post i.v. injection of 10.7 ± 0.76 MBq on a high resolution small animal PET scanner (32 module quadHIDAC, Oxford Positron Systems Ltd., Oxford, U.K.) with uniform high spatial resolution (≤1 mm FWHM). PET data were reconstructed using one-pass list mode expectation maximization algorithm with resolution recovery [22].
For co-registration of PET and MR images, the animal bed was transferred into the computed tomography (CT) scanner (Inveon, Siemens Medical Solutions, U.S.). As described before, a three step co-registration workflow was used to guarantee exact image co-registration [11]. A thorough quality check of image registration in all 3 image planes was performed after PET/CT/MR co-registration (Suppl. Fig. 4).
PET data analysis
Imaging data were analyzed using the in-house developed software MEDgical by a researcher blinded for the experimental groups. After co-registration of PET, CT and MR images, a three-dimensional digital atlas of the C57BL/6J mouse brain was co-registered [23]. Volumes of interest (VOI) including the CC, HC, thalamus and midbrain were automatically segmented from the atlas based on the inherent color thresholds per regions and used for subsequent tracer uptake analysis. Data were analyzed by calculating the %ID/cc (counts in VOI/total counts x 100) in the VOI or by using the midbrain as pseudo reference region for normalization. Ratios of VOIs-to-midbrain were calculated and compared between groups. The midbrain was chosen as pseudo reference region, as it showed the least variation in radio tracer uptake among the groups. The use of the midbrain as pseudo reference in this model was further evaluated by immunohistochemistry (Suppl. Fig. 3). In addition, previous publications have also investigated the midbrain and found less inflammatory activity after CPZ treatment compared to the CC [24, 25].
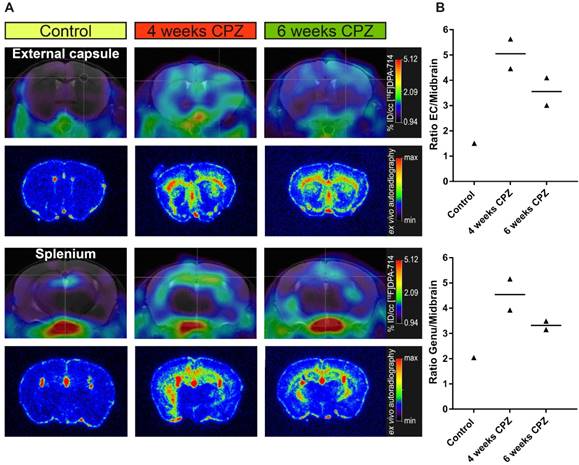
Comparison of in vivo PET data with ex vivo autoradiography. (A) Ex vivo autoradiography confirms the in vivo spatial distribution of [18F]DPA-714 (n = 1-2). The peak uptake was found 4 weeks after CPZ induction in the CC and HC. (B) Increased uptake ratios were observed in the external capsule and genu of the CC. Abbreviations: CPZ, cuprizone; CC, corpus callosum; EC, external capsule; HC, hippocampus.
Autoradiography
After the last imaging scan, mice were sacrificed by transcardial perfusion with 0.9% NaCl (autoradiography, n=5), eventually followed by 4% PFA (immunohistochemistry/-fluorescence).
Autoradiography was performed in a subset of mice (n=5). Mice were sacrificed by transcardial 0.9% NaCl perfusion and brains were immediately harvested, embedded in TissueTek OCT (TissueTek OCT Weckert Labortechnik, Kitzingen, Germany) and snap frozen. Coronal sections of the splenium and external capsule (20 μm) were cut immediately on freezing microtome (Leica) and mounted on microscope slides. Image acquisition was started 30 min after the end of the in vivo PET scans and acquired for 16 h in a microimager (Biospace Lab, Nesles la Vallee, France). For analysis, the external capsule and genu of the CC were manually delineated and analyzed using the in-house developed software MEDgical.
Immunohistochemistry and immunofluorescence
Brain slices (5-10 µm) were post fixed in 4% PFA and processed for immunohistochemistry for the detection of the translocator binding protein (TSPO), myelin basic protein (MBP), astrocytes using glial fibrillary protein (GFAP), and microglia/ macrophages using ionized calcium-binding adapter molecule 1 (Iba-1) markers, as previously described [10, 26]. Immunofluorescence or immunoperoxidase staining was performed in one section of at least four randomized animals using the following primary and secondary antibodies:
TSPO (1:250, rabbit anti-TSPO, NBP1-95674, AB_11015478, Novus Biologicals, Cambridge, UK), myelin basic protein (MBP) (1:200, chicken anti MBP, AB9348, RRID:AB_2140366, Merck, Darmstadt, Germany) , Iba1 (1:250, rabbit anti α Iba1, 019-19742, RRID:AB_2314666; Wako Chemicals, Neuss, Germany), GFAP (1:1000, chicken anti GFAP, ab4674, RRID:AB_304558, abcam, Cambridge, UK); Alexa Fluor 488/555 (1:800; Life Technologies), DSB-X™ Biotin Goat Anti-Chicken IgG (1:800; Life Technologies). Double immunofluorescence for TSPO and Iba-1 was performed using a preconjugated TSPO antibody (1:100; Anti-PBR antibody [EPR5384] (Alexa Fluor® 647) (ab199836)). Slices incubated with only secondary antibodies served as negative controls. Images were acquired with a combined fluorescence- light microscope (Nikon Eclipse NI-E, Nikon, Tokyo, Japan).
Immunofluorescence analysis
Immunohistochemistry/-fluorescence of MBP, TSPO, GFAP and Iba-1 in the splenium (Iba-1, GFAP MBP, TSPO), genu (Iba-1, GFAP, MBP, TSPO), midbrain(Iba-1, GFAP, MBP, TSPO), thalamus (MBP), somatosensory cortex (MBP), were analyzed on one section of four-five animals (5-10 µm) at a 20x magnification by placing a rectangular region of interest (ROI) in the field of view using the Fiji software package. Images were manually thresholded and the area of fluorescence was estimated using the “analyze particles” tool.
Statistical analysis
Statistical analyses were performed with the Sigma Plot 13.0 software package (Systat Software, Erkrath, Germany) and the GraphPad Prism 7 software. During analysis data were tested for normality and variance homogeneity using the Brown-Forsythe and Bartlett's test, respectively. Differences in tracer uptake ratios over time (control, CPZ-treated W4, CPZ-treated W6), as well as differences in MBP, Iba-1 and GFAP staining areas were tested using a one way ANOVA. The one way ANOVA was followed by either multiple comparisons procedures (Holm-Sidak method) or ANOVA on ranks (Tukey method). Differences in TSPO staining area between four and six weeks of CPZ treatment were tested with an unpaired t-test. Correlation analyses were performed with a two-tailed Pearson correlation test. Significance levels were set at p ≤ 0.05. Data were plotted using the GraphPad Prism 7 software. Tukey box plots with whiskers resembling the mean ± standard deviation (SD) were used for visualization of the data. Mean T2 relaxation times across groups (control, CPZ-treated W3, CPZ-treated W5) were similarly compared using one way ANOVA with post hoc Tukey correction. Autoradiography results were not statistically analyzed due to the low n-number per group.
Results
PET imaging
PET experiments with [18F]DPA-714 were performed to detect temporal alterations in microglial activation during demyelination and remyelination in the CPZ model (Figure 1 A). Comparison of PET images with [18F]DPA-714 in three groups revealed increased uptake in the external capsule (Figure 1 B) and the splenium (Figure 1 C) of the CC after four weeks of CPZ treatment. Compared to week four, a decrease of [18F]DPA-714 uptake was observed after six weeks of CPZ treatment (Figure 1 B,C).
The atlas-based quantification allowed for the calculation of uptake values (%ID/cc) of [18F]DPA-714 and mean lesion-to-background ratios (L/B) using the midbrain as pseudo reference region (Figure 2 A). Increased mean [18F]DPA-714 uptake was found after four weeks of CPZ in the CC (%ID/cc: (4w) 1.86 ± 0.23 vs (Control) 1.12 ± 0.12, p ≤ 0.001; L/B: (4w) 1.37 ± 0.05 vs (Control) 0.95 ± 0.06, p ≤ 0.001) the HC (%ID/cc: (4w) 1.96 ± 0.28 vs (Control) 1.35 ± 0.14, p ≤ 0.0001; L/B: 1.44 ± 0.13 vs 1.14 ± 0.08, p ≤ 0.001), and thalamus (%ID/cc: (4w) 1.59 ± 0.28 vs (Control) 1.01 ± 0.11, p ≤ 0.0001; L/B: 1.18 ± 0.22 vs 0.86 ± 0.05, p ≤ 0.001) compared to control animals (Figure 2 B-G).
Quantification of [18F]DPA-714 uptake in different brain regions. (A) A brain atlas template co-registered to the T2w MRI was used for PET quantification. (B-D) Uptake values (%ID/cc) of [18F]DPA-714 show elevated tracer uptake in the CC, HC and thalamus at 4 and 6 weeks after CPZ induction. Significant differences between 4 weeks and 6 weeks after CPZ induction were found in the CC 4 weeks after CPZ compared to 6 weeks after CPZ (E-F) In accordance with the non-normalized data, normalization of tracer uptake values to the midbrain shows significantly elevated lesion-to-background ratios 4 and 6 weeks after CPZ in all three investigated brain regions. (n=10; One way ANOVA followed by multiple comparisons; *p ≤ 0.05, **p≤0.01, ***p ≤ 0.001). Values are presented as Tukey box plots (mean ± SD). Abbreviations: CPZ, cuprizone; CC, corpus callosum; HC, hippocampus.
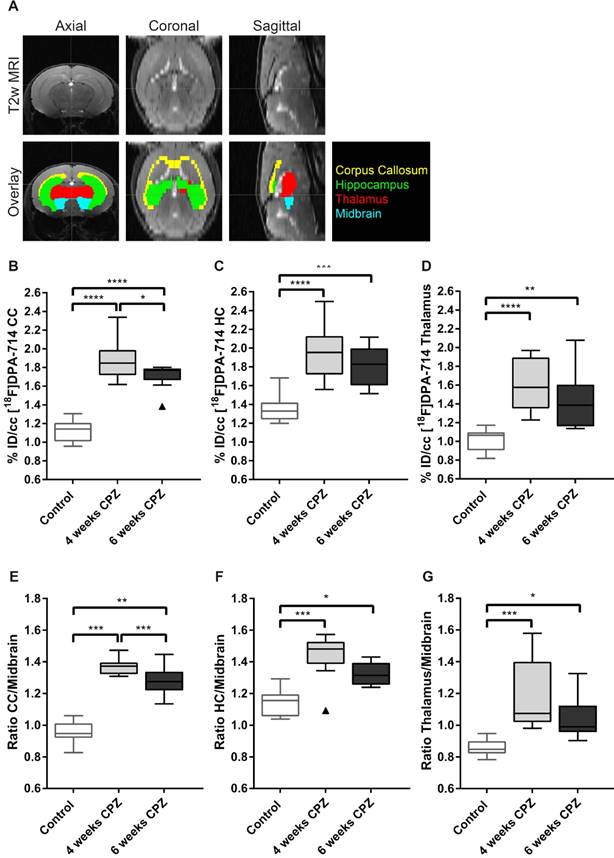
While no statistically significant differences were found in the HC and thalamus between four and six weeks of CPZ, [18F]DPA-714 uptake was significantly increased in the CC comparing four weeks (%ID/cc: 1.86 ± 0.23; L/B: 1.37 ± 0.05) and six weeks of CPZ (%ID/cc: 1.71 ± 0.13, p = 0.05; L/B: 1.28 ± 0.09,p = 0.009 (Figure 2 B,E).
Ex vivo autoradiography
Ex vivo autoradiography was performed for validation of the in vivo [18F]DPA-714 PET data. As expected from the in vivo PET data, ex vivo autoradiography of the external capsule and splenium regions reflected the temporal and spatial dynamics of the in vivo PET uptake pattern (Figure 3 A). Both areas of the CC and the HC showed an increased signal, peaking after four weeks of CPZ and slowly declining after six weeks of CPZ. Furthermore, we observed increased uptake ratios in the external capsule and genu of the CC (Figure 3B), while control animals only showed minor background activity arising from the TSPO expressing ependymal lining.
MR imaging
Multi-echo T2-weighted MRI was performed to obtain T2 maps, which allow detection of anatomical alterations of the brain following CPZ administration (Figure 4A). Qualitative analysis of the T2 maps clearly showed that control mice displayed a dark, hypointense CC, while mice that received three and five weeks of CPZ showed a bright, hyperintense contrast in the CC, indicating structural alterations such as myelin loss and neuroinflammation (Supplementary Figure 1, arrows). Accordingly, T2 values of the CC were increased after three and five weeks of CPZ compared to control (T2: (Control) 36.87 ± 0.36 vs. (3w) 44.35 ± 0.75, p ≤ 0.0001; (5w) 43.36 ± 0.37, p ≤ 0.0001). Additionally, T2 values of the CC were significantly decreased between three and five weeks of CPZ (p = 0.0008), demonstrating evolution of the CPZ injury over time and suggesting partial recovery in the white matter (Figure 4 B).
Next, we investigated whether T2 may detect CPZ-induced alterations in the deep grey matter. T2 of the HC were increased following CPZ administration compared to control (T2: (Control) 41.63 ± 0.34 vs. (3w) 42.04 ± 0.41, p = 0.0297; (5w) 42.09 ± 0.23, p = 0.0128). Similarly, T2 of the thalamus were increased following CPZ administration compared to control (T2: (Control) 37.52 ± 0.29 vs. (3w) 38.6 ± 0.53, p = 0.0001; (5w) 38.95 ± 0.62, p ≤ 0.0001) (Figure 4 C, D). In line with these findings, T2 of the midbrain and the somatosensory cortex were increased after CPZ administration (Supplementary Figure 2).
Altogether, our results indicate that T2 is able to detect CPZ-induced alterations in white matter, but also in deep grey matter and cortical areas.
Immunohistochemistry
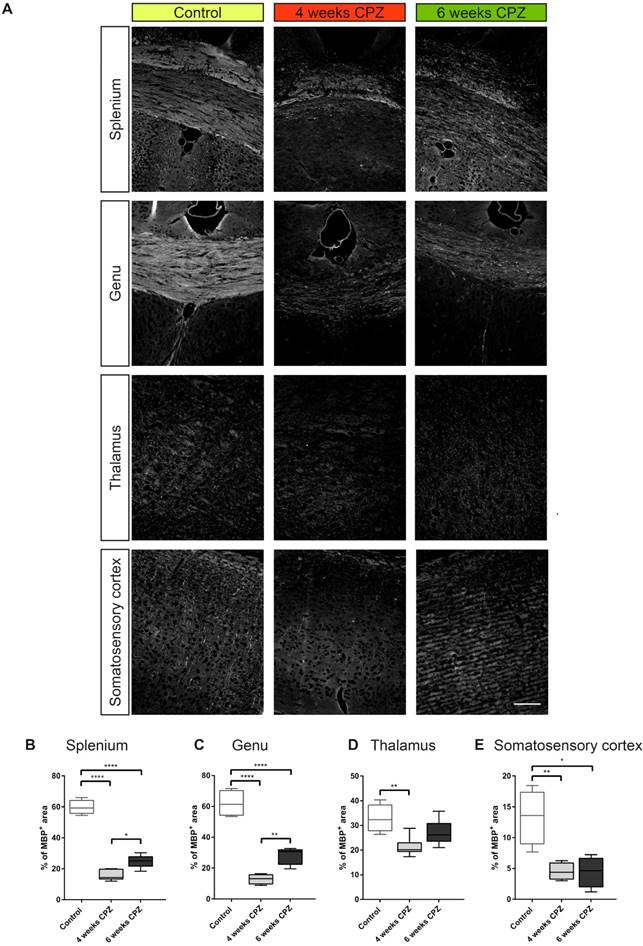
For further validation of in vivo imaging data and determination of cellular sources of TSPO, immunohistochemistry for myelin (Figure 5 A, MBP), microglia/macrophages (Figure 6 A, Iba-1), astrocytes and TSPO (Figure 6 B and Figure 7 A, B , TSPO and GFAP) was performed. Four weeks of CPZ treatment led to a significant reduction in MBP expression in the white matter i.e. the splenium (-43.7% of the percentage of staining area, p≤0.0001) and genu (-49.1%, p≤0.0001) in comparison to control animals. Subcortical areas i.e. the thalamus (-15.4%, p≤0.01), as well as cortical matter i.e. the somatosensory cortex (-8.8%, p≤0.01) showed reduced MBP staining compared to controls indicative of ongoing demyelination (Figure 5 A-E). Continued treatment with CPZ for six weeks led to significant remyelination in the splenium (+8.8%, p ≤ 0.05) and genu (+15.0%, p≤0.01) of the CC compared to animals treated for four weeks with CPZ (Figure 5 A-C).
Immunofluorescence of myelin dynamics. (A-E) Treatment with CPZ for 4 weeks leads to severe demyelination in the splenium, genu, thalamus and somatosensory cortex as compared to control animals. Continued treatment with CPZ for 6 weeks leads to partial remyelination in the splenium and genu (n=4-5; One way ANOVA followed by multiple comparisons; *p ≤ 0.05, **p≤0.01, ***p ≤ 0.001, ****p≤0.0001). Values are presented as Tukey box plots (mean ± SD). Scale bar: 100 µm. Abbreviations: CPZ, cuprizone
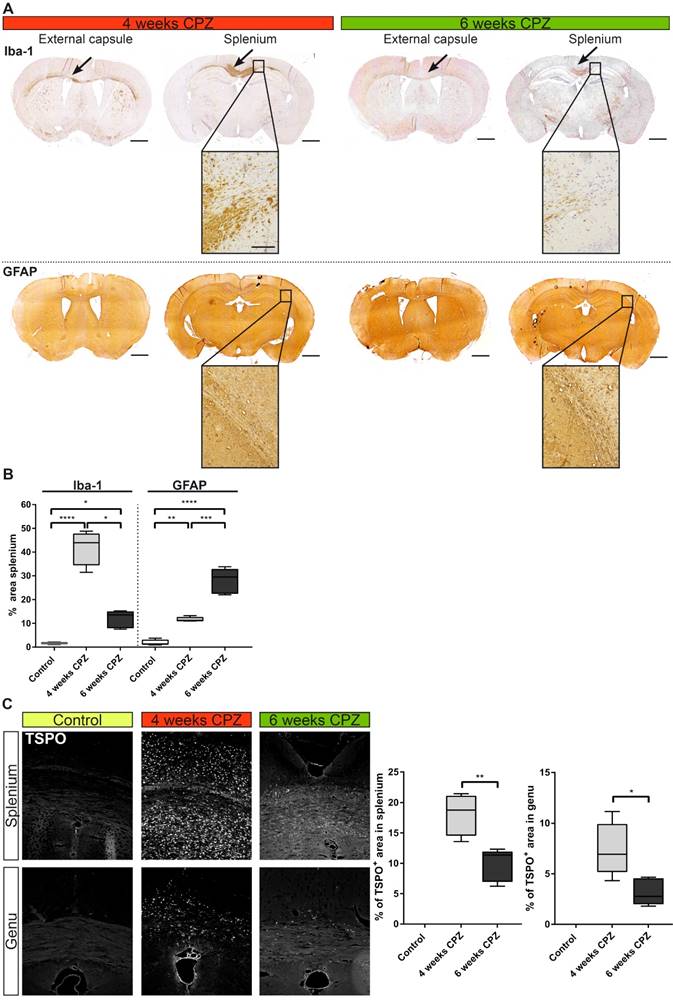
Immunohistochemical validation of immune dynamics for comparison with in vivo PET data. (A) Time course of Iba-1 expression quantifying microglia/macrophages. Strong expression of Iba-1 was found along the external capsule and splenium of the CC 4 weeks after CPZ induction. Iba-1 expression was reduced at remyelination 6 weeks after CPZ induction. GFAP was increased already 4 weeks after CPZ induction and peaked at 6 weeks after CPZ. (B) Quantification of Iba-1 and GFAP reveal differential dynamics of microglia/macrophages and astrocytes. (n=4-5; One way ANOVA followed by multiple comparisons; *p ≤ 0.05, **p≤0.01, ***p ≤ 0.001, ****p≤0.0001) Scale bar 1000 µm, insets 100 µm. (C) Analysis of the time course of TSPO expression. TSPO was significantly increased compared four weeks after CP induction compared to six weeks after CPZ. No TSPO was found in control animals. (n=4-5; One way ANOVA followed by multiple comparisons; *p ≤ 0.05, **p≤0.01, ***p ≤ 0.001, ****p≤0.0001) Scale bar: 100 µm; Abbreviations: CPZ, cuprizone; Iba-1, ionized calcium-binding adapter molecule 1; GFAP, Glial fibrillary acidic protein.
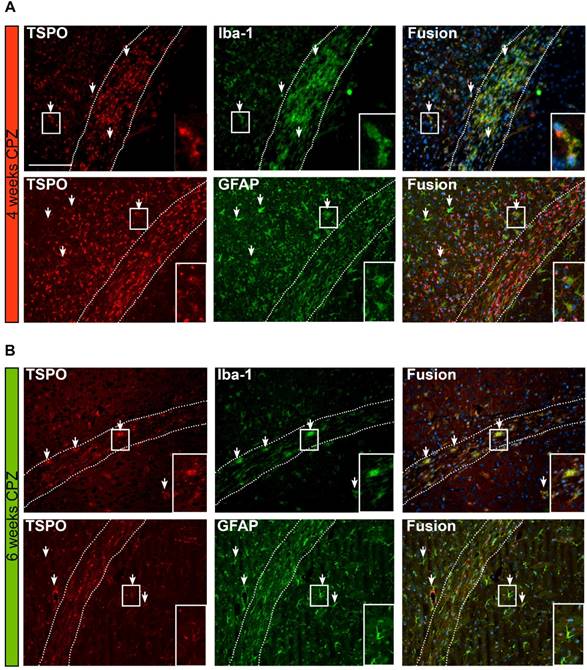
Overview of the time course and cellular sources of TSPO. (A) TSPO is expressed by Iba-1 positive microglia/macrophages four weeks after CPZ induction. Fusion images of GFAP and TSPO reveal that TSPO is mostly independent of GFAP at this disease stage. (B) Six weeks after CPZ the remaining microglia/macrophages further express TSPO. Fusion images indicate astrocytes as important source of TSPO. Arrows point to exemplary microglia and astrocytes expressing TSPO. Scale bar: 100 µm Abbreviations: CPZ, cuprizone; Iba-1, ionized calcium-binding adapter molecule 1; GFAP, Glial fibrillary acidic protein.
Microglia/macrophages levels (Iba-1) were highly elevated in the lesioned CC after four weeks of CPZ (+40%, p≤0.0001) and declined after six weeks of CPZ (-30%, p≤0.05) compared to four weeks of CPZ treatment, whereas astrocytes peaked after six weeks of CPZ treatment (GFAP area: +28.1% ± 4.8%) (Figure 6 A). Similarly, the overall TSPO staining intensity was increased at four weeks in the splenium (+18.1% ± 3.5%, p≤0.01) and genu (+7.4% ± 2.3, p ≤ 0.05) of the CC compared to week six of CPZ treatment. Control animals showed no TSPO immunoreactivity in the CC (Figure 6 B).
Fusion images of double immunofluorescence stainings for TSPO and astrocytes (GFAP), showed a time-dependent expression of TSPO. Four weeks after CPZ induction predominantly microglia/macrophages (Iba-1) express TSPO. In contrast, GFAP-positive astrocytes only faintly express TSPO at this stage of the disease. Fusion images indicate that the majority of TSPO is independent of astrocytes.
Six weeks after CPZ induction, less microglia/ macrophages are found in the CC. However, the remaining Iba-1 positive cells co-localize with TSPO expression. In contrast to the situation after four weeks of CPZ, fusion images indicate that now the majority of GFAP+ cells express TSPO (Figure 7 A, B, arrows).
In contrast to the elevated inflammatory activity in the CC, no significant changes for MBP, TSPO and Iba-1 were found in the midbrain, supporting its use as pseudo reference region in the CPZ model. Only GFAP displayed increased fluorescence at week 4 and 6 compared to control animals, albeit at low levels with less than 1.5% GFAP+ area of the midbrain ROI (Suppl. Fig. 3).
Discussion
In this study, we demonstrate the regional dynamics of TSPO and neuroinflammation in the CPZ model of de- and remyelination in combination with ultra-high field MRI T2 mapping with high resolution and sensitivity in vivo. A 1.4-fold increased uptake of [18F]DPA-714 was observed during demyelination in grey and white matter areas. [18F]DPA-714 uptake was lower during remyelination as compared to demyelination. [18F]DPA-714 PET and MRI thus allowed to distinguish periods of demyelination from remyelination in the CC based on their inflammatory profile. Furthermore, the combined use of ultra-high field MRI and a cryogenic coil enabled an increased sensitivity to CPZ-induced changes in grey (HC, thalamus and cortex) and white matter (CC and external capsule). Ex vivo autoradiography and immunohistochemistry confirmed the regional and temporal distribution of [18F]DPA-714 radiotracer uptake. Microglia/macrophages may account for the majority of TSPO-derived signal four weeks after CPZ induction, while astrocytes play a minor, yet important role in this disease model, particularly in chronic disease stages. The midbrain may serve as suitable pseudo reference VOI for normalization of [18F]DPA-714.
The non-invasive investigation of microglia/ macrophages and astrocytes is important to understand the disease course of demyelinating disorders. Both contribute to neurodegeneration, as they have been implicated to correlate with the extent of axonal damage in (early) MS lesions [27-30].
The CPZ mouse model, a biochemically-induced demyelination model for MS, is accompanied by severe (micro-)gliosis in the first weeks following CPZ administration [26, 31-33]. A major advantage of the CPZ model is the highly reproducible pattern of lesion formation in the adult mouse brain [14, 15], thus representing a model of choice for validating neuroimaging tools [26, 34, 35]. Two time points of interest were chosen according to their histopathological profiles. Specifically, after three to four weeks of CPZ administration mice showed elevated numbers of microglia/macrophages and high demyelination of the CC, while after six weeks of CPZ diet, mice showed increased astrogliosis and spontaneous remyelination of the CC [31, 32, 36]. Besides inducing white matter lesions, it is important to note that CPZ administration also causes strong demyelination and neuroinflammation of cortical and grey matter (HC, thalamus) areas [26, 37, 38].
A wide variety of MRI modalities have been used in the CPZ model, including T1w and T2w imaging, magnetization transfer imaging, macromolecular proton fraction, elastography, proton spectroscopy, hyperpolarized 13C spectroscopy, resting state functional MRI, diffusion tensor and diffusion kurtosis imaging [8, 39-41]. In agreement with previous studies [18, 42, 43] in this multi-center study, T2 values were sensitive to CPZ-induced pathological changes and subsequent recovery in the white matter (CC and external capsule). Increased T2 values reflected inflammatory demyelination, together with associated edema in the CC after three weeks of CPZ administration, while subsequent T2 decrease after five weeks of CPZ diet suggested decreased neuroinflammation and/or remyelination, in line with histological analyses of myelin (MBP) and microglia/macrophages (Iba-1) immunostainings. Very interestingly, we also showed that T2 values were sensitive to measure CPZ-induced alterations in the grey matter (HC, Thalamus and Midbrain) and the somatosensory cortices. The ability of T2 to measure and quantify demyelination and remyelination processes in grey matter was recently reported by Petiet et al. [44] using a CryoProbe at 11.7T in a chronic CPZ model (twelve weeks of CPZ diet). Combined with our findings, this highlights the importance of hardware development to advance diagnostically relevant non-invasive in vivo imaging research [45]. However, although T2 provided a highly sensitive tool to detect CPZ-induced brain changes in-vivo, T2 MRI intrinsically remains an unspecific measure to determine the underlying lesion pathology, and importantly to differentiate between demyelination and neuroinflammation.
Only a few studies have reported the use of TSPO radio ligands for assessing TSPO expression in microglia/macrophage activation in animal models of demyelination. A variety of first and second generation TSPO PET ligands have been described in different models of neurological diseases, including demyelinating diseases and models [11, 13, 46-49]. However, the applicability of first generation TSPO tracers is significantly hampered by limited half-life of carbon-11, low specificity, and unfavorable signal-to-noise ratios [50, 51]. Limitations of SPECT include low sensitivity, low spatial resolution, and quantification. Together, the limitations of the currently available tracers highlight the importance of the development and application of second generation TSPO tracers as shown here.
For the first time in the CPZ mouse model, PET images were co-registered to high-resolution T2 weighted images to enable accurate definition of areas of interest including white matter (CC and external capsule) and grey matter (HC and thalamus). We showed increased [18F]DPA-714 uptake in the CC during demyelination and associated severe microgliosis, which was significantly higher compared to remyelination. Most remarkable, we were also able to describe increased [18F]DPA-714 uptake in grey matter i.e. the HC and thalamus in vivo. Our results add more detailed regional information to previous studies that have shown increased TSPO binding using ex vivo autoradiography in the CPZ model during demyelination and remyelination phases [49, 52-54].
Furthermore, while complementary, our imaging approach provides a significant improvement compared to prior studies performed using TSPO ligands in the CPZ and MS models. For instance, Chen et al. [49] reported increased uptake of a first generation TSPO ligand [11C]PK11195, but only at the whole brain level and at a single time point of interest (four weeks of CPZ administration). Next, Mattner et al. [52], described higher uptake of the SPECT tracer [123I]CLINDE after four weeks of CPZ diet compared to control mice, but did not reach statistical significance when comparing [123I]CLINDE uptake over time (weekly exams up to four weeks of CPZ diet, followed by three weeks of recovery). In line with our findings, Abourbeh et al. [55] have shown that [18F]DPA-714 can visualize TSPO expression in the spinal cord of EAE rats at the peak of EAE disease. Overall, our results demonstrated that the use of the second generation [18F]DPA-714 enabled to distinguish between areas of interest within the brain.
Clinical studies employing second generation TSPO ligands ([11C]PBR28, [18F]PBR111) have shown good test-retest reproducibility and allowed to monitor white matter lesion and normal appearing white matter areas [56-58]. Second generation TSPO ligands may even allow to visualize the heterogeneity of inflammatory lesions in MS as well as give additional information to conventional MRI [7, 58]. Our data support these findings by showing differential uptake patterns in different MS-associated disease stages mimicked by the CPZ model using [18F]DPA-714. In addition, we could show that [18F]DPA-714 gives additional information with regards to conventional T2 MRI. However, it should be pointed out that the quantification of TSPO ligands remains challenging due to the lack of a reference tissue as well as genetic polymorphisms in the TSPO gene [59-62], although recently new methods for automated reference region extraction have been described [63]. Another confounding factor for the quantification of TSPO is the physiological expression of TSPO in the vascular compartment affecting TSPO quantification [64]. It is currently unknown whether and to what extent the inflammatory response may also affect TSPO in the vascular compartment. Furthermore, TSPO does only provide a measure of activated immune cells without information related with its specific functional role in different diseases and brain areas.
Another limitation of TSPO is the multicellular expression of TSPO and an ongoing debate about the relative contribution of several types of TSPO expressing inflammatory cells including microglia, macrophages and astrocytes to the overall TSPO signal [65, 66]. To address this, we compared the relative amount of GFAP-positive astrocytes with Iba-1 positive microglia/macrophages. Our results indicate that microglia/macrophages are, together with astrocytes, the main source of TSPO in this model. However, the contribution of astrocytes to the TSPO signal seems to be more significant in chronic inflammatory situations, hence at remyelination. During demyelination microglia are more prominent. The astrocyte-derived TSPO may represent a negative prognostic value as it has been shown that TSPO knockout in astrocytes led to a decrease in inflammatory damage and mRNA levels of the cytokines TNFα and CXCL10 during the time course of EAE [67]. In accordance, histopathological studies have indicated that microglia outnumber astrocytes in active lesions and represent the prominent source of TSPO in MS [31, 34, 65, 68, 69]. Previous work in the CPZ model has further highlighted that microglia substantially exceed numbers of infiltrating macrophages and T lymphocytes [14, 15, 17]. Interestingly, the in-depth analysis of MBP, TSPO, Iba-1 and GFAP in the midbrain supports the use of the midbrain as pseudo-reference region for normalization of [18F]DPA-714 in this animal model.
Conclusion
This study demonstrates that [18F]DPA-714 PET in combination with T2 mapping supports the non-invasive detection and differentiation of two distinct disease stages of the CPZ model of MS, while the underlying biological processes and cell types change depending on the disease state.
Both imaging parameters may be instrumental in the assessment of various disease stages during the course of MS and have the potential to serve as imaging biomarkers to stratify patients according to their specific inflammatory lesion status in order to validate novel immunomodulatory strategies in MS.
Abbreviations
CC: corpus callosum; CPZ: cuprizone; DPA-714: N,N-diethyl-2-[4-(2-fluoroethoxy)phenyl]-5,7-dimethylpyrazolo[1,5-a]pyrimidine-3-acetamide; EC: external capsule; GFAP: Glial fibrillary acidic protein; HC: hippocampus; Iba-1: ionized calcium-binding adapter molecule 1; IHC: immunohistochemistry; MBP: myelin basic protein; MRI: Magnetic-Resonance-Imaging; MS: Multiple Sclerosis; PET: Positron-Emission- Tomography; TSPO: translocator protein.
Supplementary Material
Supplementary figures.
Acknowledgements
The authors thank S Köster, C Bätza, R Priebe, S Bouma, I Hoppe, C Möllmann, D Reinhardt, and K Reckmann for their excellent technical support and N. Knubel for the support in artwork production.
Author contribution
BZ, MB, IBF, JO, CG, AVDL, AHJ designed the study, performed experiments and analyzed data. BZ, MB, IBF, JO, CG, SH, MS, AVDL, AHJ wrote and critically revised the manuscript.
Funding
This research was partly funded by the EU 7th Framework Programme (FP7/2007-2013) under grant agreement n° 278850 (INMiND), the 'Cells-in-Motion' Cluster of Excellence (DFG EXC1003 - CiM), the Horizon2020 Programme under grant agreement n° 675417 (PET3D), and the Interdisciplinary Center for Clinical Research (IZKF core unit PIX), Münster, Germany. The authors report no conflicting interests.
Ethics approval
All animal experiments were performed in accordance with the German and Belgian laws for animal protection and were approved by the local bureau for animal care (LANUV, Landesamt für Natur, Umwelt und Verbraucherschutz Nordrhein- Westfalen, Germany) and the committee of Committee on Animal Care and Use at the University of Antwerp, Belgium (2016-44).
Availability of data and materials
All data will be stored centrally on the data repository of the University of Münster. Data will be made available from the authors upon request.
Competing Interests
The authors have declared that no competing interest exists.
References
1. Goldmann T, Prinz M. Role of microglia in CNS autoimmunity. Clin Dev Immunol. 2013;2013:208093. doi:10.1155/2013/208093
2. Bogie JFJ, Stinissen P, Hendriks JJA. Macrophage subsets and microglia in multiple sclerosis. Acta Neuropathol. 2014;128:191-213 doi:10.1007/s00401- 014-1310-2
3. Ponomarev ED, Shriver LP, Maresz K, Dittel BN. Microglial cell activation and proliferation precedes the onset of CNS autoimmunity. J Neurosci Res. 2005;81:374-89 doi:10.1002/jnr.20488
4. Goldmann T, Wieghofer P, Müller PF, Wolf Y, Varol D, Yona S. et al. A new type of microglia gene targeting shows TAK1 to be pivotal in CNS autoimmune inflammation. Nat Neurosci. 2013;16:1618-26 doi:10.1038/ nn.3531
5. Giunti D, Parodi B, Cordano C, Uccelli A, Kerlero de Rosbo N. Can we switch microglia's phenotype to foster neuroprotection? Focus on multiple sclerosis. Immunology. 2014;141:328-39 doi:10.1111/imm.12177
6. Kaunzner UW, Gauthier SA. MRI in the assessment and monitoring of multiple sclerosis: an update on best practice. Ther Adv Neurol Disord. 2017;10:247-61 doi:10.1177/1756285617708911
7. Colasanti A, Guo Q, Muhlert N, Giannetti P, Onega M, Newbould RD. et al. In Vivo Assessment of Brain White Matter Inflammation in Multiple Sclerosis with 18F-PBR111 PET. J Nucl Med. 2014;55:1112-8 doi:10.2967/ jnumed.113.135129
8. Wood TC, Simmons C, Hurley SA, Vernon AC, Torres J, Dell'Acqua F. et al. Whole-brain ex-vivo quantitative MRI of the cuprizone mouse model. PeerJ. 2016;4:e2632. doi:10.7717/peerj.2632
9. Wiesmann M, Zinnhardt B, Reinhardt D, Eligehausen S, Wachsmuth L, Hermann S. et al. A specific dietary intervention to restore brain structure and function after ischemic stroke. Theranostics. 2017;7:493-512 doi:10.7150/ thno.17559
10. Zinnhardt B, Viel T, Wachsmuth L, Vrachimis A, Wagner S, Breyholz H-J. et al. Multimodal imaging reveals temporal and spatial microglia and matrix metalloproteinase activity after experimental stroke. J Cereb Blood Flow Metab. 2015;35:1711-21 doi:10.1038/jcbfm.2015.149
11. Zinnhardt B, Pigeon H, Thézé B, Viel T, Wachsmuth L, Fricke IBIB. et al. Combined PET Imaging of the Inflammatory Tumor Microenvironment Identifies Margins of Unique Radiotracer Uptake. Cancer Res. 2017:77 doi:10.1158/0008-5472.CAN-16-2628
12. Fricke IB, Viel T, Worlitzer MM, Collmann FM, Vrachimis A, Faust A. et al. 6-hydroxydopamine-induced Parkinson's disease-like degeneration generates acute micro- and astrogliosis in the nigrostriatal system but no Bioluminescence Imaging detectable alteration in adult neurogenesis. Eur J Neurosci. 2016 doi:10.1111/ejn.13232
13. Martín A, Boisgard R, Thézé B, Van Camp N, Kuhnast B, Damont A. et al. Evaluation of the PBR/TSPO radioligand [(18)F]DPA-714 in a rat model of focal cerebral ischemia. J Cereb Blood Flow Metab. 2010;30:230-41 doi:10.1038/jcbfm.2009.205
14. Praet J, Guglielmetti C, Berneman Z, Van der Linden A, Ponsaerts P. Cellular and molecular neuropathology of the cuprizone mouse model: Clinical relevance for multiple sclerosis. Neurosci Biobehav Rev. 2014;47:485-505 doi:10.1016/j.neubiorev.2014.10.004
15. Hiremath MM, Saito Y, Knapp GW, Ting JP, Suzuki K, Matsushima GK. Microglial/macrophage accumulation during cuprizone-induced demyelination in C57BL/6 mice. J Neuroimmunol. 1998;92:38-49 http://www.ncbi.nlm.nih.gov/pubmed/9916878. Accessed 28 Jul 2017
16. Hibbits N, Yoshino J, Le TQ, Armstrong RC. Astrogliosis during acute and chronic cuprizone demyelination and implications for remyelination. ASN Neuro. 2012;4:393-408 doi:10.1042/AN20120062
17. Remington LT, Babcock AA, Zehntner SP, Owens T. Microglial recruitment, activation, and proliferation in response to primary demyelination. Am J Pathol. 2007;170:1713-24 doi:10.2353/ajpath.2007.060783
18. Guglielmetti C, Veraart J, Roelant E, Mai Z, Daans J, Van Audekerke J. et al. Diffusion kurtosis imaging probes cortical alterations and white matter pathology following cuprizone induced demyelination and spontaneous remyelination. Neuroimage. 2016;125:363-77 doi:10.1016/j.neuroimage.2015. 10.052
19. Guglielmetti C, Le Blon D, Santermans E, Salas-Perdomo A, Daans J, De Vocht N. et al. Interleukin-13 immune gene therapy prevents CNS inflammation and demyelination via alternative activation of microglia and macrophages. Glia. 2016;64:2181-200 doi:10.1002/glia.23053
20. Kuhnast B, Damont A, Hinnen F, Catarina T, Demphel S, Le Helleix S. et al. [18F]DPA-714, [18F]PBR111 and [18F]FEDAA1106—Selective radioligands for imaging TSPO 18kDa with PET: Automated radiosynthesis on a TRACERLAb FX-FN synthesizer and quality controls. Appl Radiat Isot. 2012;70:489-97 doi:10.1016/j.apradiso.2011.10.015
21. James ML, Fulton RR, Vercoullie J, Henderson DJ, Garreau L, Chalon S. et al. DPA-714, a new translocator protein-specific ligand: synthesis, radiofluorination, and pharmacologic characterization. J Nucl Med. 2008;49:814-22 doi:10.2967/jnumed.107.046151jnumed.107.046151 [pii]
22. Schäfers KP, Reader AJ, Kriens M, Knoess C, Schober O, Schäfers M. Performance evaluation of the 32-module quadHIDAC small-animal PET scanner. J Nucl Med. 2005;46:996-1004 http://www.ncbi.nlm.nih.gov/ pubmed/15937311
23. Ma Y, Hof PR, Grant SC, Blackband SJ, Bennett R, Slatest L. et al. A three-dimensional digital atlas database of the adult C57BL/6J mouse brain by magnetic resonance microscopy. Neuroscience. 2005;135:1203-15 doi:10.1016/ j.neuroscience.2005.07.014
24. Goldberg J, Clarner T, Cordian Beyer &, Kipp M. Anatomical Distribution of Cuprizone-Induced Lesions in C57BL6 Mice. doi:10.1007/s12031-015-0595-5.
25. Yan G, Xuan Y, Dai Z, Shen Z, Zhang G, Xu H. et al. Brain Metabolite Changes in Subcortical Regions After Exposure to Cuprizone for 6 Weeks: Potential Implications for Schizophrenia. Neurochem Res. 2015;40:49-58 doi:10.1007/s11064-014-1464-2
26. Guglielmetti C, Veraart J, Roelant E, Mai Z, Daans J, Van Audekerke J. et al. Diffusion kurtosis imaging probes cortical alterations and white matter pathology following cuprizone induced demyelination and spontaneous remyelination. Neuroimage. 2016;125:363-77 doi:10.1016/j.neuroimage.2015. 10.052
27. Bitsch A, Kuhlmann T, Costa C Da, Bunkowski S. Tumour necrosis factor alpha mRNA expression in early multiple sclerosis lesions: correlation with demyelinating activity and oligodendrocyte pathology. Glia. 2000. http://onlinelibrary.wiley.com/doi/10.1002/(SICI)1098-1136(20000215)29:4%3C366::AID-GLIA7%3E3.0.CO;2-Y/full. Accessed 1 Aug. 2017
28. Rasmussen S, Wang Y, Kivisäkk P, Bronson R. Persistent activation of microglia is associated with neuronal dysfunction of callosal projecting pathways and multiple sclerosis-like lesions in relapsing-remitting. Brain. 2007. https://academic.oup.com/brain/article-abstract/130/11/2816/3300 92. Accessed 1 Aug. 2017
29. Singh S, Metz I, Amor S, van der Valk P, Stadelmann C, Brück W. Microglial nodules in early multiple sclerosis white matter are associated with degenerating axons. Acta Neuropathol. 2013;125:595-608 doi:10.1007/ s00401-013-1082-0
30. Howell OW, Rundle JL, Garg A, Komada M, Brophy PJ, Reynolds R. Activated Microglia Mediate Axoglial Disruption That Contributes to Axonal Injury in Multiple Sclerosis. J Neuropathol Exp Neurol. 2010;69:1017-33 doi:10.1097/NEN.0b013e3181f3a5b1
31. Guglielmetti C, Najac C, Didonna A, Van der Linden A, Ronen SM, Chaumeil MM. Hyperpolarized (13)C MR metabolic imaging can detect neuroinflammation in vivo in a multiple sclerosis murine model. Proc Natl Acad Sci U S A. 2017;114:E6982-91 doi:10.1073/pnas.1613345114
32. Matsushima GK, Morell P. The neurotoxicant, cuprizone, as a model to study demyelination and remyelination in the central nervous system. Brain Pathol. 2001;11:107-16 http://www.ncbi.nlm.nih.gov/pubmed/11145196. Accessed 6 Jul 2018
33. Gudi V, Moharregh-Khiabani D, Skripuletz T, Koutsoudaki PN, Kotsiari A, Skuljec J. et al. Regional differences between grey and white matter in cuprizone induced demyelination. Brain Res. 2009;1283:127-38 doi:10.1016/j.brainres.2009.06.005
34. Trapp BD, Bö L, Mörk S, Chang A. Pathogenesis of tissue injury in MS lesions. J Neuroimmunol. 1999;98:49-56 doi:10.1016/S0165-5728(99)00081-8
35. Nathoo N, Yong VW, Dunn JF. Understanding disease processes in multiple sclerosis through magnetic resonance imaging studies in animal models. NeuroImage Clin. 2014;4:743-56 doi:10.1016/j.nicl.2014.04.011
36. Orije J, Kara F, Guglielmetti C, Praet J, Van der Linden A, Ponsaerts P. et al. Longitudinal monitoring of metabolic alterations in cuprizone mouse model of multiple sclerosis using 1H-magnetic resonance spectroscopy. Neuroimage. 2015;114:128-35 doi:10.1016/j.neuroimage.2015.04.012
37. Gudi V, Moharregh-Khiabani D, Skripuletz T, Koutsoudaki PN, Kotsiari A, Skuljec J. et al. Regional differences between grey and white matter in cuprizone induced demyelination. Brain Res. 2009;1283:127-38 doi:10.1016/ j.brainres.2009.06.005
38. Skripuletz T, Lindner M, Kotsiari A, Garde N, Fokuhl J, Linsmeier F. et al. Cortical demyelination is prominent in the murine cuprizone model and is strain-dependent. Am J Pathol. 2008;172:1053-61 doi:10.2353/ajpath.2008. 070850
39. Hübner NS, Mechling AE, Lee H-L, Reisert M, Bienert T, Hennig J. et al. The connectomics of brain demyelination: Functional and structural patterns in the cuprizone mouse model. Neuroimage. 2017;146:1-18 doi:10.1016/ j.neuroimage.2016.11.008
40. Schregel K, Wuerfel nee Tysiak E, Garteiser P, Gemeinhardt I, Prozorovski T, Aktas O. et al. Demyelination reduces brain parenchymal stiffness quantified in vivo by magnetic resonance elastography. Proc Natl Acad Sci. 2012;109:6650-5 doi:10.1073/pnas.1200151109
41. Khodanovich MY, Sorokina I V, Glazacheva VY, Akulov AE, Nemirovich-Danchenko NM, Romashchenko A V. et al. Histological validation of fast macromolecular proton fraction mapping as a quantitative myelin imaging method in the cuprizone demyelination model. Sci Rep. 2017;7:46686. doi:10.1038/srep46686
42. Thiessen JD, Zhang Y, Zhang H, Wang L, Buist R, Del Bigio MR. et al. Quantitative MRI and ultrastructural examination of the cuprizone mouse model of demyelination. NMR Biomed. 2013;26:1562-81 doi:10.1002/ nbm.2992
43. Jelescu IO, Zurek M, Winters K V, Veraart J, Rajaratnam A, Kim NS. et al. In vivo quantification of demyelination and recovery using compartment- specific diffusion MRI metrics validated by electron microscopy. Neuroimage. 2016;132:104-14 doi:10.1016/j.neuroimage.2016.02. 004
44. Petiet A, Aigrot M-S, Stankoff B. Gray and White Matter Demyelination and Remyelination Detected with Multimodal Quantitative MRI Analysis at 11.7T in a Chronic Mouse Model of Multiple Sclerosis. Front Neurosci. 2016;10:491. doi:10.3389/fnins.2016.00491
45. Baltes C, Radzwill N, Bosshard S, Marek D, Rudin M. Micro MRI of the mouse brain using a novel 400 MHz cryogenic quadrature RF probe. NMR Biomed. 2009;22:834-42 doi:10.1002/nbm.1396
46. Winkeler A, Boisgard R, Awde AR, Dubois A, Thézé B, Zheng J. et al. The translocator protein ligand [18F]DPA-714 images glioma and activated microglia in vivo. Eur J Nucl Med Mol Imaging. 2012;39:811-23 doi:10.1007/s00259-011-2041-4
47. Jacobs AH, Tavitian B, consortium Inm. Noninvasive molecular imaging of neuroinflammation. J Cereb Blood Flow Metab. 2012;32:1393-415 doi:10.1038/jcbfm.2012.53
48. Martín A, Vázquez-Villoldo N, Gómez-Vallejo V, Padro D, Soria FN, Szczupak B. et al. In vivo imaging of system xc- as a novel approach to monitor multiple sclerosis. Eur J Nucl Med Mol Imaging. 2016;43:1124-38 doi:10.1007/s00259-015-3275-3
49. Chen M-K, Guilarte TR. Imaging the Peripheral Benzodiazepine Receptor Response in Central Nervous System Demyelination and Remyelination. Toxicol Sci. 2006;91:532-9 doi:10.1093/toxsci/kfj172
50. Chauveau F, Van Camp N, Dollé F, Kuhnast B, Hinnen F, Damont A. et al. Comparative evaluation of the translocator protein radioligands 11C-DPA-713, 18F-DPA-714, and 11C-PK11195 in a rat model of acute neuroinflammation. J Nucl Med. 2009;50:468-76 doi:10.2967/jnumed.108. 058669
51. Boutin H, Prenant C, Maroy R, Galea J, Greenhalgh AD, Smigova A. et al. [18F]DPA-714: direct comparison with [11C]PK11195 in a model of cerebral ischemia in rats. PLoS One. 2013;8:e56441. doi:10.1371/journal.pone.005644 1PONE-D-11-25095 [pii]
52. Mattner F, Bandin DL, Staykova M, Berghofer P, Gregoire MC, Ballantyne P. et al. Evaluation of [123I]-CLINDE as a potent SPECT radiotracer to assess the degree of astroglia activation in cuprizone-induced neuroinflammation. Eur J Nucl Med Mol Imaging. 2011;38:1516-28 doi:10.1007/s00259-011-1784-2
53. Chen M, Baidoo K, Verina T, Guilarte TR. Peripheral benzodiazepine receptor imaging in CNS demyelination: functional implications of anatomical and cellular localization. Brain. 2004;127:1379-92 doi:10.1093/brain/awh161
54. Fukudome D, Hayes LN, Faust TE, Foss CA, Kondo MA, Lee BJ. et al. Translocator protein (TSPO) and stress cascades in mouse models of psychosis with inflammatory disturbances. Schizophr Res. 2018;197:492-7 doi:10.1016/ j.schres.2018.01.015
55. Abourbeh G, Thézé B, Maroy R, Dubois A, Brulon V, Fontyn Y. et al. Imaging microglial/macrophage activation in spinal cords of experimental autoimmune encephalomyelitis rats by positron emission tomography using the mitochondrial 18 kDa translocator protein radioligand [18F]DPA-714. J Neurosci. 2012;32:5728-36 doi:10.1523/JNEUROSCI.2900-11.2012
56. Park E, Gallezot J-D, Delgadillo A, Liu S, Planeta B, Lin S-F. et al. 11C-PBR28 imaging in multiple sclerosis patients and healthy controls: test-retest reproducibility and focal visualization of active white matter areas. Eur J Nucl Med Mol Imaging. 2015;42:1081-92 doi:10.1007/s00259-015-3043-4
57. Herranz E, Giannì C, Louapre C, Treaba CA, Govindarajan ST, Ouellette R. et al. Neuroinflammatory component of gray matter pathology in multiple sclerosis. Ann Neurol. 2016;80:776-90 doi:10.1002/ana.24791
58. Datta G, Colasanti A, Kalk N, Owen DR, Scott G, Rabiner E (Ilan) A. et al. [ 11 C]PBR28 or [ 18 F]PBR111 detect white matter inflammatory heterogeneity in multiple sclerosis. J Nucl Med. 2017:jnumed.116.187161. doi:10.2967/ jnumed.116.187161
59. Raffel J, Sridharan S, Nicholas R. [ 11 C]PBR-28 positron emission tomography in multiple sclerosis: Neuroinflammation or otherwise? Ann Neurol. 2017;81:323-4 doi:10.1002/ana.24853
60. Golla SS V, Boellaard R, Oikonen V, Hoffmann A, van Berckel BNM, Windhorst AD. et al. Quantification of [18F]DPA-714 binding in the human brain: initial studies in healthy controls and Alzheimer's disease patients. J Cereb Blood Flow Metab. 2015;35:766-72 doi:10.1038/jcbfm.2014.261
61. Owen DR, Guo Q, Rabiner EA, Gunn RN. The impact of the rs6971 polymorphism in TSPO for quantification and study design. Clin Transl Imaging. 2015;3:417-22 doi:10.1007/s40336-015-0141-z
62. Lavisse S, García-Lorenzo D, Peyronneau M-A, Bodini B, Thiriez C, Kuhnast B. et al. Optimized Quantification of Translocator Protein Radioligand 18F-DPA-714 Uptake in the Brain of Genotyped Healthy Volunteers. J Nucl Med. 2015;56:1048-54 doi:10.2967/jnumed.115.156083
63. García-Lorenzo D, Lavisse S, Leroy C, Wimberley C, Bodini B, Remy P. et al. Validation of an automatic reference region extraction for the quantification of [ 18 F]DPA-714 in dynamic brain PET studies. J Cereb Blood Flow Metab. 2018;38:333-46 doi:10.1177/0271678X17692599
64. Wimberley C, Lavisse S, Brulon V, Peyronneau M-A, Leroy C, Bodini B. et al. Impact of Endothelial 18-kDa Translocator Protein on the Quantification of 18F-DPA-714. J Nucl Med. 2018;59:307-14 doi:10.2967/jnumed.117.195396
65. Cosenza-Nashat M, Zhao M-LL, Suh H-SS, Morgan J, Natividad R, Morgello S. et al. Expression of the translocator protein of 18 kDa by microglia, macrophages and astrocytes based on immunohistochemical localization in abnormal human brain. Neuropathol Appl Neurobiol. 2009;35:306-28 doi:10.1111/j.1365-2990.2008.01006.x
66. Tronel C, Largeau B, Santiago Ribeiro MJ, Guilloteau D, Dupont A-C, Arlicot N. Molecular Targets for PET Imaging of Activated Microglia: The Current Situation and Future Expectations. Int J Mol Sci. 2017:18 doi:10.3390/ ijms18040802
67. Daugherty DJ, Chechneva O, Mayrhofer F, Deng W. The hGFAP-driven conditional TSPO knockout is protective in a mouse model of multiple sclerosis. Sci Rep. 2016;6:22556. doi:10.1038/srep22556
68. Lucchinetti C, Bruck W, Parisi J, Scheithauer B. Heterogeneity of multiple sclerosis lesions: implications for the pathogenesis of demyelination. Ann. 2000. https://www.researchgate.net/profile/Hans_Lassmann/publication/ 12465103_Heterogeneity_of_multiple_sclerosis_lesions_Implications_for_the_pathogenesis_of_demyelination/links/00b7d52a8681c2e797000000/Heterogeneity-of-multiple-sclerosis-lesions-Implications-for-the-pathogenesis-of-demyelination.pdf. Accessed 1 Aug. 2017
69. Boyle EA, McGeer PL. Cellular immune response in multiple sclerosis plaques. Am J Pathol. 1990;137:575-84 http://www.ncbi.nlm.nih.gov/ pubmed/1698025. Accessed 1 Aug 2017
Author contact
![]() Corresponding author: Andreas H. Jacobs, European Institute for Molecular Imaging (EIMI), Westfälische Wilhelms University Münster, Waldeyerstraße 15, 48149 Münster, Germany. Phone: +492518349300; Fax: +492518349312; Email: ahjacobsde
Corresponding author: Andreas H. Jacobs, European Institute for Molecular Imaging (EIMI), Westfälische Wilhelms University Münster, Waldeyerstraße 15, 48149 Münster, Germany. Phone: +492518349300; Fax: +492518349312; Email: ahjacobsde