Impact Factor
- Issue 14; 2026
- Issue 13; 2026
- Issue 12; 2026
- Issue 11; 2026
- Issue 10; 2026
- Volume 16; 2026
- Advance Articles
- Past Issues
- Cover Images
- Cover Suggestion
- Index & Coverage
- Special Issues
Introduction
Materials and Methods
Results and Discussion
Conclusions
Abbreviations
Acknowledgements
Supplementary Material
References
International Journal of Biological Sciences
International Journal of Medical Sciences
 Global reach, higher impact

Theranostics 2019; 9(7):1993-2002. doi:10.7150/thno.31943 This issue Cite
Research Paper
DNAzyme Catalyzed Tyramide Depositing Reaction for In Situ Imaging of Protein Status on the Cell Surface
Lulu Xu1,2*, Shengchun Liu3*, Tiantian Yang1, Yifan Shen1, Yuhong Zhang1, Lizhen Huang1, Lutan Zhang1, Shijia Ding4, Fangzhou Song2 ![]() , Wei Cheng1
, Wei Cheng1 ![]()
1. The Center for Clinical Molecular Medical Detection, The First Affiliated Hospital of Chongqing Medical University, Chongqing 400016, P. R. China
2. Molecular Medicine and Cancer Research Center, Chongqing Medical University, Chongqing 400016, P. R. China
3. Department of Endocrine and Breast Surgery, The First Affiliated Hospital of Chongqing Medical University, Chongqing 400016, P. R. China
4. Key Laboratory of Clinical Laboratory Diagnostics (Ministry of Education), College of Laboratory Medicine, Chongqing Medical University, Chongqing 400016, P. R. China
*These authors contributed equally to this work.
Received 2018-12-2; Accepted 2019-2-13; Published 2019-3-16
Abstract

Effective characterization of protein biomarkers status on the cell surface has important value in the diagnosis and treatment of diseases. Traditional immunohistochemistry can only assess the protein expression level rather than accurately reflect their interaction and oligomerization, resulting in inevitable problems for personalized therapy.
Methods: Herein, we developed a novel DNAzyme-catalyzed tyramide depositing reaction (DCTDR) for in situ amplified imaging of membrane protein status. By using human epidermal growth factor receptor 2 (HER2) as model, the binding of HER2 proteins with specific aptamers induced the formation of activated hemin/G-quadruplex (G4) DNAzyme on the cell surface to catalyze the covalent deposition of fluorescent tyramide on the membrane proteins for fluorescence imaging.
Results: The DCTDR-based imaging can conveniently characterize total HER2 expression and HER2 dimerization on the breast cancer cell surface with the application of aptamer-G4 probes and proximity aptamer-split G4 probes, respectively. The designed DCTDR strategy was successfully applied to quantitatively estimate total HER2 expression and HER2 homodimer on clinical breast cancer tissue sections with high specificity and accuracy.
Conclusion: The DCTDR strategy provides a simple, pragmatic and enzyme-free toolbox to conveniently and sensitively analyze protein status in clinical samples for improving clinical research, cancer diagnostics and personalized treatment.
Keywords: aptamer, hemin/G-quadruplex DNAzyme, tyramide depositing reaction, human epidermal growth factor receptor 2, protein homodimer
Introduction
Membrane proteins are an essential part of cells and play critically important roles in keeping the integrity of cellular functions involving in cellular proliferation and differentiation, signal transduction, and immune recognition [1, 2]. Many human diseases are associated with the aberrant membrane protein expression and protein-protein interactions. Abnormal receptor protein oligomerization can induce phosphorylation, initiate downstream critical signaling pathways and finally result in tumor formation and metastasis [3, 4]. Plenty of membrane proteins also serve as significant biomarkers and crucial drug targets for cancer [5, 6]. Thus, effective characterization of proteins status on the cell membrane has important value in the diagnosis and treatment of diseases.
For example, as one of the most important protein biomarkers on the tumor cell surface [7], human epidermal growth factor receptor 2 (HER2) was overexpressed in approximately 20%-30% of breast cancer patients [8, 9]. It is believed that HER2 is correlated with the development, invasion and prognosis of breast cancer [10]. Trastuzumab (Herceptin) was an effective targeted drug for HER2-positive metastatic breast cancers [9]. Moreover, evidences have shown that the therapeutic effect of trastuzumab is affected by the different oligomerization status of the HER2 protein. Especially, it takes more effective on high levels of HER2 homodimer than other oligomerization status [11]. Therefore, it is important to profile the HER2 proteins status, including the HER2 expression levels and the dimerization, to provide guidance for better diagnosis and targeted drug therapy of breast cancer.
At present, immunohistochemistry (IHC) is still the most frequently-used method for the in situ detection of the cell surface proteins such as HER2 in clinical pathology laboratory. IHC is based on the specific recognition of target proteins with primary antibodies and the introduction of horseradish peroxidase (HRP) labeled secondary antibodies, resulting in an enzyme-catalyzed dye precipitation on the cell surface [12]. To further enhance the signal, tyramide signal amplification (TSA) was used in IHC due to its excellent amplification effect. In the classical TSA model, HRP is introduced to catalyze the covalent linkage of numerous biotin-labeled tyramide substrates reporters to the enzyme site and nearby proteins. Then biotin-streptavidin system is used to further bind more HRP [13]. Based on this, multiple signal amplification is achieved [14]. However, IHC and TSA techniques still have some limitations, such as multiple immunological recognition of antigen-antibody, the complex process of antibody modification [15]. More importantly, these techniques can only be used to assess the protein expression levels rather than accurately reflect the protein-protein interactions and dimerization.
In recent years, the exploitation of aptamers has gained wide interest because of these unique features such as high binding affinity, low immunogenicity and small size [16, 17]. As a consequence, many aptamer-based methods were developed for cell surface proteins detection by labeling aptamers with diverse biocatalysts including enzyme [18], catalytic metal nanoparticles [19] or DNAzyme [20] due to their easily modified features. Functionalized aptamers were used as the sensing element to transform the protein recognition events into the production of catalysis-induced signal such as absorbance changes [21] or fluorescent signal [22] and have successfully overcame the deficiency caused by the use of antibodies. Although these methods have realized sensitive detection of protein expression, however, they failed to visualize the protein status in situ on the cell surface, especially on clinical fixed tissue section. In addition, multistep tedious operations and modification processes inevitably increase the complexity and cost.
Inspired by traditional TSA, in this work we developed a novel aptamer-induced in situ amplification system named DNAzyme-catalyzed tyramide depositing reaction (DCTDR). In this system, hemin/G-quadruplex DNAzyme was firstly exploited to catalyze the in situ deposition of fluorescent tyramide substrate on the cell surface for amplified imaging of membrane protein status. HER2 protein was chosen as the model. HER2 specific aptamer (Apt2) [23] and intact G-quadruplex sequence (G4) were incorporated to design a bifunctional Apt2-G4 probes for total HER2 protein analysis. The recognition of HER2 protein with the aptamer part can present the hemin/G4 DNAzyme on the cell surface and subsequently initiated DCTDR in situ. On the other hand, for characterization of HER2 homodimer, we designed a pair of proximity probes (Apt2-g4 and Apt2-g8) by using two split G4 sequences with a ratio of 4:8 guanine bases to connect with two HER2 aptamer, respectively [24]. Only when two proximity probes bound with the dimerized HER2 proteins simultaneously, two split G4 sequences can jointly form intact G4 and bind with hemin to assemble activated DNAzyme for DCTDR amplification [20, 25-28]. Thus, by taking the advantages of the high selectivity and flexibility of aptamers, the excellent catalytic activities of hemin/G4 DNAzyme and proximity DNA assembly, the proposed strategy presents a simple and enzyme-free method for amplified imaging proteins expression and dimerization on the cell surface, and shows a great potential for clinical application.
Materials and Methods
Materials and reagents
2,2′-azino-bis (3-ethylben-zothiazoline-6-sulfonic acid) (ABTS2-), Tween 20, hemin, tyramine, 30% hydrogen peroxide solution (H2O2), bovine serum albumin (BSA), diethylpyrocarbonate, 4% paraformaldehyde fix solution, phosphate buffer saline (PBS), dimethyl sulfoxide (DMSO), and DNA oligonucleotides were obtained from Sangon Biotechnology Co. Ltd. (Shanghai, China). Alexa Fluor™ 488 tyramide reagent and Alexa Fluor™ 594 tyramide reagent were purchased from Invitrogen (Carlsbad, CA, USA). Recombinant human epidermal growth factor receptor 2 was purchased from Sino Biological Inc. (Beijing, China). Both IHC kit and DAB kit were from ZSGB-BIO (Beijing, China). Salmon sperm DNA, diamidino-2-phenylindole (DAPI) solution and glass coverslips pretreated with TC were purchased from Solarbio (Beijing, China). All DNA oligonucleotides were purified by high performance liquid chromatography and listed in Table S1. Hemin was dissolved in DMSO and stored in the dark at -20 °C and diluted to the required concentrations with 4-(2-hydroxyethyl)-1-piperazineëthanesulfonic acid (HEPES) (pH 7.4, 100 mM KCl, 200 mM NaCl, 0.05% Triton X-100, 1% DMSO) prior to use. Millipore-Q water (≥18 MΩ, Milli-Q, Millipore) was used for all experiments. Formalin-fixed paraffin-embedded (FFPE) breast cancer tissues and breast cancer cell lines used in this study were obtained from the First Affiliated Hospital of Chongqing Medical University.
The fluorescence spectra were detected by using a Cary Eclipse Fluorescence Spectrophotometer (Agilent Technologies, Palo Alto, CA). The absorbance spectra were obtained by an UV-2550 UV-Visible Spectrophotometer (Shimadzu, Kyoto, Japan). Fluorescence images were visualized under an Olympus BX53 fluorescence microscope (Olympus, Tokyo, Japan). The flow cytometry measurements of the cells were recorded with FC-500 Flow Cytometer (Beckman Coulter, Inc., Fullerton, CA). The confocal microscopy imaging and colocalization analysis were carried out on confocal laser scanning microscope (ZEISS, Germany).
Analysis of the catalytic performance of the probes in solution
To analyze the catalytic performance of different probes samples, we mixed 1 µM hemin solution with a series of probes samples including 100 nM Apt2-G4, Apt2-g4, Apt2-g8 and the mixture of Apt2-g4, Apt2-g8, and HER2 protein solution, and incubated for 30 min at room temperature (RT), respectively. Then, 140 mM tyramine and 400 mM H2O2 were added to each mixture for fluorescence analysis. The spectra were recorded from 330 nm to 500 nm with the excitation wavelength of 320 nm. The silt widths of excitation and emission were both 5 nm and the voltage was 600 V. Furthermore, 100 µL 4 mM ABTS2- and 1 µL of 30% H2O2 were added in the above reaction mixtures of probes and hemin for colorimetric analysis. And the absorption signal at 418 nm was measured by UV-Visible Spectrophotometer in the wave length range of from 500 to 400 nm.
Cell culture and sample pretreatment
Human breast cancer SKBR-3, MDA-MB-231 and MCF-7 cell lines were seeded on glass coverslips pretreated with TC (Solarbio) in 24 wells plates and cultured in DMEM medium (Gibco) containing 10% fetal bovine serum (Gibco) and 1% penicillin and streptomycin at 37 °C in 5% CO2 incubator. When cultured to 90% confluence, the cells were fixed with 4% paraformaldehyde for 15 min at room temperature after removing the medium and then washed three times with ice pre-cold PBS. The activity of endogenous peroxidase was inhibited by 3% H2O2 for 30 min and nonspecific sites were treated with blocking buffer containing 3% BSA and 0.4 mg/mL salmon sperm DNA in PBS at 37 °C for 1 h. Then the cell slides were washed twice using ice-cold PBS for further DCTDR assay.
FFPE sections were placed on a 60 °C baking machine for 2 h then immersed in dimethylbenzene for 8 min. Next, the hydration process was conducted with the following steps: anhydrous alcohol, 95% ethanol, 85% ethanol and 75% ethanol, each step for 3 min. Then, antigen retrieval was accomplished by heating in 10 mM citric acid (pH 6.0) buffer within microwave oven for 10 min, cooling to RT and washing with PBS three times. Then prepared slides were used for further IHC according to product specification or DCTDR assay.
DCTDR-based imaging of protein status on the cell surface
400 μL 200 nM Apt2-G4 probes were added on cell or FFPE slides for HER2 expression detection. 400 μL 200 nM Apt2-g4 and Apt2-g8 probes mixture were used for HER2 homodimer detection. After reacting with corresponding probes at RT for 120 min, the slides were treated with 400 μL 200 nM hemin solution for 30 min at RT to form hemin/G4 DNAzyme structure. The upper reactions were accomplish in HEPES buffer containing 100 mM K+ which is enough to keep the stability of G4 structure. Subsequently, the slides were further incubated with tyramide reaction solution containing Alexa Fluor™ 488 tyramide reagent (1:300) and 3% H2O2 in the dark at RT for 10 min. The cell nucleuses were stained with DAPI solution. Each step was followed with three times washing by 0.05% Tween 20 in PBS buffer for 5 min. Finally, the cells on the slides were analyzed by Olympus BX53 fluorescence microscope (Olympus, Tokyo, Japan) with identical exposure parameters. The fluorescence intensity of FFPE slides was quantified by Image J 7.0.
IHC staining and flow cytometry
The conventional IHC staining was performed according to the instructions. For flow cytometry analysis, 106 of different cell suspensions were treated with corresponding probes and hemin to form hemin/G4 DNAzyme, followed by reaction with tyramide reaction solution. The fluorescence intensity of the cells was then recorded with FC-500 Flow Cytometer (Beckman Coulter).
Results and Discussion
Principle of the DCTDR-based imaging
To illustrate the proof-of-principle, we chose HER2 as the target protein given its importance in breast cancer diagnosis and treatment. In this aptamer-induced DCTDR, the assembly of hemin/G4 DNAzyme on the cell surface can be induced only when the HER2 aptamer specifically bound to the HER2 proteins on the cell surface. The formed hemin/G4 horseradish peroxidase-mimicking DNAzyme [29, 30] on the cell surface can catalyze tyramide residues into free radicals which then covalently link with aromatic compounds such as tyrosine and tryptophan on the neighboring membrane proteins, in the presence of H2O2 (Figure 1A). Due to the tyramide molecules were pre-labeled with Alexa Fluor 488 fluorochrome, a large number of fluorescent molecules were labeled on the cell surface for amplified imaging. Alexa Fluor 488 fluorochrome has the same excitation wavelength (495 nm) and emission wavelength (519 nm) with fluorescein isothiocyanate (FITC) [31], so we used FITC channel of general fluorescence microscopy for imaging analysis. Bifunctional Apt2-G4 probes were designed for total HER2 protein expression analysis by connecting intact G4 sequence with HER2 extracellular domain specific aptamer. When Apt2-G4 probes incubated with the cells, the aptamer region specifically bound to the HER2 extracellular domain on the cell surface. Then G4 sequence region folded properly with hemin to form a stable hemin/G4 DNAzyme, leading to the catalyzed accumulation of fluorescein-labeled tyramide molecule on the cell surface (Figure 1B).
Schematic illustration of DCTDR-based imaging of HER2 protein status on the cell surface. (A) The principle of the DNAzyme-catalyzed covalent binding fluorescent tyramide with protein. (B) The imaging of total HER2 protein expression on the cell surface by Apt2-G4 probes. (C) The imaging of HER2 homodimer on the cell surface by Apt2-g4 and Apt2-g8 probes.
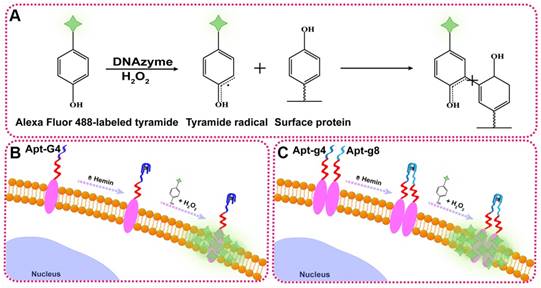
Furthermore, we designed a pair of proximity probes, Apt2-g4 and Apt2-g8, for HER2 homodimer analysis, by linkage of two split G4 sequences at 4:8 ratio of the guanine bases with two HER2 aptamer sequences, respectively. Split G4 sequences at 4:8 ratio is the best split mode because of its highest signal-to-noise ratio and the lowest background compared with the other modes [24]. The simultaneous binding of two proximity probes with identical HER2 homodimer greatly increase their local concentrations and bring g4 sequence and g8 sequence to close proximity, resulting joint assembly with hemin to form a stable and intact hemin/G4 DNAzyme (Figure 1C). Consequently, proximity-induced DNAzyme assembly catalyzed fluorescent tyramide deposition on the HER2 homodimer. Therefore, the proposed aptamer-induced DCTDR system can be used to characterize the HER2 protein status including both total HER2 proteins expression and HER2 homodimer with high-sensitive fluorescent imaging.
Verification the catalytic properties of the designed probes in solution
The design of probes is crucial for the feasibility of the proposed DCTDR strategy. In our group's previous work, we found that hemin/G4 DNAzyme can catalyze the transformation of the non-fluorescent tyramine monomers into fluorescent dityramine in solution [32]. Herein, tyramine monomer was used as the fluorescence reporter to reflect the catalytic performance of the designed probes. After a series of probes were incubated with the appropriate concentration of hemin, only Apt2-G4 probes can catalyze the tyramine monomers to generate a significant fluorescence signal due to the formed intact hemin/G4 DNAzyme. Whereas, the individual proximity probes Apt2-g4 or Apt2-g8 didn't generate appreciable fluorescence signal as well as the mixture of this pair of proximity probes. These data suggested the designed proximity probes cannot assemble a complete hemin/G4 DNAzyme by themselves in solution and have negligible catalytic activity. In addition, the results of the mixture of HER2 proteins monomer with this pair of proximity probes were also similar to the background. Because the scattered HER2 protein monomers were not enough to pull this pair of proximity probes closer together to assemble active DNAzyme. This HER2 monomer-added control experiment also demonstrated that HER2 protein had only one apatmer binding site, guaranteeing the specificity of subsequent quantification of HER2 and their homodimers on the cell surface.
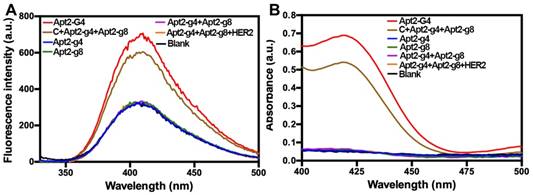
Moreover, in order to verify that the proximity of the Apt2-g4 and Apt2-g8 is crucial to form an intact G4, we also used a complementary DNA (C) probe to simultaneously hybridize with Apt2-g4 and Apt2-g8, respectively, which draw the Apt2-g4 and Apt2-g8 closer to mimic the proximity effect of HER2 dimers. The C/Apt2-g4/Apt2-g8 complex produced obvious fluorescence signal which just slightly lower than that of same amount of Apt2-G4 (Figure 2A). However, the signal of the mixture of Apt-g4 and Apt-g8 without the help of complementary probe was similar to background. These results directly proved that the proximity of the Apt-g4 and Apt-g8 can form an intact G4 with high catalytic activity and low background. In the meantime, the ABTS-H2O2 system was further used to verify the catalytic properties of the designed probes based on that hemin/G4 DNAzyme could produce a measurable absorbance signal through catalyzing the conversion of a colorless ABTS2- to a green ABTS- [33, 34] (Figure 2B). The results were consistent with those obtained by tyramine-H2O2 system.
The fluorescence spectra of tyramine-H2O2 system (A) and UV-Visible absorbance spectra of ABTS-H2O2 system (B) catalyzed by a series of probes, after incubation with hemin.
Feasibility of DCTDR-based imaging for HER2 protein expression analysis
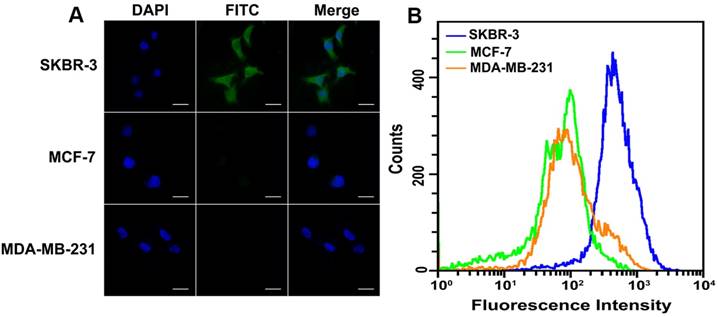
To verify the feasibility of HER2 protein expression analysis with proposed DCTDR-based imaging, HER2-positive breast cancer cell lines SKBR-3 and HER2-negative cells MCF-7 and MDA-MB-231 were chose as the models [35, 36]. First of all, the specific binding of HER2 aptamer with HER2 proteins on the cell surface was confirmed by the flow cytometry analysis of cancer cell lines by using the FITC-labeled HER2 aptamer (Figure S1) and then DCTDR-based imaging was accomplished. As shown in Figure 3A, after the fixed SKBR-3 cells were treated with Apt2-G4 probes and implemented intact DCTDR system, cells showed bright and clear green fluorescence, indicating the Apt2-G4 probes can bind with the HER2 proteins on the cell surface and triggered DCTDR in situ for HER2 protein imaging. The fluorescence signals distributed mainly on the cell surface but partly in cytoplasmic surroundings of SKBR-3 cells, which is in accordance with the imaging results of the original article for this aptamer development, due to enhanced cell penetration ability of DNA aptamer [23]. Meanwhile, there was no detectable fluorescence image, when Apt2-G4 or hemin was absent in the DCTDR system. We also carried out a control experiment by using random sequence linked G4 sequence instead of aptamer to verify the crucial role of HER2 aptamer for specific recognition in our DCTDR system (Figure S2). These results clearly demonstrated that aptamer specific binding-induced hemin/G4 DNAzyme assembly on the cell surface were vital to achieve the catalysis of fluorescein-tyramide deposition. Furthermore, there was no nonspecific adsorption of hemin on the cell surface which may catalyze nonspecific fluorescence signal. On the other hand, MDA-MB-231 cells and MCF-7 cells without HER2 protein expression did not display detectable fluorescent imaging, further proving the high specificity of the designed DCTDR strategy. These results from fluorescence imaging were further confirmed by flow cytometry analysis and demonstrated the feasibility and specificity of the aptamer-induced DCTDR strategy for in situ imaging of protein expression analysis on the cell surface (Figure 3B).
Fluorescence imaging (A) and flow cytometry analysis (B) of SKBR-3, MCF-7 and MDA-MB-231 cells after aptamer-induced DCTDR. Scale bar: 25 µm.
In the meanwhile, several important experimental parameters were optimized for achieving a better analytical performance. Firstly, the incubation time of Apt2-G4 probes was investigated. As shown in Figure S3A-B, the fluorescence intensity of SKBR-3 cells increased with increasing incubation time of Apt2-G4 probes and reached a maximum after 120 min, which was adopted as an optimized incubation time. The long incubation time might be beneficial to aptamer binding and the formation of intact G4 structure. And the reaction time of DCTDR was another key factor because the catalysis was very quick and radical tyramide was a transient intermediate which was easily inactivated. According to the Figure S3C-D, 10 min of reaction time were enough to accumulate abundant fluorescein-tyramide, resulting in localized enhancement of fluorescent signal.
HER2 dimer imaging based on proximity-induced DCTDR
SKBR-3 breast cancer cell line with HER2 over-expression also has high-expressed HER2 homodimer [37, 38]. So SKBR-3 cell was used as a positive model and HER2 homodimer negative MCF-7, MDA-MB-231 cells as negative models to assess the proximity-induced DCTDR strategy for HER2 dimer imaging. In HER2 homodimer imaging, due to the same HER2 aptamer sequence was used, there might be three proximity formats: dimer/Apt2-g4/Apt2-g8, dimer/Apt2-g4/Apt2-g4 and dimer/Apt2-g8/Apt2-g8. But we believe that the stable formation of intact G4 structure with g4 and g8 can provide additional free energy and promote the formation of dimer/Apt2-g4/Apt2-g8 rather than dimer/Apt2-g4/Apt2-g4 and dimer/Apt2-g8/Apt2-g8 (Figure S4) [24, 39, 40]. We did confocal microscopy imaging by using the FITC-labeled Apt2-g4 and TAMRA-labeled Apt2-g8 probes to verify the proximity formats (Figure S5). The colocalization analysis of FITC and TAMRA fluorescence signals were performed in two SKBR-3 cell samples and three HER2 over-expressed breast cancer tissue samples. The Manders' overlap coefficient was calculated to be 0.977±0.011, which implied that about 97% of Apt2-g4 and Apt2-g8 can colocalize on same HER2 dimer [41]. Thus HER2 dimer/Apt2-g4/Apt2-g8 complex is dominant in our proximity-induced DCTDR strategy, resulting in a large number of intact G4 on HER2 homodimer high-expressed cell surface for HER2 dimer imaging.
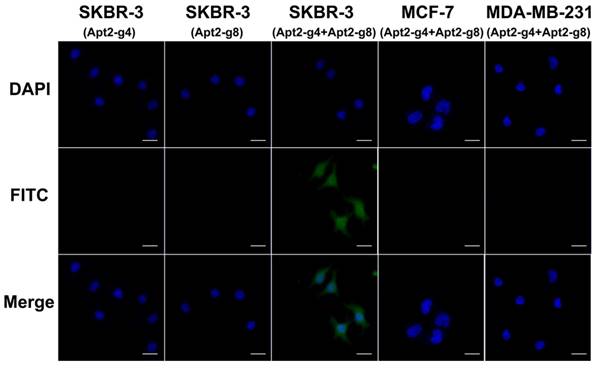
Because there is a certain distance between the two aptamer binding sites on the HER2 homodimer, the length of the T repeat linkers between the HER2 aptamer and split G4 sequence will affect the assembly efficiency of active G4 DNAzyme. In order to achieve better assembly efficiency we also investigated the spacer lengths between split G4 and aptamer sequence (Figure S6). We found that 8-bp spacer can result in optimal imaging. Under optimal conditions, in the presence of both Apt2-g4 and Apt2-g8 probes in the assay, SKBR-3 cells showed a remarkable fluorescence image (Figure 4). It was a powerful proof that the simultaneous recognition of HER2 homodimer by this pair of proximity probes can induce the formation of complete hemin/G4 DNAzyme on the cell surface. And thereby, the formed hemin/G4 DNAzyme can catalyze the deposition of abundant tyramide fluorescence reporters on the cell surface for amplified imaging. In contrast, MCF-7, MDA-MB-231 cells displayed inappreciable fluorescence which matched well with the fact that there was a direct correlation between the level of HER2 homodimer expression and the total HER2 protein expression [38]. Furthermore, the results of flow cytometry coincided well with the fluorescence imaging and further demonstrated the feasibility and specificity of proximity-induced DCTDR strategy (Figure S7). In the case of the Apt2-g4 probes or Apt2-g8 probes alone applied in the assay, there was no fluorescent signal produced on HER2 homodimer-positive SKBR-3 cell surface. In these two control experiments, although proximity probes can bind with HER2 protein alone, single Apt2-g4 or Apt2-g8 cannot combine hemin to from hemin/G4 DNAzyme structure. This result was in accord with the catalytic properties of the proximity probes in solution and the colocalization analysis result.
Fluorescence imaging of SKBR-3, MCF-7 and MDA-MB-231 cells based on proximity-induced DCTDR and SKBR-3 cells with single Apt2-g4 or Apt2-g8 probes in the assay as control. Scale bar: 25 μm.
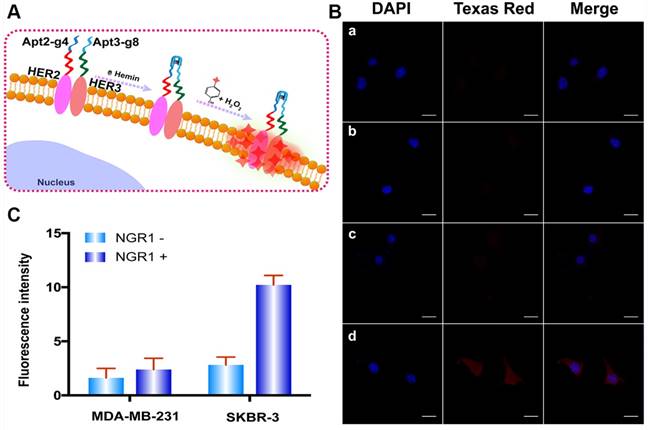
To further verify the capacity of the proposed method for versatile imaging of protein dimerization. This method was used to detect HER2/HER3 heterodimers by using Apt2-g4 and HER3 aptamer (Apt3)-g8 as proximity probes and red Alexa Fluor 594-labeled tyramide reagent (a substitute for Texas Red with excitation wavelength of 590 nm and emission wavelength of 617 nm) as reporter. Neuregulin 1 (NRG1), a classic HER3 ligand was used to stimulate to generate HER2/HER3 heterodimer-positive SKBR-3 cells model. Meanwhile, NRG1-stimulated MDA-MB-231 cells were used as HER2/HER3 heterodimer-negative control cell due to its low expression of HER2 [42, 43]. We first starved the SKBR-3 and MD-MB-231 cells overnight by using a serum-free medium and treated with 50 ng/L NRG1 for 30 min at 37 °C [44]. As is shown in Figure 5, upon stimulation of NRG1, SKBR-3 cells exhibited marked bright red profiles, while MDA-MB-231 cells remain indistinct. These results revealed the proposed proximity-induced DCTDR strategy can be applied to detect HER2/HER3 heterodimers on different breast cancer cells, proving its versatile application.
(A) The Schematic diagram of HER2/HER3 heterodimers imaging based on DCTDR system. (B) Fluorescence imaging and (C) fluorescence intensity analysis of HER2/HER3 heterodimers on MDA-MB-231 cells (a, b) and SKBR-3(c, d) cells without (a, c) or with (b, d) NRG1 treatment. The data were gained from three independent experiments. Scale bar: 25 μm.
Characterization of HER2 status in clinical tissue samples
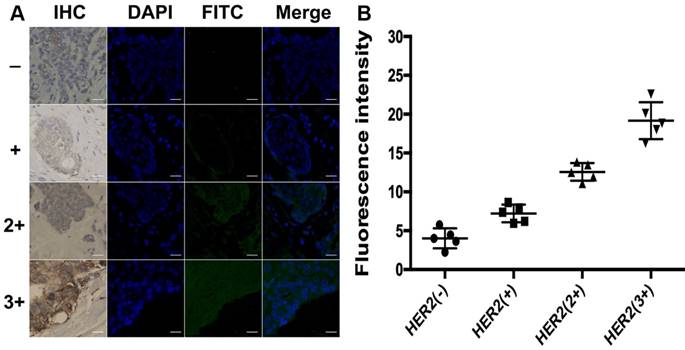
To further explore the application of the developed method in clinical tissue samples, the total HER2 expression and HER2 homodimer were analyzed in 20 clinical FFPE samples of invasive breast cancers tissues. Meantime, IHC assay was used as reference method to semi-quantitatively score the total HER2 expression of these samples and categorize them in four subgroups as HER2 (-), HER2 (+), HER2 (2+) and HER2 (3+) according to the ASCO/CAP guideline recommendations for HER2 testing. Each subgroup contained 5 samples, respectively. As shown in Figure 6, there was no detectable fluorescent image obtained in HER2 (-) subgroup. The slight fluorescent profile showed in HER2 (+) subgroup and bright fluorescence displayed in HER2 overexpressed subgroups HER2 (2+) and HER2 (3+). The fluorescence intensity of cancer cells analyzed with ImageJ 7.0 software was increased with the increasing levels of HER2 expression, which was in good agreement with IHC score. It is worth mentioning that green fluorescence only existed in the region of carcinoma nests rather than stroma cells regions in HER2 expressed breast cancer tissues, in good accord with the profiles of the IHC staining. It also strongly proved that the designed DCTDR strategy has high specificity and accuracy to quantitatively estimate the expression of HER2 protein on clinical FFPE tissue sections with simple and enzyme-free protocol.
(A) DCTDR-based fluorescence imaging and (B) quantitative fluorescence intensity analysis of total HER2 expression on breast cancer tissues with different HER2 expression levels, respectively. Scale bar: 25 μm.
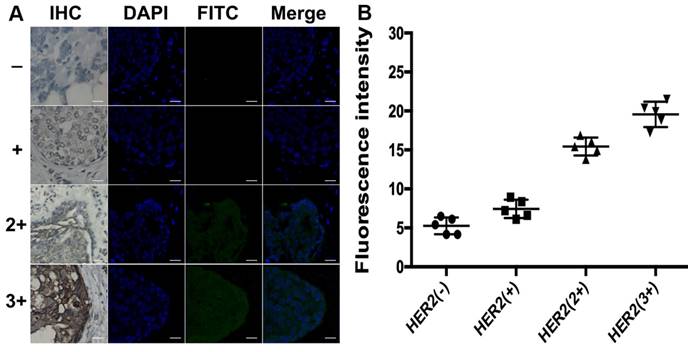
Different from total HER2 expression imaging, the HER2 homodimer imaging of both HER2 (-) and HER2 (+) subgroups with proximity-induced DCTDR didn't display any detectable fluorescent signal (Figure 7). The quantitative fluorescence intensity didn't show significant difference between two subgroups (5.3 ± 1 and 7.4 ± 1.2, respectively), analyzed with ImageJ 7.0 software. This result indicated that HER2 negative or low-expressed breast cancer cells didn't express HER2 homodimer, which was also consistent with the results of MDA-MB-231 and MCF-7 cell lines. On the contrary, it has been acknowledged that HER2 homodimer can spontaneously form on HER2 protein overexpressed breast cancer cell surface [45, 46]. In our HER2 overexpressed subgroups HER2 (2+) and HER2 (3+), significant fluorescent images were also found with continuously increased fluorescence intensities (15.4 ± 1.2 and 19.5 ± 1.6, respectively) which revealed statistical significance compared with HER2 (-) and HER2 (+) subgroups (P < 0.01). These evidences demonstrated that the DCTDR-based assay directly reveal status of the HER2 dimers was suitable for analysis of the HER2 dimers status in complex clinical FFPE samples. Compared with the IHC assay, the proposed DCTDR imaging can directly reveal both the total expression of HER2 and HER2 dimerization rather than only reflect the overall amount of HER2 protein. What's more, due to a simpler and enzyme-free process, our strategy can be completed in six hours with little cost (Table S2), presenting a great potential pragmatic tool for clinical research, cancer diagnosis and guidance of targeted therapy.
(A) DCTDR-based fluorescence imaging and (B) quantitative fluorescence intensity analysis of HER2 homodimer on breast cancer tissues with different HER2 expression levels, respectively. Scale bar: 25 μm.
Conclusions
In summary, we developed a new aptamer-induced amplification system which was DCTDR to comprehensive analyze the profiling of the HER2 proteins in situ on the cell surface. In this system, the specific recognition of HER2 aptamer can induce the assembly of hemin/G4 DNAzyme and subsequently catalyze the fluorophore-labeled tyramide substrate, leading to accumulation of fluorescent signal on the surface of the target protein. Based on this DCTDR, we have successfully completed the imaging of total HER2 protein, HER2 homodimer and HER2/ HER3 heterodimer by using the functionalized Apt2-G4 probes and the pair of proximity probes Apt2-g4/Apt2-g8 and Apt2-g4/Apt3-g8 respectively. More importantly, our method can also carry out in FFPE samples. Compared to traditional IHC, this method is more simple, convenient and directly reveals the function and activation of HER2-based signal pathway. This DCTDR strategy achieved both imaging and quantitative analysis HER2 status in situ, offering new insight into the membrane proteins for disease diagnostics and targeted drug therapy.
Abbreviations
HER2: human epidermal growth factor receptor 2; IHC: immunohistochemistry; HRP: horseradish peroxidase; TSA: tyramide signal amplification; DCTDR: DNAzyme-catalyzed tyramide depositing reaction; Apt: aptamer; G4: G-quadruplex sequence; ABTS2-: 2,2-azino-bis(3-ethylben-zothiazoline-6-sulfonic acid; H2O2: hydrogen peroxide; BSA: bovine serum albumin; PBS: phosphate buffer saline; DMSO: dimethyl sulfoxide; DAPI: diamidino-2-phenylindole; HEPES: 4-(2-hydroxyethyl)-1-piperazineëthanesulfonic acid; FITC: fluorescein isothiocyanate; FFPE: formalin-fixed paraffin-embedded; RT: room temperature; HER3: human epidermal growth factor receptor 3; NRG1: neuregulin 1.
Acknowledgements
This work was funded by the National Natural Science Foundation of China (81572080, 81873972 and 81873980), the Natural Science Foundation Project of Chongqing (cstc2015shmszx120086) and the Training Program for Advanced Young Medical Personnel of Chongqing (2017HBRC003).
Supplementary Material
Supplementary figures and tables.
Competing Interests
The authors have declared that no competing interest exists.
References
1. Grimm D, Bauer J, Pietsch J, Infanger M, Eucker J, Eilles C. et al. Diagnostic and therapeutic use of membrane proteins in cancer cells. Curr Med Chem. 2011;18:176-90
2. Arinaminpathy Y, Khurana E, Engelman DM, Gerstein MB. Computational analysis of membrane proteins: the largest class of drug targets. Drug Discov Today. 2009;14:1130-5
3. Hudis CA. Trastuzumab-mechanism of action and use in clinical practice. N Engl J Med. 2007;357:39-51
4. Hynes NE, Lane HA. ERBB receptors and cancer: the complexity of targeted inhibitors. Nat Rev Cancer. 2005;5:341-54
5. Brown DM, Ruoslahti E. Metadherin, a cell surface protein in breast tumors that mediates lung metastasis. Cancer Cell. 2004;5:365-74
6. Sanders CR, Nagy JK. Misfolding of membrane proteins in health and disease: the lady or the tiger? Curr Opin Struct Biol. 2000;10:438-42
7. Slamon DJ, Clark GM, Wong SG, Levin WJ, Ullrich A, McGuire WL. Human breast cancer: correlation of relapse and survival with amplification of the HER-2/neu oncogene. Science. 1987;235:177-82
8. Slamon DJ, Godolphin W, Jones LA, Holt JA, Wong SG, Keith DE. et al. Studies of the HER-2/neu proto-oncogene in human breast and ovarian cancer. Science. 1989;244:707-12
9. Yakes FM, Chinratanalab W, Ritter CA, King W, Seelig S, Arteaga CL. Herceptin-induced inhibition of phosphatidylinositol-3 kinase and Akt is required for antibody-mediated effects on p27, cyclin D1, and antitumor action. Cancer Res. 2002;62:4132-41
10. Weigel MT, Dowsett M. Current and emerging biomarkers in breast cancer: prognosis and prediction. Endocr Relat Cancer. 2010;17:R245-62
11. Ghosh R, Narasanna A, Wang SE, Liu S, Chakrabarty A, Balko JM. et al. Trastuzumab has preferential activity against breast cancers driven by HER2 homodimers. Cancer Res. 2011;71:1871-82
12. Pugliese M, Stempel M, Patil S, Hsu M, Ho A, Traina T. et al. The clinical impact and outcomes of immunohistochemistry-only metastasis in breast cancer. Am J Surg. 2010;200:368-73
13. Bobrow MN, Harris TD, Shaughnessy KJ, Litt GJ. Catalyzed reporter deposition, a novel method of signal amplification. Application to immunoassays. J Immunol Methods. 1989;125:279-85
14. Akama K, Shirai K, Suzuki S. Droplet-free digital enzyme-linked immunosorbent assay based on a tyramide signal amplification system. Anal Chem. 2016;88:7123-9
15. Teramoto N, Szekely L, Pokrovskaja K, Hu LF, Yoshino T, Akagi T. et al. Simultaneous detection of two independent antigens by double staining with two mouse monoclonal antibodies. J Virol Methods. 1998;73:89-97
16. Sankaran NB, Nishizawa S, Seino T, Yoshimoto K, Teramae N. Abasic-site-containing oligodeoxynucleotides as aptamers for riboflavin. Angew Chem Int Ed Engl. 2006;45:1563-8
17. Shangguan D, Li Y, Tang Z, Cao ZC, Chen HW, Mallikaratchy P. et al. Aptamers evolved from live cells as effective molecular probes for cancer study. Proc Natl Acad Sci USA. 2006;103:11838-43
18. Baldrich E, Acero JL, Reekmans G, Laureyn W, O'Sullivan CK. Displacement enzyme linked aptamer assay. Anal Chem. 2005;77:4774-84
19. Liu Y, Hou W, Xia L, Cui C, Wan S, Jiang Y. et al. ZrMOF nanoparticles as quenchers to conjugate DNA aptamers for target-induced bioimaging and photodynamic therapy. Chem Sci. 2018;9:7505-9
20. Zong C, Wu J, Liu M, Yang L, Yan F, Ju H. Chemiluminescence imaging for a protein assay via proximity-dependent DNAzyme formation. Anal Chem. 2014;86:9939-44
21. Xu L, Jiang Z, Mu Y, Zhang Y, Zhan Q, Cui J. et al. Colorimetric assay of rare disseminated tumor cells in real sample by aptamer-induced rolling circle amplification on cell surface. Sens Actuators B Chem. 2018;259:596-603
22. Li F, Zhang H, Wang Z, Li X, Li XF, Le XC. Dynamic DNA assemblies mediated by binding-induced DNA strand displacement. J Am Chem Soc. 2013;135:2443-6
23. Sett A, Borthakur BB, Bora U. Selection of DNA aptamers for extra cellular domain of human epidermal growth factor receptor 2 to detect HER2 positive carcinomas. Clin Transl Oncol. 2017;19:976-88
24. Zhu J, Zhang L, Dong S, Wang E. How to split a G-quadruplex for DNA detection: new insight into the formation of DNA split G-quadruplex. Chem Sci. 2015;6:4822-7
25. Travascio P, Li Y, Sen D. DNA-enhanced peroxidase activity of a DNA-aptamer-hemin complex. Chem Biol. 1998;5:505-17
26. Shi H, Li D, Xu F, He X, Wang K, Ye X. et al. A label-free activatable aptamer probe for colorimetric detection of cancer cells based on binding-triggered in situ catalysis of split DNAzyme. Analyst. 2014;139:4181-4
27. Wu H, Zhang K, Liu Y, Wang H, Wu J, Zhu F. et al. Binding-induced and label-free colorimetric method for protein detection based on autonomous assembly of hemin/G-quadruplex DNAzyme amplification strategy. Biosens Bioelectron. 2015;64:572-8
28. Zhang H, Li F, Dever B, Wang C, Li XF, Le XC. Assembling DNA through affinity binding to achieve ultrasensitive protein detection. Angew Chem Int Ed Engl. 2013;52:10698-705
29. Zhong R, Tang Q, Wang S, Zhang H, Zhang F, Xiao M. et al. Self-assembly of enzyme-like nanofibrous G-molecular hydrogel for printed flexible electrochemical sensors. Adv Mater. 2018;30:e1706887
30. Zhong R, Xiao M, Zhu C, Shen X, Tang Q, Zhang W. et al. Logic catalytic interconversion of G-molecular hydrogel. ACS Appl Mater Interfaces. 2018;10:4512-8
31. Qu X, Wang S, Ge Z, Wang J, Yao G, Li J. et al. Programming cell adhesion for on-chip sequential boolean logic functions. J Am Chem Soc. 2017;139:10176-9
32. Li J, Yuan T, Yang T, Xu L, Zhang L, Huang L. et al. DNA-grafted hemin with preferable catalytic properties than G-quadruplex/hemin for fluorescent miRNA biosensing. Sens Actuators B Chem. 2018;271:239-46
33. Niazov T PV, Xiao Y, Gill R, Willner I. DNAzyme-functionalized Au nanoparticles for the amplified detection of DNA or telomerase activity. Nano Lett. 2004;4:1683-7
34. Li W, Liu Z, Lin H, Nie Z, Chen J, Xu X. et al. Label-free colorimetric assay for methyltransferase activity based on a novel methylation-responsive DNAzyme strategy. Anal Chem. 2010;82:1935-41
35. Jandial DD, Krill LS, Chen L, Wu C, Ke Y, Xie J. et al. Induction of G2M arrest by Flavokawain A, a kava chalcone, increases the responsiveness of HER2-overexpressing breast cancer cells to Herceptin. Molecules. 2017;22:462
36. Owens MA, Horten BC, Da Silva MM. HER2 amplification ratios by fluorescence in situ hybridization and correlation with immunohistochemistry in a cohort of 6556 breast cancer tissues. Clin Breast Cancer. 2004;5:63-9
37. Rusnak DW, Alligood KJ, Mullin RJ, Spehar GM, Arenas-Elliott C, Martin AM. et al. Assessment of epidermal growth factor receptor (EGFR, ErbB1) and HER2 (ErbB2) protein expression levels and response to lapatinib (Tykerb, GW572016) in an expanded panel of human normal and tumour cell lines. Cell Prolif. 2007;40:580-94
38. Shi Y, Huang W, Tan Y, Jin X, Dua R, Penuel E. et al. A novel proximity assay for the detection of proteins and protein complexes: quantitation of HER1 and HER2 total protein expression and homodimerization in formalin-fixed, paraffin-embedded cell lines and breast cancer tissue. Diagn Mol Pathol. 2009;18:11-21
39. Tang W, Wang H, Wang D, Zhao Y, Li N, Liu F. DNA tetraplexes-based toehold activation for controllable DNA strand displacement reactions. J Am Chem Soc. 2013;135:13628-31
40. Tian L, Heyduk T. Antigen peptide-based immunosensors for rapid detection of antibodies and antigens. Anal Chem. 2009;81:5218-25
41. Zinchuk V, Grossenbacher-Zinchuk O. Recent advances in quantitative colocalization analysis: focus on neuroscience. Prog Histochem Cytochem. 2009;44:125-72
42. Garner AP, Bialucha CU, Sprague ER, Garrett JT, Sheng Q, Li S. et al. An antibody that locks HER3 in the inactive conformation inhibits tumor growth driven by HER2 or neuregulin. Cancer Res. 2013;73:6024-35
43. Okita R, Mougiakakos D, Ando T, Mao Y, Sarhan D, Wennerberg E. et al. HER2/HER3 signaling regulates NK cell-mediated cytotoxicity via MHC class I chain-related molecule A and B expression in human breast cancer cell lines. J Immunol. 2012;188:2136-45
44. Chen ChB, Chernis GA, Hoang VQ, Landgraf R. Inhibition of heregulin signaling by an aptamer that preferentially binds to the oligomeric form of human epidermal growth factor receptor-3. Proc Natl Acad Sci USA. 2003;100:9226-31
45. Yarden Y, Sliwkowski MX. Untangling the ErbB signalling network. Nat Rev Mol Cell Biol. 2001;2:127-37
46. Spears M, Taylor KJ, Munro AF, Cunningham CA, Mallon EA, Twelves CJ. et al. In situ detection of HER2:HER2 and HER2:HER3 protein-protein interactions demonstrates prognostic significance in early breast cancer. Breast Cancer Res Treat. 2012;132:463-70
Author contact
![]() Corresponding authors: Prof. Fangzhou Song, E-mail: fzsongcqcom and Prof. Wei Cheng, E-mail: chengweicqmu.edu.cn.
Corresponding authors: Prof. Fangzhou Song, E-mail: fzsongcqcom and Prof. Wei Cheng, E-mail: chengweicqmu.edu.cn.