Impact Factor
- Issue 13; 2026
- Issue 12; 2026
- Issue 11; 2026
- Issue 10; 2026
- Issue 9; 2026
- Volume 16; 2026
- Advance Articles
- Past Issues
- Cover Images
- Cover Suggestion
- Index & Coverage
- Special Issues
Introduction
Methods
Results
Discussion
Abbreviations
Supplementary Material
Acknowledgements
References
International Journal of Biological Sciences
International Journal of Medical Sciences
 Global reach, higher impact

Theranostics 2019; 9(7):2100-2114. doi:10.7150/thno.29538 This issue Cite
Research Paper
Gastric cancer cells escape metabolic stress via the DLC3/MACC1 axis
Li Lin1*, Yantan Liu1*, Changqie Pan1, Junhao Zhang1, Yang Zhao1, Ruoyang Shao1, Zhenhua Huang1, Yuqi Su1, Min Shi1, Jianping Bin2, Yulin Liao2, Nailin Li3, Chunlin Wang1 ![]() , Wangjun Liao1
, Wangjun Liao1 ![]()
1. Department of Oncology, Nanfang Hospital, Southern Medical University, Guangzhou, China;
2. Department of Cardiology, Nanfang Hospital, Southern Medical University, Guangzhou, China.
3. Karolinska Institute, Department of Medicine-Solna, Clinical Pharmacology Group, Karolinska University Hospital-Solna, Stockholm, Sweden.
*These authors contributed equally to the study.
Received 2018-8-28; Accepted 2019-2-21; Published 2019-4-6
Abstract

Metabolic stress usually occurs in rapidly growing gastric cancer (GC) when the energy demand exceeds the supply. Interestingly, cancer cells can somehow escape this stress. Some small Rho GTPases regulating cell migration can be activated by metabolic stress. DLC3 is a RhoA-specific GTPase-activating protein of unclear function in cancer. We hypothesized that it participated in metabolic stress escape.
Methods: Metabolic stress in GC cells was induced by glucose deprivation, and DLC3 expression was detected. Based on the prognostic value, cell viability, motility and glycolysis were detected in DLC3 differently expressed GC cells in vitro and in vivo. DLC3 downstream targets were screened and verified. Chemotactic ability was evaluated to study DLC3 and its downstream signaling on metabolic stress escape. In addition, therapeutic strategies targeting DLC3 were explored.
Results: DLC3 expression was lowered by metabolic stress in GC cells. DLC3 downregulation indicated poor cancer prognosis, and silencing DLC3 promoted GC cell proliferation and invasion. MACC1, an oncogene promoting GC growth and metastasis, was proved to be the downstream target of DLC3. Low DLC3 expression and high MACC1 expression indicated high recurrence rate after GC resection. DLC3 transcriptionally inhibited MACC1 expression via RhoA/JNK/AP-1 signaling, and subsequently suppressed GC cell glycolysis and survival under metabolic stress. The DLC3/MACC1 axis modulated the chemotaxis of GC cells from energy deficient area to glucose abundant area. Finally, lovastatin was found to be a promising therapeutic drug targeting the DLC3/MACC1 axis.
Conclusions: The DLC3/MACC1 axis modulates GC glycolysis and chemotaxis to escape glucose deprivation. Lovastatin may inhibit GC by targeting the DLC3/MACC1 axis.
Keywords: DLC3, MACC1, metastasis, chemotaxis, lovastatin
Introduction
Although malignant tumor cells are characterized by high proliferation and metastasis, it remains uncertain how they leave the primary growing mass to reach secondary sites. In gastric cancer (GC), it was reported that metabolic stress usually occurs in rapidly proliferating cells when the energy demand exceeds the energy supply [1]. Interestingly, in an earlier study, we discovered that the expression of the pro-metastatic oncogene MET transcriptional regulator (MACC1) is upregulated under metabolic stress in GC [2], suggesting that cancer cells can somehow sustain the stress and even escape it. Hence, we hypothesize that some signaling networks involving MACC1 might be responsible for metabolic stress escape. However, the detailed mechanisms remain unclear.
It is known that the balance between guanine nucleotide exchange factors (GEF) and the GTPase-activating proteins (GAP) controls signaling that regulates cytoskeletal changes, which is necessary for cell migration. DLC proteins are a family of GAP paralogs. Therein, DLC3 (also named STARD8) expression has been reported to frequently be low in various types of cancer, including GC [3, 4], which consequently leads to RhoA activation [5-8]. Currently, it is known that DLC3 downregulation promotes proliferation and destabilizes adherens junctions [3, 5, 6, 9], DLC3 low expression is associated with unfavorable clinical features in GC [4]. However, the clinical prognostic value of DLC3, and its other functions and downstream signaling targets remain poorly characterized. Some small Rho GTPases (e.g., RhoA) have been reported to regulate cancer cell scaffold formation and motility [10], implying that DLC3 might be involved in cancer metastasis. Meanwhile, in cardiomyocytes, RhoA has been verified to be activated by metabolic stress and to impart a protective effect during recuperation [11], giving the possibility that its upstream signal molecule DLC3 might also participate in metabolic regulation. Moreover, it was reported that RhoA signaling stimulates c-JUN [12], which is known as a member of the activator protein 1 (AP-1) transcription factor complex that targets the promoter of MACC1 [13, 14]. These facts led us to speculate that DLC3-related signaling might be involved in cancer metastasis, which may link metabolic stress and MACC1.
Therefore, in this study, we mainly focused on the function of DLC3, and hypothesized that DLC3 might be involved in metabolic stress-triggered GC metastasis via MACC1. Furthermore, we attempted to explore a therapeutic strategy based on DLC3-related signaling.
Methods
Cell culture
Unless otherwise indicated, cancer cells were cultured in complete RPMI 1640 medium with 2 g/L glucose and 10% fetal bovine serum at 37°C under 5% CO2. To apply metabolic stress, cells were cultured in glucose-free RPMI 1640 medium. To block RhoA, ROCK or JNK, cells were respectively cultured with CCG1423 (300 nM), Y27632 (10 μM) or SP600125 (5 μM) (Selleck Chemicals, Houston, TX, US) for 24 hours. Lovastatin (Selleck) was added into medium as indicated. MKN45 cells were from Japanese Collection of Research Bioresources Cell Bank, and BGC823 cells were from the KeyGene Biotech (Nanjing, China).
Patients and tissue specimens
The clinical study was approved by the Nanfang Hospital Ethics Review Board. The patients were histologically diagnosed as GC at Nanfang Hospital, Southern Medical University (Guangzhou, China). For Quantitative Real-Time PCR (qRT-PCR), 12 pairs of fresh GC tissue and non-cancerous tissue analysis were obtained from patients who received surgery in February, 2015. For immunohistochemistry (IHC) staining, GC tissues were from 90 cases who received curative operation. Among them, 19 patients were Stage I, 37 were Stage II, and 34 were Stage III.
Mouse models
In vivo experiments using mouse models were approved by the Institutional Animal Care and Usage Committee of Nanfang Hospital and followed the ARRIVE and the institution's guidelines. Mice were raised under specific pathogen-free conditions in our center, and models were created using 4-week-old male BALB/c athymic mice. To evaluate tumor growth in vivo, cancer cells (~1×10⁷) were implanted subcutaneously. Tumor nodule volumes were monitored every other day according to the formula: Volume=width×length×(width+length)/2. Mice were sacrificed at Day 34, and xenografts were confirmed by DLC3 and Ki-67 IHC staining. To evaluate tumor metastasis, we used both intravenous injection model and intrasplenic transplantation model. For intravenous injection model, cancer cells (~5×10⁶) were injected via caudal vein to create lung metastasis. Mice were sacrificed at Day 45, and metastatic nodules were verified by H&E staining. For intrasplenic transplantation model, cancer cells (~6×10⁶) were injected into mouse spleen via laparotomy. Lovastatin treatment stated at the day after intrasplenic injection. Lovastatin of 100 mg/kg body weight was given to mouse via gavage every day. Mice were sacrificed at Day 35.
Cellular 18F-fludeoxyglucose uptake and mouse microPET imaging
Gastric cancer cells were seeded on 24-well plate (2×10⁵/well) for 24 hours. Then culture medium was replaced, and cells were incubated in fresh medium containing 18F-fludeoxyglucose (18F-FDG) (about 1 μCi/well) for 1 hour. Image was obtained by microPET Inveon scanner (Siemens, Knoxville, TN) as previously described [2]. The intrasplenic transplantation mouse models were fasted overnight and anesthetized with isoflurane inhalation. 18F-FDG of about 150 μCi per mouse was injected via the caudal vein. After 40 minutes for nonspecific clearance, the mouse was scanned in microPET/CT Inveon scanner (Siemens) and analyzed by Inveon Research Workplace 4.1 (Siemens).
Statistical analysis
Data were analyzed using the SPSS19 software. The results were presented as mean ± SEM. For means comparison, experiments were repeated at least three times, and the significance of difference was analyzed using one-way ANOVA or Student's T-test. Correlations between two continuous variables were examined by Pearson's Test, while those of categorical variables were examined by the nonparametric Spearman rank test. Survival rates were analyzed according to the Kaplan-Meier method and examined by the log-rank test. Two-sided p<0.05 were considered statically significant.
Results
Metabolic stress decreased DLC3 expression in GC cell lines
To apply metabolic stress on GC cells, glucose, the main energy source, was withdrawn from the culture medium. Upon glucose deprivation, we noticed that GC cell lines of MKN45, BGC823, AGS, MGC803 showed some morphological changes, i.e., besides swollen apoptotic cells induced by the stress, some cells became spindle-shaped and disseminated from the cluster (Figure 1A). Given that glucose deprivation contributes to stress fiber assembly and morphological changes in endothelial cells [15], we wanted to know whether this phenomenon occurred in GC cells. When glucose was withdrawn from GC cells, stress fiber assembly was enhanced, and the arrangement was realigned (Figure 1B). We confirmed that RhoA was significantly activated by metabolic stress (Figure 1C and Supplementary Figure S1A), in agreement with previous studies [11, 16], suggesting some GAP and GEF might be involved.
DLC3 downregulation could be induced by glucose deprivation. (A) Under glucose deprivation for 6 h, some of the GC cells turned spindle and scattered (white arrow) besides the swelling or shrinking apoptotic cells (black arrow). (B) As labeled by phalloidin, GC cell stress fiber was increased and rearranged upon glucose deprivation. (C) Glucose deprivation altered RhoA activity in MKN45 cells. (D) Time-coursed glucose deprivation on DLC1 and DLC3 expression in MKN45 cells. (E and F) In GC cells, glucose deprivation decreased DLC3 expression at both (E) mRNA and (F) protein levels, and enhanced c-Jun phosphorylation. *P<0.05, #P<0.01, +P<0.001.
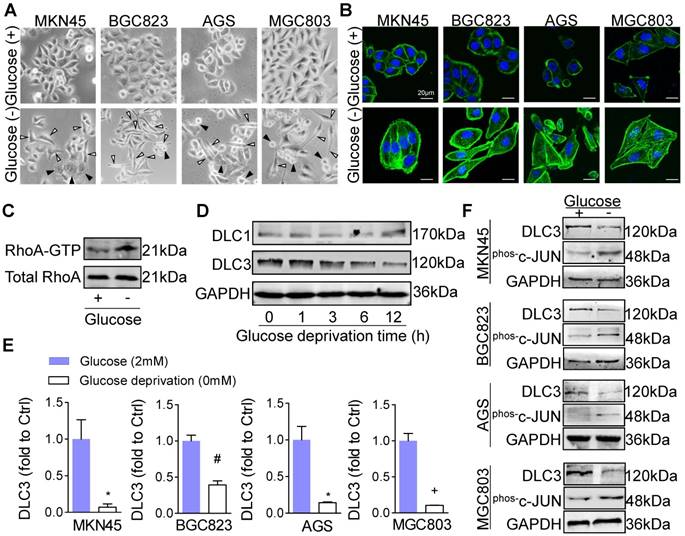
In in vivo microenvironment, metabolic stress usually results from low blood vessel density. Hence, by analyzing 375 cases of GC from the Cancer Genome Atlas (TCGA) data, we wanted to know whether CD31, a vascular endothelial marker, correlated with Rho GAP or GEF expressions. As results, though all three DLC family members positively correlated with CD31 expression (r2=0.4387, 0.1796 and 0.6203 for DLC1, 2 and 3, respectively), DLC3 was the most notably significant one. Whereas, for the GEFs (TRIO, ARHGEF1 and MCF2L), there were weak or even no statistical associations in correlation to CD31. Considering that the angiogenic factor Vascular endothelial growth factor A (VEGFA) was not correlated with DLC3, these results suggested that DLC3 might be an important GAP molecule sensitive to metabolic stress (Supplementary Figure S1B). As expected, by culturing MKN45 cells in glucose-free medium, DLC3 protein level gradually decreased in a time course-dependent manner, while glucose deprivation showed much less influence on DLC1 (Figure 1D). Similar to MKN45 cells, the mRNA (Figure 1E) and protein (Figure 1F) levels of DLC3 were also significantly suppressed by glucose deprivation in BGC823, AGS and MGC803 cells. Moreover, phosphorylated c-JUN levels were significantly increased in these cells (Figure 1F), suggesting mRNA transcription by AP-1 might be enhanced by metabolic stress.
DLC3 downregulation indicated poor prognosis in GC and other cancers
To confirm DLC3 expression levels in GC tissue, we analyzed the GSE2685 dataset, which included primary human advanced GC and noncancerous gastric tissues (Figure 2A). We also analyzed DLC3 mRNA expression using 12 pairs of fresh GC and noncancerous tissues (Figure 2B). In both bioinformatic analysis and qRT-PCR results, DLC3 expression was significantly lower in GC tissues than in noncancerous ones.
DLC3 downregulation was associated with adverse cancer prognosis. (A) Confirmed by bioinformatic analysis of GSE2685 dataset and (B) 12 pairs of fresh tissue samples in our center using qRT-PCR, DLC3 was down regulated in human GC compared with noncancerous tissues. (C to E) Using online Kaplan-Meier plotter for bioinformatic analysis, DLC3 low expression indicated poor GC survival in (C) early (GSE51105) and (D and E) advanced stage patients (GSE14210). *P<0.05, #P<0.01, +P<0.001.
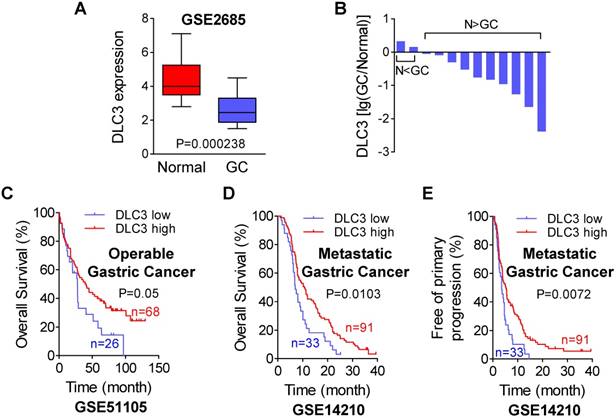
Currently, the prognostic value of DLC3 is unclear. Hence, we performed bioinformatic analyses using an online Kaplan-Meier plotter for GC survival (http://kmplot.com/) to explore the role of DLC3 in clinical outcomes. In GSE51105, a dataset of 94 cases of operable GC, low DLC3 expression demonstrated a shorter overall survival (Figure 2C). In the GSE14210 dataset, which included 124 cases of metastatic GC treated with cisplatin and fluorouracil as the first-line chemotherapy, low DLC3 expression also showed significant poorer overall survival (Figure 2D) and earlier primary progression (Figure 2E). Besides GC, a similar trend was also observed in recurrence-free survival (RFS) and overall survival for postoperative breast cancer patients (GSE42568) and primary progression-free survival and overall survival for lung cancer patients (CaArray) (Supplementary Figure S1C and D). These data suggested that DLC3 might be a cancer suppressor gene, and its downregulation might bring about some adverse effects.
DLC3 inhibited GC cell proliferation and invasion
To explore the function of DLC3, we used models of DLC3-overexpressed by ectopic coding sequence (oeDLC3) and DLC3-knocked down by targeted shRNA (shDLC3) (Supplementary Figure S2A and B). Accordingly, RhoA activities were also confirmed to be suppressed by oeDLC3 and enhanced by shDLC3 (Supplementary Figure S2C). Unlike wild-type cells (Figure 1D), the expression of DLC3 was not significantly influenced by glucose deprivation in oeDLC3 cells (Supplementary Figure S2D), showing exogenous DLC3 was stable.
In MTT assays of MKN45 (Figure 3A) and BGC823 (Supplementary Figure S3A) cells, oeDLC3 significantly inhibited cell viability, while shDLC3 showed the opposite effect (Figure 3A). Consistently, in the EdU assay, cell proliferation was also negatively regulated by DLC3 (Figure 3B and Supplementary Figure S3B). Moreover, the regulatory effect on proliferation was also certified by the colony formation assay, where the colony number was significantly decreased by oeDLC3 but was increased by shDLC3 in both MKN45 and BGC823 cell lines (Figure 3C and Supplementary Figure S3C).
DLC3 inhibited GC cell proliferation and invasion. (A) To study the effect of DLC3 on cell viability, MTT assay was performed using oeDLC3 or shDLC3 MKN45 cells after 24 hours. (B) The EdU assay was employed to detect the effect of DLC3 on DNA replication. (C) In the colony formation assay, colony numbers were significantly influenced by DLC3 differential expression. (D) DLC3 induced morphological changes in MKN45 cells. (E and F) DLC3 significantly influenced cell (E) migration by scratch healing assay and (F) invasion by the Boyden chamber transwell assay. *P<0.05, +P<0.001.
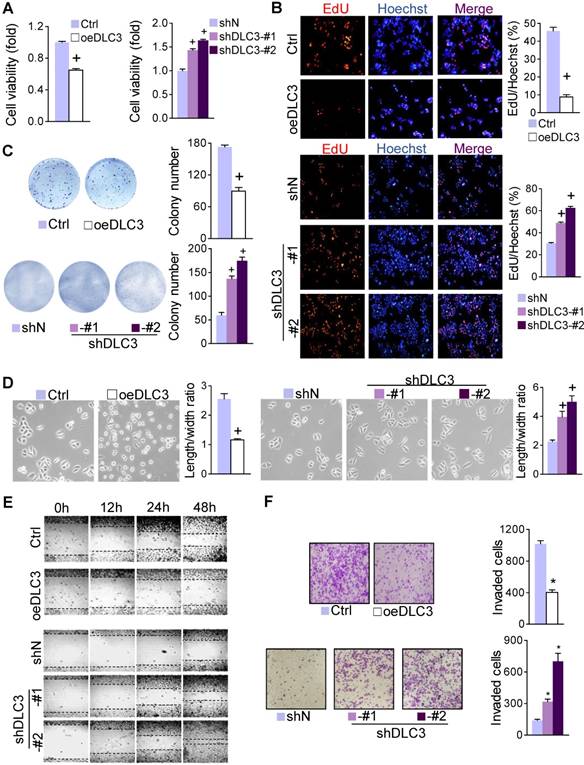
Interestingly, we noticed that the morphology of GC cells was influenced by DLC3. By overexpressing DLC3, MKN45 cells lost their original polarity and became small spheroids. In contrast, shDLC3 turned cells to mesenchymal-like spindle-shaped cells (Figure 3D), which were similar to the live cells under metabolic stress (Figure 1A). This suggested that DLC3 is a cytoskeletal regulator and may also participate in regulating cell migration. As expected, oeDLC3 significantly delayed scratch wound healing, while shDLC3 accelerated it (Figure 3E and Supplementary Figure S3D). Likewise, the Boyden chamber transwell assay showed that cell invasiveness was impaired by oeDLC3 but was enhanced by shDLC3 (Figure 3F and Supplementary Figure S3E).
DLC3 suppressed GC growth and metastasis in vivo
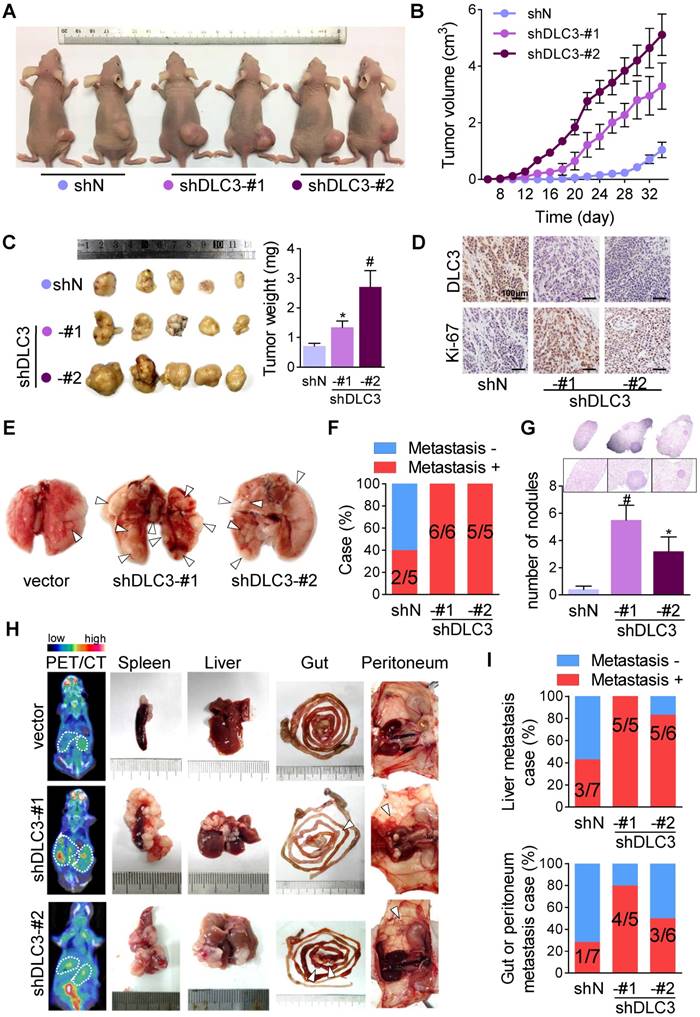
Since the cellular functional experiments suggested that DLC3 downregulation might promote GC malignant activity, we then verified this using athymic mouse models. To evaluate tumor growth, MKN45 cells were implanted on the right flank subcutaneously (Figure 4A). shDLC3 significantly accelerated tumor growth rate (Figure 4B) and led to a larger tumor volume and heavier tumor weight (Figure 4C). As confirmed by IHC staining, shDLC3 xenografts presented with a higher number of Ki-67-positive cells (Figure 4D). To verify the role of DLC3 in GC colonization at distant sites, MKN45 cells were injected via the caudal vein to induce lung metastasis (Figure 4E). As presented by distant colony formation rates (Figure 4F) and nodule numbers (Figure 4G), shDLC3 greatly facilitated lung nodule formation. Moreover, the effect on metastasis was further confirmed by intrasplenic transplantation of MKN45 cells (Figure 4H and I). shDLC3 not only significantly accelerated tumor growth in the spleen (Figure 4H) but also increased metastasis to the liver, gut, and peritoneum (Figure 4H and I). Interestingly, we also found that tumors of shDLC3 groups exhibited higher uptake rate of 18F-FDG, which is a glucose analog commonly used clinically for cancer metabolic assays (Figure 4H). This indicated that glycolysis might participate in DLC3-mediated regulation of growth and metastasis.
DLC3 suppressed GC growth and metastasis in athymic mouse. (A to D) MKN45 cell xenograft were transplanted subcutaneously. (A) Representative image of mouse at Day 34. (B) Tumor growth curve dotted by each other day. (C) Downregulating DLC3 significantly increased xenograft volume (left panel) and tumor weight (right panel). (D) DLC3 effect on cell proliferative ability was confirmed by Ki-67 staining on xenograft samples. (E to G) MKN45 cells were injected via caudal vein to induce lung metastasis. (E) Representative image of lung metastases (white arrow) at Day 45. Downregulating DLC3 increased (F) metastasis rate between groups and (G) lung colony numbers in each mouse. (H and I) MKN45 cells were transplanted intrasplenically. (H) At day 35, microPET/CT was canned and tumors were found on spleen, liver, gut and peritoneum. (I) Downregulating DLC3 increased metastasis from spleen to liver, gut and peritoneum. *P<0.05, #P<0.01.
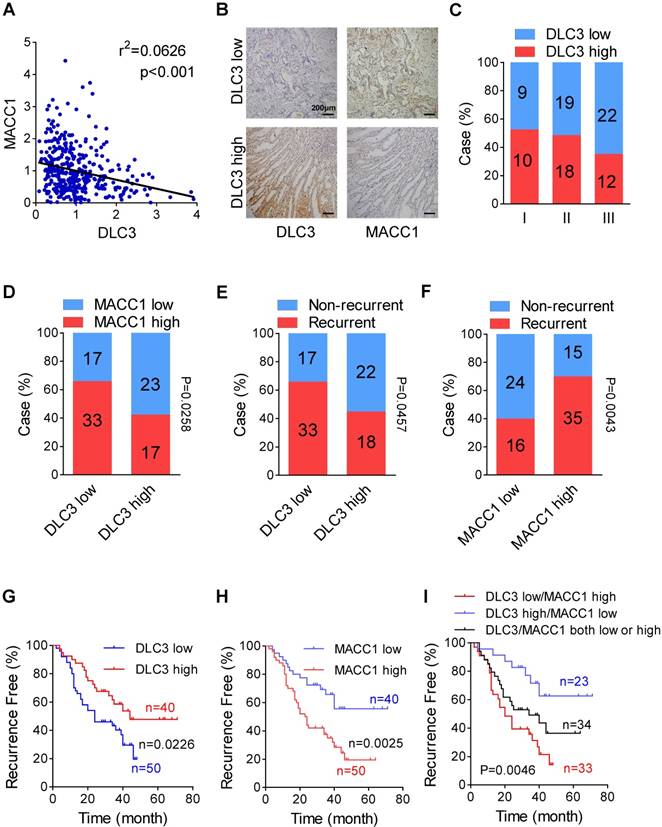
Low DLC3 expression and high MACC1 expression indicated high recurrence
The pro-metastatic oncogene MACC1, which can be upregulated by glucose deprivation, has been found to be essential for metabolic stress resistance [2]. Hence, we speculated whether there were any correlations between DLC3 and MACC1. By analyzing GC data from TCGA, the mRNA levels of DLC3 were found to be negatively correlated with those of MACC1 (Figure 5A). Then, we performed IHC staining of DLC3 and MACC1 on GC tissues from 90 patients who underwent curative surgery at our center (Figure 5B). Among stages I to III, low DLC3 expression was more frequently seen in patients with more advanced stage cancer (Figure 5C). In the low DLC3 expression group, the proportion of patients with high MACC1 expression was more than that in the high DLC3 expression group (Figure 5D), which showed well consistence to the TCGA data (Figure 5A). Postoperative recurrence was negatively associated with the DLC3 expression level (Figure 5E) but positively associated with MACC1 expression level (Figure 5F). In Kaplan-Meier analysis for RFS, low DLC3 expression and high MACC1 expression, respectively, showed shorter RFS. When considering DLC3 and MACC1 expressions together, patients of both high DLC3 expression (Figure 5G) and low MACC1 expression (Figure 5H) groups had the best prognosis, whereas those with low DLC3 expression and high MACC1 expression had the shortest RFS (Figure 5I). These data suggested that the downregulation of DLC3 and upregulation of MACC1 might function synergistically.
Low DLC3 expression and high MACC1 expression indicated high recurrence in GC patients after curative surgery. (A) Suggested by the negative correlation between DLC3 and MACC1 in TCGA data, (B to I) a retrospective study was performed including 90 GC patients after curative operation. (B) Representative IHC staining of DLC3 and MACC1 in GC samples. (C) In more advanced stage, more patients were of DLC3 low expression. (D) MACC1 expression was negatively correlated with DLC3 in protein level. Recurrence rate was high in (E) low DLC3 expression and (F) high MACC1 expression patients. In Kaplan-Meier analysis, (G) low DLC3 and (H) high MACC1 expressions indicated shorter recurrence-free time, (I) and integrating both further stratified the patients.
DLC3 transcriptionally inhibited MACC1 expression via RhoA/JNK/AP-1 signaling
To ascertain the regulatory relationship between DLC3 and MACC1, we detected mRNA and protein expressions in MKN45 cells. Silencing DLC3 significantly upregulated MACC1 mRNA (Figure 6A) and protein expressions (Figure 6B). Whereas, overexpressing MACC1 had no effect on DLC3 (Supplementary Figure S4A). We next overexpressed DLC3 under glucose deprivation. As demonstrated by immunofluorescence (Figure 6C), Western blots (Supplementary Figure S4B) and qRT-PCR (Supplementary Figure S4C), MACC1 expression was upregulated by glucose deprivation but was significantly suppressed by oeDLC3. Although MACC1 protein expression in oeDLC3 cells under glucose deprivation seemed a little higher than that with glucose (Figure 6C and Supplementary Figure S4B), its mRNA alterations upon glucose deprivation in oeDLC3 cells was not elevated (Supplementary Figure S4C), suggesting some post-transcriptional bypasses might exist [17]. Even so, DLC3 was still shown as an essential regulator. To further validate the transcriptional inhibitory effect of DLC3 on MACC1, we cloned a MACC1 promoter-luciferase construct. As a result, the promoter activity of MACC1 was greatly increased by shDLC3 and suppressed by oeDLC3 (Figure 6D).
DLC3 inhibited MACC1 transcription via RhoA/JNK/AP-1 signaling. Downregulating DLC3 expression significantly increased the (A) mRNA and (B) protein expressions of MACC1. (C) Overexpressing DLC3 whittled the glucose deprivation-enhanced MACC1 expression. The results were confirmed by Western blot in Supplementary Figure S4B. (D) DLC3 expression status influenced MACC1 promoter activation, while it had no effect on the promoter with AP-1 binding site mutation. (E) Inhibiting RhoA, ROCK and JNK by chemicals (CCG1423, Y27632 and SP600125) suppressed MACC1 mRNA expression, respectively. (F) ShDLC3 increased the protein expression of MACC1, which could be mitigated by RhoA, ROCK and JNK inhibitors respectively. RhoA, ROCK or JNK inhibitors suppressed shDLC3-promoted MKN45 (G) colony formation and (H) invasion, and the quantified results were shown in Supplementary Figure S4F and G. *P<0.05, #P<0.01, +P<0.001.
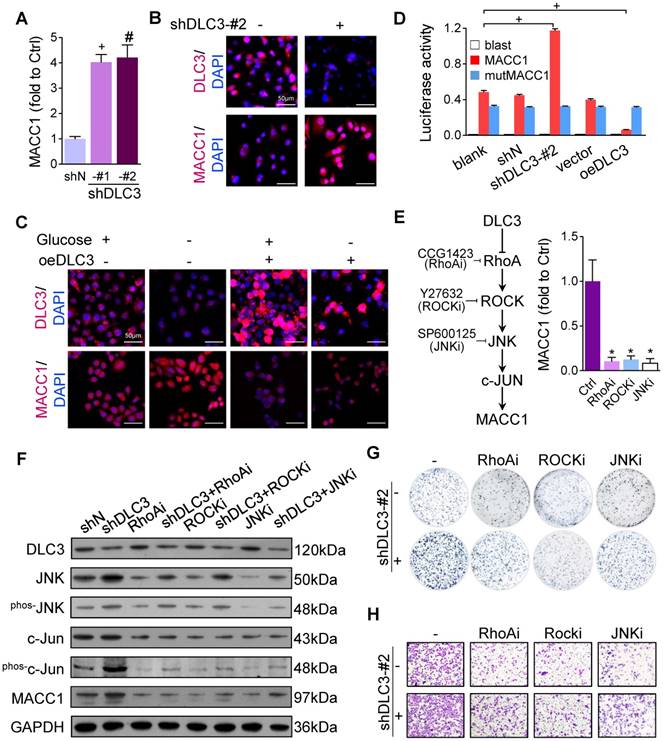
These data suggested that the metabolic stress-induced DLC3 downregulation transcriptionally promoted MACC1 expression. However, as a GAP, how DLC3 enhances the transcription of MACC1 has not been clarified. Hence, we performed a human phospho-kinase array assay to determine the probable DLC3 downstream signaling targets. We found that multiple phosphokinases were enhanced by shDLC3 (Supplementary Figure S4D), among which JNK was reported to be activated by RhoA/ROCK and to stimulate c-JUN phosphorylation [12]. Considering that c-JUN (the component of the AP-1 transcription factor complex) could bind to the MACC1 promoter [13, 14] and that phosphorylated c-JUN was upregulated by metabolic stress (Figure 1F), we supposed that DLC3 suppressed MACC1 transcription via RhoA/JNK/AP-1 signaling (Figure 6E). We then introduced an AP-1-binding site-mutated MACC1 promoter fragment-luciferase construct and found that shDLC3- and oeDLC3-induced MACC1 promoter activity alterations were significantly suppressed (Figure 6D). To validate RhoA/JNK/AP-1 signaling in MACC1 regulation, we performed qPCR by adding the inhibitors of RhoA (CCG1423), ROCK (Y27632), or JNK (SP600125) to MKN45 cells, which significantly decreased MACC1 mRNA levels (Figure 6E). Furthermore, we performed Western blotting by blocking RhoA, ROCK, or JNK under the DLC3 silencing condition. As anticipated, shDLC3 induced MACC1 upregulation (Figure 6F and Supplementary Figure S4E). Meanwhile, the expression levels of JNK, phosphorylated JNK, and phosphorylated c-JUN were also increased by shDLC3. These changes were suppressed by adding inhibitors targeting RhoA, ROCK, or JNK (Figure 6F). Consequently, shDLC3-promoted MKN45 colony formation (Figure 6G and Supplementary Figure S4F) and cell invasion (Figure 6H and Supplementary Figure S4G) were also markedly inhibited by blocking RhoA, ROCK, or JNK signaling.
The DLC3/MACC1 axis modulated GC cell viability by metabolic remodeling
In an earlier study, we reported that MACC1 promotes the Warburg effect and thus supports GC cell proliferation [2]. Hence, we wondered whether the DLC3-induced suppressive effect on proliferation could be reversed by MACC1. As anticipated, in the EdU assay, oeDLC3-depressed MKN45 cell proliferation was conversely enhanced by oeMACC1 (Figure 7A). On the contrary, transiently silencing MACC1 (siMACC1) significantly reduced the proliferative shDLC3 cells (Supplementary Figure S5A). Then, we assayed the influence of the DLC3/MACC1 axis on the 18F-FDG uptake activity in vitro. OeDLC3 significantly inhibited 18F-FDG consumption, while oeMACC1 replenished the 18F-FDG uptake (Figure 7B). Whereas, silencing DLC3 and MACC1 exerted opposite effect (Supplementary Figure S5B). Likewise, the effect of the DLC3/MACC1 axis on glucose uptake was also proved to achieve similar results (Figure 7C and Supplementary Figure S5C). As a consequence of glycolysis inhibition, oeDLC3 suppressed acidosis in the conditioned medium, whereas the same amount of oeMACC1 cells produced more acids. This was markedly reflected by the changes in the color of phenol red in the conditioned medium (Figure 7D). The experiments using shDLC3 and siMACC1 cells showed an opposite effect (Supplementary Figure S5D). The results verified that the DLC3/MACC1 axis participated in the regulation of the Warburg effect.
The DLC3/MACC1 axis modulated glycolysis remodeling and chemotaxis under metabolic stress. (A) Indicated by EdU staining, overexpressing MACC1 significantly reversed DLC3 suppression on DNA-replication in MKN45 cells. (B and C) The DLC3/MACC1 axis regulated cellular (B) 18F-FDG and (C) glucose uptake in culturing plates. (D) The DLC3/MACC1 axis influenced acidosis in the conditioned medium. (E) Upregulating MACC1 repressed DLC3-induced ROS generation. (F) Under glucose deprivation, overexpressing MACC1 inhibited DLC3-induced apoptosis. The DLC3/MACC1 axis modulation on MKN45 cell motility was confirmed by (G) scratch healing migration assay and (H) transwell invasion assays. (I) The DLC3/MACC1 axis participated in glucose chemotaxis under metabolic stress. *P<0.05, #P<0.01, +P<0.001.
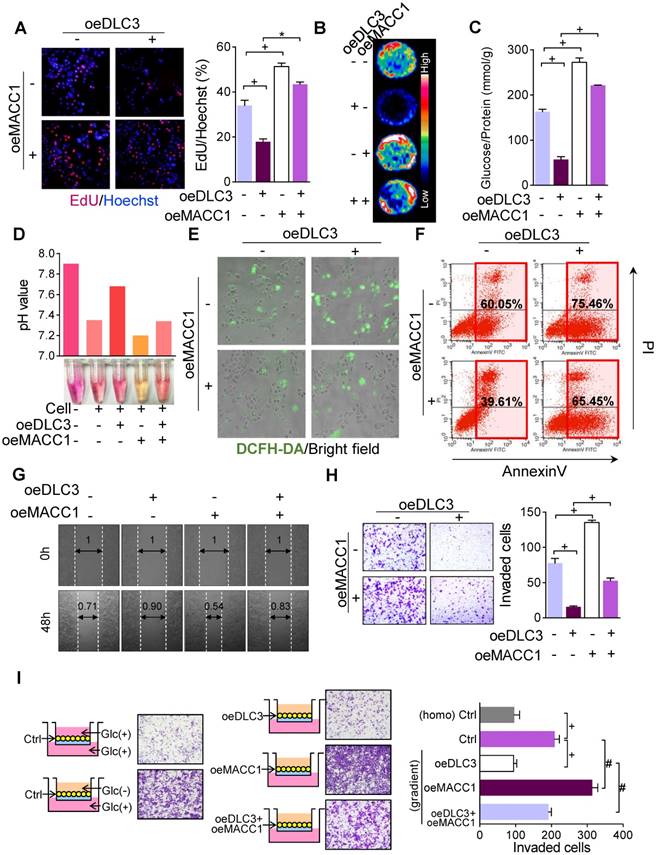
Glucose deprivation can increase oxidative stress. We have previously shown that the Warburg effect inhibits ROS generation and helps GC cells overcome metabolic stress, while inhibiting endogenous MACC1 increased ROS generation, mitochondrial damage and cell apoptosis under metabolic stress [2]. In this study, we confirmed that glucose deprivation-promoted ROS generation was further increased by siMACC1 (Supplementary Figure S5E). Then we found that oeDLC3 and glucose deprivation significantly led to ROS generation, and oeMACC1 suppressed such effects (Figure 7E). As a result, oeDLC3 cells were more vulnerable to glucose deprivation-induced apoptosis, while oeMACC1 protected GC cells from apoptosis and reduced the damage from oeDLC3 (Figure 7F).
The DLC3/MACC1 axis helped GC cells escape metabolic stress
Given that oxidative stress suppression helps cancer cell metastasis [18], we supposed that GC cell metastasis might be influenced by the DLC3/MACC1 axis. To verify this, in vitro migration experiments were carried out. In the scratch wound assay, the oeDLC3-mediated slow healing rate was accelerated again by oeMACC1 (Figure 7G), while siMACC1 slowed down shDLC3-enhanced migratory effect (Supplementary Figure S6A). In the transwell assay, the oeDLC3-inhibited GC cell invasion was reversed by oeMACC1 (Figure 7H). On the contrary, shDLC3 promoted invasiveness was greatly inhibited by siMACC1 (Supplementary Figure S6B). At the molecular level, the DLC3/MACC1 axis was proved to regulate the epithelial-to-mesenchymal transition for the DLC3-induced epithelial phenotype was reversed by MACC1 to mesenchymal type (Supplementary Figure S4A and S6C). These findings implied that DLC3 restrained GC metastasis by downregulating MACC1. Since glucose-deprivation-induced cytoskeleton changes could be reversed by siMACC1 (Supplementary Figure S6D), we next ascertained whether the DLC3/MACC1 axis influenced the nutritional chemotaxis of GC cells under metabolic stress. We performed a transwell assay with different median glucose concentrations in the chambers to imitate a concentration gradient in the Matrigel (Figure 7I). Compared to the homogenous glucose gel, the gradient gel significantly promoted GC cell invasion towards the high glucose side (Figure 7I), while silencing MACC1 inhibited glucose chemotaxis (Supplementary Figure S6E). This glucose-potentiated chemotaxis was greatly inhibited by oeDLC3 but was re-enhanced by oeMACC1 (Figure 7I).
Lovastatin influenced DLC3 and MACC1 expressions and inhibited GC malignant activities
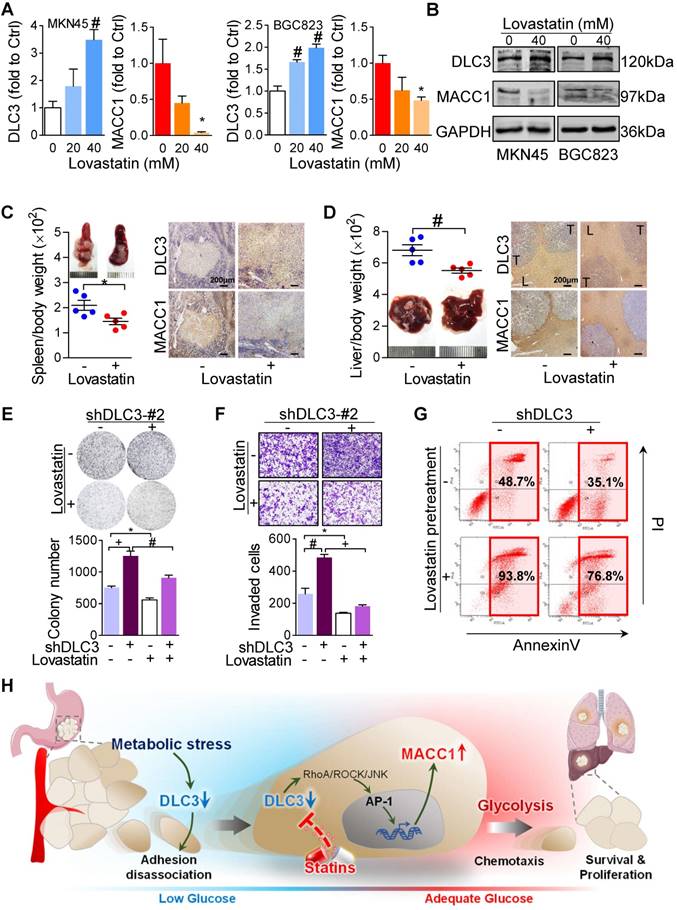
Statins, a class of hydroxymethylglutaryl coenzyme A reductase inhibitors, were found to reduce the risk and mortality of gastrointestinal cancers [19-23]; however, the underlying mechanism has not been fully elucidated. Recently, it was mentioned that statins could suppress RhoA activation [24] and inhibit the binding of AP-1 to the MACC1 promoter [14]. This prompted us to analyze the effect of statins on DLC3 function. By stimulating MKN45 cells for 48 h, lovastatin not only decreased MACC1 expression but also enhanced the expression of its upstream suppressor DLC3 in a concentration-dependent manner. A similar trend was also observed in BGC823 cells (Figure 8A). In addition, the protein levels of DLC3 and MACC1 were also altered by lovastatin (Figure 8B). Benefited from lovastatin treatment, intrasplenic transplanted MKN45 tumor growth was inhibited (Figure 8C) and liver metastasis was suppressed (Figure 8D). Confirmed by IHC staining, DLC3 expression was increased and MACC1 expression was lowered in both splenic tumor xenograft (Figure 8C) and liver metastasis (Figure 8D). These results suggested that lovastatin might serve as a therapeutic agent in GC by modulating the DLC3/MACC1 axis. As anticipated, cellular functions of colony formation (Figure 8E) were proved to be repressed by lovastatin, which were blunted by DLC3 silencing. Moreover, the glucose-potentiated chemotaxis inhibited by lovastatin was also reversed by shDLC3 (Figure 8F). After pretreated with lovastatin for 48 h, MKN45 cells without shDLC3 showed the highest apoptosis rate when subjected to glucose deprivation (Figure 8G). These findings together suggested that lovastatin might inhibit GC cell functions by modulating the DLC3/MACC1 axis.
Lovastatin influenced DLC3 and MACC1 expressions and inhibited GC malignant activities. (A and B) Lovastatin upregulated DLC3 and downregulated MACC1 (A) mRNA and (B) protein expressions in both MKN45 and (B) BGC823 cells. Lovastatin suppressed (C) splenic tumor xenograft growth and (D) liver metastasis by regulating DLC3 and MACC1 expression in vivo. L, Liver; T, Tumor. (E to G) Lovastatin inhibited GC cell (E) colony formation, (F) glucose chemotaxis invasion, and (G) metabolic stress resistance by targeting DLC3. (H) Schematic map summarizing current study. Metabolic stress decreases GC cell DLC3 expression in rapid proliferating GC cells. DLC3 downregulation dissociates GC cell from the primary site and activates RhoA/JNK/AP-1 signaling to increase MACC1 expression transcriptionally. As a result, glycolysis is enhanced and drives GC cells to seek for more nutrition. These also help GC survive from metabolic stress and proliferate at the second site. Finally, to the potential practical value, DLC3/MACC1 axis may be a target of lovastatin in GC. *P<0.05, #P<0.01, +P<0.001.
Discussion
In this study, we revealed the prognostic value and biological functions of the DLC3/MACC1 axis in GC, which explained why and how proliferating cancer cells acquire a metastatic tendency towards nutritional factors. Rapid proliferation usually gives rise to glucose deficiency in the microenvironment, which induces metabolic stress [1]. We proved that DLC3 was downregulated by metabolic stress in GC cells. As a supplement to previous reports that silencing DLC3 disintegrated adherens junctions [5, 6], we found that DLC3 downregulation transcriptionally promoted MACC1 expression via RhoA/JNK/AP-1 signaling in this study. These alterations triggered metabolic remodeling and facilitated GC cells to leave from nutrient-deficient sites to nutrient-rich sites to seek energy, which also helped GC cell survival under metabolic stress and proliferation at the secondary sites. Finally, we suggested that lovastatin might be a potential drug inhibiting the malignant effects by targeting the DLC3/MACC1 axis (Figure 8H).
Unlike most of the normal somatic cells, cancer cells predominantly metabolize by glycolysis (i.e., the Warburg effect), even under aerobic conditions. Although the Warburg effect contributes to hypoxic adaptation, this inefficient metabolic mode consumes much more glucose than oxidative phosphorylation does to produce an equal amount of ATP [25, 26]. In GC tissues, it was reported that the microenvironment contains extremely low levels of glucose but high levels of lactate and glycolytic intermediates [1]. Hence, this contradiction of supply and demand forces the starved GC cells to either leave from the primary site for energy or to adjust their metabolism [27]. In this study, we proved that DLC3 was downregulated by glucose deprivation. Moreover, DLC3 deficiency accelerated proliferation, which further aggravated metabolic stress. Given that low blood vessel density can lead to a metabolic stress state, these results also explain our finding in GC tissue why the blood vessel marker CD31 low expression accompanied with DLC3 low expression. Recently, low DLC3 was reported to be associated with adverse clinical features in GC [4], yet the function of DLC3 was rarely documented in detail. The most definite functions are that it is localized in focal adhesion and it stabilizes adherens junctions by suppressing RhoA activity [3, 5, 6]. The loss of DLC3 impairs adherens junctions and leads to the dissociation of cell aggregates [3, 5, 6]. Here, following disaggregation, we further demonstrated that the silencing of DLC3 further promoted cell migration and invasion, suggesting that the long-term effects by metabolic stress were impactful.
In a physical model, glucose gradient-stimulated chemotaxis has been proved to be necessary for cancer cell invasion [27]. This was also evidenced by an in vivo study which showed that inhibiting glucose uptake in distant organs increased the incidence of metastasis [28]. However, the biological mechanism was unknown. Here, we demonstrated that the metabolic stress-sensitive DLC3/MACC1 signaling regulated both metabolic and metastatic activities of GC cells: DLC3 suppressed the migration following the glucose gradient, while MACC1 reversed it. However, circulating cancer cells, which usually suffer from anoikis by oxidative stress, are inefficient to form distant metastases [18]. Nevertheless, it is interesting that metabolic stress, which brings about oxidative stress, conversely promotes metastasis [29]. In our in vivo study, lowering DLC3 expression significantly promoted distant tumor colony formation, suggesting that metabolic stress-induced DLC3 deficiency may somehow overcome oxidative challenge. Some key glycolysis enzymes (e.g., pyruvate dehydrogenase kinase) are upregulated in detached tumor spheroids [30, 31]. Although glucose metabolism is relatively suppressed upon detachment [30], artificially enhancing the Warburg effect diminishes ROS production and oxidation stress [31]. This suggests that glycolysis is a protective metabolic route against anoikis [32]. In this study, the DLC3/MACC1 axis reconciled the opposing effects of metabolic and oxidative stresses on metastasis by glycolysis regulation. Hence, besides metastasis inhibition, the current study showed another novel therapeutic potential of DLC3 in suppressing glycolysis via MACC1 inhibition, which further intensified the oxidative stress and apoptosis of GC cells.
MACC1, as the name implies, was first identified as a pro-metastatic transcriptional factor [33]. Whereafter, more malignant functions of MACC1 have been discovered, including proliferation [34], angiogenesis [30], chemoresistance [35], and metabolic remodeling [2], suggesting its potential as a therapeutic target. Previously, we discovered that MACC1 mRNA was stabilized by its associated lncRNA MACC1-AS1 via AMPK/Lin28 under metabolic stress [17]. Different from post-transcriptional regulation, here we proved that DLC3 suppressed MACC1 transcription and functions via RhoA/JNK/AP-1 signaling. Given that RhoA has oncogenic effects in many tumors [36, 37], enhancing DLC3 expression might be a promising therapeutic approach targeting both RhoA and MACC1 upstream. It was recently found that statins, besides lowering cholesterol, downregulate MACC1 expression in colon cancer cells by targeting the binding of AP-1 and Sp1 to the MACC1 promoter [14]. In this study, besides lowering MACC1 expression, lovastatin was also verified to upregulated DLC3 expression. It was showed that statins could downregulate DNA methyltransferase activity [23] and restore blood global DNA methylation [38] in different diseases. Considering that DLC3 DNA was frequently methylated in lung [39] and colorectal cancers [9], it is reasonable to believe that lovastatin treatment against DLC3 might probably be occurring by DNA demethylation. In addition, it was reported that statins could lead to RhoA inactivation [40, 41], which also supported our results. Moreover, some other mechanisms might also contribute to their benefic actions, for example cytostasis, proapoptosis, and synergy with chemotherapeutics [42]. As a result, lovastatin was finally proved to inhibit metastasis and augment metabolic stress-induced apoptosis. Therefore, our current study suggested that statins might be a promising anti-GC drug by modulating the DLC3/MACC1 axis. Nonetheless, further clinical explorations are warranted to verify this.
Collectively, our present findings demonstrated that GC cells escape metabolic stress via the DLC3/MACC1 signaling axis, and that increasing DLC3 expression by lovastatin might be a promising therapeutic approach targeting GC cell metabolism and metastasis.
Abbreviations
18F-FDG: 18F-fludeoxyglucose; AP-1: Activator protein 1; GAP: GTPase-activating protein; GC: gastric cancer; GEF: guanine nucleotide exchange factor; IHC: immunohistochemistry; MACC1: MET transcriptional regulator; oeDLC3: DLC3-overexpressed by ectopic coding sequence; qRT-PCR: quantitative Real-Time PCR; ROS: reactive oxygen species; shDLC3: DLC3-knocked down by targeted shRNA; TCGA: the Cancer Genome Atlas.
Supplementary Material
Supplementary methods, figures and tables.
Acknowledgements
We thank Xiaoyin Li and Chen Yang for rising animals and Sun Huang for operating microPET. XL and CY are from the Department of Oncology, and SH are from PET center, Nanfang Hospital.
Authors' contributions
WL, LL and CW designed the conception; YL, CP, LL, YZ, JZ, RS, YS performed the experiments; LL, ZH, CW, WL and YL analyzed and interpreted the data; LL, WL, CW, MS, BJ and NL drafted the manuscript; WL and LL obtained the funding.
Financial Support
This study was supported by the National Natural Science Foundation of China (81502535 to LL; 81472314 to WL), China Postdoctoral Science Foundation (2017M622739 to LL), the Pearl River S&T Nova Program of Guangzhou (201806010104 to LL), the CSCO-Merck Serono Oncology Research Fund (Y-MX2015-099 to LL), and the Special Foundation for National Clinical Specialties of China (to Department of Oncology, Nanfang Hospital). The funders had no role in study design, collection, analysis and interpretation of data, in the writing of the report and in the decision to submit this article for publication.
Competing Interests
The authors have declared that no competing interest exists.
References
1. Hirayama A, Kami K, Sugimoto M, Sugawara M, Toki N, Onozuka H. et al. Quantitative metabolome profiling of colon and stomach cancer microenvironment by capillary electrophoresis time-of-flight mass spectrometry. Cancer Res. 2009;69:4918-25
2. Lin L, Huang H, Liao W, Ma H, Liu J, Wang L. et al. MACC1 supports human gastric cancer growth under metabolic stress by enhancing the Warburg effect. Oncogene. 2015;34:2700-10
3. Durkin ME, Ullmannova V, Guan M, Popescu NC. Deleted in liver cancer 3 (DLC-3), a novel Rho GTPase-activating protein, is downregulated in cancer and inhibits tumor cell growth. Oncogene. 2007;26:4580-9
4. Zhang S, Chang X, Ma J, Chen J, Zhi Y, Li Z. et al. Downregulation of STARD8 in gastric cancer and its involvement in gastric cancer progression. Onco Targets Ther. 2018;11:2955-61
5. Holeiter G, Bischoff A, Braun AC, Huck B, Erlmann P, Schmid S. et al. The RhoGAP protein Deleted in Liver Cancer 3 (DLC3) is essential for adherens junctions integrity. Oncogenesis. 2012;1:e13
6. Hendrick J, Franz-Wachtel M, Moeller Y, Schmid S, Macek B, Olayioye MA. The polarity protein Scribble positions DLC3 at adherens junctions to regulate Rho signaling. J Cell Sci. 2016;129:3583-96
7. Braun AC, Hendrick J, Eisler SA, Schmid S, Hausser A, Olayioye MA. The Rho-specific GAP protein DLC3 coordinates endocytic membrane trafficking. J Cell Sci. 2015;128:1386-99
8. Kawai K, Kiyota M, Seike J, Deki Y, Yagisawa H. START-GAP3/DLC3 is a GAP for RhoA and Cdc42 and is localized in focal adhesions regulating cell morphology. Biochem Biophys Res Commun. 2007;364:783-9
9. Mokarram P, Kumar K, Brim H, Naghibalhossaini F, Saberi-Firoozi M, Nouraie M. et al. Distinct High-Profile Methylated Genes in Colorectal Cancer. Plos One. 2009;4:e7012
10. Valon L, Marin-Llaurado A, Wyatt T, Charras G, Trepat X. Optogenetic control of cellular forces and mechanotransduction. Nat Commun. 2017;8:14396
11. Del Re DP, Miyamoto S, Brown JH. Focal adhesion kinase as a RhoA-activable signaling scaffold mediating Akt activation and cardiomyocyte protection. J Biol Chem. 2008;283:35622-9
12. Marinissen MJ, Chiariello M, Tanos T, Bernard O, Narumiya S, Gutkind JS. The small GTP-binding protein RhoA regulates c-jun by a ROCK-JNK signaling axis. Mol Cell. 2004;14:29-41
13. Juneja M, Ilm K, Schlag PM, Stein U. Promoter identification and transcriptional regulation of the metastasis gene MACC1 in colorectal cancer. Mol Oncol. 2013;7:929-43
14. Juneja M, Kobelt D, Walther W, Voss C, Smith J, Specker E. et al. Statin and rottlerin small-molecule inhibitors restrict colon cancer progression and metastasis via MACC1. PLoS Biol. 2017;15:e2000784
15. Allen C, Srivastava K, Bayraktutan U. Small GTPase RhoA and its effector rho kinase mediate oxygen glucose deprivation-evoked in vitro cerebral barrier dysfunction. Stroke. 2010;41:2056-63
16. Durgan J, Florey O. Cancer cell cannibalism: Multiple triggers emerge for entosis. Biochim Biophys Acta Mol Cell Res. 2018;1865:831-41
17. Zhao Y, Liu Y, Lin L, Huang Q, He W, Zhang S. et al. The lncRNA MACC1-AS1 promotes gastric cancer cell metabolic plasticity via AMPK/Lin28 mediated mRNA stability of MACC1. Mol Cancer. 2018;17:69
18. Piskounova E, Agathocleous M, Murphy MM, Hu Z, Huddlestun SE, Zhao Z. et al. Oxidative stress inhibits distant metastasis by human melanoma cells. Nature. 2015;527:186-91
19. Rosch PJ, McCully K. Statin use and reduced cancer-related mortality. N Engl J Med. 2013;368:576
20. Singh PP, Singh S. Statins are associated with reduced risk of gastric cancer: a systematic review and meta-analysis. Ann Oncol. 2013;24:1721-30
21. Voorneveld PW, Reimers MS, Bastiaannet E, Jacobs RJ, van Eijk R, Zanders MMJ. et al. Statin Use After Diagnosis of Colon Cancer and Patient Survival. Gastroenterology. 2017;153:470-9 e4
22. Alexandre L, Clark AB, Bhutta HY, Chan SS, Lewis MP, Hart AR. Association Between Statin Use After Diagnosis of Esophageal Cancer and Survival: A Population-Based Cohort Study. Gastroenterology. 2016;150:854-65
23. Kodach LL, Jacobs RJ, Voorneveld PW, Wildenberg ME, Verspaget HW, van Wezel T. et al. Statins augment the chemosensitivity of colorectal cancer cells inducing epigenetic reprogramming and reducing colorectal cancer cell 'stemness' via the bone morphogenetic protein pathway. Gut. 2011;60:1544-53
24. Fromigue O, Hay E, Modrowski D, Bouvet S, Jacquel A, Auberger P. et al. RhoA GTPase inactivation by statins induces osteosarcoma cell apoptosis by inhibiting p42/p44-MAPKs-Bcl-2 signaling independently of BMP-2 and cell differentiation. Cell Death Differ. 2006;13:1845-56
25. Koppenol WH, Bounds PL, Dang CV. Otto Warburg's contributions to current concepts of cancer metabolism. Nat Rev Cancer. 2011;11:325-37
26. Zhang CS, Liu Q, Li M, Lin SY, Peng Y, Wu D. et al. RHOBTB3 promotes proteasomal degradation of HIFalpha through facilitating hydroxylation and suppresses the Warburg effect. Cell Res. 2015;25:1025-42
27. Liu L, Duclos G, Sun B, Lee J, Wu A, Kam Y. et al. Minimization of thermodynamic costs in cancer cell invasion. Proc Natl Acad Sci U S A. 2013;110:1686-91
28. Fong MY, Zhou W, Liu L, Alontaga AY, Chandra M, Ashby J. et al. Breast-cancer-secreted miR-122 reprograms glucose metabolism in premetastatic niche to promote metastasis. Nat Cell Biol. 2015;17:183-94
29. Caino MC, Chae YC, Vaira V, Ferrero S, Nosotti M, Martin NM. et al. Metabolic stress regulates cytoskeletal dynamics and metastasis of cancer cells. J Clin Invest. 2013;123:2907-20
30. Jiang L, Shestov AA, Swain P, Yang C, Parker SJ, Wang QA. et al. Reductive carboxylation supports redox homeostasis during anchorage-independent growth. Nature. 2016;532:255-8
31. Kamarajugadda S, Stemboroski L, Cai Q, Simpson NE, Nayak S, Tan M. et al. Glucose oxidation modulates anoikis and tumor metastasis. Mol Cell Biol. 2012;32:1893-907
32. Zhao Y, Hu X, Liu Y, Dong S, Wen Z, He W. et al. ROS signaling under metabolic stress: cross-talk between AMPK and AKT pathway. Mol Cancer. 2017;16:79
33. Stein U, Walther W, Arlt F, Schwabe H, Smith J, Fichtner I. et al. MACC1, a newly identified key regulator of HGF-MET signaling, predicts colon cancer metastasis. Nat Med. 2009;15:59-67
34. Wang L, Wu Y, Lin L, Liu P, Huang H, Liao W. et al. Metastasis-associated in colon cancer-1 upregulation predicts a poor prognosis of gastric cancer, and promotes tumor cell proliferation and invasion. Int J Cancer. 2013;133:1419-30
35. Duan J, Chen L, Zhou M, Zhang J, Sun L, Huang N. et al. MACC1 decreases the chemosensitivity of gastric cancer cells to oxaliplatin by regulating FASN expression. Oncol Rep. 2017;37:2583-92
36. Jansen S, Gosens R, Wieland T, Schmidt M. Paving the Rho in cancer metastasis: Rho GTPases and beyond. Pharmacol Ther. 2018;183:1-21
37. Chan CH, Lee SW, Li CF, Wang J, Yang WL, Wu CY. et al. Deciphering the transcriptional complex critical for RhoA gene expression and cancer metastasis. Nat Cell Biol. 2010;12:457-67
38. Zinellu A, Sotgia S, Sotgiu E, Assaretti S, Baralla A, Mangoni AA. et al. Cholesterol lowering treatment restores blood global DNA methylation in chronic kidney disease (CKD) patients. Nutr Metab Cardiovasc Dis. 2017;27:822-9
39. Su Y, Lin L, Zhang J, Jiang Y, Pan C, Sun L. et al. Low expression of DLC1 is predictive of poor therapeutic efficiency of fluoropyrimidine and oxaliplatin as adjuvant chemotherapy in gastric cancer. Mol Med Rep. 2015;12:5771-9
40. Kato S, Liberona MF, Cerda-Infante J, Sanchez M, Henriquez J, Bizama C. et al. Simvastatin interferes with cancer 'stem-cell' plasticity reducing metastasis in ovarian cancer. Endocr Relat Cancer. 2018;25:821-36
41. Kamel WA, Sugihara E, Nobusue H, Yamaguchi-Iwai S, Onishi N, Maki K. et al. Simvastatin-Induced Apoptosis in Osteosarcoma Cells: A Key Role of RhoA-AMPK/p38 MAPK Signaling in Antitumor Activity. Mol Cancer Ther. 2017;16:182-92
42. Zaleska M, Mozenska O, Bil J. Statins use and cancer: an update. Future Oncol. 2018;14:1497-509
Author contact
![]() Corresponding author: Wangjun Liao, Department of Oncology, Nanfang Hospital, Southern Medical University, Guangzhou 510515, China, Tel: +86-20-62787731, Fax: +86-20-61360657, E-mail: nfyyliaowjcom Or Chunlin Wang, Department of Oncology, Nanfang Hospital, Southern Medical University, Guangzhou 510515, China, Tel: +86-20-62787736, Fax: +86-20-61360657, E-mail: wangchunl03com
Corresponding author: Wangjun Liao, Department of Oncology, Nanfang Hospital, Southern Medical University, Guangzhou 510515, China, Tel: +86-20-62787731, Fax: +86-20-61360657, E-mail: nfyyliaowjcom Or Chunlin Wang, Department of Oncology, Nanfang Hospital, Southern Medical University, Guangzhou 510515, China, Tel: +86-20-62787736, Fax: +86-20-61360657, E-mail: wangchunl03com