Impact Factor
- Issue 14; 2026
- Issue 13; 2026
- Issue 12; 2026
- Issue 11; 2026
- Issue 10; 2026
- Volume 16; 2026
- Advance Articles
- Past Issues
- Cover Images
- Cover Suggestion
- Index & Coverage
- Special Issues
Introduction
Results and Discussion
Conclusions
Methods
Supplementary Material
Acknowledgements
References
International Journal of Biological Sciences
International Journal of Medical Sciences
 Global reach, higher impact

Theranostics 2019; 9(9):2646-2661. doi:10.7150/thno.32219 This issue Cite
Research Paper
Highly bright and stable NIR-BRET with blue-shifted coelenterazine derivatives for deep-tissue imaging of molecular events in vivo
Ryo Nishihara1,2#, Ramasamy Paulmurugan2#, Takahiro Nakajima3, Eiji Yamamoto4, Arutselvan Natarajan2, Rayhaneh Afjei2, Yuki Hiruta1, Naoko Iwasawa1, Shigeru Nishiyama1, Daniel Citterio1, Moritoshi Sato3, Sung Bae Kim2,5, ![]() , Koji Suzuki1,
, Koji Suzuki1, ![]()
1. Department of Applied Chemistry, Faculty of Science and Technology, Graduate School of Science and Technology, Keio University, 3-14-1 Hiyoshi, Kohoku-ku, Yokohama, Kanagawa 223-8522, Japan
2. Molecular Imaging Program at Stanford, Bio-X Program, Stanford University School of Medicine, Palo Alto, California 94304, United States
3. Graduate School of Arts and Sciences, The University of Tokyo, 3-8-1, Komaba Meguro-ku, Tokyo 153-8902, Japan
4. Graduate School of Science and Technology, Keio University, 3-14-1 Hiyoshi, Kohoku-ku, Yokohama, Kanagawa 223-8522, Japan
5. Research Institute for Environmental Management Technology, National Institute of Advanced Industrial Science and Technology (AIST), 16-1 Onogawa, Tsukuba 305-8569, Japan
# Equal contribution
Received 2018-12-12; Accepted 2019-2-13; Published 2019-4-13
Abstract

Background: Bioluminescence imaging (BLI) is one of the most widely used optical platforms in molecular imaging, but it suffers from severe tissue attenuation and autoluminescence in vivo.
Methods: Here, we developed a novel BLI platform on the basis of bioluminescence resonance energy transfer (BRET) for achieving a ~300 nm blue-to-near infrared shift of the emission (NIR-BRET) by synthesizing an array of 18 novel coelenterazine (CTZ) derivatives, named “Bottle Blue (BBlue)” and a unique iRFP-linked RLuc8.6-535SG fusion protein as a probe.
Results: The best NIR-BRET was achieved by tuning the emission peaks of the CTZ derivatives to a Soret band of the iRFP. In mammalian cells, BBlue2.3, one of the CTZ derivatives, emits light that is ~50-fold brighter than DBlueC when combined with RLuc8.6-535SG, which shows stable BL kinetics. When we used a caged version of BBLue2.3, it showed a BL half decay time of over 60 minutes while maintaining the higher signal sensitivity. This NIR BL is sufficiently brighter to be used for imaging live mammalian cells at single cell level, and also for imaging metastases in deep tissues in live mice without generating considerable autoluminescence. A single-chain probe developed based on this BLI platform allowed us to sensitively image ligand antagonist-specific activation of estrogen receptor in the NIR region.
Conclusion: This unique optical platform provides the brightest NIR BLI template that can be used for imaging a diverse group of cellular events in living subjects including protein‒protein interactions and cancer metastasis.
Keywords: Bioluminescence Imaging, bioluminescence resonance energy transfer (BRET), coelenterazine derivatives, blue-to-near infrared shift, metastasis
Introduction
Bioluminescence imaging (BLI) has emerged as a standard optical imaging technique for visualizing a diverse group of molecular events within living subjects [1-4]. The advantage of BLI over fluorescence (FL) imaging is mainly due to lower background signals because of the absence of an excitation light source needed for illumination. The high sensitive analysis of BLI is also in part due to low (negligible) background signals and the resulting better signal-to-noise (S/N) ratio when compared to other methods [5]. On the other hand, BLI commonly suffers from poor optical intensity, tissue attenuation, and the availability of a limited palette of colors, especially when it comes to in vivo imaging. Tissue attenuation of BL in the visible region is a critical issue; hence emission of light over 700 nm is more appropriate for in vivo imaging of signals from deep physiological tissues [6]. The shortcomings associated with deep-tissue imaging in vivo have been improved in part by: (i) synthesizing red shifted coelenterazine (CTZ) derivatives [7], (ii) fabricating red-shifted luciferases [8-10], and (iii) a combination thereof [11]. As one of the efficient imaging systems, the scheme of bioluminescence resonance energy transfer (BRET) was previously introduced [12-14], in which the resonance energy (RE) of a luciferase is transferred to the adjacent fluorescent protein (FP), which emits light at a higher wavelength. The fabrication of an efficient BRET system has potential to extend the available color palette with improved optical properties. BAF-Y [5] and Nano-lantern [12] have been introduced as successful examples of Renilla luciferase (RLuc)-based BRET systems. A connected study has demonstrated that the colors of Nano-lantern can be varied by simply changing the FPs [14]. A Nanoluc variant (teLuc) with diphenylterazine (DTZ) and Antares2‒DTZ as substrates achieved several fold brighter BL emissions compared to the conventional furimazine/NanoLuc pair. However, the maximum emission wavelengths (λmax) are still confined within the range of 460 nm and 600 nm [11].
It has been well documented that synthetic CTZ derivatives with Renilla luciferase 8 (RLuc8) as luciferase provide an effective, blue-shifted BLI system emitting light around 400 nm [15]. However, most of these BLI systems have not shown practical optical advantages over the standard imaging methodology with the use of native coelenterazine (nCTZ) in living mice, owing to weaker red luminescence emission of the BLI system compared to that with nCTZ. Recently, a family of phytochrome-driven red fluorescent proteins (iRFPs) has been established for light emissions in NIR region [16, 17]. The iRFP was also linked to RLuc8, and illuminated with conventional CTZs to achieve BRET with light emissions in the NIR region [18].
To address the limited color palette, quantum dot-conjugated BRET systems have been developed and demonstrated by various heterogenous conjugation models for BRET [19-21]. Recently, a sensitive BL system with a mutant of click beetle luciferase (named CBR2) in combination with naphthyl-luciferin substrate was developed to generate near infrared (NIR) bioluminescence [22]. These studies have greatly contributed to the expansion of the color pallet of BRET to the NIR region. However, the BRET models are still suffered by considerable background BL signals because the broad emission spectrum of the donor are practically superimposed to the excitation spectrum of the acceptor. In addition, for multiplex analysis to image multiple events in cells or in animals, it is important to have reporters with multiple substrate utility.
In this study, we aimed to develop a NIR BRET system with a 300 nm blue-to-NIR shift (400 nm to 717 nm) by improving both the probe and the substrate by constructing an improved iRFP-RLuc8.6-535SG single chain probe and by synthesizing an array of 18 novel bright blue-illuminating CTZ derivatives, as a BLI system for deep-tissue imaging in vivo (Figure 1; Supplementary Figure 1). This BLI system provides in cellulo and in vivo imaging modalities with light emission at 717 nm, which is greatly brighter than conventional RLuc/nCTZ-based imaging system (Figures 1‒3). The NIR-BRET system was achieved by tuning the emission peak of CTZ derivatives to a Soret band of the iRFP-RLuc8.6-535SG fusion protein. The junction between iRFP and RLuc8.6-535SG was optimized for the best NIR-BRET efficiency by screening various linkers (Figure 3A; Supplementary Figure 13). The blue-shifted RLuc substrates are of value for in vivo imaging because it overlaps well with the excitation of the iRFP that was chosen as a BRET acceptor, and it also shows low autoluminescence in vivo, due to its blue emission and the large blue-to-near infrared shifts of the RE.
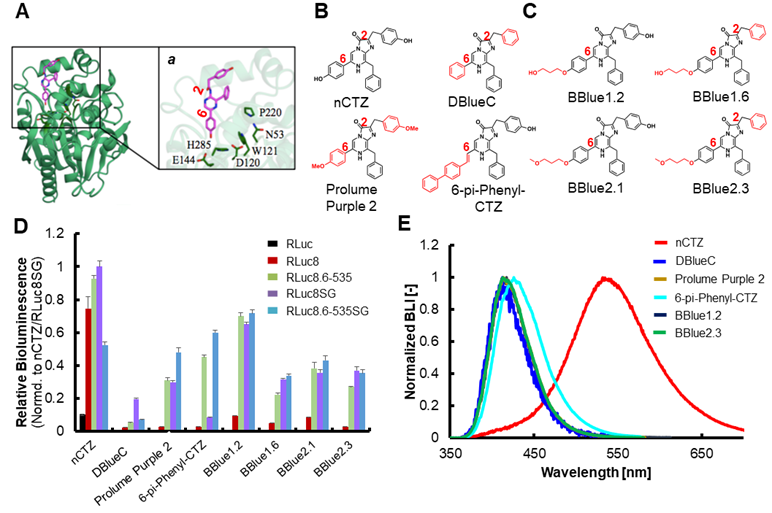
Bioluminescence (BL) measurement of selected CTZ derivatives with different RLuc variants in vitro. (A) Crystal structure of the RLuc8 with the coelenteramide (CTM). Inset 'a' indicates a close-up view of the binding site of CTM with 6 amino acid residues in RLuc8 (N53, D120, W121, E144, P220 and H285) which have mutagenesis affection on the enzymatic activity. (PDB ID: 2PSJ). (B) Chemical structures of representative conventional CTZ derivatives: nCTZ, DeepBlueC (DBlueC), Prolume Purple 2 and 6-pi-Phenyl-CTZ. The characteristic functional groups are highlighted in red. (C) Chemical structures of selected novel CTZ derivatives synthesized by us: BBlue1.2, BBlue1.6, BBlue2.1 and BBlue2.3. (D) Relative BL intensities of synthetic CTZs according to different RLuc variants, compared to those of nCTZ (n=3). (E) Normalized BL spectra of selected CTZ derivatives with a Renilla luciferase variant (RLuc8.6-535SG).
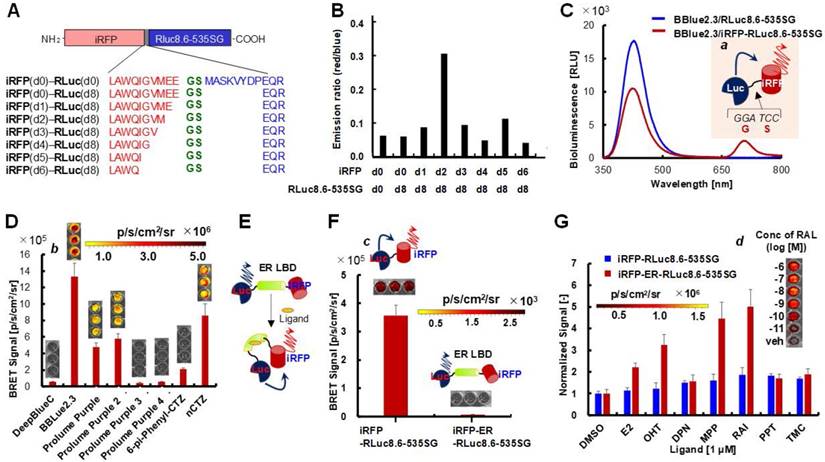
(A) Schematic diagram of an iRFP-RLuc8.6-535SG protein with a highlighted junction region between iRFP (red) and RLuc8.6-535SG (blue). The fusion protein consists of iRFP and RLuc8.6-535SG, which were linked with a variable length of linkers G, S for the highest BRET efficiency. (B) The effect of the deletion of amino acids in the junction region on BRET efficiency. The bar graph shows the relative optical intensities according to the deletion of amino acids in the junction region. (C) Bioluminescence (BL) spectra of RLuc8.6-535SG and iRFP-RLuc8.6-535SG with substrate BBlue2.3 in COS-7 cells. Inset 'a' illustrates the schematic of the design of iRFP-RLuc8.6-535SG fusion protein. Emission spectra were measured in triplicate, and the average data are shown as results. The red shadow highlights the NIR region that was used for integrating the intensity measurement. (D) The BRET signal of iRFP-RLuc8.6-535SG when reacted with DBlueC, BBlue2.3, Prolume Purple2‒4, 6-pi-Phenyl-CTZ, or nCTZ in MDA-MB231 cells. The BRET signal was captured with a Cy5.5 filter (emission: 695-770 nm) (n=3). Inset 'b' indicates the pseudocolored image at t = 5 min. (E) The schematic illustration showing the change in the conformation of iRFP-ER-RLuc8.6-535SG fusion protein in response to the binding of ER ligands (n=3). (F) The spontaneous BRET signal observed in MDA-MB231 cells expressing iRFP-RLuc8.6-535SG or iRFP-ER-RLuc8.6-535SG when reacting with BBlue23.3 (n=3). Inset 'c' illustrates the schematic of the design of iRFP-RLuc8.6-535SG fusion protein. (G) Relative BL intensities of MDA-MB231 cells expressing iRFP-RLuc8.6-535SG and iRFP-ER-RLuc8.6-535SG 24 h after incubation with 1 of different ER ligands (E2, OHT, DPN, MPP, RAI, PPT and THC) or a vehicle (0.1% DMSO) as a control (n=3). Inset 'd' shows the enhanced BL intensities of iRFP-ER-RLuc8.6-535SG according to the concentrations of raloxifene (RAL).
By virtue of the optimal spectral overlaps, low background signal, high intensity, and optical stability (Figures 2‒7), this NIR-BRET system provides the brightest NIR template for imaging diverse intracellular molecular events with the large RET without optical crosstalk. We utilized this NIR-BRET system to image live cells at single cell level, and deep-tissue imaging of molecular events in animal models (Figure 4‒6). Using this system, we further evaluated a single-chain NIR-BRET probe for measuring estrogenicity of ER-ligands in the NIR region (Figure 3D-F). We also estimated the kinetic constants and binding free energies through a docking simulation for reasoning why the NIR-BRET system emits the best NIR BL (Supplementary Figure 9). The developed NIR-BRET system provides the brightest NIR template for imaging diverse cellular events in living subjects without severe tissue attenuation and autoluminescence.
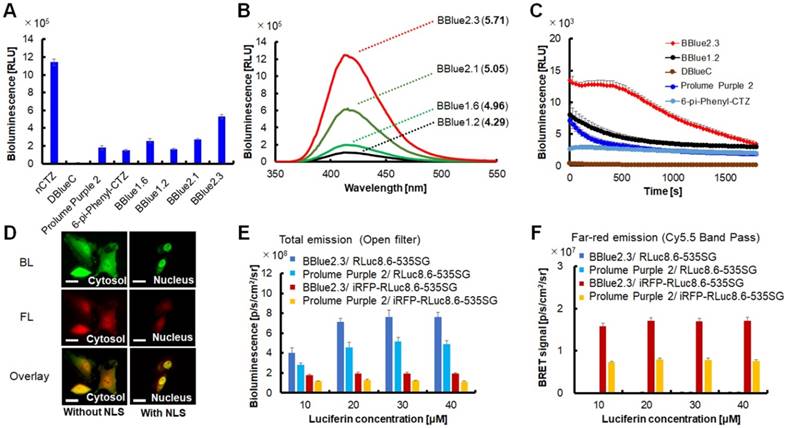
Bioluminescence (BL) characteristics of CTZ derivatives in living cells. (A) The relative BL intensities of COS-7 cells expressing RLuc8.6-535SG according to CTZ derivatives (n=3). (B) BL spectra of selected CTZ derivatives with COS7 cells expressing RLuc8.6-535SG. Emission spectra were measured in triplicate, and the average data are plotted in the graph. The numbers in parentheses mean the Log P values of each compound (cLog P), where P means each lipid-water partition coefficient. (C) The decay rates of the BLI of RLuc8.6-535SG reacted with BBlue1.2, BBlue2.3, DBlueC, Prolume Purple 2 and 6-pi-Phenyl-CTZ. (D) Single-cell BL and FL imaging with HeLa cells expressing RLuc8.6-535SG. RLuc8.6-535SG located in the nucleus and the cytosol by fusing it with and without a nuclear localization signal peptide (NLS). The exposure time for BL and FL imaging were 2 s and 1 s, respectively. The BL image was taken in the presence of BBlue2.3. The reference FL signal was captured by exciting mCherry with light 565 nm. Scale bars, 25 µm. (E) The BL intensities of Living cells stably expressing RLuc8.6-535SG or iRFP-RLuc8.6-535SG, which were obtained with an open window. The X-axis shows increasing concentrations of the substrates. The cells were cultured without biliverdin (BV) addition (n=3). (F) The BL intensities of living cells stably expressing RLuc8.6-535SG or iRFP-RLuc8.6-535SG, which were obtained with Cy5.5-filter (695-770 nm) (n=3). The cells expressing RLuc8.6-535SG did not show significant BLI in the NIR region. It was confirmed with a Cy5.5 long band pass filter.
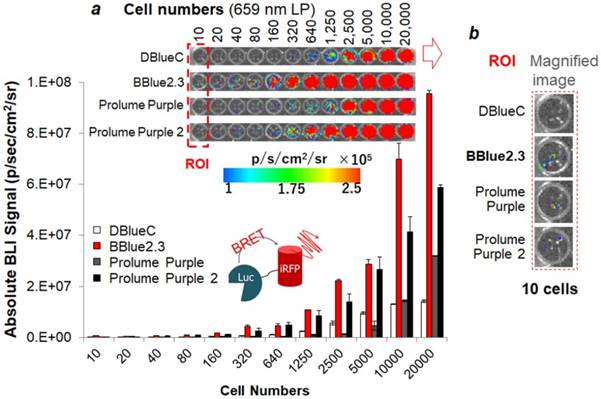
Quantitative evaluation of substrate sensitivity of MDA-MB231 cell stably expressing the iRFP-RLuc8.6-535SG with respect to cell number (n=3). The BRET signals of selected CTZ substrates are cell number dependent. Inset 'a' shows the optical image that was taken by a 659 nm LP filter. Inset 'b' highlights the magnified optical image at the 10-cell region. ROI means a region of interest.
Results and Discussion
Evaluation of RLuc variants with the new CTZ derivatives identified a novel substrate with blue-shifted emission peak and higher optical intensity
DeepBlueC (shortly, DBlueC) is a preferred substrate for RLuc8-based BRET studies, because it provides better optical separation between the excitation and emission signals of the GFP acceptor. Hence, DBlueC has been highlighted as a principle substrate for iRFP-RLuc8 BRET-based in vivo studies since the blue-shifted light can be used as a potential energy donor for illuminating iRFP [23]. However, the BL intensity of DBlueC is as low as 3.7% of that of nCTZ when combined with RLuc8, a variant of RLuc [15]. This causes poor optical properties in bioassays and for imaging studies in animal models. Therefore, developing new generation substrates with blue-shifted BL with higher optical intensity will have great potential in improving imaging studies using this reporter, but it remains a challenging issue.
We previously demonstrated that modification of nCTZ at the C-6 position allows a large spectral shift towards blue- of BL signal without any influence on the enzymatic recognition by RLuc variants [15, 24]. The rigidity of the ethynyl group at the C-6 position of nCTZ decreases the BL intensity by increasing the steric bulkiness. The ethynyl group causes steric hindrance by interacting with the key amino acids such as, D120, E144 and H285, located within the active site (Figure 1A) [24-26].
Furthermore, our earlier studies also suggest that the use of a flexible alkyl linker moiety in the CTZ may relieve its steric hindrance, and that could enhance the enzymatic efficiency of RLuc [24, 25]. Based on this knowledge, we synthesized 18 novel CTZ derivatives, where the (p-hydroxy)-phenyl group at the C-6 position was intentionally modified by alkylation (Figure 1B and Supplementary Figure 1). When we assayed these substrates with different RLuc variants (RLuc8, RLuc8.6-535, RLuc8SG, and RLuc8.6-535SG [8, 10]), we found that BBlue1.2, a new CTZ derivative with a hydroxyl-terminated alkyl linker chain of three methylene units in length at the C-6 position displayed the brightest blue-shifted emission, which produced ~33.5-fold stronger BL signal when combined with RLuc8.6-535SG (i.e., BBlue1.2/RLuc8.6-535SG pair) compared to that of the DBlueC/RLuc8 pair (Figure 1B-D, Supplementary Figure 2 and Supplementary Table 2). Additionally, a few other CTZ derivatives having three methylene units at C-6 position also displayed much stronger BL signal compared to DBlueC/RLuc8 pair, but lower than BBlue1.2 (Figure 1C-D). Among the new derivatives, the BBlue2.3 reached a peak BL signal at the lower concentration of substrate when combined with purified RLuc8.6-535 protein (Supplementary Figure 3). This is mainly due to its low Km value (Supplementary Table 3), which leads to signal saturation at relatively low concentration of substrate, and also potential competitive inhibition effects by oxyluciferin, a product of the BL reaction, for which the mechanism has been previously reported for CTZ [27].
Bioluminescence evaluation of CTZ derivatives in live cells expressing RLuc8.6-535SG identified a novel cell permeable CTZ analog with improved light output
In order to evaluate the biophysical properties of the new CTZ derivatives in intact cells, COS-7 cells transiently transfected with RLuc8.6-535SG were imaged after treatment with different CTZ derivatives at 10 μM concentration (Figure 2). In contrast to the results of BL assays we performed using bacterially expressed pure RLuc protein and the cell lysates of transfected mammalian cells (Figure 1D and Supplementary Figure 2), the imaging data in live cells showed much brighter signal with BBlue2.3 compared to BBlue1.2 (Figure 2A-2B and Supplementary Figure 5). We observed approximately 2 and 54-fold higher absolute BL signal with BBlue2.3 compared to BBlue1.2 and DBlueC, respectively in live COS-7 cells (Figure 2A). This is mainly due to high membrane permeability of BBlue2.3 in mammalian cells. The high permeability of BBlue2.3 across cell membrane is mainly due to its superior lipid-water partition coefficient (P) (Figure 2B). The relationship of small molecules permeability in cell membranes was well discussed previously by Bennion et al., 2017 [28]. In addition, it is also possible that the multidrug efflux machinery of mammalian cells [29] may in part plays a role in maintaining relatively high influx with lower efflux rate for BBlue2.3, which could help its high intracellular substrate availability for the enzymatic reaction of RLuc8.6-535SG. This property of BBlue2.3 also implies that this can serve as a suitable substrate for BL imaging in intact live cells and in vivo imaging in living animals. Indeed, when the selected CTZ derivatives such as, BBlue1.2, BBlue1.6, BBlue2.1 and BBlue2.3 were incubated with COS-7 cells expressing RLuc8.6-535SG, BBlue2.3 showed the strongest BL peak (Figure 2B) compared to the other substrates e.g., ~12-fold brighter than BBlue1.2. Therefore, the introduction of a hydrophobic moiety into the CTZ backbone can results in achieving an improved lipid‒water partition coefficient (P), which promotes BL at the cellular level (Figure 2B). The estimation of BL decay rate in live cells showed the best optical stability from BBlue2.3 (BL-half decay time: 18.5 min), when compared to DBlueC (BL-half decay time: 7 min) (Figure 2C and Supplementary Table 5). Comparison of BL signal levels in intact cells and cell lysates over time after the addition of substrates revealed the differences in cell membrane permeability (influx/ efflux ratios) of these substrates (Supplementary Figure 6), which is considered a major factor limiting the substrates availability inside cells for their interaction with the enzyme, and influencing the net BL production rate in intact cells [29].
As single cell imaging has been considered one of the most useful applications in BL imaging [30], we tested the optical imaging potential of BBlue2.3/RLuc8.6-535SG pair in intact HeLa cells. This pair allows bright single cell imaging with high resolution similar to fluorescence imaging (Figure 2D). By a compartmentalized expression of RLuc8.6-535SG into selective organelles (e.g. cytosol and nucleus) through tagging a localization signaling peptide (nuclear localization signal; NLS) as described before [31], we were able to successfully image the localized BLI signal in the nuclear compartment. In addition, these results also imply that the BBlue2.3 can diffuses rapidly throughout the cell (Figure 2D).
We further evaluated the optical properties of the BLI in living mammalian cells that stably express RLuc8.6-535SG or iRFP-RLuc8.6-535SG with respect to: (i) optical filters with different wavelengths, (ii) the presence and absence of biliverdin (BV), (iii) BL half decay rates, and (iv) luciferin concentration dependency (Figure 2E and 2F; Supplementary Figure 7 and 8). The use of BV is considered since the chromophore stability of this phytochrome photoreceptor derived iRFP can interact with endogenous BV generated by the decomposition of heme and can improve the fluorescent property of this photoprotein [32]. The study results show that the addition of BV at the applied concentration did not elevate the BLI significantly. A similar trend was also observed in in vivo studies (Supplementary Figure 7 and 8). The results also indicate that BBlue2.3 generates ~2-fold brighter and stable NIR BL signal than Prolume Purple 2 in the absence of BV. Hence, we did not supplement BV into the culture medium for the experiments we performed hereafter. The comparison of BLI with open and Cy5.5 Band Pass (BP) filter shows that the BLI of RLuc8.6-535SG is mostly blocked by Cy5.5 BP filter, whereas a large portion of BLI from iRFP-RLuc8.6-535SG remains within the range of Cy5.5 BP filter, which is considered the BRET signal successfully transferred from RLuc8.6-535SG to iRFP (Figure 2E and 2F). The NIR BL intensities did not vary significantly in the range of 10‒40 μM of BBlue2.3. Thus, 10 μM of BBLue2.3 was used for all cell-based studies hereafter. The study on the BL decay rates shows that BBlue2.3 has ~30-50% prolonged BL intensities compared to Prolume Purple 2 (Supplementary Figure 8).
Evaluation of iRFP-RLuc8.6-535SG fusion protein with different linkers identified an optimal NIR BRET bioluminescence imaging system with higher signal intensity
As a trial for fabricating an optimal BRET platform, we examined for an optimal linker between iRFP and RLuc8.6-535SG fusion protein that maintains high signal intensity with minimal steric hindrance (Figure 3A; Supplementary Figure 13). The C-terminal end of iRFP and the N-terminal end of RLuc8.6-535SG were consecutively edited by few amino acids. Every C-terminal- deletion to iRFP was named as d0, d1, d2, d3, d4, d5, and d6, according to the number of amino acids deletion. Similarly, an N-terminal deletion of 8 amino acids in RLuc8.6-535SG which we named as d8, was used for optimizing the interface region for the BRET efficiency.
We examined the spectral match between the deleted pairs of iRFP and RLuc8.6-535SG for the efficient BRET signal. The results show that iRFP(d2)/RLuc8.6-535SG(d8) pair exerts the best BRET efficiency compared to all other fusion proteins (Figure 3B).
The BRET spectra of iRFP(d0)-RLuc8.6-535SG(d0) and iRFP(d2)-RLuc8.6-535SG(d8) fusion were compared for highlighting the improved BRET efficiency. The BRET peak at 717 nm was ~4-fold higher by adapting iRFP(d2)-RLuc8.6-535SG(d8) compared to iRFP(d0)-RLuc8.6-535SG(d0) direct fusion (Figure 3A, B). Therefore, the optimal NIR-BRET probe, iRFP(d2)-RLuc8.6-535SG(d8), which we named as “iRFP-RLuc8.6-535SG”, was used for all the results shown in this manuscript hereafter.
BBlue2.3/iRFP-RLuc8.6-535SG NIR-BRET pair is efficient in imaging biological functions in cells
The effective application of BBlue2.3 as a NIR-BRET imaging substrate was further evaluated using iRFP-RLuc8.6-535SG BRET luciferase system. Fabrication of a BRET pair is an efficient strategy for improving the λmax of bioluminescent proteins. However, most of the existing marine luciferase-based BRET proteins emit luminescence in the blue to orange spectral region [33]. In the conventional approaches, because of the limited color palette of marine luciferases (λmax = 500 nm), developing a BRET system with further red-shifting has no margin, and is very challenging through an efficient spectral overlap between the excitation spectrum of FPs and the emission spectrum of marine luciferases. Hence, we focused on using a family of NIR fluorescent proteins such as iRFPs,11 which are commonly used for in vivo imaging studies. The λmax of most of the iRFPs are over 700 nm. Interestingly, these proteins possess a second absorption peak located around 380 nm that is attributed to a Soret band of the biliverdin (BV) chromophore [23]. Therefore, it was assumed that the Soret band enables iRFPs to be a sufficient BRET acceptor of the blue-shifted BL system using the BBlue2.3/iRFP-RLuc8.6-535SG pair, with no background signal due to the large spectral gap (Figure 3C). As aimed, iRFP-RLuc8.6-535SG fusion displayed a large BRET shift from blue (ca. 415 nm) to NIR (ca. 717 nm) with the substrate BBlue2.3 in COS-7 cells.
The relative BL intensities in the NIR region were determined using iRFP-RLuc8.6-535SG fusion protein and varying kinds of the substrates (Figure 3D). The highest NIR BL intensities were observed with BBlue2.3, followed by nCTZ and Prolume Purple 2. The intensity profiles of these substrates greatly differ from those of the cell lysates and live cells, with the use open window as shown in Figures 1D and 2B. This advantageous feature explains that BBlue2.3 efficiently excites iRFP located within the iRFP-RLuc8.6-535SG fusion as expected and emits NIR BL through the blue to NIR-BRET. On the other hand, nCTZ shows ~40% poorer NIR BL than BBlue2.3, which may be interpreted as nCTZ being less efficient in activating iRFP-RLuc8.6-535SG, and is reflected in the results of less NIR BL.
The chemiluminescence (CL) and BL spectra of all the CTZ derivatives were investigated for discussing the unique blue-shifted optical properties (Supplementary Figure 4 and Supplementary Table 4). It is well known that, during the enzymatic reaction, CTZ can form three possible intermediates in different protonation states (e.g. neutral species, phenolate anion or pyrazine anion species), which determine the emission color [34, 35]. In the BL spectra of CTZ derivatives modified at the C-6 position in combination with RLuc variants as enzymes, the blue-shifted emission (λmax = 401-426 nm) comes only from the neutral form of the intermediates in the excited state, implying that modifications at C-6 position prevents the deprotonation of the p-hydroxyl group on the C-6 phenyl of the substrate. This precedent view explains why our new CTZ derivatives are bright in the blue region. The results also support that we successfully developed bright blue-shifted CTZ derivatives, which can be used as alternatives to DeepBlueC.
We further investigated whether this unique optical platform works as an efficient NIR-BLI template for imaging intracellular molecular event such as protein-folding in cells. This is important for extending this system for various applications include, protein-protein interactions, protein folding, and protein stability estimation in cells. This feature was determined with a fusion protein where we placed the ligand binding domain of estrogen receptor (ER-LBD: aa 281-549) in between iRFP and RLuc8.6-535SG (named iRFP-ER-RLuc8.6SG) and measured the NIR-BRET signal using BBlue2.3 substrate (Figure 3E). The result shows that iRFP-ER-RLuc8.6SG emits ca. 0.17% of NIR BLI of iRFP-RLuc8.6-535SG, where the only difference between the two probes is the presence of ER-LBD. The poor NIR-BRET intensity of iRFP-ER-RLuc8.6-535SG can be explained as ER-LBD disrupting the BRET efficiency by increasing the distance between the full-length iRFP and RLuc8.6-535SG, hence BRET foster energy transfer process is affected by the distance and the orientation of the BRET protein partners located within the fusion protein. The BRET efficiency‒distance correlations were well discussed before [12].
The ligand-driven variance in the NIR BL was determined after stimulation of iRFP-ER-RLuc8.6SG with various agonists and antagonists (Figure 3G). The results show that the ER antagonists emit relatively higher BL intensities, followed by the endogenous agonist estradiol (E2). This result corresponds with our previous observation of the protein-fragment complementation-based ER probes, where antagonist transforms the α-helix 12 of the ER-LBD more efficiently to approximate the fragmented luciferases closer than the agonist [36, 37].
Quantitative evaluation of BBlue2.3/iRFP-RLuc8.6-535SG based NIR-BRET pair with cell numbers reveals the single cell imaging ability of this new system
Figure 3B and 3D strongly suggest that Prolume Purple, Prolume Purple 2, and nCTZ are strong competing contenders to BBlue2.3 for imaging iRFP-RLuc8.6-535SG fusion protein. Hence, we further determined the optical intensity of these substrates by evaluating the minimum number of cells that can be imaged using these different substrates. We used MDA-MB231 cells stably expressing iRFP-RLuc8.6-535SG fusion protein for the evaluation (Figure 4). As expected, the highest optical intensities were observed with BBlue2.3, followed by Prolume Purple 2, DBlueC, and Prolume Purple. The ROI indicates that even an individual cell can be imaged using iRFP-RLuc8.6-535SG/BBlue2.3 combination. The ROI of the cell image in the well appears that 10 individual optical spots with BBlue2.3 which matches with the number of cells plated for imaging, whereas the imaging signals acquired with other substrates (Prolume Purple 2 and DBlueC) were ~2‒4 log orders lower than BBlue2.3 (Figure 4, inset a). In this study we used two commercially available blue shifted substrates such as, Prolume Purple 2 (two methoxy groups) and Prolume Purple (one methoxy and one hydroxyl groups). We observed significantly higher amount of bioluminescence signal from Prolume Purple 2 compared to Prolume Purple, when we used iRFP-RLuc8.6-535SG fusion protein as a reporter. We assume that the reason for this variation from these two substrates may be possibly due to the higher hydrophobicity of the functional groups in Prolume Purple 2, compared to those in Prolume Purple, allowing the better diffusion of this substrate across cell membrane into the live cells.
Characterization of BBlue2.3 for its potential protein binding associated autoluminescnce property in an in vitro imaging study reveals BBlue2.3 with lower autoluminescence compared to other CTZ analogs
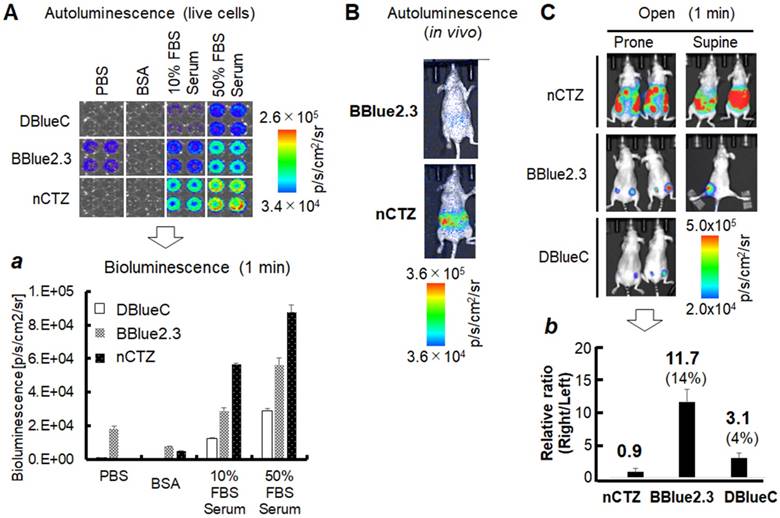
CTZ and its derivatives have been reported to possess inherent protein binding property, which in turn lead to autoluminescence [29]. Hence, we evaluated the potential protein-binding properties and the associated autoluminescence of substrate BBlue2.3 and compared it with nCTZ and DBlueC, under an in vitro condition. We used 1μg of BSA and FBS at 10% and 50%, as protein sources for testing. The PBS was used as a control. We tested the substrates DBlueC, nCTZ and BBlue2.3 at 10 μM concentrations at three different conditions for the imaging study. We used IVIS-Lumina optical imaging system with the open filter window for image acquisition (Figure 5A). The results showed significantly lower level of autoluminescence from DBlueC, compared to nCTZ and BBlue2.3. However, it should be noted that DBlueC also shows much poorer optical intensities compared to other substrates.
Autoluminescence of the selected substrates in live cells, live animals, and live animals implanted with MDA-MB231 tumor xenografts. (A) Serum-driven autoluminescence of selected CTZ derivatives in living mammalian cells (open filter with one minute integration) (n=4). Inset 'a' represents the quantitative values of the BL intensities according to the protein components, BSA or FBS. (B) Comparison of autoluminescence intensities of nCTZ and BBlue2.3 in living BALB/c nude mice after the i.p. injection of the substrates. (C) In vivo bioluminescence imaging (BLI) of animals bearing MDA-MB231 xenografts stably expressing RLuc8.6-535SG (left flank) or iRFP-RLuc8.6-535SG (right flank) after i.p. injection of different substrates (nCTZ, BBlue2.3, and DBlueC) (n=3). The animals were imaged for each substrate at four-hour intervals. BLIs show tumor sites expressing RLuc8.6-535SG or iRFP-RLuc8.6-535SG, and autoluminescence background signals from the peritoneum at supine and prone positions using open window. The in vivo image of DBlueC in supine position was not determined. BBlue2.3 showed the highest absolute intensities without autoluminescence. Inset 'b' represents the relative optical intensities of the tumor sites (Left flank: RLuc8.6-535SG, Right flank: iRFP-RLuc8.6-535SG) according to the substrates (prone). The optical intensities were normalized to those of RLuc8.6-535SG in the left tumor sites. The numbers and percentages on the bars show the fold intensity and the intensity ratio longer than 659 nm, respectively.
Characterization of iRFP-RLuc8.6-535SG/ BBlue2.3 NIR-BRET pair in vivo in animals bearing xenograft tumors reveal its higher sensitivity, and deep tissue imaging with lower background
i. Comparative evaluation of the sensitivity of iRFP-RLuc8.6-535SG/ BBlue2.3 BRET pair with iRFP-RLuc8.6-535SG/ nCTZ BRET pair reveals BBlue2.3 with higher sensitivity compared to nCTZ in vivo
The physiological tissue penetration of marine luciferase BL is expected to be improved by the use of the iRFP-RLuc8.6-535SG/BBlue2.3 BRET enzyme-substrate pair. For comparison between BBlue2.3 and nCTZ, the same number of COS-7 cells (1.83 cells) expressing equal levels of iRFP-RLuc8.6-535SG fusion protein and previously treated with BV chromophore was mixed with 10 μg of either BBlue2.3 (left flank) or nCTZ (right flank) and simultaneously implanted into the subcutaneous layer on the lower flank of nude mice. The BRET imaging was performed using a Lumazon FA imaging system (Nippon Roper) using a Cy5.5 filter. The comparison of results indicated that the BBlue2.3/iRFP-RLuc8.6-535SG pair with significantly enhanced BLI signal (3±1 fold) compared to the nCTZ/iRFP-RLuc8.6-535SG pair, which clearly indicates that BBlue2.3/iRFP-RLuc8.6-535SG can be an alternative in vivo bioluminescence imaging probe with red-shifted signal output (Supplementary Fig. 13D).
ii. Evaluation of BBlue2.3 for its substrate associated autoluminescnce in an in vivo intraperitoneal injection model reveals BBlue2.3 with lower autoluminescence compared to nCTZ
Similar to in vitro evaluation for substrate associated autoluminescence as shown in Figure 5A, we also evaluated the autoluminescence of BBlue2.3 in an in vivo condition. We used BBlue2.3 along with nCTZ for comparison. When we used these substrates for in vivo imaging by intraperitoneal injection, we found BBlue2.3 with a 33-fold less autoluminescence signal than nCTZ (1.7x10⁶ vs. 5.6x10⁷) (Figure 5B). This could be possibly due to (i) the excellent chemical stability and tissue permeability of BBLuc2.3 in vivo and (ii) the emission spectrum of BBlue2.3 in the blue range (peak of ~400 nm) may be attenuated through tissue absorption in vivo compared to nCTZ (peak of ~450 nm) with a wide emission spectrum.
iii. Comparative evaluation of substrate sensitivity, BRET specificity, and substrate autoluminescence of iRFP-RLuc8.6-535SG BRET system with BBlue2.3, nCTZ and DBlueC, in an in vivo intraperitoneal substrate injection model reveals BBlue2.3 with higher sensitivity and lower background signal
nCTZ in combination with RLuc and Gaussia luciferase (GLuc) have been widely used for in vivo imaging in small animals [4, 10, 38]. Because of being highly autoluminescent in nature, the concentration of nCTZ for in vivo imaging application has been limited to below 50 μg/injection to avoid non-specific lung and liver signals, while the injection is also restricted to systemic tail vein [39]. In this study, we evaluated the potential imaging application of BBlue2.3 by an intraperitoneal injection model (Figure 5C). We used animals bearing subcutaneous xenografts of MDA-MB231 TNBC tumors stably expressing RLuc8.6-535SG (left flank) and iRFP-RLuc8.6-535SG (right flank). The animals were optically imaged for BLI signal after intraperitoneal injection of 50 μg of nCTZ or BBlue2.3 or DBlueC in four-hour intervals between each substrate. The animals were imaged by both supine and prone positions to observe for the non-specific autoluminescence signals of the substrates in the peritoneum as well as specific target signal from the tumors. We used both open window and 659 nm long pass (659 nm LP) filter for BLI. The results showed significantly high amount of autoluminescence signal from the substrate nCTZ in both prone and supine positions without a clearly defined tumor margin. In contrast, both BBlue2.3 and DBlueC showed no substrate assisted autoluminescence signals, but showed clear tumor specific BLI with predominantly very high signal from BBlue2.3 compared to DBlueC. Using a long band-pass filter which eliminates most signals below 659 nm (659 nm LP), resulted in tumor specific BRET signal (iRFP-RLuc8.6-535SG) from both BBlue2.3 and DBlueC, and only BL signal from nCTZ (Figure 6).
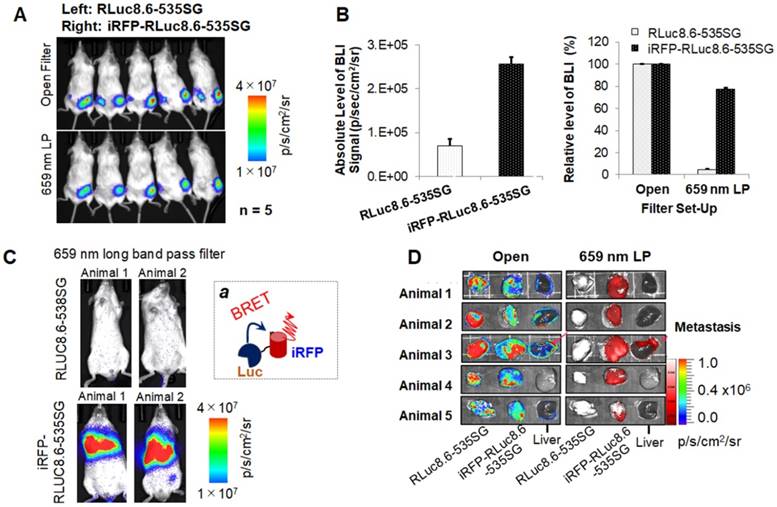
(A) Tissue permeability of the NIR BL signals in animal models bearing tumor xenografts of MDA-MB231 cells stably expressing RLuc8.6-535SG (left flank) or iRFP-RLuc8.6-535SG (right flank) (n=5). The BL image was taken after i.p. injection of BBlue2.3. (B) Statistical analysis of the variance in the tissue permeability according to probes (left) and optical filters (right). (C) The BL image of mice bearing tumor xenografts of MDA-MB231 cells stably expressing RLuc8.6-535SG (upper) or iRFP-RLuc8.6-535SG (lower) under a 659 nm LP filter. Inset 'a' indicates the cartoon of BRET. (D) The ex vivo images of tumors and liver tissues under open or 659 nm-long pass (695 nm LP) filters. The red arrows indicate the metastasis in liver.
iv. Comparative evaluation of RLuc8.6-535SG/ BBlue2.3 and iRFP-RLuc8.6-535SG/ BBlue2.3 BRET pairs in MDA-MB231 triple negative breast cancer in subcutaneous, and deep tissue lung metastatic models reveals iRFP-RLuc8.6-535SG/ BBlue2.3 BRET system with higher deep tissue imaging sensitivity
The results of Figures 3 and 5 indicate that BBlue2.3 is the best substrate for highly sensitive imaging of iRFP-RLuc8.6-535SG NIR BRET without autoluminescence. We further evaluated the deep tissue imaging capability of iRFP-RLuc8.6-535SG/ BBlue2.3 BRET pair in xenografts of MDA-MB231 tumors stably expressing iRFP-RLuc8.6-535SG in subcutaneous and deep tissue lung metastatic models. We used a similar tumor model expressing RLuc8.6-535SG as a control for comparison. The results of BLI (open filter) and BRET (659 nm LP) imaging using BBlue2.3 substrate showed nearly 3-fold improved BLI sensitivity by tumors expressing iRFP-RLuc8.6-535SG (right flank) in comparison to tumors expressing RLuc8.6-535SG (left flank). BRET imaging using the 659 nm LP filter showed almost 90% of BLI signals recovered from tumor xenografts expressing iRFP-RLuc8.6-535SG were from BRET signal. In contrast, RLuc8.6-535SG showed less than 3% signal in the BRET window (Figure 6A-B). Similarly, the lung metastatic model of tumor cells expressing iRFP-RLuc8.6-535SG/ BBlue2.3 BRET pair showed very strong lung metastatic tumor signal from all animals, while none of the animals received RLuc8.6-535SG showed either BLI or BRET signal (Figure 6C). Interestingly, ex vivo imaging of tumor, lung and liver tissues revealed for the presence of distinct liver metastasis in animals when we used 659 nm LP filter imaging compared to open filter imaging which showed substrate autoluminescence associated background signal in the liver that masked the metastatic tumor signal (Figure 6D). Since we imaged organs and tumor tissues ex vivo without further addition of substrates, the ex vivo signals show much lower absolute intensity in these organs compared to in vivo imaging signals (Figure 6C vs Figure 6D).
Discussion on the BRET efficiency
It is well known that the BRET efficiency is greatly influenced by various factors according to the specific theoretical equations (Supplementary Information 8) [12]. The controllable factors in determining BRET efficiency include: (i) the luminescence quantum yield (QY) of the BRET donor ( ), (ii) the distance between BRET partners (r), and (iii) the overlap integral representing the degree of overlap of the donor emission spectrum with the acceptor absorption spectrum (J(λ)). In the present study, we improved the relative QYs (
 ) of the BRET donor up to ~10-fold by synthesizing specific substrates for RLuc8.6-535SG (Supplementary Table 3). The distance (r) between the BRET donor and acceptor was optimized through identifying optimal linker length (Figure 3A). The authors assume the r in our study is
  5 nm for iRFP-RLuc8.6-535SG and is
  7.5 nm for iRFP-ER-RLuc8.6-535, considering the reference data on the average distance between FP and RLuc8 [40, 41]. The overlap integral factor (J(λ)) was modified through creating and combining the bright blue spectrum of the substrates with the excitation spectrum of iRFP in this study. The spectral overlap integral value between RLuc8.6-535SG and iRFP was found to be 0.882 × 10¹⁵ nm4 M-1 cm-1 with a specific software, ale ver 2.2. Despite the optimization, the BRET efficiency of the present system is ~20%. This relatively low BRET efficiency may be explained by the relatively low molar absorption coefficient of the FP acceptor (the molar absorption coefficient of Soret band of iRFP: 39,900 M-1cm-1). This feature can be greatly improved in future by replacing the FP acceptor with an iRFP variant with a better absorption coefficient.
We further studied a computational docking simulation between the substrates and RLuc8 to explain in part for the BRET efficiency. We calculated the relative orientation of the bound nCTZ with respect to RLuc8 and found that the C-6 phenyl group of nCTZ binds to H285, E144 and D120 residues of RLuc8 via hydrogen bonding, and can insert into the active site pocket as both the binding pose of site-1-up (~6.50 ± 0.10 kcal/mol) and site-1-down ( 7.65± 0.14 kcal/mol) (Supplementary Figure 9 and 10C). The docking simulation results suggest that the size and shape of the C-6 substituent of nCTZ strongly affects BLIs.
Conclusions
In summary, by identifying a novel CTZ derivative in combination with an iRFP-RLuc8.6-535SG-based NIR-BRET system, in this study, we accomplished in developing a sensitive deep tissue imaging system for monitoring biological events in vivo in animal models. We first investigated alkylation of the (p-hydroxy)-phenyl group in the C-6 position of the CTZ backbone with the motivation for modulating the optical properties of CTZ derivatives towards blue spectrum. As a result, for instance, the CTZ derivatives with 3-hydroxypropoxy substitution at the C-6 position of nCTZ (BBlue1.2) showed ~33.5-fold brighter BL emission than DBlueC as a blue-shifted derivative in cell lysates. Among the various synthesized CTZ derivatives, BBlue2.3 was identified as a substrate with brightest BL without apparent autoluminescence, and with prolonged reaction kinetics in living mammalian cells and in vivo in animal models (Figures 2‒6). The caged version of BBlue2.3 showed an hour-long BL half decay time (>60 minutes) (Supplementary Figure 8, 12). In combination with iRFP-RLuc8.6-535SG, BBlue2.3 allows an almost 300-nm BRET shift from blue-to-near infrared with high efficiency and showed high tissue permeability and minimal autoluminescence in animal models (Figures 4‒6). The quantitative features of the system were examined initially in COS-7 cells with its high transfection efficiency, and further in MDA-MB231 cells (Figure 2‒4) as a relevant tumor model for later in vivo applications. Using this system, we further evaluated a single-chain NIR-BRET probe for measuring estrogen binding mediated structural change in ER LBD in the NIR region (Figure 3E-G). We also investigated the kinetic constants and absolute binding free energies through a docking simulation for reasoning the advantages of the present substrates, compared to conventional CTZ derivatives (Supplementary Figure 9; Supplementary Tables 3, 6). The docking simulation results suggest that the size and shape of the C-6 substituent of nCTZ strongly affects BLIs and spectral properties (Supplementary Figure 9; Supplementary Tables 3, 6). The overall results suggest that the moderate hydrophobicity, size, and shape of the C-6 substituent strongly affects the membrane permeability, turn-over rates, and luminescence quantum yield of marine luciferase systems. Throughout all the experiments we did not observe any obvious cytotoxicity or morphological changes to cells, which is consistent with various previous toxicity studies using iRFP [16] and Rluc8 [42]. The further in vivo imaging in subcutaneous and lung metastatic models highlighted the sensitivity of the developed iRFP-RLuc8.6-535SG/BBlue2.3 NIR-BRET system. Overall, the present bioluminescent platform provides the brightest NIR template for advantageous imaging of various molecular events in live mammalian cells and in vivo in living animals.
Methods
Construction of mammalian expression plasmids for NIR-BRET imaging
A series of mammalian expression plasmids were fabricated for BRET imaging both in live cells and in vivo in living animal models (Supplementary Figure 13). The basic molecular structure starts from iRFP and finished by RLuc8.6-535SG, between of which a flexible linker, or the ligand binding domain of human estrogen receptor (ER LBD) was inserted for exerting ligand-driven variance in the optical intensities.
We further fabricated 8 different cDNA constructs encoding iRFP-linked RLuc8.6-535SG (d0-d8), where the C- and N-terminal interface between iRFP and RLuc8.6-535SG, respectively, were consecutively deleted to find an optimal length in the interface region for the best BRET efficiency between iRFP and RLuc8.6-535SG (Figure 3A; Supplementary Figure 13).
First of all, a series of cDNA segments encoding each block shown in Supplementary Figure 13 were generated by polymerase chain reaction (PCR) using corresponding primers to introduce unique restriction sites, HindIII/BamHI, BamHI/XhoI, or BamHI/XhoI at the 5' and 3' ends, respectively. The cDNA segments were double digested by the corresponding restriction enzymes (NEB, Ipswich, MA, USA), ligated with a ligation kit (Takara Bio), and subcloned into a respective enzyme (HindIII/XhoI) digested pcDNA3.1(+) mammalian expression vector (Invitrogen, Carlsbad, CA, USA).
The corresponding lentiviral vectors were also constructed for establishing stable cell lines. The cDNA constructs encoding RLuc8.6-535SG, iRFP-RLuc8.6-535SG, or iRFP-ER-RLuc8.6SG were released from pcDNA 3.1(+) vector by NheI/XhoI restriction enzymes and subcloned into a respective enzyme-digested lentiviral vector named pHAGE-UBI-dTomato-CMV-MCS vector. The fidelity of the clones was confirmed with a genetic sequence analyzer (Applied Biosystems). Three-vector transfection system (pHAGE-UBI-dTomato-CMV-iRFP-RLuc-8.6SG, VPR, and VSVG) in HEK293T cells by adopting the calcium phosphate transfection method was used for producing lentivirus. The concentrated pure virus after titration was used to generate various stable cell lines by transduction. After three continuous passages, these cells were FACS sorted for clonal population of cells with uniform expression for the delivered reporter, and used for various experiments.
Studying the variation in the BRET efficiency of iRFP-linked RLuc8.6-535SG (d0-d8) according to the flexible linker lengths
Monkey kidney fibroblast-derived COS-7 cells were separately transfected with the pcDNA3.1(+) vectors encoding iRFP-linked RLuc8.6-535SG constructs (d0-d8) using a TransIT-LT1 transfection reagent (Takara, Osaka, Japan). The cells were incubated for 24 h and lysed with a lysis buffer (Promega, Madison, WI, USA). An aliquot of the cell lysate (4 µL) was mixed with 200 µL of phosphate buffered saline (PBS) containing 2 µM nCTZ in Röhren polystyrene tubes (Sarstedt, Nümbrecht, Germany). Initial BLI of nCTZ and its derivatives were immediately measured for the first one second with a Lumat LB 9507 luminometer (Berthold Technologies, Bad Wildbad, Germany).
Determination of bioluminescence intensities of the CTZ derivatives in cell lysates
The initial bioluminescence intensities (BLI) of all CTZ derivatives were determined against different variants of Renilla luciferase (RLuc, RLuc8, RLuc8.6-535, RLuc8SG and RLuc8.6-535SG). Monkey kidney fibroblasts, COS-7 cells cultured in a 24-well plate were transfected with different BL reporters using a TransIT-LT1 transfection reagent (Takara, Osaka, Japan). COS-7 cells were separately transfected with pcDNA3.1(+) encoding wild-type RLuc (pGL4.75) (Promega, Madison, WI, USA), RLuc8, RLuc8.6-535, RLuc8SG, or RLuc8.6-535SG and incubated for 44 h. The cells were then treated with lysis buffer (E291A) (Promega, Madison, WI, USA) and collected according to the manufacturer's protocol. An aliquot of the cell lysate (4 µL) was mixed with 200 µL phosphate buffered saline containing 2 µM nCTZ or the respective CTZ derivatives in R hren polystyrene tubes (Sarstedt, N
 mbrecht, Germany). Initial BLI of nCTZ and its derivatives were immediately measured for the first one second with a Lumat LB 9507 luminometer (Berthold Technologies, Bad Wildbad, Germany).
Evaluation of substrate dose dependency using purified RLuc8.6-535 protein
All CTZ derivatives were dissolved in methanol to prepare stock solution of 2 mM and diluted to appropriate concentration in neutral PBS buffer for each measurement. The affinity column-purified RLuc8.6-535 protein was suspended in PBS buffer (1 µg mL-1). An aliquot of the luciferase solution (50 µL) was transferred into a 96-well black frame optical-bottom microplate (Thermo Scientific, Waltham, MA, USA). The BL signals were determined every 1 second with an image analyzer (Lumazone FA with PIXIS 1024, Nippon Roper) equipped with an electron multiplying charged coupled cooled device (EM-CCD) camera, immediately after the simultaneous injection of CTZ solutions (50 µL) using an 8-channel micropipette. The 96-well black frame optical-bottom microplate was immediately set in the dark chamber of the Lumazon FA image analyzer. The first 5-second BL signal was taken as a measure of luciferase activity (the final CTZ concentrations were 0, 0.25, 0.5, 1, 2, 5, 10, and 20 µM, respectively; on the other hand, the final concentration of RLuc8.6-535 was 0.5 µg mL-1). The bioluminescence kinetic profiles (Km, Vmax and BL half decay) of luciferins were determined from the integrated values of the first 5-second BL signal and calculated by using GraphPad Prism software. The overall BL intensities of CTZ derivatives were determined by long-term integration (10 min) of luminescence intensities, which were generated by complete consumption of a low concentration of luciferins (0.25 µM) with excess amount of RLuc8.6-535.
Bioluminescence spectra measurement of CTZ derivatives
The BL spectra of all CTZ derivatives were determined with the lysates of cells transfected to express RLuc8, RLuc8.6-535, RLuc8SG or RLuc8.6-535SG. An aliquot of the lysate (4 µL) was mixed with 200 µL of PBS buffer containing 2  nCTZ or the respective CTZ derivatives in a microtube and set in the sample holder of a precision spectrophotometer (AB-1850 spectrophotometer, ATTO). BL spectra were measured in 1 nm increments from 350 to 780 nm using 5 seconds of integration time.
Bioluminescence intensity evaluation in live cells
The BLI of all CTZ derivatives were determined in HeLa or COS-7 cells expressing RLuc8.6-535SG. HeLa or COS-7 cells were sub cultured in a 96-well black frame optical-bottom microplate and transiently transfected with pcDNA3.1 (+) plasmids encoding RLuc8.6-535SG using a TransIT-LT1 transfection reagent (Takara, Osaka, Japan) and incubated for 24 h and 48 h, respectively. After removal of the cell culture medium, the cells were incubated with Hank's balanced salt solution (HBSS) (100 µL) and simultaneously mixed with HBSS buffer (100 µL) containing 20 µM nCTZ or the respective CTZ derivatives (final CTZ concentration: 10 µM). The 96-well black frame optical-bottom microplate was immediately set in the dark chamber of the Lumazon FA image analyzer (Nippon Roper), and the corresponding luminescence intensities from the plate were integrated every 30 seconds.
Bioluminescence imaging of living single mammalian cells using Microscope CCD-Camera
A BLI with single mammalian cells was performed using an Olympus DP30 Cooled Monochrome CCD Microscope Camera with a 100 objective lens. HeLa cells in glass bottom dishes were transfected with RLuc8.6-535SG and incubated at 37
 under 5% CO2 for 48 h. Cells were washed with HBSS and suspended in HBSS (100 µL) (covering the central glass bottom part of dish). BBlue2.3 in HBSS (100 µL, 20 µM) was added to the glass bottom dish (final concentration of luciferin: 10 µM) and BL was recorded for 2 secs integration time. The reference fluorescence microscopic images were obtained by exciting mCherry with 565 nm before addition of luciferins. The exposure time for FL images was 2 seconds.
Determination of the BL properties of living cells carrying RLuc8.6-535SG or iRFP-RLuc8.6-535SG
The BL properties of the living mammalian cells stably expressing RLuc8.6-535SG or iRFP-RLuc8.6-535SG were determined with respect to variations in the optical filters, BV supplementation, BL half decay rates, and luciferin concentration dependency. The stable cells were plated on 96-well black frame optical-bottom microplates and incubated up to 80% confluency. The cell media were changed with a DMEM medium supplemented with 5% FBS and 1% penicillin/ streptomycin (P/S) mixture, or with a DMEM medium supplemented with 5% FBS, 1% P/S, and 10 µM BV (final concentration). The microplates were incubated for 5 hours before BL measurements. The BL intensities were determined every 125 seconds with an IVIS optical imaging system with an open filter window or a Cy5.5 band-pass (BP) filter (695-770 nm) immediately after addition of varying concentrations of BBlue2.3 or Prolume Purple 2, which range from 10 - 40 µM.
Cell-based measurement of NIR-BRET with ligand-activatable probes
The NIR-BRET was first measured with MDA-MB231 cells stably expressing RLuc8.6-535SG or iRFP-RLuc8.6-535SG. The two types of cells were first plated in 96-well black frame optical-bottom microplates and incubated until the cells reached to a 90% confluence. The BL spectra were immediately determined after injection of a PBS solution dissolving BBlue2.3 (final concentration: 10 µM) with a precision spectrophotometer (AB-1850 spectrophotometer, ATTO). BL spectra were measured in 1 nm increments from 350 to 780 nm using 5 seconds of integration time.
The relative optical intensities in NIR region were further measured as follows: The MDA-MB231 cells were plated in 96-well black frame optical-bottom microplates and incubated until the cell reaches 90% confluence. The culture media were completely removed from the microplate and the cells on the wells were injected with an aliquot of the substrate solutions (50 µL) dissolving DBlueC, BBlue2.3, Prolume Purple, Prolume Purple 2, Prolume Purple 3, Prolume Purple 4, 6-pi-Phenyl-CTZ, or nCTZ (final concentration: 10 µM). The NIR BRET intensities were immediately acquired for 5 minutes using the IVIS Lumina optical imaging system with 1-10 sec integration time.
The ligand-driven variations in NIR BRET intensities were examined with the MDA-MB231 cells stably expressing iRFP-RLuc8.6-535SG or iRFP-ER-RLuc8.6SG. The cells were plated in a 96-well black frame optical-bottom microplate and incubated to be 90% confluence. The cell media were completely eliminated and the remained cells were simultaneously immersed with a substrate-ligand mixture, that is an aliquot (50 µL) of BBlue2.3 solution dissolving the vehicle (0.1% DMSO), 17β-estradiol (E2), 4-hydroxytamoxifen (OHT), Diarylpropiolnitrile (DPN), methyl-piperidino-pyrazole (MPP), Raloxifene (RAL), 4,4,4-(4-propyl-[1H])-pyrazole-1,3,5-triyl)trisphenol (PPT), or Tetrahydrochrysene (THC) (final concentration of ligands: 1 µM). The corresponding optical intensities were immediately determined with the IVIS Lumina optical imaging system and analyzed with Living Image ver. 4.5.
Determination of autoluminescence of selected substrates in BSA or FBS solutions
The autoluminescence properties of selected substrates were examined in the presence of bovine serum albumin (BSA) or fetal bovine serum (FBS). Fifty microliters of PBS, BSA (totally, 1 µg), 10% FBS, or 50% FBS were plated on each well of a 96-well black frame optical-bottom microplate. The solutions were then simultaneously mixed with selected substrates, DBlueC, BBlue2.3, or nCTZ, using a multichannel micropipette. The corresponding optical intensities were immediately integrated for 1 minute by acquiring in the IVIS Lumina optical imaging system. The signals were quantified using Living Image software by drawing region of interest (ROI) over the image.
Quantitative determination of mammalian cell numbers according to the substrates
Mammalian cell numbers were quantitatively evaluated using MDA-MB231 cells stably expressing iRFP-RLuc8.6-535SG. The original cells counting 20,000 were diluted every 2 folds by 10 with a PBS buffer on a 96-well black frame optical-bottom microplate to be 40 µL. After simultaneous injection of an aliquot of the designated substrate solutions (DBlueC, BBlue2.3, Prolume Purple, or Prolume Purple 2) with a multichannel pipette, the corresponding optical intensities were integrated with the IVIS optical imaging system with the open filter window.
Bioluminescence imaging in living animals
All animal handling was performed in accordance with Stanford University Institutional Animal Care and Use Committee guidelines (APLAC-26748) and by adherence to the NIH Guide for the Care and Use of Laboratory Animals. For determining the autoluminescence of selected substrates in living mice, BALB/c nude mice (nu/nu) purchased from Charles River were anesthetized by standard gas anesthesia method (2% isoflurane with oxygen flow of 0.8 to 1L/min) and intraperitoneally (i.p.) injected with 50 µg of nCTZ or BBLue2.3 in 100  saline cocktail supplemented with 35% poly ethylene glycol 400 (PEG400) and 10% ethanol (n=3). The corresponding supine images were obtained with Lago (Spectral Instruments Imaging) and analyzed with a specific image analyzing software (Aura ver 2.2.0).
For evaluating the tumor images according to the substrate, 5 million MDA-MB231 cells stably expressing fusion proteins RLuc8.6 or iRFP-RLuc8.6SG were implanted subcutaneously (s.c.) on either flank of the hind limbs of living nude mouse model (nu/nu) on Day 0. The mice were then housed in a cage for two weeks until the tumors grew to a size in the range 150 to 250 mm3. To image the tumors, the mice were anesthetized by standard gas anesthesia method (2% isoflurane with oxygen flow of 0.8 to 1L/min) and were i.p. injected with 50 of nCTZ, BBlue2.3, or DBlueC in 100 µl saline cocktail supplemented with 35% PEG400 and 10% ethanol (n=3). The corresponding BL images of the tumor xenografts were captured in prone or supine position with Lago (Spectral Instruments Imaging). To quantify the number of emitted photons, regions of interest (ROI) were drawn over the area of the tumors, and the maximum photons per second per square centimeter per steradian (p/sec/cm2/sr) generated by Aura (ver 2.2.0) were recorded.
The deep tissue permeability of the NIR BL signals in mouse models were similarly determined with MDA-MB231 cells stably expressing fusion proteins RLuc8.6SG or iRFP-RLuc8.6-535SG (n=5). The cells (5 105) in 100
  PBS were intravenously injected to NSG mouse model by tail vein. The mice were then housed in a cage for two weeks for the tumors to grow in different internal organs, majorly in the lungs. The tumors were then imaged after i.v. injection of 50
  of BBlue2.3, which was dissolved in the 100 µl saline cocktail (35% PEG400 and 10% ethanol) using Lago (Spectral Instruments Imaging using a 659 nm LP filter). The number of emitted photons were analyzed after drawing the regions of interest (ROI) over the area of the tumors, and normalized in p/sec/cm2/sr with the specific software, Aura (ver 2.2.0).
The corresponding lung tumor xenografts were imaged in the similar experimental procedure. The MDA-MB231 cells stably expressing RLuc8.6-535SG or iRFP-RLuc8.6-535SG were i.v. injected and housed in a cage for 2 weeks until the tumors in the lungs grow enough. The BL images were determined and analyzed in the same protocol as those of Figure 6A.
The corresponding ex vivo images were obtained 3 weeks later. The mice were sacrificed, from which the tumors on each flank, lungs and liver were extracted. The optical images were determined with Lago (Spectral Instruments Imaging) and analyzed with the specific software, Aura (ver 2.2.0).
Supplementary Material
Supplementary information available: Detailed synthetic producers and spectral characterization of new compounds; additional information on chemiluminescence and bioluminescence properties as noted in the text; docking simulation study; and summarized luminescence properties.
Acknowledgements
We thank Dr. Matteo Aldeghi and Dr. Masahito Ohue for helpful discussion about docking simulation. RLuc variants (RLuc8 and RLuc8.6-535) were generously gifted by Dr. Sanjiv S. Gambhir (Stanford University). This work was supported by the Japan Society for the Promotion of Science (JSPS), through grant numbers 17H01215, 26288088, 15KK0029, 16K14051, and 24225001. R.N. gratefully acknowledges the grant aid from a Research Fellowship program of JSPS for Young Scientists. We cordially acknowledge Lago Spectral Imaging Instruments for custom modifying the filter wheel with 659 nm LP filter and for the other technical assistance.
Author contributions statements
R.N., R.P. and S.B.K. wrote the main manuscript text, and prepared all the Figures. R.N., Y.H., N.I., S.N., D.C., and S.K. synthesized the CTZ derivatives. R.P., S.B.K., A.N., T.N., and M.S. synthesized the luciferase variants. E.Y. conducted the docking simulation. All authors reviewed the manuscript.
Competing Interests
The authors have declared that no competing interest exists.
References
1. Close DM, Xu TT, Sayler GS, Ripp S. In Vivo Bioluminescent Imaging (BLI): Noninvasive Visualization and Interrogation of Biological Processes in Living Animals. Sensors-Basel. 2011;11:180-206
2. Thorne N, Inglese J, Auldl DS. Illuminating Insights into Firefly Luciferase and Other Bioluminescent Reporters Used in Chemical Biology. Chem Biol. 2010;17:646-57
3. Prescher JA, Contag CH. Guided by the light: visualizing biomolecular processes in living animals with bioluminescence. Curr Opin Chem Biol. 2010;14:80-9
4. Ozawa T, Yoshimura H, Kim SB. Advances in Fluorescence and Bioluminescence Imaging. Anal Chem. 2013;85:590-609
5. Hoshino H, Nakajima Y, Ohmiya Y. Luciferase-YFP fusion tag with enhanced emission for single-cell luminescence imaging. Nat Methods. 2007;4:637-9
6. Kojima R, Takakura H, Ozawa T, Tada Y, Nagano T, Urano Y. Rational design and development of near-infrared-emitting firefly luciferins available in vivo. Angew Chem Int Ed. 2013;52:1175-9
7. Kuchimaru T, Iwano S, Kiyama M, Mitsumata S, Kadonosono T, Niwa H. et al. A luciferin analogue generating near-infrared bioluminescence achieves highly sensitive deep-tissue imaging. Nat Commun. 2016;7:11856
8. Loening AM, Wu AM, Gambhir SS. Red-shifted Renilla reniformis luciferase variants for imaging in living subjects. Nat Methods. 2007;4:641-3
9. Ohmiya Y. Basic and applied aspects of color tuning of bioluminescence systems. Jpn J Appl Phys. 2005;44:6368-79
10. Loening AM, Dragulescu-Andrasi A, Gambhir SS. A red-shifted Renilla luciferase for transient reporter-gene expression. Nat Methods. 2010;7:5-6
11. Yeh HW, Karmach O, Ji A, Carter D, Martins-Green MM, Ai HW. Red-shifted luciferase-luciferin pairs for enhanced bioluminescence imaging. Nat Methods. 2017;14:971-4
12. Saito K, Chang YF, Horikawa K, Hatsugai N, Higuchi Y, Hashida M. et al. Luminescent proteins for high-speed single-cell and whole-body imaging. Nat Commun. 2012;3:1262
13. Suzuki K, Kimura T, Shinoda H, Bai GR, Daniels MJ, Arai Y. et al. Five colour variants of bright luminescent protein for real-time multicolour bioimaging. Nat Commun. 2016;7:13718
14. Takai A, Nakano M, Saito K, Haruno R, Watanabe TM, Ohyanagi T. et al. Expanded palette of Nano-lanterns for real-time multicolor luminescence imaging. Proc Natl Acad Sci U S A. 2015;112:4352-6
15. Nishihara R, Suzuki H, Hoshino E, Suganuma S, Sato M, Saitoh T. et al. Bioluminescent coelenterazine derivatives with imidazopyrazinone C-6 extended substitution. Chem Commun. 2014;51:391-4
16. Filonov GS, Piatkevich KD, Ting LM, Zhang JH, Kim K, Verkhusha VV. Bright and stable near-infrared fluorescent protein for in vivo imaging. Nat Biotechnol. 2011;29:757
17. Yu D, Gustafson WC, Han C, Lafaye C, Noirclerc-Savoye M, Ge WP. et al. An improved monomeric infrared fluorescent protein for neuronal and tumour brain imaging. Nat Commun. 2014;5:3626
18. Rumyantsev KA, Turoverov KK, Verkhusha VV. Near-infrared bioluminescent proteins for two-color multimodal imaging. Sci Rep. 2016;6:36588
19. So MK, Xu CJ, Loening AM, Gambhir SS, Rao JH. Self-illuminating quantum dot conjugates for in vivo imaging. Nat Biotechnol. 2006;24:339-43
20. Yao HQ, Zhang Y, Xiao F, Xia ZY, Rao JH. Quantum dot/bioluminescence resonance energy transfer based highly sensitive detection of proteases. Angew Chem Int Ed. 2007;46:4346-9
21. Dwyer CL, Diaz SA, Walper SA, Samanta A, Susumu K, Oh E. et al. Chemoenzymatic Sensitization of DNA Photonic Wires Mediated through Quantum Dot Energy Transfer Relays. Chem Mater. 2015;27:6490-4
22. Hall MP, Woodroofe CC, Wood MG, Que I, van't Root M, Ridwan Y. et al. Click beetle luciferase mutant and near infrared naphthyl-luciferins for improved bioluminescence imaging. Nat Commun. 2018;9:132
23. Chernov KG, Redchuk TA, Omelina ES, Verkhushaa VV. Near-Infrared Fluorescent Proteins, Biosensors, and Optogenetic Tools Engineered from Phytochromes. Chem Rev. 2017;117:6423-46
24. Nishihara R, Abe M, Nishiyama S, Citterio D, Suzuki K, Kim SB. Luciferase-Specific Coelenterazine Analogues for Optical Contamination-Free Bioassays. Sci Rep. 2017;7:908
25. Nishihara R, Hoshino E, Kakudate Y, Kishigami S, Iwasawa N, Sasaki S. et al. Azide- and Dye-Conjugated Coelenterazine Analogues for a Multiplex Molecular Imaging Platform. Bioconjugate Chem. 2018;29:1922-31
26. Woo JC, Howell MH, Von Arnim AG. Structure-function studies on the active site of the coelenterazine-dependent luciferase from Renilla. Protein Sci. 2008;17:725-35
27. Matthews JC, Hori K, Cormier MJ. Substrate and Substrate Analog Binding Properties of Renilla Luciferase. Biochemistry. 1977;16:5217-20
28. Bennion BJ, Be NA, McNerney MW, Lao V, Carlson EM, Valdez CA. et al. Predicting a Drug's Membrane Permeability: A Computational Model Validated With in Vitro Permeability Assay Data. J Phys Chem B. 2017;121:5228-37
29. Pichler A, Prior JL, Piwnica-Worms D. Imaging reversal of multidrug resistance in living mice with bioluminescence: MDR1 P-glycoprotein transports coelenterazine. Proc Natl Acad Sci U S A. 2004;101:1702-7
30. Iwano S, Sugiyama M, Hama H, Watakabe A, Hasegawa N, Kuchimaru T. et al. Single-cell bioluminescence imaging of deep tissue in freely moving animals. Science. 2018;359:935-9
31. Kim SB, Ozawa T, Watanabe S, Umezawa Y. High-throughput sensing and noninvasive imaging of protein nuclear transport by using reconstitution of split Renilla luciferase. Proc Natl Acad Sci U S A. 2004;101:11542-7
32. Kapitulnik J, Maines MD. The role of bile pigments in health and disease: effects on cell signaling, cytotoxicity, and cytoprotection. Front Pharmacol. 2012:3
33. Lohse MJ, Nuber S, Hoffmann C. Fluorescence/Bioluminescence Resonance Energy Transfer Techniques to Study G-Protein-Coupled Receptor Activation and Signaling. Pharmacol Rev. 2012;64:299-336
34. Giuliani G, Molinari P, Ferretti G, Cappelli A, Anzini M, Vomero S. et al. New red-shifted coelenterazine analogues with an extended electronic conjugation. Tetrahedron Lett. 2012;53:5114-8
35. Shimomura O. Bioluminescence. Singapore: World Scientific Publishing Co. Pte. Ltd. 2006
36. Paulmurugan R, Gambhir SS. An intramolecular folding sensor for imaging estrogen receptor-ligand interactions. Proc Natl Acad Sci U S A. 2006;103:15883-8
37. Kim SB, Umezawa Y, Kanno KA, Tao H. An integrated-molecule-format multicolor probe for monitoring multiple activities of a bioactive small molecule. ACS Chem Biol. 2008;3:359-72
38. Remy I, Michnick SW. A highly sensitive protein-protein interaction assay based on Gaussia luciferase. Nat Methods. 2006;3:977-9
39. Zhao H, Doyle TC, Wong RJ, Cao Y, Stevenson DK, Piwnica-Worms D. et al. Characterization of coelenterazine analogs for measurements of Renilla luciferase activity in live cells and living animals. Mol Imaging. 2004;3:43-54
40. Dacres H, Wang J, Dumancic MM, Trowell SC. Experimental Determination of the Forster Distance for Two Commonly Used Bioluminescent Resonance Energy Transfer Pairs. Analytical Chemistry. 2010;82:432-5
41. Dacres H, Michie M, Wang J, Pfleger KDG, Trowell SC. Effect of enhanced Renilla luciferase and fluorescent protein variants on the Forster distance of Bioluminescence resonance energy transfer (BRET). Biochem Biophys Res Comm. 2012;425:625-9
42. Machleidt T, Woodroofe CC, Schwinn MK, Mendez J, Robers MB, Zirnmerman K. et al. NanoBRET-A Novel BRET Platform for the Analysis of Protein-Protein Interactions. ACS Chem Biol. 2015;10:1797-804
Author contact
![]() Corresponding authors: suzukikeio.ac.jp; kimu-sbgo.jp
Corresponding authors: suzukikeio.ac.jp; kimu-sbgo.jp