Impact Factor
 Global reach, higher impact
Theranostics 2019; 9(12):3555-3564. doi:10.7150/thno.31811 This issue Cite
Research Paper
Laser brain cancer surgery in a xenograft model guided by optical coherence tomography
Nitesh Katta1, Arnold D Estrada1 ![]() , Austin B McElroy1, Aleksandra Gruslova2, Meagan Oglesby2, Andrew G Cabe2, Marc D Feldman2, RY Declan Fleming1, Andrew J Brenner2, Thomas E Milner1
, Austin B McElroy1, Aleksandra Gruslova2, Meagan Oglesby2, Andrew G Cabe2, Marc D Feldman2, RY Declan Fleming1, Andrew J Brenner2, Thomas E Milner1
1. University of Texas at Austin
2. University of Texas Health Science Center at San Antonio
Received 2018-11-26; Accepted 2019-4-24; Published 2019-5-26
Abstract

Higher precision surgical devices are needed for tumor resections near critical brain structures. The goal of this study is to demonstrate feasibility of a system capable of precise and bloodless tumor ablation. An image-guided laser surgical system is presented for excision of brain tumors in vivo in a murine xenograft model. The system combines optical coherence tomography (OCT) guidance with surgical lasers for high-precision tumor ablation (Er:YAG) and microcirculation coagulation (Thulium (Tm) fiber laser).
Methods: A fluorescent human glioblastoma cell line was injected into mice and allowed to grow four weeks. Craniotomies were performed and tumors were imaged with confocal fluorescence microscopy. The mice were subsequently OCT imaged prior, during and after laser coagulation and/or ablation. The prior OCT images were used to compute three-dimensional tumor margin and angiography images, which guided the coagulation and ablation steps. Histology of the treated regions was then compared to post-treatment OCT images.
Results: Tumor sizing based on OCT margin detection matched histology to within experimental error. Although fluorescence microscopy imaging showed the tumors were collocated with OCT imaging, margin assessment using confocal microscopy failed to see the extent of the tumor beyond ~ 250 µm in depth, as verified by OCT and histology. The two-laser approach to surgery utilizing Tm wavelength for coagulation and Er:YAG for ablation yielded bloodless resection of tumor regions with minimal residual damage as seen in histology.
Conclusion: Precise and bloodless tumor resection under OCT image guidance is demonstrated in the murine xenograft brain cancer model. Tumor margins and vasculature are accurately made visible without need for exogenous contrast agents.
Keywords: Optical Coherence Tomography, laser ablation, image-guided surgery, brain cancer
Introduction
Considering the critical significance of cell-sized brain structures, a need exists for surgical tools and procedures that provide sub-millimeter imaging and cutting during intracranial tumor removal. Factors that currently limit surgical practice include relatively large non-specific damage footprints and a lack of intraoperative, depth-resolved image guidance with micron-level resolution. Recent advances in optical tomographic imaging [1-5] and fiber laser technology [6-8] can improve surgical access and precision with devices that address both imaging and cutting limitations.
OCT is a label-free, three-dimensional imaging modality that allows for visualization of intrinsic optical scattering properties of tissue [9-11]. OCT has a tissue penetration depth of 2 mm with cellular-level depth resolution (5-10 μm). Swept-source OCT systems, coupled with GPU data processing, are capable of displaying tomograms (10-20 mm3) in seconds [12, 13], providing a quasi-real-time, intraoperative imaging tool. OCT has been demonstrated as an effective high-resolution, intra-vital imaging tool applied to excised human tissue samples and in vivo pre-clinical models [5, 14, 15]. In addition to standard structural images, by recording temporal tissue scattering changes, OCT can display high-resolution and high-contrast angiography images without exogenous contrast agents [14, 16-19]. Furthermore, by characterizing optical attenuation, texture or birefringence, OCT has successfully imaged tumor margins in excised human brain cancer specimens as well as in live xenograft mouse models without exogenous contrast agents [4, 5, 20-24]. The combination of high-speed angiography and tumor margin detection make OCT a leading candidate imaging modality for intraoperative surgical guidance during resection. The high spatial resolution and speed of OCT can provide neurosurgeons a detailed moment-by-moment tomographic image during tumor excision. Such real-time guidance may be complementary to more conventional intraoperative imaging platforms such as magnetic resonance imaging (MRI) and X-Ray computed tomography (CT), whose limited resolution and slow image acquisition times prevent visualization of small changes in tissue shape and position that occur during tumor excision.
Although precision of conventional surgical procedures that rely on electrocautery for coagulation and hemostasis has improved over the last decades [25, 26], collateral damage zones as large as a few millimeters are common. Laser-based surgical methods potentially offer many improvements over the existing art for precise ablation and blood vessel coagulation. Specifically, infrared laser sources allow for fiber-delivery, high rates of tissue removal and are decreasing in cost. Because emission wavelength (2.94 μm) of Er:YAG laser radiation coincides with a peak in water absorption [27], tumor ablation is highly energy efficient [28] and spatially confined [29, 30]. However, Er:YAG lasers are not utilized for surgery in general (outside of dermatological cosmetic resurfacing) and are not a viable candidate for coagulation of the cerebral microcirculation.
Recently, researchers have reported experiments demonstrating image-guided laser surgical concepts. Of particular interest here are Chang, F-Y's work [31] on combining OCT feedback with laser coagulation in murine models and Fan, Y's work [32] on using OCT feedback to guide ex vivo ablation of porcine brain tissue samples. In this report, we demonstrate enhanced in vivo surgical imaging and cutting using a new surgical platform that combines optical coherence tomography (OCT) image guidance with thulium (Tm) laser blood vessel coagulation and erbium (Er:YAG) laser brain tumor ablation. The two-laser approach overcomes competing requirements of precise ablation and coagulation of in vivo cerebral microcirculation. The absorption depth of Tm laser light in tissue (125 μm) can coagulate the majority of murine brain blood vessels [14] while still providing a tight non-specific thermal damage margin [28, 33].
The combination of OCT imaging, Tm coagulation and Er:YAG laser ablation can improve surgeries by removing brain tumors while sparing adjacent normal structures, and preventing bleeding that can obscure the operative field. OCT image guidance can not only allow for tumor visualization [9-11, 34], but also provide angiography [14, 16-18, 35] and tumor margin location [5, 12, 14, 21-24, 36, 37] to the neurosurgeon. In addition to positional guidance before ablation, real-time OCT imaging of tissue response during ablation can allow radiant energy titration to minimize non-specific brain damage. We present a feasibility study demonstrating capabilities of an image-guided surgical system in an in vivo brain cancer xenograft murine model for resecting tumors that provides label-free imaging of vasculature and margins and can guide precise coagulation and bloodless tumor resection.
Methods
A benchtop OCT-guided laser surgical system was utilized to image and then remove brain tumors from a xenograft murine cancer model. Brain tumors and the surrounding vasculature were first imaged using a commercial fluorescent microscope and then by a custom benchtop OCT imaging system. After tumor pre-imaging, vasculature was coagulated and brain tumors were laser-ablated under OCT guidance.
In vivo brain cancer model
Human glioma tumor cells (U251-luc-RFP) were maintained as neurospheres in neurobasal media (GIBCO) with supplements. Cells express firefly luciferase and red fluorescent protein (RFP) as tumor biomarkers. Prior to intracranial implantation, neurospheres were dispersed with accutase (MP Biomedicals) and resuspended to a final concentration of 2x10⁴ cells/μL. Tumors were allowed to grow for four weeks before laser treatment experiments.
All animal experiments were performed following a protocol that adheres to the National Institutes of Health Guide for the Care and Use of Experimental Animals. Athymic nude mice (Harlan Labs) were anesthetized and placed onto a cranial stereotaxic stage and administered dexamethasone (0.02 ml at 4 mg/ml) and carprofen (4 mg/kg of a 50 mg/ml solution) by intramuscular injection preoperatively. The scalp was retracted to expose the bregma and the periosteum was covered with a lidocaine solution for hemostasis during scraping. The periosteum was gently scraped with a scalpel to expose the cranium and the surface dried. Using a high-speed micro-drill (0.5 mm, Stoelting Co), the cranium was thinned in a 4.5 mm diameter circumference of skull region overlying the brain area of interest and the bone was gently removed. A suspension (5 μL) containing 105 U251 cells was stereotactically injected into the mouse brain at a depth of 1 mm below the dura using a 10 μL Hamilton microsyringe. A round cover slip (5 mm diameter, No. 1 thickness) was positioned to cover the open-skull region and sealed with a thin layer of cyanoacrylate glue and dental acrylic (Ortho-Jet).
Bench-Top OCT guided laser surgery system
The bench-top image-guided surgical apparatus consisted of three major subsystems: (1) OCT imaging system; (2) Tm fiber laser for coagulation/hemostasis; and (3) a fiber-coupled, pulsed Er:YAG laser for tissue ablation. Each subsystem was independently triggered so that OCT image data could be recorded before, during or after either Tm or Er:YAG laser irradiation. The system allowed positioning of the mouse brain in the incoming beam during imaging and surgery using an XYZ micro-positioner.
OCT System: The OCT system utilized a swept-source, mode-locked laser (Axsun, Billerica MA) with emission at 1310±70 nm and a scan-rate of 100kHz. Laser output was coupled into a fiber-optic (SMF-28) Mach-Zehnder interferometer with pathlength and dispersion matched sample and reference paths. Sample path light was directed onto two galvanometer mirrors positioned in a telecentric configuration (Figure 1) with an aspheric ZnSe scanning lens (AR112-ZC-XWL-25-25, ISP Optics). Light backscattered from the sample and reflected from the reference mirror interfered and was directed onto balanced detectors (BD). Recorded tomograms (512 × 512 × 369 voxels) had a maximum field of view (FOV) of 3.5 × 3.5 × 3 mm3 with a longitudinal spatial resolution (depth dimension) of 6.75 μm (in air).
Benchtop OCT guided laser surgery system with co-aligned Tm/Er beams. A Mach-Zehnder fiber Interferometer uses circulators (CR) and balanced detection (BD) and is dispersion compensated (CM). Tm/Er and OCT beams are fiber delivered via reflective collimators (RC) and combined with di-chroic mirrors (DM).
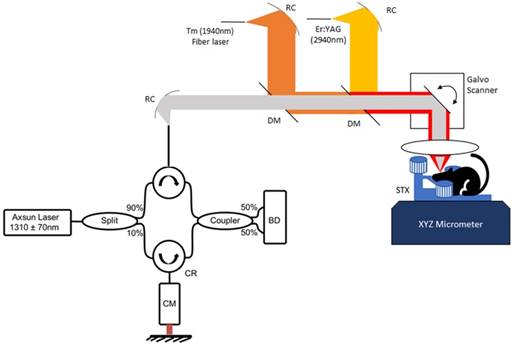
Tm fiber laser: A Tm fiber laser (Nufern, NUQA-1940-NA-0015F-0) configurable for either mode-locked or CW operation was used for coagulation/hemostasis. For coagulation, the laser was operated in CW mode with variable average power (max 15W). Light emitted from the laser was collimated (RC08 Thorlabs) and directed onto a di-chroic mirror (DM, DMSP1500, Thorlabs) to combine Tm and OCT beams. A weak concave defocusing lens was positioned between the di-chroic and collimator to increase Tm spot size on the brain to 350 μm.
Er:YAG laser: A compact (30 × 32 × 25 mm3) diode-pumped Er:YAG laser (Pantec, DPM50) with variable pulse energy (20-500 mJ), duration (50-500 μs) and repetition rate (5-200 Hz) was utilized for cutting and removing tissue. Er:YAG light emitted from the laser was coupled into a Ge glass fiber (Infrared Fiber Systems). Er:YAG laser light emitted from the fiber was collimated (RC12 Thorlabs) and directed onto a di-chroic mirror (DMEr2940, RMI Optics) to combine with the OCT beam and directed onto the telecentric scanning system. Er:YAG laser light was focused to a 250 μm diameter spot to give a fluence exceeding threshold for tissue ablation (0.7 J/cm2) with minimal thermal damage [30, 38-40] (see supporting data).
Tumor Imaging
Fluorescent Microscopy: For all mice, confocal fluorescence images were recorded one day prior to OCT imaging and laser surgery. During continuous isoflurane inhalation the anesthetized mouse's head was stabilized using a custom-built microscope stage. Newly formed brain tumors were evaluated through the cranial window. Z-stacks were obtained from two fluorescence channels to image vasculature and tumor cells. To visualize brain blood vessels, green fluorescent protein (GFP)-conjugated dye (FITC-dextran, 10 mg/ml) was injected into the tail vein. Red fluorescent protein (RFP) allowed tumor cell (U251) visualization. A Z-stack (83 frames) of confocal fluorescence images (512 × 512) was recorded (3 μm step) using a Nikon Eclipse FN-1 microscope (10x objective) with Prairie View hardware and software using excitation wavelengths for GFP (488nm) and RFP (542 nm). To image the viewable brain area, four 250 μm Z-stacks (3 μm step, 512 x 512 pixel frame size) were acquired from adjacent locations. After acquisition, images were merged (ImageJ) into a final Z-stack with lateral extent overlapping the cranial window (2.5 × 2.5 mm2).
OCT Angiography: OCT angiography techniques detect the temporal shift in red blood cell (RBC) position and derive volumetric flow images from decorrelation of analytic signal interferograms. A modified version of an A-scan amplitude decorrelation technique previously reported [18, 19] was developed that quantifies the average degree of decorrelation in an A-scan window. For adequate contrast, A-scan sampling times must be longer than expected decorrelation times of moving RBCs. Although exceptionally detailed and high contrast angiography images can be generated [14], these require longer imaging times (~10s of minutes) than is practical for some surgical procedures. Angiography images with good flow contrast were obtained by recording pairs of consecutive B-scans separated by 5-7 ms. Eight B-scans were acquired for all 512 rows of the tomogram, resulting in seven B-scan decorrelation pairs that were averaged to improve signal-to-noise-ratio (SNR) of angiography images. The amplitude decorrelation algorithm reported previously [18, 19] was modified by performing an averaging step before decorrelation, whereby neighboring optical frequencies of the OCT A-scan interferogram were averaged to further improve SNR. Although intra-A-scan averaging reduces the scan range, imaging depth is limited in most tissues by light attenuation. Thus, angiography SNR enhancement was obtained with negligible loss in image resolution, depth, or acquisition time (see supporting information). The angiography computation was implemented on a GPU (RX-480P8DFA6 AMD), to obtain an angiogram within 90 seconds of acquisition.
OCT Tumor Imaging: We implemented an approach analogous to Kut et al [5] and converted recorded OCT signals to attenuation coefficient images to locate tumor margins. A method first reported by Vermeer et al [41] was followed to convert OCT signals to attenuation coefficient data avoiding use of a calibration phantom. Unlike Vermeer, all 8 B-scan repeats acquired for angiography were averaged prior to calculation of the attenuation coefficient to improve SNR. Once volumetric attenuation coefficient images were calculated, a threshold was applied to give a binary image in which voxels below an attenuation threshold (5.7 mm-1) were assigned a value of 1 (classified as cancerous) and all other voxels were given a value of 0. The threshold attenuation coefficient was selected to give reasonable contiguous tumor regions and resulted in a value within 3% to that used by Kut et al [5] (5.5 mm-1). Edge-detection and fill operations were performed on tumor binary images to fill regions classified as non-cancerous (0) but surrounded by cancer voxels (1) (See supplemental information).
Image-guided tumor coagulation and ablation
The surgical workflow consisted of an initial OCT imaging step, a series of image-guided Tm coagulations, a series of image-guided Er:YAG ablations and a post-ablation imaging step. To ensure bloodless cutting, Tm laser spot size (350 μm) was larger than that for Er:YAG (250 μm) radiation. Once an OCT image dataset was acquired, angiography and attenuation coefficient images were computed and displayed. Target coagulation locations were outlined using in-house custom software so that Tm laser radiation could be applied for coagulation. The coagulation region was selected to completely encompass the targeted tissue ablation volume so that a sufficient margin (lateral and depth) was obtained for bloodless Er:YAG laser ablation. Post-coagulation OCT angiography images were recorded to ensure the desired coagulation volume had been achieved. The optimal Tm laser power and exposure duration for these experiments were empirically determined to be 180 mW and 480 ms (approximately 24x axial thermal relaxation time) to achieve a coagulation depth of about 500 μm. The Er:YAG laser was operated with a pulse duration of 150 μs and a pulse energy of 37 mJ and delivered to the selected tissue region with concurrent OCT image guidance. A B-scan was recorded through the center of the cut tissue immediately after Er:YAG laser ablation. If deeper cutting was required, the brain was raised into the beam (Z-translation) to treat successively deeper brain regions. Although cut tissue was always within a larger pre-coagulated region, to further ensure bloodless ablation, the Tm laser emitted light (180 mW) during Er:YAG ablation. Rationale for dual wavelength emission during cutting was that if ablation resulted in micro-bleeding, Tm laser radiation would immediately cause hemostasis.
Histological processing
After OCT imaging and laser tumor resection, mice were euthanized and brains formalin fixed, removed from the cranium, cut into horizontal or coronal sections, and histologically processed as hematoxylin and eosin (H&E) stained slides. Slides were then co-registered to OCT images recorded before and after surgical resection. Co-registration between histology and OCT was similar to that reported previously [42, 43] and allowed for image analysis to be performed with confidence on brain cancer tumor and margins.
Results
Angiography and tumor margin imaging
A maximum intensity Z-projection of a fluorescence confocal microscopy image (mouse #1, Panel A in Figure 2) starting from the cortex (250 μm deep) shows vasculature (green) and tumor regions (red). A maximum intensity projection of OCT angiography combined with a thresholded attenuation coefficient (5.7 mm-1) shows tumor (green) and vasculature (red) regions (Panel B of Figure 2). The blue outlined box (Panel B) circumscribes a region with a low attenuation coefficient presumed to be tumor.
A) Confocal fluorescence microscopy Z-projection (cortical surface - 250 µm) of mouse #1. Cancer cells expressing RFP (red) and vasculature (green) are visible. B) OCT angiography (red) and attenuation coefficient less than 5.7 mm-1 (green) Z-projections (cortical surface - 2 mm) of mouse #1. C) Histology of 5 µm thick transverse section located 550 µm from cortical surface. D) Confocal fluorescence microscopy Z-projection (cortical surface - 250 µm) of mouse #2. E) OCT angiography (red) and attenuation coefficient less than 5.7 mm-1 (green) Z-projections (cortical surface - 2 mm) of mouse #2. F) B-scan (horizontal line in Panel E) with tumor regions (blue) indicated where attenuation coefficient is less than 5.7 mm-1. Note different scale bars.
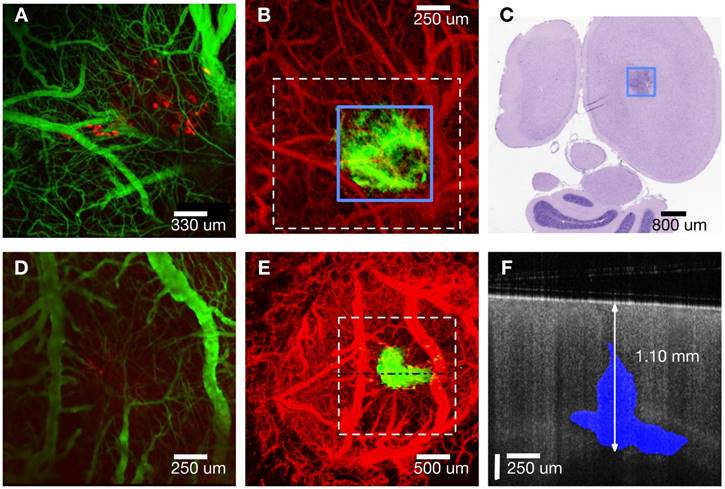
Vascular features in OCT angiography generally match green regions in fluorescence confocal microscopy images. Tumor visible in the OCT Z-projection (green, Panel B) is co-located but larger than cancer regions (red) visible in the fluorescence confocal microscopy image (Panel A). Bulks of induced tumor masses were observed between 0.3 - 1.5 mm in depth (as confirmed by histology) and were therefore not fully visible by confocal fluorescence microscopy that has a limited imaging depth (250 μm). A 5 μm thick transverse tissue section (H&E stain) of the cortex (mouse #1) at 0.55 mm below the cortical surface (Panel C in Figure 2) reveals a region (black box) with higher density of nuclei, indicative of the tumor. Tumor width estimated from histology at this depth was 0.81 ± 0.2 mm and is consistent with that determined using OCT (0.75 ± 0.1 mm). Additionally, the tumor extended to a depth of 1.15 ± 0.2 mm estimated using histology and 1.30 ± 0.1 mm using OCT (image not shown). Analogous maximum intensity projections of fluorescence and OCT-derived angiography and attenuation coefficient Z-stacks for mouse #2 (Panels D and E of Figure 2) show similar features as those for mouse #1. An OCT intensity B-scan (Panel E, dashed horizontal line) indicates tumor regions (attenuation coefficient less than 5.7 mm-1) in blue (Panel F). See figure S3 in supplemental information for further description of how OCT intensity and thresholded attenuation images were combined to create tumor margin overlay in Panel F. Full tumor depth is observed in OCT images but not in those derived from fluorescence confocal microscopy (Panel F, Figure 2). OCT volumetric imaging in all mice indicates a small portion of the tumor consistently (n = 5/5) grows upwards into the needle track while the bulk mass grows along the corpus callosum and hippocampus boundary. Fluorescent tumor cells (red in panels A and D) appear to have grown up into the needle track and are sufficiently close to be within imaging depth (250 μm) of the confocal fluorescence microscope.
Precise coagulation with image Guidance
To demonstrate OCT imaging feedback to guide laser surgery, we performed controlled coagulation of targeted cortical tumor vasculature. Coagulation of regions of vasculature adjacent to the tumor were done as a means to reduce perfusion to the tumor area prior to ablation. Additionally, tumor coagulation treatments are commonly performed clinically in association with tumor biopsies to prevent bleeding [44]. The process consisted of a pre-treatment OCT imaging step to visualize tumor and associated vasculature, delivery of Tm laser energy for coagulation, followed by OCT angiography to verify blood flow stoppage. The process was sometimes repeated to confirm blood flow stoppage.
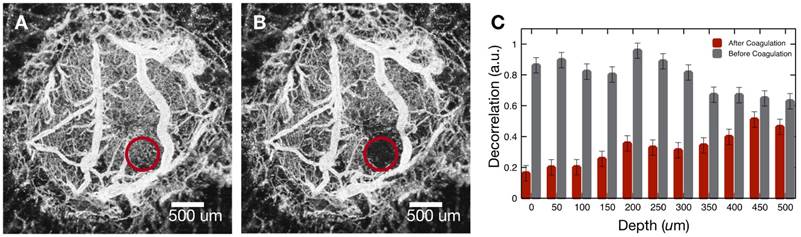
Brain tumor in mouse #2 was imaged (Figure 2E) and vasculature coagulated (Figure 3). A maximum intensity projection (Panel A) shows the targeted vasculature (red circle) prior to coagulation. An angiography image (Panel B) recorded after coagulation indicates blood flow stoppage in the targeted region. To investigate coagulation depth, Z-dependent average decorrelation was computed within the highlighted region to find hemostasis extends to a depth of about 500 μm (Panel C). Examining difference between pre- and post-coagulation angiography reveals shape of the coagulated region is conical and pointed into the tissue (Supplemental Figure S7). Cone apex angle matches numerical aperture (26 degrees) of the incident Tm beam.
A) Maximum intensity projection of OCT angiography data before coagulation (mouse #2). B) Maximum intensity projection of OCT angiography data after coagulation (mouse #2). C) Decorrelation values of highlighted region before (grey) and after (red) coagulation.
Precise laser ablation with OCT guidance
To test margin identification and ability to precisely ablate a selected tissue region, a portion of the tumor was targeted for removal. Pre-operative margin detection accuracy is presented above (Figure 2). By leaving some tumor mass in the mouse, margin detection capability during treatment could be estimated by comparing remaining tumor size determined by OCT to that indicated by histology. Tumor margin visualization is critical for planning any subsequent coagulation and/or cutting steps.
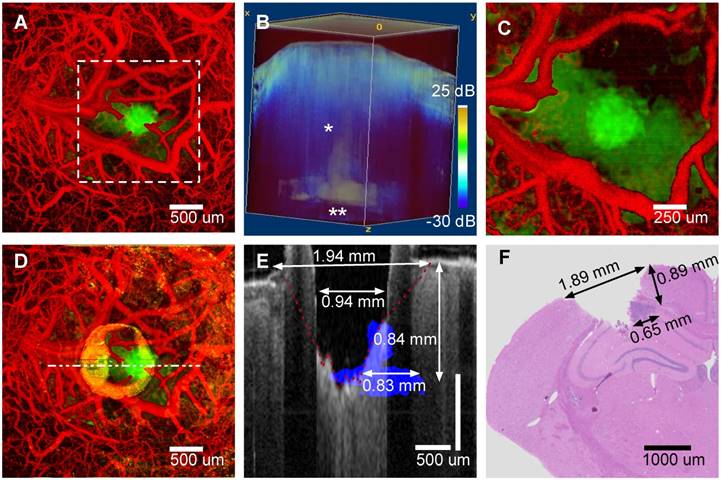
An image-guided tumor ablation (mouse #4) is presented (Figure 4). A maximum intensity projection (Panel A) shows vasculature (red) and tumor regions (green) before treatment. A three-dimensional rendering (Panel B) of attenuation coefficient threshold mask (white, attenuation coefficient less than 5.7 mm-1) overlaid on OCT intensity (blue) was utilized to guide surgical ablation. Tumor glioma cells populate the needle track (Panel B, single asterisk) and along the corpus callosum and hippocampus boundary (Panel B, double asterisk). A characteristic slender tumor region in the needle track and a wider region along the corpus callosum/hippocampus was observed in all mice (5/5) imaged. After initial angiography and tumor margin imaging, a Tm laser coagulation step was performed directly over the tumor. All surface blood vessels that fed the tumor were coagulated (Panel C). After angiographic confirmation of blood flow stoppage, a series of ablation, imaging and Z-translation steps were repeated directly over and centered on the needle track. Initially, to verify proper ablation, a single Er:YAG laser pulse (150 μs and 37 mJ) was administered immediately followed by OCT cross-sectional imaging. With proper ablation verified, groups of seven Er:YAG laser pulses were delivered (1 Hz repetition rate) to remove a layer of tissue (approximately 125 μm) without bleeding, so that the surgical field remained visible. Occasionally a small coagulum would form at the newly formed ablation crater bottom, however, this coagulum never ruptured and tissue cutting was bloodless. Vasculature prior to treatment and tumor remaining after ablation are displayed in the maximum intensity projection of the pre-coagulation angiography and a post-ablation attenuation coefficient images (Figure 4, Panel D). Residual damage after cutting is observed (Panel D) as a ring of increased attenuation around the ablation crater corresponding to a rim of raised tissue (Panel E, B-scan through ablation crater center). Both ablation crater and residual damage zone are visible (Panel E) in the tumor portion intentionally not ablated. Visual inspection revealed a raised rim region around the ablation crater represented by desiccated and lightly carbonized tissue. Width of the raised, desiccated rim increased as deeper regions were ablated (see discussion section). Residual thermal damage (yellow in Panel D) and raised surface regions bordering the ablation crater (Panel E) are missing in histology (Panel F). The raised rim of residual damage was likely structurally weakened and unintentionally sloughed off during histological processing. The desiccated zone near the tissue surface produced a shadowing artifact (Panel E). A conical form is observed in the shadow that we believe is the interface (Panel E, red dashed line) between viable and damaged tissue. The ablation crater diameter, within the residual damage zone, measured via OCT was 940 ± 100 μm. The ablation crater diameter, within the viable zone measured via OCT was 1940 ± 200 μm. The ablation diameter measured via histology (Panel F) was 1890 ± 200 μm. Tumor regions not ablated (Panel E, blue) are also visible as an area of increased nuclear density in the histology section (Panel F, dark purple). Depth (840 ± 100 μm) and width (830 ± 100 μm) of the non-ablated tumor region measured via OCT are comparable to values determined from histology (depth: 890 ± 100 μm and width: 650 ± 100 μm).
A) OCT Z-projection (cortical surface - 2.5 mm) of mouse #4 prior to treatment indicating vasculature (red) and tumor (green, attenuation coefficient less than 5.7 mm-1). B) Volumetric view with tumor regions (white, attenuation coefficient less than 5.7 mm-1) overlaid on OCT intensity (blue). C) Same maximum intensity projection as A, after coagulation. D) Same maximum intensity projection as A and C after ablation. E) Post-ablation B-scan (gray) with pre-ablation tumor margin (blue) superposed. F) H&E stained coronal histological section in region where B-scan Panel E) was recorded.
Discussion
We have presented a light-based system that can perform image-guided brain cancer surgery with neither bleeding nor obscuration of the surgical field. The system incorporates a bench-top OCT imaging system with coaligned coagulation and ablation beams. Combined use of coagulation and ablation beams together with OCT angiography enabled precise ablation without bleeding. Since Er:YAG laser wavelength (2.94 μm) is close to the water absorption peak, precise tumor ablation with minimal non-specific thermal damage is possible. Penetration depth of Tm laser light (1.94 μm) is well suited to coagulate vessels with diameters less than 100 μm while still offering good spatial precision. Visualization of tumor and surrounding vasculature without use of exogenous contrast agents is demonstrated with good spatial resolution (finer than 10 μm) and imaging times of about ninety seconds. The system and experiments were designed as a proof-of-concept for a new class of image-guided micro-surgical tools uniquely suited for tumor removal near critical brain areas where extreme surgical precision is desired to prevent collateral damage of surrounding normal brain tissue.
Tumor locations obtained from OCT attenuation coefficient imaging matched values determined by histology. Due to the 10-fold shallower imaging depth of confocal fluorescence microscopy, OCT imaged much deeper and more accurately depicted the entire tumor volume. We tested the system's tumor margin accuracy before and after ablation and demonstrated accurate quantification of the initial tumor volume compared to histology. Collateral thermal damage caused by the ablation process was visible as an increase in tissue scattering adjacent to the ablated region. Numerical aperture of the ablation beam limited the ability to perform deep, high aspect ratio cuts without a residual thermal damage zone present above the focal plane. Observed residual thermal damage zones were conical in shape (largest diameter at the surface) and appeared lightly carbonized. Apex angle of the damaged area matched the ablation beam numerical aperture.
Viable normal brain tissue was discernible underlying residually damaged tumor zones. Ablation crater diameter, as measured by OCT, was smaller than that measured by histology possibly due to the residually damaged zone sloughing off during histological processing. Diameter of the discernible viable tissue region around the ablation crater as measured by OCT matched that determined from histology. Furthermore, depth of the unablated tumor region measured with OCT matched that from histology. Width of the unablated tumor region measured with OCT was 27% larger than that obtained from histology. This size difference may be due to tissue shrinkage during formalin fixation associated with histological processing and choice of attenuation coefficient threshold that likely overestimated tumor size in OCT images near the hippocampus, which has a lower scattering strength than cortex[28, 45].
Although data provided here indicate what is possible by combining OCT imaging with laser blood vessel coagulation and tissue ablation, additional imaging-only experiments (OCT imaging vs histology) of the murine brain cancer animal model would establish higher confidence in accuracy of tumor margin detection. In studies reported here, an attenuation threshold coefficient of 5.7 mm-1 was utilized and within 3% of that reported by Kut et al [5] who worked at a similar OCT wavelength. Inasmuch as light attenuation varies with optical wavelength, the attenuation threshold coefficient for tumor identification is likely different for OCT systems operating at shorter or longer wavelengths. Additional studies are required to explore the range of applicability of this threshold value and investigate possible dependence on OCT center wavelength, physiological and population factors including, for example, stage of the tumor, type of animal model and age of the animal. Despite the numerous potential factors that may impact the optimal attenuation coefficient threshold value, a reasonable estimate can be obtained by requiring continuous margins and including image data from tumor angiography and additional candidate OCT contrast mechanisms (e.g. scattering angle and polarimetry). Laser resection of a portion of the tumor confounds margin comparison between OCT and histology. However, the rim of desiccated tissue surrounding the ablation crater could have been mitigated in part by application of tissue cooling in conjunction with laser ablation. Tissue cooling can be accomplished for example by contact cooling with a sapphire window, forced air convection or spraying with evaporation. None of these cooling approaches were implemented in experiments reported here due to associated experimental complications. Additionally, after initial laser ablation of tumor regions, use of the attenuation coefficient for margin identification was complicated by change in optical properties due to tissue desiccation. This complication could be mitigated either by tissue cooling or possibly identifying the region of thermally modified tissue with polarization sensitive OCT [46, 47]. Tissue cooling would reduce water loss and partially mitigate changes in light attenuation. Imaging with polarization sensitive OCT could allow identification and quantification of thermally denatured regions so that attenuation in the underlying tissue may be determined while mitigating the artifact. In experiments reported here, a Tm laser was utilized to coagulate blood vessels that constrained the caliber of target vessels from capillaries up to venules and arterioles (150 μm in diameter). If larger vessels are present, small wavelength red-shifts in the coagulation laser (e.g., Ho:YAG) can allow coagulation of larger vessels. Moreover, because Tm and Ho lasers target water, some non-specific thermal denaturation of surrounding tissues resulted. An approach that selectively coagulates just the blood vessels [48] could reduce volume of non-specific thermal damage and provide an improved surgical outcome when higher levels of precision are required. Follow-on work can include survival studies with the same murine animal model to verify overall therapeutic benefit of this system over conventional surgical methods. Finally, the authors recognize limitations of the murine xenograft model. As the methodology is refined, more realistic clinical models will be required to advance the approach.
Conclusions
In conclusion, results presented demonstrate precise surgical resection by combining advances in OCT imaging of brain tumors and associated vasculature with laser coagulation and cutting. OCT-derived angiography and attenuation coefficient images allow rapid imaging of tumor margins and associated vasculature. The prototype laser surgical system reported here can precisely coagulate and ablate, and OCT may be applied to monitor the degree of coagulation, the efficacy of ablation and the degree of collateral damage. Importantly, verification of vessel coagulation by OCT angiography allows laser surgical resection without bleeding. Spatially precise, bloodless tissue resection, as demonstrated here, is particularly desirable for treatment of neurological tumors, where a bloodless operative field allows constant visualization, and where accidental damage to even the smallest of brain structures can have dramatic motor/sensory and/or psychological consequences for patients. Additional studies and engineering development are required to assess the implications of presented results for clinical neurosurgery.
Abbreviations
OCT: optical coherence tomography; Er:YAG: erbium-doped yttrium aluminum garnet; Th: thulium; MRI: magnetic resonance imaging; CT: computed tomography; RFP: red fluorescent protein; GFP: green fluorescent protein; FITC: fluorescein isothiocyanate; H&E: Haematoxylin and eosin.
Supplementary Material
Supplementary figures and tables.
Competing Interests
The authors have declared that no competing interest exists.
References
1. Li Z, Shen JH, Kozub JA, Prasad R, Lu P, Joos KM. Miniature forward-imaging B-scan optical coherence tomography probe to guide real-time laser ablation. Lasers Surg Med. 2014;46:193-202
2. Fan Y, Xia Y, Zhang X, Sun Y, Tang J, Zhang L. et al. Optical coherence tomography for precision brain imaging, neurosurgical guidance and minimally invasive theranostics. Biosci Trends. 2018;12:12-23
3. Falkner-Radler CI, Glittenberg C, Gabriel M, Binder S. Intrasurgical microscopeintegrated spectral domain optical coherence Tomography-Assisted membrane peeling. Retina. 2015;35:2100-2106
4. Böhringer HJ, Lankenau E, Stellmacher F, Reusche E, Hüttmann G, Giese A. Imaging of human brain tumor tissue by near-infrared laser coherence tomography. Acta Neurochir (Wien). 2009;151:507-517
5. Kut C, Chaichana KL, Xi J, Raza SM, Ye X, McVeigh ER. et al. Detection of human brain cancer infiltration ex vivo and in vivo using quantitative optical coherence tomography. Sci Transl Med. 2015;7:1-10
6. Jackson SD. Towards high-power mid-infrared emission from a fibre laser. Nat Photonics. 2012;6:423-431
7. Jackson SD, King TA. Theoretical modeling of Tm-doped silica fiber lasers. J Light Technol. 1999;17:948-956
8. Jackson SD, King TA. Silica Fiber Laser. Opt Lett. 1998;23:1462-1464
9. Huang D, Swanson EAEA, Lin CP, Schuman JS, William G, Chang W. et al. Optical Coherence Tomography. Science (80- ). 1991;254:1178-1181
10. Fujimoto JG, Pitris C, Boppart SA, Brezinski ME. Optical Coherence Tomography: An Emerging Technology for Biomedical Imaging and Optical Biopsy. Neoplasia. 2000;2:9-25
11. Drexel W, Fujimoto JG, Gueye P. Optical Coherence Tomography Technology and Applications. Med Phys. 2009;36:4842
12. Yuan W, Kut C, Liang W, Li X. Robust and fast characterization of OCT-based optical attenuation using a novel frequency-domain algorithm for brain cancer detection. Sci Rep. 2017;7:44909
13. Draelos M, Keller B, Viehland C, Carrasco-Zevallos OM, Kuo A, Izatt J. Real-time visualization and interaction with static and live optical coherence tomography volumes in immersive virtual reality. Biomed Opt Express. 2018;9:2825
14. Vakoc BJ, Lanning RM, Tyrrell JA, Padera TP, Bartlett LA, Stylianopoulos T. et al. Three-dimensional microscopy of the tumor microenvironment in vivo using optical frequency domain imaging. Nat Med. 2009;15:1219-1223
15. FUKUMURA DAI, DUDA DANG, MUNN LL, JAIN RK. Tumor Microvasculature and Microenvironment: Novel Insights Through Intravital Imaging in Pre-Clinical Models. Microcirculation. 2010;17:206-225
16. Chen Z, Milner TE, Srinivas S, Wang X, Malekafzali A, van Gemert MJC. et al. Noninvasive imaging of in vivo blood flow velocity using optical Doppler tomography. Opt Lett. 1997;22:1119-1121
17. Nam AS, Chico-Calero I, Vakoc BJ. Complex differential variance algorithm for optical coherence tomography angiography. Biomed Opt Express. 2014;5:3822
18. Jia Y, Tan O, Tokayer J, Potsaid B, Wang Y, Liu JJ. et al. Split-spectrum amplitude-decorrelation angiography with optical coherence tomography. Opt Express. 2012;20:4710
19. Chen C-L, Wang RK. Optical coherence tomography based angiography [Invited]. Biomed Opt Express. 2017;8:1056
20. Boppart SA, Brezinski ME, Pitris C, Fujimoto JG. Optical Coherence Tomography for Neurosurgical Melanoma Imaging of Human Intracortical Melanoma. Neurosurgery. 1998;43:834-841
21. Bizheva K, Unterhuber A, Hermann B, Považay B, Sattmann H, Fercher AF. et al. Imaging ex vivo healthy and pathological human brain tissue with ultra-high-resolution optical coherence tomography. J Biomed Opt. 2005;10:011006
22. Vuong B, Skowron P, Kiehl T-R, Kyan M, Garzia L, Sun C. et al. Measuring the optical characteristics of medulloblastoma with optical coherence tomography. Biomed Opt Express. 2015;6:1487
23. Li YQ, Chiu KS, Liu XR, Hsiao TY, Zhao G, Li SJ. et al. Polarization-sensitive optical coherence tomography for brain tumor characterization. IEEE J Sel Top Quantum Electron. 2019;25:1-7
24. Lenz M, Krug R, Dillmann C, Stroop R, Gerhardt NC, Welp H. et al. Automated differentiation between meningioma and healthy brain tissue based on optical coherence tomography ex vivo images using texture features. J Biomed Opt. 2018;23:1-7
25. Iacopino DG. Hemostasis in brain tumor surgery using the Aquamantys system. Med Sci Monit. 2014;20:538-543
26. Hammond JS, Muirhead W, Zaitoun AM, Cameron IC, Lobo DN. Comparison of liver parenchymal ablation and tissue necrosis in a cadaveric bovine model using the Harmonic ScalpelTM, the LigaSureTM, the Cavitron Ultrasonic Surgical Aspirator® and the Aquamantys ® devices. Hpb. 2012;14:828-832
27. Hale GM, Querry MR. Optical Constants of Water in the 200-nm to 200-μm Wavelength Region. Appl Opt. 1973;12:555
28. Jacques SL. Optical properties of biological tissues: A review. Physics in Medicine and Biology 58. 2013:37-61 http://iopscience.iop.org/0031-9155/58/11/R37
29. Kaufmann R, Hibst R. Pulsed erbium:YAG laser ablation in cutaneous surgery. Lasers Surg Med. 1996;19:324-330
30. Vogel A, Venugopalan V. Mechanisms of pulsed laser ablation of biological tissues. Chem Rev. 2003;103:577-644
31. Chang FY, Tsai MT, Wang ZY, Chi CK, Lee CK, Yang CH. et al. Optical coherence tomography-guided laser microsurgery for blood coagulation with continuous-wave laser diode. Sci Rep. 2015;5:1-9
32. Fan Y, Zhang B, Chang W, Zhang X, Liao H. A novel integration of spectral-domain optical-coherence-tomography and laser-ablation system for precision treatment. Int J Comput Assist Radiol Surg. 2018;13:411-423
33. Fan Y, Sun Y, Chang W, Zhang X, Tang J, Zhang L. et al. Bioluminescence imaging and two-photon microscopy guided laser ablation of GBM decreases tumor burden. Theranostics. 2018;8:4072-4085
34. Katta N, McElroy AB, Estrada AD, Milner TE. Optical coherence tomography image-guided smart laser knife for surgery. Lasers Surg Med. 2018;50:202-212
35. Srinivasan V, Chan A, Lam E. Doppler OCT and OCT Angiography for In Vivo Imaging of Vascular Physiology. In: Cdn.Intechopen.Com. 2009
36. Yashin KS, Kiseleva EB, Moiseev AA, Kuznetsov SS, Timofeeva LB, Pavlova NP. et al. Quantitative nontumorous and tumorous human brain tissue assessment using microstructural co- and cross-polarized optical coherence tomography. Sci Rep. 2019;9:2024
37. Chang W, Fan Y, Zhang X, Liao H, Member S. An Intelligent Theranostics Method Using Optical Coherence Tomography Guided Automatic Laser Ablation for Neurosurgery. 2018 40th Annual International Conference of the IEEE Engineering in Medicine and Biology Society (EMBC). 2018:3224-3227
38. El-Sherif a. F, King T a. Soft and hard tissue ablation with short-pulse high peak power and continuous thulium-silica fibre lasers. Lasers Med Sci. 2003;18:139-147
39. Mckenzie AL. Physics in Medicine & Biology Physics of thermal processes in laser-tissue interaction Physics of thermal processes in laser-tissue interaction. Phys Med Biol Phys Med Biol. 1990;35:1175-1209
40. Ramtin A, A. PJ, J. WA, Massoud M. Rate process model for arterial tissue thermal damage: Implications on vessel photocoagulation. Lasers Surg Med. 1994;15:176-184
41. Vermeer KA, Mo J, Weda JJA, Lemij HG, de Boer JF. Depth-resolved model-based reconstruction of attenuation coefficients in optical coherence tomography. Biomed Opt Express. 2013;5:322-37
42. Phipps JE, Vela D, Hoyt T, Halaney DL, Mancuso JJ, Buja LM. et al. Macrophages and intravascular OCT bright spots: A quantitative study. JACC Cardiovasc Imaging. 2015;8:63-72
43. Phipps JE, Hoyt T, Vela D, Wang T, Michalek JE, Buja LM. et al. Diagnosis of thin-capped fibroatheromas in intravascular optical coherence tomography images. Circ Cardiovasc Interv. 2016:9
44. Ludwig HC, Kruschat T, Knobloch T, Teichmann H-O, Rostasy K, Rohde V. First experiences with a 2.0-microm near infrared laser system for neuroendoscopy. Neurosurg Rev. 2007;30:195-201 discussion 201
45. Choi WJ, Wang RK. Swept-source optical coherence tomography powered by a 1. 3- μ m vertical cavity surface emitting laser enables 2. 3-mm-deep brain imaging in mice in vivo imaging in mice in vivo. J Biomed Opt. 2015;20:106004
46. de Boer JF, Milner TE. Review of polarization sensitive optical coherence tomography and Stokes vector determination. J Biomed Opt. 2002;7:359
47. de Boer JF, Milner TE, van Gemert MJC, Nelson JS. Two-dimensional birefringence imaging in biological tissue by polarization-sensitive optical coherence tomography. Opt Lett. 1997;22:934
48. Babilas P, Shafirstein G, Bäumler W, Baier J, Landthaler M, Szeimies RM. et al. Selective photothermolysis of blood vessels following flashlamp-pumped pulsed dye laser irradiation: In vivo results and mathematical modelling are in agreement. J Invest Dermatol. 2005;125:343-352
Author contact
![]() Corresponding author: arnold.estradaedu.
Corresponding author: arnold.estradaedu.