Impact Factor
- Issue 14; 2026
- Issue 13; 2026
- Issue 12; 2026
- Issue 11; 2026
- Issue 10; 2026
- Volume 16; 2026
- Advance Articles
- Past Issues
- Cover Images
- Cover Suggestion
- Index & Coverage
- Special Issues
Introduction
Materials and methods
Results
Discussion
Conclusions
Abbreviations
Supplementary Material
Acknowledgements
References
International Journal of Biological Sciences
International Journal of Medical Sciences
 Global reach, higher impact

Theranostics 2019; 9(14):4101-4114. doi:10.7150/thno.35186 This issue Cite
Research Paper
Integrated microbiome and metabolome analysis reveals a novel interplay between commensal bacteria and metabolites in colorectal cancer
Yongzhi Yang1,2,3#, Biswapriya B. Misra4#, Lei Liang1,2#, Dexi Bi5, Wenhao Weng6,7, Wen Wu3, Sanjun Cai1,2, Huanlong Qin3, Ajay Goel8, Xinxiang Li1,2, Yanlei Ma1,2 ![]()
1. Department of Colorectal Surgery, Fudan University Shanghai Cancer Center, Shanghai, 200032, China
2. Department of Oncology, Shanghai Medical College, Fudan University, Shanghai, 200032, China
3. Department of GI Surgery, Shanghai Tenth People's Hospital Affiliated to Tongji University, Shanghai, 200072, China
4. Center for Precision Medicine, Department of Internal Medicine, Section of Molecular Medicine, Medical Center Boulevard, Winston-Salem, NC 27157, USA.
5. Department of Pathology, Shanghai Tenth People's Hospital Affiliated to Tongji University, Shanghai 200072, China
6. Department of Clinical Laboratory, Yangpu Hospital, Tongji University School of Medicine, Shanghai, China
7. Center for Translational Medicine, Yangpu Hospital, Tongji University School of Medicine, Shanghai, China
8. Center for Gastrointestinal Research, Center for Epigenetics, Cancer Prevention and Cancer Genomics, Baylor Scott &White Research Institute and Charles A. Sammons Cancer Center, Texas, USA
#Equal contribution
Received 2019-3-24; Accepted 2019-4-17; Published 2019-5-31
Abstract

Rationale: Colorectal cancer (CRC) is a malignant tumor with the third highest morbidity rate among all cancers. Driven by the host's genetic makeup and environmental exposures, the gut microbiome and its metabolites have been implicated as the causes and regulators of CRC pathogenesis. We assessed human fecal samples as noninvasive and unbiased surrogates to catalog the gut microbiota and metabolome in patients with CRC.
Methods: Fecal samples collected from CRC patients (CRC group, n = 50) and healthy volunteers (H group, n = 50) were subjected to microbiome (16S rRNA gene sequencing) and metabolome (gas chromatography-mass spectrometry, GC-MS) analyses. The datasets were analyzed individually and integrated for combined analysis using various bioinformatics approaches.
Results: Fecal metabolomic analysis led to the identification of 164 metabolites spread across 40 metabolic pathways in both groups. In addition, there were 42 and 17 metabolites specific to the H and CRC groups, respectively. Sequencing of microbial diversity revealed 1084 operational taxonomic units (OTUs) across the two groups, and there was less species diversity in the CRC group than in the H group. Seventy-six discriminatory OTUs were identified for the microbiota of H volunteers and CRC patients. Integrated analysis correlated CRC-associated microbes with metabolites, such as polyamines (cadaverine and putrescine).
Conclusions: Our results provide substantial evidence of a novel interplay between the gut microbiome and metabolome (i.e., polyamines), which is drastically perturbed in CRC. Microbe-associated metabolites can be used as diagnostic biomarkers in therapeutic explorations.
Keywords: colorectal cancer, gut, microbiome, metabolomics, biomarkers
Introduction
Colorectal cancer (CRC) carries the third highest burden of morbidity among all malignant tumors worldwide [1, 2]. Although several mechanistic events have been identified that play key roles during colorectal carcinogenesis, only a few of these molecular targets are clinically translatable [3]. Identification of previously unrecognized mechanism(s) that drive cancer development would be of clinical relevance as these would allow development of robust biomarkers and effective drug targets, which are urgently needed for the diagnosis and therapeutic management of CRC. However, the underlying mechanisms involved in the occurrence and development of CRC are far from being explored.
There is accumulating evidence that colorectal carcinogenesis is driven by the interaction between genetic and environmental factors [4, 5]. Notably, the gut microbiome has been implicated as a critical environmental factor contributing to the tumorigenesis and progression of CRC, potentially through pro-inflammatory response, microbial metabolites, and interference with energy balance in cancer cells [6]. Furthermore, the diversity and function of the host bacterial community can be altered as a response to changes in the host diet or physiology [4, 7]. Therefore, the microbiome has come to the forefront as a reflection of the tumor environment, allowing the microbiome and the metabolome to be robust noninvasive targets for precision medicine [8].
Although there are several studies that have reported microbial associations with CRC, the profile of the gut microbial community and its functional contribution to CRC has not been systematically characterized [9]. Moreover, it is now clear that some important factors that connect intestinal microbiota to CRC are microbial metabolites [10]. As biochemical converters, gut microbes are capable of converting the complex chemical space presented by the dietary and host nutrients into a milieu of metabolites [11]. These metabolites can exert either genotoxic or tumor-suppressive functions through multiple mechanisms, such as by providing supportive metabolic flux to promote anabolic metabolism, by acting as competitive enzyme inhibitors, or by modifying signaling proteins [12]. Therefore, the disruption in the balance of metabolites by the microbiome may result in tumorigenesis. Nevertheless, the interplay between gut microbiota and metabolites and their roles in CRC development have not been effectively addressed, and the study of this interplay is limited by invasive and expensive sampling techniques that are often biased with unidimensional classical approaches. Thus, taking advantage of this critical gap in the literature, we envisaged this study to systematically and comprehensively interrogate the microbiome and metabolome of human CRC fecal samples, to identify microbial diversity and metabolite abundance and to decipher the association of CRC with gut microbiota and fecal metabolites.
Materials and methods
Study design and fecal sample collection
A total of 50 patients diagnosed with sporadic CRC and 50 healthy (H) volunteers for conventional medical examination including fecal occult blood test (FOBT) and fibrocolonoscopy examination evaluated at Tongji University Affiliated Tenth People's Hospital (Shanghai, China) from January 2014 to September 2014 were recruited for inclusion in this study. The written informed consents were obtained from the CRC patients and the H volunteers. Their general clinical data including age, gender, educational background, body mass index (BMI), waist-to-hip ratio (WHR), and histories of smoking, hypertension, appendectomy, and FOBT were recorded. All patients and volunteers were Shanghai Han Chinese with similar geographic areas and eating habits. All patients were diagnosed by postoperative pathological examinations. The clinical pathological features of CRC, such as tumor stage, tumor location, tumor size, tumor differentiation, serum carcinoembryonic antigen (CEA) and carbohydrate antigen 19-9 (CA19-9), were recorded. The exclusion criteria were as follows: patients older than 80 years or younger than 25 years; patients with a history of familial CRC, inflammatory bowel disease (IBD), or irritable bowel syndrome (IBS); individuals who received preoperative neoadjuvant chemoradiotherapy; patients with other coexisting malignant tumors; and patients with complications of complete intestinal obstruction. All the H volunteers had a normal bowel habit. The H volunteers had no history of IBS, IBD, CRC, other malignant tumors or other severe gastroenterological diseases. All patients and volunteers using antibiotics, probiotics, prebiotics, or synbiotics within two months of sampling were excluded. The flow chart displaying the enrollment and analysis process is illustrated in Supplementary Figure S1. Three H volunteers with a positive FOBT were further detected by fiber electron colonoscopy and confirmed to have stage I internal hemorrhoids without neoplasia throughout the entire large intestine, thus, the 3 H volunteers were included in our study. Four volunteers with colon polyps were excluded in our further study after colonic endoscopy. All qualified stool samples were self-sampled prior to mechanical bowel preparation and were transported immediately to the laboratory, divided into two portions per sample, packed into two frozen pipes, and then frozen in liquid nitrogen overnight and preserved under -80°C for further testing. Our studies were conducted under the institutional review board (IRB) protocols of the participating institutions.
Fecal DNA extraction for microbiome analysis
The genomic DNA of feces was extracted using the QIAamp DNA Stool Mini Kit (Qiagen, Hilden, Germany) according to the manufacturer's guidelines. DNA integrity and size were verified by 1% agarose gel electrophoresis, and DNA concentrations were determined using NanoDrop spectrophotometry (NanoDrop, Germany).
High-throughput 16S ribosomal RNA gene sequencing
16S ribosomal RNA (rRNA)-based amplification was performed using the primers (319F: 5'-ACTCCTACGGGAGGCAGCAG-3'; 806R: 5'-GGACTACHVGGGTWTCTAAT-3') directionally targeting the V3 and V4 hypervariable regions of the 16S rRNA gene. To differentiate each sequenced sample and obtain accurate phylogenetic and taxonomic information, the gene products were attached with forward and reverse error-correcting barcodes. After purification, the amplicons were quantified, following which the normalized equimolar concentrations of amplicons were pooled and sequenced on a MiSeq PE300 sequencing instrument (Illumina, Inc., CA, USA) using 2 ×300 bp chemistry according to the manufacturer's specifications.
Sequencing data analysis
The paired-end reads were generated and assigned to each sample based on their barcodes and then were merged with FLASH (Fast Length Adjustment of SHort reads) software. High-quality filtering of the raw tags was conducted to acquire clean tags using Qiime (Version 1.7.0) [13]. The chimeric sequences were filtered using Usearch (Uparse v6.0.307) software. Sequences with more than 97% similarity thresholds were allocated to one operational taxonomic unit (OTU) using CD-HIT (v4.6.1). Classification of representative sequences for each OTU was applied, and then Ribosomal Database Project (RDP) classifier 2.10.1 were used to assign taxonomic data to each sequence. The phylogenetic differences in the dominant OTUs were performed using Python Nearest Alignment Space Termination (PyNAST). A rarefaction curve was generated using the Mothur package for richness estimations of the OTUs. Alpha diversity was performed to identify the complexity of species diversity for each sample. To assess the diversity in samples for species complexity, beta diversity calculations were analyzed by principal coordinate analysis (PCoA). The Wilcoxon rank-sum test and Welch's t-test were used to compare bacterial abundance and diversity. Heat maps were constructed based on the nonparametric Wilcoxon test (p < 0.05, q < 0.1) at the genus level. Linear discriminant analysis (LDA) coupled with effect size (LEfSe) was applied to evaluate the differentially abundant taxon.
Fecal sample preparation for metabolomics analysis
Gas chromatography-mass spectrometry (GC-MS) was performed as described [14]. Briefly, lyophilized fecal samples (100 mg) were collected in 5 mL centrifuge tubes, and ddH2O (500 µL at 4°C) was added. The mixture was then vortexed for 1 min. Then, 1 mL methanol (-20°C) was used for extraction, following addition of 30 μL 2-chloro-L-phenylalanine (0.2 mg/mL) and 60 μL heptadecanoic acid (0.05 mg/mL) as internal standards. The mixture was vortexed for 30 s and sonicated for 10 min, kept on ice for 30 min, and subsequently centrifuged at 14000 rpm at 4°C for 30 min. The supernatant (1200 μL) was transferred into a 1.5-mL microcentrifuge tube and freeze-dried with nitrogen. Methoxyamination was performed by adding 60 μL methoxyamine. HCl solution (20 mg/mL in pyridine) was added to each tube, followed by incubation and shaking at 1200 rpm for 120 min at 37°C. Then, 60 μL N,O-bis (trimethylsilyl) trifluoroacetamide (BSTFA) with 1% trimethylchlorosilane (TMCS) was added into the mixture and then incubated at 37°C for 90 min for trimethylsilyl derivatization. Pooled samples were used as quality control (QC) samples over batches of 10 samples, and samples were blinded and randomized and were served as QC checks by injecting at scheduled intervals for monitoring shifts in retention indices (RI). Deionized water was used as the control sample to account for the background noise produced during sample processing and data analysis.
GC-MS data acquisition
Samples were analyzed with an Agilent Gas Chromatography Mass Spectrometer (7890A/5975C GC-MS System, Agilent, CA, USA). The GC system employed a HP-5MS capillary column coated with 5% phenyl methyl silox (Agilent J & W Scientific, Folsom, CA, USA). Samples (1 μL) were injected at a split ratio of 20:1. As a carrier gas, helium was set to a constant flow rate of 1.0 mL/min. The temperatures were set to 280°C (injection), 250°C (transfer line) and 150°C (ion source), respectively. The initial temperature program was set at 2 min of isothermal heating at 70°C and then increased to 300°C at a rate of 10°C/min. The final temperature was maintained for 5 min. Electron impact ionization (70 eV) in a full scan mode with an m/z range of 35-780 was used for data acquisition.
GC-MS-based metabolomics data analysis
The GC-MS data obtained in [.D] format from the platform were converted to .mzXML format using msConvert (ProteoWizard tool) and were preprocessed, cleaned, deconvoluted and aligned using the Automated Mass Spectral Deconvolution and Identification System (AMDIS, National Institute of Standards and Technology, USA) interface to match against the freely available Mass Spectral (MS) and Retention Time Index (RI) (MSRI) library at the Golm Metabolome Database. Metabolites were further identified by comparing fragmentation patterns available in both the Golm database and the National Institute of Standards and Technology Mass Spectral Reference Library 2011 (NIST11/2011; National Institute of Standards and Technology, USA). Peak findings and quantification of selective ion traces were accomplished using AMDIS software. As a rule, if a compound had an AMDIS match factor > 60%, a probability score > 20% and a matching RI to a known compound, it was considered “probable”. Base peak areas of the mass fragments (m/z) were normalized using median normalization and log2 transformation.
Fecal metabolomes were obtained, of which a total of 12 outliers were detected postanalysis and were removed, possibly due to other sources of unwanted source of variations. Thus, we obtained fecal metabolome data from 42 H volunteers and 46 CRC patients. Normalized, transformed, imputed, outlier removed, and scaled peak areas representative of relative metabolite abundances obtained by processing using the DeviumWeb package (https://github.com/dgrapov/DeviumWeb) are presented in the tables and figures. Hierarchical clustering analysis (HCA) was applied on Pearson distances using PermutMatrix [15]. For heat-maps, the fecal metabolome data were normalized using z-scores under the peak areas. Principal component analysis (PCA) was conducted at DeviumWeb, where output consisted of score plots to visualize the contrast between sample set and loading plot to interpret cluster separation. Orthogonal partial least squares discriminant analysis (OPLS-DA) was applied to highlight the phenotypic difference between the groups used in the study. Pathway enrichment was conducted at MetaboAnalyst. For ID conversions, a web tool-Chemical Translation Service (CTS) was utilized to convert the common compound into Kyoto Encyclopedia of Genes and Genomes (KEGG) and Human Metabolome Database (HMDB) metabolite IDs.
Statistical analyses
Significant differences in clinical characteristics were evaluated with Pearson's Chi-square test or Fisher's exact test. Pearson's rank correlation analysis was conducted to calculate the correlation between metabolites or between species and metabolites. Differences were considered significant when p < 0.05. Two-tailed Student's t-test was performed and the p-value was adjusted by the Benjamini-Hochberg (BH) correction. The probability level for statistical tests was set at α = 0.05 and was adjusted by the BH correction to allow for a maximum 5% probability (q = 0.05) of false positive detection. All data were analyzed with Graph Pad Prism 6 software (GraphPad software, Inc., San Diego, California, USA), R version 3.3.2 (R Foundation for Statistical Computing, Vienna, Austria) and Microsoft Excel (Microsoft Corporation, Seattle, WA, USA).
Results
Summary of clinical characteristics
All patients and volunteers were Han Chinese from Shanghai area with comparable eating habits to exclude dietary differences. The clinicopathological variables (Supplementary Table 1) of the two groups were generally matched, suggesting that none of the established confounding factors influenced group discrimination prior to the experimental design and sample collection. There was a significant difference in positive FOBT results between the CRC and H groups (44% versus 6%, p < 0.001).
Decreased bacterial diversity in fecal microbiota associated with CRC
In our present microbiome investigation, a total number of 3087931 high-quality 16S rRNA reads were obtained, with a median read count of 29099.5 (range, 17816 to 49391) per sample. Following taxonomic assignment, 1084 OTUs were obtained (Supplementary Table S2). The species accumulation curve (Supplementary Figure S2A) and the rarefaction curve (Supplementary Figure S2B) of all samples supported the adequacy of the sampling efforts. In addition, the rank abundance distribution curves (Supplementary Figure S2C) indicated decreased richness and a relative bacterial imbalance in the CRC group compared with the H group.
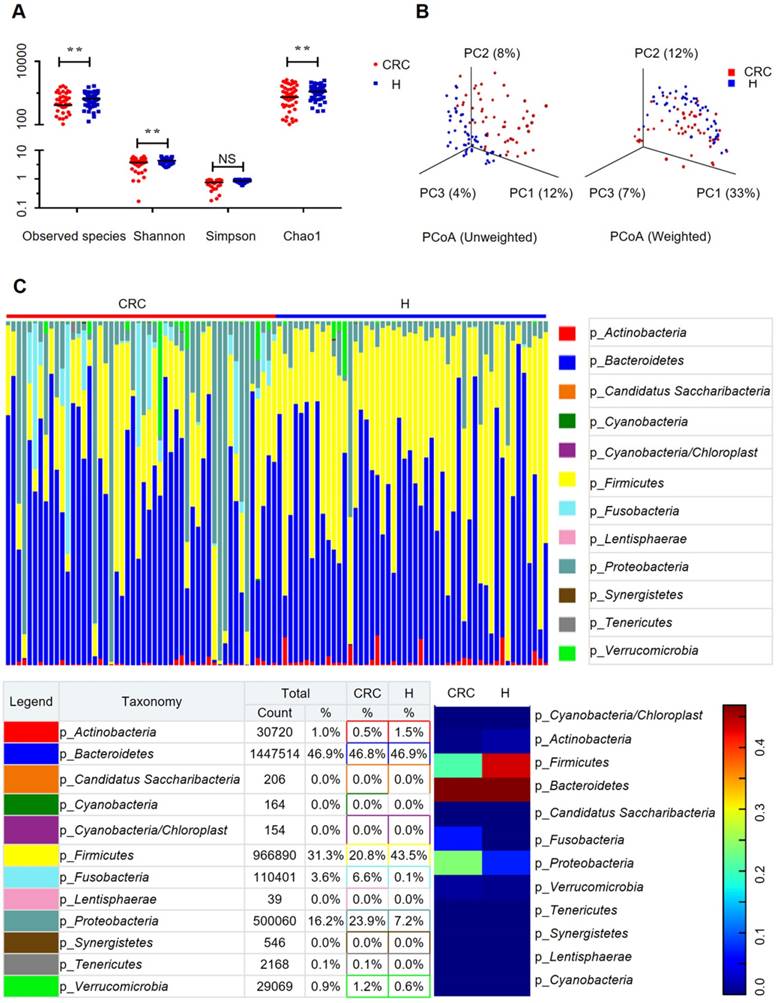
To evaluate the differences in bacterial diversity between the two groups, sequences were aligned to estimate alpha diversity and beta diversity. There were statistically significant differences in the Shannon (3.73 ± 1.39 versus 4.35 ± 0.90, p = 0.0093), observed species (204.56 ± 98.32 versus 257.46 ± 64.61 p = 0.002), and Chao1 (273.70 ± 127.98 versus 333.81 ± 79.63, p = 0.0058) indexes, whereas the Simpson index (0.76 ± 0.23 versus 0.85 ± 0.09, p = 0.0758) was not significantly different between the CRC and H groups (Figure 1A). Both the unweighted and the weighted PCoA plots revealed a separation of the two groups on the basis of the first three PCoA (Figure 1B). These results suggest that the diversity of gut microbiota could be strongly influenced by the tumor burden.
Gut microbiome diversity and structure analysis. (A) Species diversity differences between the CRC and H groups were estimated by the observed species, Shannon, Simpson, and Chao1 indices. **p < 0.01; NS, not significant. CRC, CRC patient group; H, H volunteer group. (B) PCoA plot base of the relative abundance of OTUs (97% similarity level) showing bacterial structural clustering. (i) Unweighted UniFrac PCoA plots; (ii) Weighted UniFrac PCoA plots. CRC group (red dots); H group (blue dots), where dots represent individual samples. (C) Component proportion of bacterial phylum in each group; n = 50 for the CRC group and n = 50 for the H group.
Alterations in the composition of fecal microflora associated with CRC
The relative proportions of dominant taxa at the phylum level were assessed by microbial taxon assignment in both groups. We observed considerable variability in gut microbiota across samples in each group (Figure 1C). Twelve phyla were identified in each group. Bacteroidetes was the most predominant phylum, accounting for 46.8% and 46.9% of the OTUs in the CRC and H groups, respectively. In addition, Proteobacteria (23.9% versus 7.2%) and Fusobacteria (6.6% versus 0.1%) were enriched in the CRC group compared to the H group, whereas Firmicutes (20.8% versus 43.5%) was enriched in the H group. Although an upregulated Firmicutes/Bacteroidetes ratio has been suggested as an indicator of several pathological conditions [16], our results suggested otherwise (Supplementary Figure S2D).
To compare the differences in fecal microflora between the two groups, Welch's t-test was performed for different classification levels. At the phylum level, Firmicutes (p < 0.001) and Actinobacteria (p = 0.00812) were significantly more abundant in the H group than in the CRC group; however, Fusobacteria (p = 0.00176), Lentisphaerae (p = 0.0313), and Proteobacteria (p = 0.00163) were also significantly more abundant in the CRC group than in the H group (Supplementary Figure S3A). At the genus level, a total of 307 genera were found to be significantly different between the two groups. Of these discriminatory taxa, Escherichia-Shigella (p < 0.001), Parvimonas (p = 0.0123), Fusobacterium (p = 0.0196), CFT112H7_norank (p = 0.0195), and Porphyromonas (p = 0.0329) were found to be significantly more abundant in the CRC group than in the H group (Supplementary Figure S3B). Given that the left and right colon have different physiological functions, we further stratified the analysis by tumor location in the CRC group but did not find any significant differences (all FDR > 0.05) between the proximal and distal colon subgroups. When we further stratified the analysis at the genus level by lymph node metastasis in the CRC group, only Peptostreptococcus (p = 0.0391) was found to be abundant in CRC patients with positive lymph node metastasis.
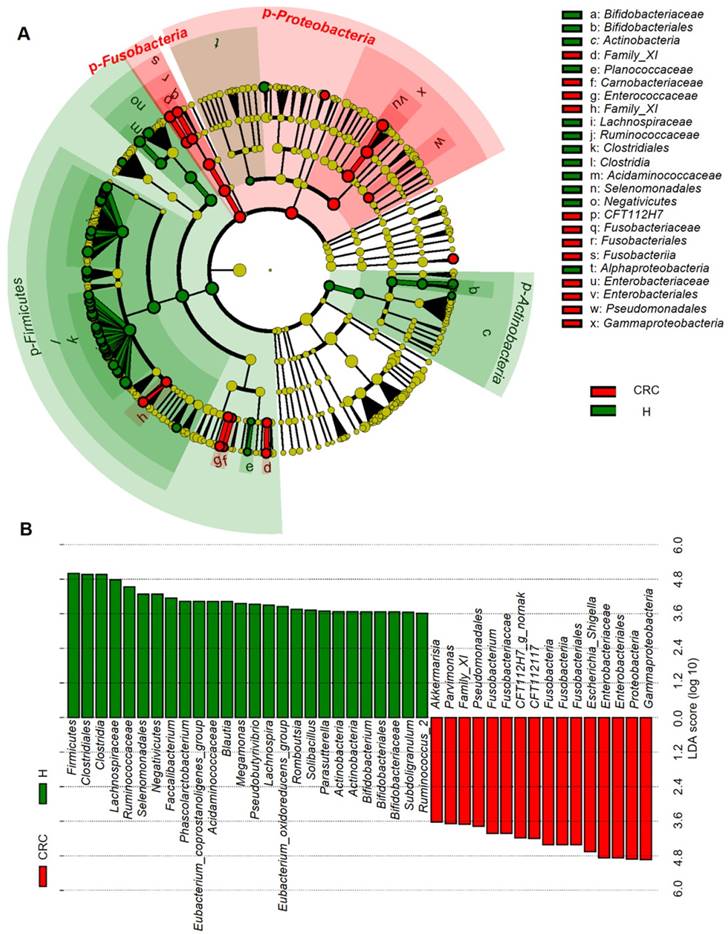
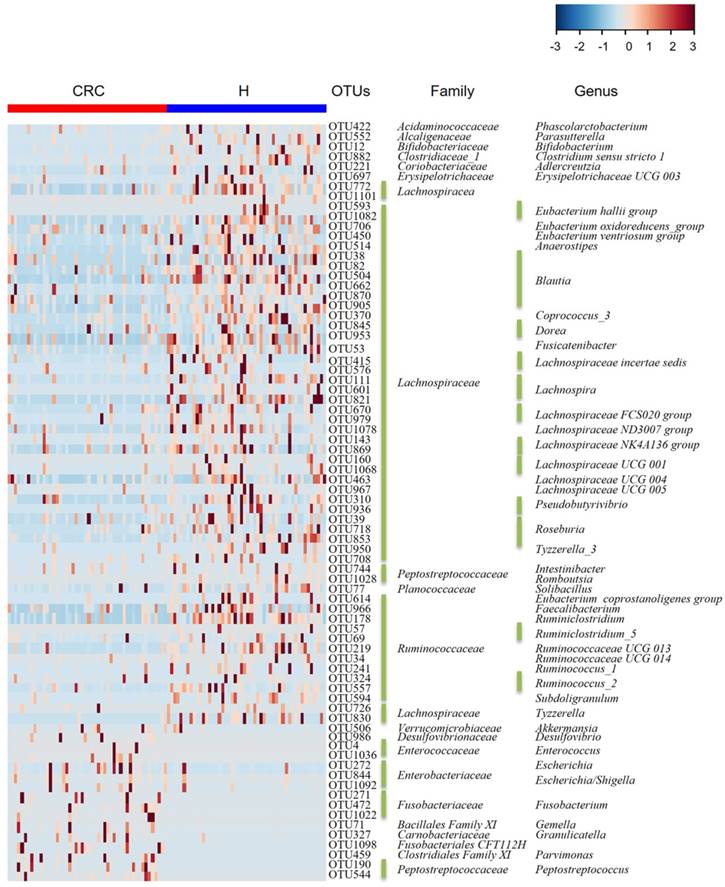
Considering that this discriminant analysis did not distinguish the predominant taxon, LEfSe was used to generate a cladogram to identify the specific bacteria associated with CRC (Figure 2). We identified 76 discriminatory OTUs as key discriminants. Several opportunistic pathogens including Gammaproteobacteria (Proteobacteria), Enterobacteriaceae (Enterobacteriales), and Fusobacteriales (Fusobacteria) were all significantly overrepresented (all LDA scores (log10) > 4) in the feces of patients in the CRC group, whereas Firmicutes, Clostridiales, Clostridia, Lachnospiraceae, Ruminococcaceae, Selenomonadales, Negativicutes, and Faecalibacterium were the most abundant microbiota in the H group (LDA scores (log10) > 3.6). The relative abundances of these 76 OTUs were further analyzed by clustering analysis represented by a heat map (Figure 3). The H group was enriched with 58 OTUs, while the CRC group was enriched with 18 OTUs (Supplementary Table S3). These data suggest that the abundance of microbes was much less in the CRC group than in the H group, and these differentially abundant microbiota were sufficient to differentiate the microbiota of H volunteers and CRC patients.
Linear discriminant analysis (LDA) integrated with effect size (LEfSe). (A) Cladogram indicating the phylogenetic distribution of microbiota correlated with the H or CRC groups. (B) The differences in abundance between the H and CRC groups.
Heat map of the relative abundances of the 76 OTUs (97% similarity level) that differentiate the H and CRC groups. OTUs are shown from lower abundance (in blue) to higher abundance (in red) for the z-transformed data. Data were analyzed by the Wilcoxon rank-sum test (Mann-Whitney U test). All 76 OTUs were assigned to families and genera.
Global overview of gut metabolism in the fecal metabolome of the CRC and H groups
Since the CRC patients demonstrated signature microbiota associated with disease, we hypothesized that alterations in metabolic pathways may be at least partially affected by gut microbiota in patients with CRC. Therefore, we subsequently performed metabolome analysis of fecal samples using a nontargeted GC-MS-based metabolomics approach. We successfully quantified 226 metabolites in both the H and CRC groups, of which 164 were shared (Supplementary Table S4). These metabolites were mapped onto ~40 different KEGG metabolic pathways including protein biosynthesis (14 metabolites), ammonia recycling (5), and galactose metabolism (6) (Supplementary Figure S4A).
CRC and H group-specific fecal metabolomes
Analysis of the differentially accumulated and significantly changed metabolites in the H and CRC groups are shown in Supplementary Table S5. In the H group, the abundant metabolites were mainly sugars (maltose, fructose), sugar alcohols, amines (galactosamine) and a large set of organic and fatty acids (glycerol, octadecanoic acid, hexanedioic acid, benezenepropanoic acid, linoleic acid, and oleic acid). In contrast, the CRC group showed a higher abundance of polyamines (cadaverine, 1,4-Butanediamine), amino acids (Pro, Glu) and urea, suggesting that the H group is better able to maintain carbohydrate metabolism and a more reductive environment in the gut than in the CRC group (Supplementary Table S6, Figure 4A).
Fecal metabolomics for quantification of metabolites in both the H and CRC groups. (A) Volcano plot showing the differentially accumulated [log2 (fold-change) on X-axis] and significantly changed [-log10 (p) on Y-axis] metabolites in the H and CRC groups. (B) Pathway enrichment and statistical significance of the 17 metabolites that were only present in CRC patients. (C) Pathway enrichment and statistical significance of the 42 metabolites unique to the H group.
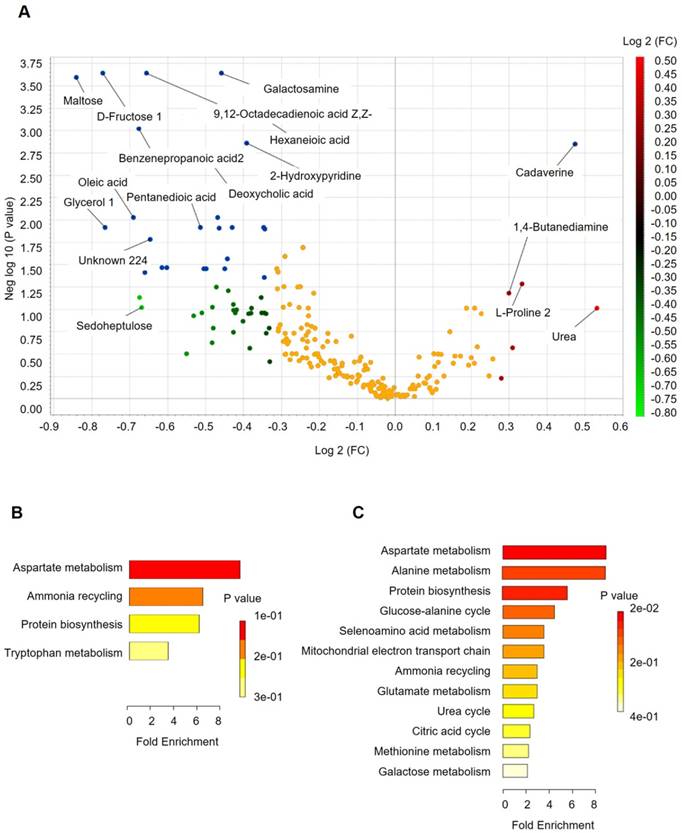
More importantly, we found several metabolites that were uniquely present in either the CRC or H groups. For instance, 17 metabolites that potentially participate in Asp metabolism, ammonia recycling, protein biosynthesis, and Trp metabolism, which supports the environment needed for tumorigenesis (Figure 4B), were only quantified in the CRC group, i.e., Lys, heptanedioic acid (a precursor of Lys), norvaline, and several amino acid and organic acid derivatives (Supplementary Table S7). We also found 42 metabolites (excluding 20 unknown metabolites) that were not detectable in the CRC group at all. These metabolites are mostly involved in Asp metabolism, Ala metabolism, protein biosynthesis, etc. (Figure 4C), suggesting that these metabolic pathways are less active in CRC patients.
Clustering, correlation, and multivariate analysis reveal discriminatory metabolites between the H and CRC groups
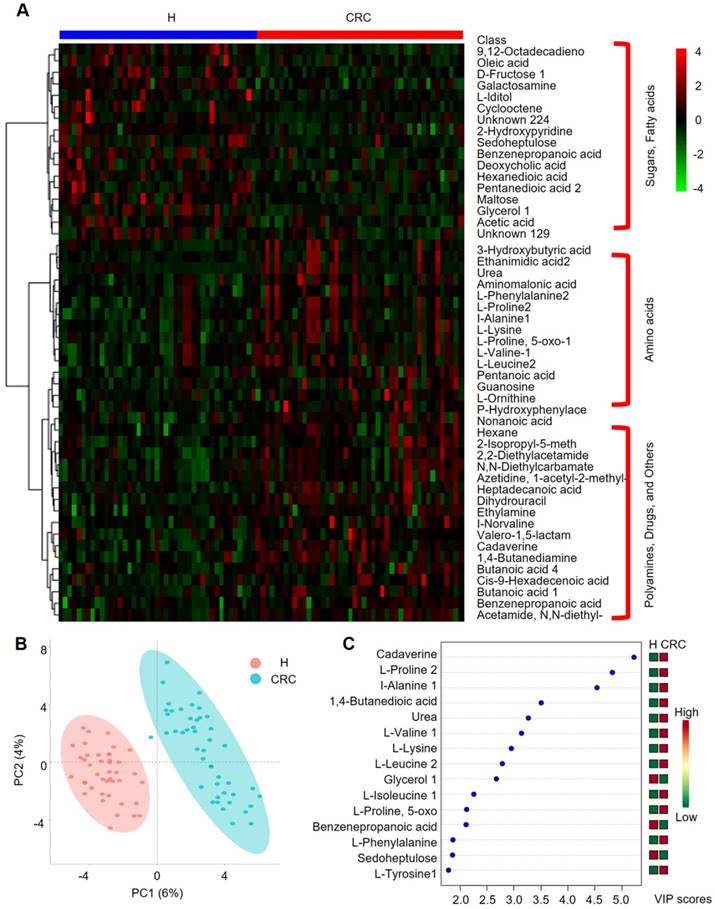
We further performed HCA analysis on the metabolite abundances in the H and CRC groups. The results displayed the following three large clusters: (i) sugars and fatty acids, which showed higher abundances in the H group than in the CRC group, and (ii) amino acids and (iii) polyamines, drugs and other metabolites, which showed higher abundances in the CRC group than in the H group (Figure 5A). Consistent with these findings, a metabolite-metabolite Pearson correlation analysis also showed a significant correlation between the abovementioned metabolites and the CRC phenotype (Supplementary Figure 4B, Supplementary Table S8). Specifically, higher abundances of sugars and sugar alcohols, such as fructose, iditol, sedoheptulose, maltose, glycerol, galactosamine, and fatty acids, such as 9, 12-octadecanoic acid, oleic acid, hexanedioic acid, and pentanedioic acid, were observed in the H group. Amino acids, such as Phe, Pro, Ala, Lys, 5-oxo-Pro, Val, Leu, and Orn, were also overrepresented in the CRC group. PCA clearly showed differences between the H and CRC groups based on the first two principal components, PC1 (6%) and PC2 (4%), suggesting CRC group-specific metabolomic abundance and signatures (Figure 5B). These claims were further supported by OPLS-DA analysis, where several specific metabolites such as cadaverine, Pro, Ala, 1,4-butanedioic acid, urea, Val, Lys, Leu, glycerol, Ile, 5-oxo-Pro, benzenepropanoic acid (i.e., hydrocinnamic acid), Phe, sedoheptulose and Tyr, were able to differentiate CRC patients from H volunteers (Figure 5C). Taken together, our data clearly and robustly showed that CRC patients presented a specific fecal metabolome.
Important discriminatory metabolites identified by clustering, correlation and multivariate analysis between the H and CRC groups. (A) Hierarchical clustering analysis (HCA) for the H and CRC group metabolites based on their z-normalized abundances. The three large clusters from top to bottom are (i) sugars and fatty acids, (ii) amino acids, and (iii) polyamines, drugs and others. (B) OPLS-DA analysis displaying the grouped discrimination of the H and CRC groups by the first two PCs. (C) Variable Importance in Projection (VIP) scores of the important discriminatory metabolites obtained from the OPLS-DA models.
Identification of CRC-specific metabolites
Based on the above fecal microbiome and metabolomics data, we performed Pearson's correlation-based clustering analysis to identify microbe-associated metabolites in CRC (Figure 6A). Interestingly, we observed that the metabolite-microbe correlation was stronger in CRC patients (Supplementary Table S9) than in H volunteers (Supplementary Table S10), suggesting that the aberrantly enriched metabolites in CRC are highly attributed to an imbalance in gut microflora or to interactions thereof. Notably, these data only suggest a potential correlation between gut microbes and metabolites without considering the different bacterial abundances between the two groups or the dietary habits of the subjects. We further explored the 76-OTUs-associated metabolites (Supplementary Table S11). The results revealed positive correlations for several microbe-metabolite pairs in the CRC group (Figure 6B). Furthermore, several unknown metabolites that could not be identified by the currently available EI spectral libraries were also found to be significantly associated with several OTUs, indicating their potential roles as future targets for biomarker discovery in CRC patients, pending confident annotation.
Integrated correlation-based network analysis of microbes and metabolites. Pearson's correlation analysis from the entire network in the CRC group and H group. (A) Firmicutes (Bacillus, Solibacillus and Lactococcus) were grouped with tetradecanoic acid (myristic acid) and methyl-butanedioic acid (methylsuccinic acid) in the CRC group. In the H group, Firmicutes (Bacillus, Solibacillus and Lactococcus) were grouped with sugars (d-galactose, sedoheptulose), sugar alcohols, and organic acids, such as nonanoic acid, benzoic acid and others (hexane, 1-acetyl-2-methyl-azetidine). (B) Integrated correlation-based network analysis (Pearson's correlation) of microbes and metabolites. (C) A four-way Venn diagram displaying the coefficient of variation (CV) of four groups of metabolites in the CRC (< 0.25), CRC (> 0.75), H (< 0.25), and H (> 0.75) groups. CVs were obtained ranging from 0-1, in which 0-0.25 was classified as the least variable, and 0.75-1 was classified as highly variable. (D) Biomarker analysis for metabolite abundance showing the high AUCs for cadaverine and putrescine.
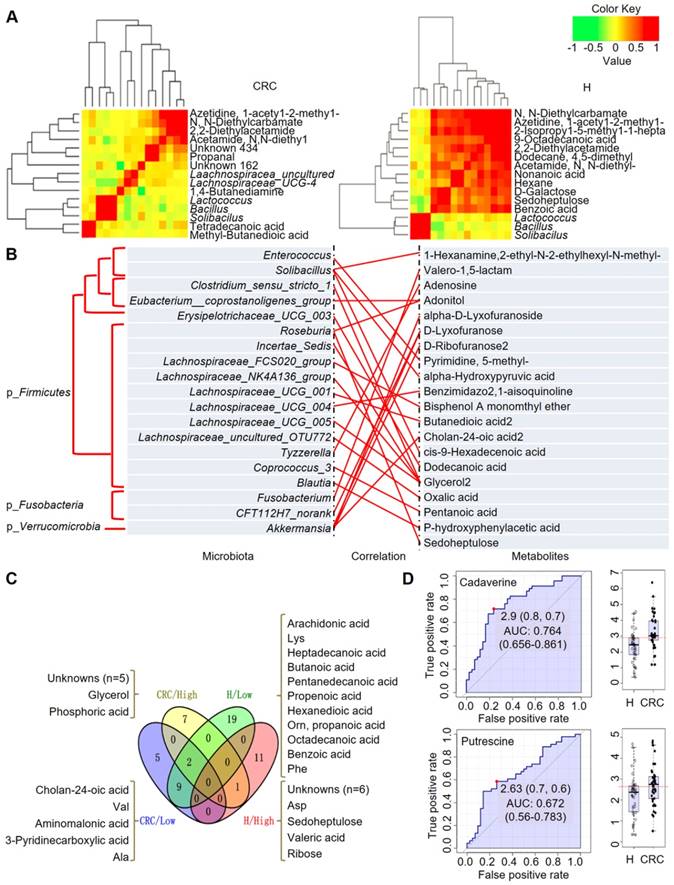
When we calculated the coefficient of variation (CV) of the abundances of the fecal metabolites, we obtained CVs ranging from 0-1, where we classified 0-0.25 as least variable (less noisy and serve as good biomarkers) and 0.75-1 CV as highly variable metabolites (Figure 6C). We observed that metabolites showing lowest CV (and least variability) in CRC samples were cholan-24-oic acid, Val, aminomalonic acid, 3-pyridinecarboxylic acid, and Ala, whereas those showing higher CV (and higher variability) were unknowns (five of them), glycerol, and phosphoric acid. For the H samples we observed that, metabolites showing lowest CV were arachidonic acid, Lys, heptadecanoic acid, butanoic acid, pentanedecanoic acid, propenoic acid, hexanedioic acid, Orn, propanoic acid, octadecanoic acid, benzoic acid, Phe among others. On the other hand, the higher CV metabolites belonged to the unknowns (six of them), Asp, sedoheptulose, valeric acid, and ribose. It is also important to note that, Glu is highly variable in both CRC and H cases, while norLeu, 5-oxo-Pro, Trp, hydroxylamine are least variable in the fecal metabolomes and hence, may not serve as good biomarkers for defining the healthy and disease status.
According to this analysis, we focused on polyamines as potential biomarkers, as these were the abundant metabolites identified in the CRC group. A receiver operating characteristic (ROC) curve analysis indicated that cadaverine (area under the curve (AUC), 0.764; p = 5.4512E-5) and putrescine (AUC, 0.672; p = 0.015449) were significantly associated with CRC samples (Figure 6D). Thus, the diagnostic value of polyamines was equivalent to or better than that of FOBT (AUC, 0.681; p = 0.002), which is a conventional method for CRC screening.
Discussion
Akin to an anaerobic bioreactor, the colorectum harbors an enormous diversity of microbiota, more than a trillion cells, which are capable of producing an extraordinarily wide range of small molecules (i.e., metabolites) that influence many vital pathways associated with energy homeostasis, nutritional intake, and immune balance [17]. Additionally, accumulating evidence suggests that the microbiome and its metabolome contribute to tumorigenesis in CRC [18]. Therefore, using the gut microbiome and its metabolites as screening tools for early detection of carcinoma is a promising field [19]. Omics approaches show great promise for the development of biomarkers as they generate large scale data sets containing thousands of variables in a high-throughput manner that may be predictive and thus offer a lucrative approach when presented with a biological system with extremely high complexity, i.e., CRC disease diagnosis from fecal matter [19]. Compared with omics approaches using biofluids, such as serum and urine, the fecal metabolome reflects direct interactions among genetic, environmental, and dietary factors [20]. Thus, metabolomics research efforts involving fecal samples may be more effective at identifying biomarkers. Given that > 80% of fecal metabolites overlap with mucosal metabolites, only < 50% of CRC-specific metabolites can be found in feces, which poses a challenge in correlating CRC with fecal metabolite abundance [21]. Thus, the global nontargeted metabolomics analysis applied herein on fecal sample provides insights into the association between bacterial populations from a microbiome sequencing approach and may allow identification of CRC-derived metabolic biomarkers.
Following an untargeted approach, our study identified a larger number of decreasing metabolites (sugars and long chain fatty acids) than increasing ones (amino acids and polyamines) in the CRC group. Previous studies have also documented increases in the amino acids Pro and Glu and decreases in glycerol, linoleic, and oleic acids in CRC patients [22, 23]. The increased concentration of Glu independent of Gln in stool samples from CRC patients indicates that cancer cells may display hyperactivity of glutaminase and result in conversion of Gln to Glu [24]. Interestingly, polyamines, such as putrescine and cadaverine, which showed a higher abundance in the CRC group than in the H group, have been previously implicated in cancer [25]. In addition, we found mannitol exclusively in the H subjects, which was also recently found in the colonic mucosa adjacent to CRC [21]. Further, we detected greater amounts of poly- and monounsaturated fatty acids and deoxycholic acid in the H group, which are known to be present in fecal samples from healthy adults [26, 27]. For instance, acetate, an important short-chain fatty acid (SCFA) for keeping gut health and a precursor for endogenous cholesterol production, was also increased in the H group. Hydrocinnamic acid, which regulates the breakdown of branched-chain amino acids, was only detected in the stool metabolomes of healthy adults, suggesting its protective role in tumorigenesis in the gut [28]. In general, our global nontargeted metabolomics efforts in fecal samples from CRC patients and H individuals showed unique and differential metabolic signatures.
Low gut bacterial richness is a common hallmark of chronic disease [29]. Some genera (Roseburia and Bifidobacterium) are associated with protective effects, while others (Streptococcus and Escherichia/Shigella) are detrimental to the gut mucosa [30]. It has generally been observed in the diverse structure of stool microbiota between the Chinese and Americans at the species level [31]. In our study based on a Han Chinese population, we observed strongly correlated Lachnospiraceae OTUs in the H cohort, which was in accordance with the findings of previous reports in which several chronic diseases (including liver cirrhosis and IBD) were independently associated with lower levels of Lachnospiraceae [32]. However, in CRC patients, a 3-fold increase in Proteobacteria, a 60-fold increase in Fusobacteria and a 0.5-fold decrease in Firmicutes were observed compared with the H group; this demonstrates a staggering shift in the complex yet consistent dynamics of the human fecal microbiome. Indeed, a previous study has shown that genera such as Faecalibacterium, Bifidobacterium, and Blautia were reduced while Fusobacterium and Porphyromonas were increased in CRC tissues, which is a trend that is consistent with our findings.[33]. Therefore, the tumor-promoting effects of the microbiome in patients with CRC may be probably caused by holistic dysbiosis, rather than by a specific pathogen [34].
The species richness in the microbial flora of the H subjects was strongly associated with the observed metabolic diversity. For instance, as observed in the LEfSe analysis, Selenomonadales was one of the most abundant genera in the H group and was correlated very well with enriched selenoamino acid metabolism for metabolites that were detected only in the H group. Furthermore, Firmicutes (Lactobacillus) was enriched in the H group, which aligns well with the increased lactose in this group. The microbiome also helps in converting complex carbohydrates into reabsorbable substrates, such as simple sugars [35]. The higher diversity and amounts of simple sugars in the H group are indicative of a metabolically healthy status of the gut microbiome. In patients with CRC, we clearly observed reduced microbial and metabolic diversity. We observed increases in amino acids in the CRC group, indicating their association with disease phenotype. In summary, the use of an integrative analysis has the potential to be applied to personalized and predictive medicine.
Nonetheless, it is extremely challenging to evaluate fecal metabolites, a majority of which can be contributed by diet (and microbiota therein) and lifestyle, and to differentiate host-derived metabolites from those of the microbial metabolites without isotope-labeled diet studies, which are difficult to perform in human subjects. Moreover, without a controlled diet and for the simplicity of the study design, we could only associate metabolites with disease phenotypes at one timepoint in both groups. Additionally, the simple aqueous-methanolic sample extraction technique used failed to capture most of the nonpolar fatty acids, i.e., SCFAs, unconjugated secondary bile acids and other specialized metabolites and volatiles that are typically released by the gut microbiome and the host's gut cellular landscape [36]. This study has some limitations but opens new avenues to explore the gut microbiome-metabolome associations for biomarker discovery.
Conclusions
We demonstrated the capabilities of a nontargeted GC-MS-based metabolomics approach to successfully discriminate between H and CRC volunteers and associated different metabolites with health status or disease phenotype. Furthermore, fecal microbiome data displayed the signature microbiota representing the H and CRC patient groups, i.e., enrichment of Proteobacteria, Fusobacteria in CRC and Firmicutes in H groups as well as an uneven and lesser microbial diversity in CRC. Given that all the patients were from a single ethnicity, i.e., Han Chinese, identifying specific biomarkers for CRC prediction in a global population may not be straightforward. However, polyamines (cadaverine, putrescine) in CRC are potential biomarkers for discriminating CRC versus H status, pending further validation studies across georacial landscapes in larger cohorts performed over a longer time. This integrated analysis of the putative microbial metabolism based on the identified microbes and fecal metabolites provides more functional insights than either of the single datasets. Nonetheless, individual metabolites, i.e., polyamines, and OTU differences among individuals are helpful in differentiating between CRC and H status.
Abbreviations
16S rRNA: 16S ribosomal RNA; AMDIS: automated mass spectral deconvolution and identification system; AUC: area under the curve; CA19-9: carbohydrate antigen 19-9; CEA: serum carcinoembryonic antigen; CRC: colorectal cancer; CTS: chemical translation service; CV: coefficient of variation; FOBT: fecal occult blood test; GC-MS: gas chromatography-mass spectrometry; HCA: hierarchical clustering analysis; IBD: inflammatory bowel disease; IBS: irritable bowel syndrome; LDA: linear discriminant analysis; LEfSe: LDA coupled with effect size; POLS-DA: Orthogonal partial least squares discriminant analysis; OTU: operational taxonomic unit; PCA: principal component analysis; PCoA: principal coordinate analysis; QC: quality control; RDP: ribosomal database project; RI: retention indices; ROC: receiver operating characteristic; SCFA: short-chain fatty acid.
Supplementary Material
Supplementary figures and table legends.
Supplementary tables.
Acknowledgements
The authors would take this opportunity to thank all the participating patients and healthy volunteers for supporting this study by donating precious biomaterials for research.
Funding
This work was sponsored by the grants obtained from the National Natural Science Foundation of China (No.81230057, No.81472262, No.81372615, No.81802412), the Fudan Outstanding Young Talent Training Plan (No.YJYQ201601), the Shanghai Sailing Program (No.18YF1414900), and the Shanghai Pujiang Program (No.17PJD007).
Contributions
This work was designed by HQ, YM and AG; HQ and YM provided essential reagents and materials; WW and YY collected clinical samples, YY, WW and DB conducted laboratory assays; BM, YM, YY, LL, XL and DB analyzed and integrated data. YY, BM, WW drafted the manuscript. All authors read and approved the final version of the manuscript.
Competing Interests
The authors have declared that no competing interest exists.
References
1. Siegel RL, Miller KD, Fedewa SA, Ahnen DJ, Meester RGS, Barzi A. et al. Colorectal cancer statistics, 2017. CA Cancer J Clin. 2017;67:177-93
2. Chen W, Zheng R, Baade PD, Zhang S, Zeng H, Bray F. et al. Cancer statistics in China, 2015. CA Cancer J Clin. 2016;66:115-32
3. Vogelstein B, Papadopoulos N, Velculescu VE, Zhou S, Diaz LA Jr, Kinzler KW. Cancer genome landscapes. Science. 2013;339:1546-58
4. Song M, Garrett WS, Chan AT. Nutrients, foods, and colorectal cancer prevention. Gastroenterology. 2015;148:1244-60
5. Plummer M, de Martel C, Vignat J, Ferlay J, Bray F, Franceschi S. Global burden of cancers attributable to infections in 2012: a synthetic analysis. Lancet Glob Health. 2016;4:e609-16
6. Marchesi JR, Adams DH, Fava F, Hermes GD, Hirschfield GM, Hold G. et al. The gut microbiota and host health: a new clinical frontier. Gut. 2016;65:330-9
7. Shoaie S, Ghaffari P, Kovatcheva-Datchary P, Mardinoglu A, Sen P, Pujos-Guillot E. et al. Quantifying Diet-Induced Metabolic Changes of the Human Gut Microbiome. Cell Metab. 2015;22:320-31
8. Magnusdottir S, Heinken A, Kutt L, Ravcheev DA, Bauer E, Noronha A. et al. Generation of genome-scale metabolic reconstructions for 773 members of the human gut microbiota. Nat Biotechnol. 2017;35:81-9
9. Bultman SJ, Jobin C. Microbial-derived butyrate: an oncometabolite or tumor-suppressive metabolite? Cell Host Microbe. 2014;16:143-5
10. Louis P, Hold GL, Flint HJ. The gut microbiota, bacterial metabolites and colorectal cancer. Nat Rev Microbiol. 2014;12:661-72
11. Anand S, Kaur H, Mande SS. Comparative In silico Analysis of Butyrate Production Pathways in Gut Commensals and Pathogens. Front Microbiol. 2016;7:1945
12. O'Keefe SJ. Diet, microorganisms and their metabolites, and colon cancer. Nat Rev Gastroenterol Hepatol. 2016;13:691-706
13. Caporaso JG, Kuczynski J, Stombaugh J, Bittinger K, Bushman FD, Costello EK. et al. QIIME allows analysis of high-throughput community sequencing data. Nat Methods. 2010;7:335-6
14. Gao X, Pujos-Guillot E, Sebedio JL. Development of a quantitative metabolomic approach to study clinical human fecal water metabolome based on trimethylsilylation derivatization and GC/MS analysis. Anal Chem. 2010;82:6447-56
15. Caraux G, Pinloche S. PermutMatrix: a graphical environment to arrange gene expression profiles in optimal linear order. Bioinformatics. 2005;21:1280-1
16. Masumoto S, Terao A, Yamamoto Y, Mukai T, Miura T, Shoji T. Non-absorbable apple procyanidins prevent obesity associated with gut microbial and metabolomic changes. Sci Rep. 2016;6:31208
17. Poutahidis T, Erdman SE. Commensal bacteria modulate the tumor microenvironment. Cancer Lett. 2016;380:356-8
18. Johnson CH, Dejea CM, Edler D, Hoang LT, Santidrian AF, Felding BH. et al. Metabolism links bacterial biofilms and colon carcinogenesis. Cell Metab. 2015;21:891-7
19. Yu J, Feng Q, Wong SH, Zhang D, Liang QY, Qin Y. et al. Metagenomic analysis of faecal microbiome as a tool towards targeted non-invasive biomarkers for colorectal cancer. Gut. 2017;66:70-8
20. Goedert JJ, Sampson JN, Moore SC, Xiao Q, Xiong X, Hayes RB. et al. Fecal metabolomics: assay performance and association with colorectal cancer. Carcinogenesis. 2014;35:2089-96
21. Brown DG, Rao S, Weir TL, O'Malia J, Bazan M, Brown RJ. et al. Metabolomics and metabolic pathway networks from human colorectal cancers, adjacent mucosa, and stool. Cancer Metab. 2016;4:11
22. Weir TL, Manter DK, Sheflin AM, Barnett BA, Heuberger AL, Ryan EP. Stool microbiome and metabolome differences between colorectal cancer patients and healthy adults. PloS One. 2013;8:e70803
23. Monleon D, Morales JM, Barrasa A, Lopez JA, Vazquez C, Celda B. Metabolite profiling of fecal water extracts from human colorectal cancer. NMR Biomed. 2009;22:342-8
24. Blachier F, Boutry C, Bos C, Tome D. Metabolism and functions of L-glutamate in the epithelial cells of the small and large intestines. Am J Clin Nutr. 2009;90:814S-21S
25. Gerner EW, Meyskens FL Jr. Polyamines and cancer: old molecules, new understanding. Nat Rev Cancer. 2004;4:781-92
26. Cockbain AJ, Toogood GJ, Hull MA. Omega-3 polyunsaturated fatty acids for the treatment and prevention of colorectal cancer. Gut. 2012;61:135-49
27. Dermadi D, Valo S, Ollila S, Soliymani R, Sipari N, Pussila M. et al. Western Diet Deregulates Bile Acid Homeostasis, Cell Proliferation, and Tumorigenesis in Colon. Cancer Res. 2017;77:3352-63
28. Anantharaju PG, Gowda PC, Vimalambike MG, Madhunapantula SV. An overview on the role of dietary phenolics for the treatment of cancers. Nutr J. 2016;15:99
29. Pascal V, Pozuelo M, Borruel N, Casellas F, Campos D, Santiago A. et al. A microbial signature for Crohn's disease. Gut. 2017;66:813-22
30. Flemer B, Warren RD, Barrett MP, Cisek K, Das A, Jeffery IB. et al. The oral microbiota in colorectal cancer is distinctive and predictive. Gut. 2018;67:1454-63
31. Li M, Wang B, Zhang M, Rantalainen M, Wang S, Zhou H. et al. Symbiotic gut microbes modulate human metabolic phenotypes. Proc Natl Acad Sci U S A. 2008;105:2117-22
32. Machiels K, Sabino J, Vandermosten L, Joossens M, Arijs I, de Bruyn M. et al. Specific members of the predominant gut microbiota predict pouchitis following colectomy and IPAA in UC. Gut. 2017;66:79-88
33. Chen W, Liu F, Ling Z, Tong X, Xiang C. Human intestinal lumen and mucosa-associated microbiota in patients with colorectal cancer. PloS One. 2012;7:e39743
34. Schwabe RF, Jobin C. The microbiome and cancer. Nat Rev Cancer. 2013;13:800-12
35. O'Keefe SJ, Li JV, Lahti L, Ou J, Carbonero F, Mohammed K. et al. Fat, fibre and cancer risk in African Americans and rural Africans. Nat Commun. 2015;6:6342
36. Beger RD, Dunn W, Schmidt MA, Gross SS, Kirwan JA, Cascante M. et al. Metabolomics enables precision medicine: "A White Paper, Community Perspective". Metabolomics. 2016;12:149
Author contact
![]() Corresponding author: Yanlei Ma, MD, PhD, Department of Colorectal Surgery, Fudan University Shanghai Cancer Center; Department of Oncology, Shanghai Medical College, Fudan University, 270 Dong'an Road, Shanghai, 200032, China, Tel.: +86 21 64175590; Fax: +86 21 54175590, E-mail: yanleimaedu.cn.
Corresponding author: Yanlei Ma, MD, PhD, Department of Colorectal Surgery, Fudan University Shanghai Cancer Center; Department of Oncology, Shanghai Medical College, Fudan University, 270 Dong'an Road, Shanghai, 200032, China, Tel.: +86 21 64175590; Fax: +86 21 54175590, E-mail: yanleimaedu.cn.