Impact Factor
- Issue 14; 2026
- Issue 13; 2026
- Issue 12; 2026
- Issue 11; 2026
- Issue 10; 2026
- Volume 16; 2026
- Advance Articles
- Past Issues
- Cover Images
- Cover Suggestion
- Index & Coverage
- Special Issues
Introduction
Materials and Methods
Results
Discussion
Abbreviations
Supplementary Material
Acknowledgements
References
International Journal of Biological Sciences
International Journal of Medical Sciences
 Global reach, higher impact

Theranostics 2019; 9(15):4265-4286. doi:10.7150/thno.35914 This issue Cite
Research Paper
COL4A2 in the tissue-specific extracellular matrix plays important role on osteogenic differentiation of periodontal ligament stem cells
Yi Wen1,*, Hongxu Yang2,*, Junjie Wu1,3,4,*, ![]() , Axian Wang1, Xiaodong Chen5, Sijun Hu6, Yuxing Zhang4, Ding Bai3,
, Axian Wang1, Xiaodong Chen5, Sijun Hu6, Yuxing Zhang4, Ding Bai3, ![]() , Zuolin Jin1,
, Zuolin Jin1, ![]()
1. State Key Laboratory of Military Stomatology and National Clinical Research Center for Oral Diseases and Shaanxi Clinical Research Center for Oral Diseases, Department of Orthodontics, School of Stomatology, the Fourth Military Medical University, Xi'an, 710032, China.
2. State Key Laboratory of Military Stomatology, National Clinical Research Center for Oral Diseases, Shaanxi International Joint Research Center for Oral Diseases, Department of Oral Anatomy and Physiology and TMD, School of Stomatology, the Fourth Military Medical University, Xi'an, 710032, China.
3. State Key Laboratory of Oral Diseases, Department of Orthodontics, West China Hospital of Stomatology, Sichuan University, Chengdu, 610041, China.
4. Medical College, Xijing University, Xi'an, 710123, China.
5. Division of Research, Department of Comprehensive Dentistry, the University of Texas Health Science Center at San Antonio, San Antonio, TX 78229, USA.
6. State Key Laboratory of Cancer Biology and Xijing Hospital of Digestive Diseases, The Fourth Military Medical University, Xi'an, China.
*These authors contributed equally to this work.
Received 2019-4-20; Accepted 2019-4-26; Published 2019-5-31
Abstract

Periodontal ligament stem cells (PDLSCs) can repair alveolar bone defects in periodontitis in a microenvironment context-dependent manner. This study aimed to determine whether different extracellular matrices (ECMs) exert diverse effects on osteogenic differentiation of PDLSCs and accurately control alveolar bone defect repair.
Methods: The characteristics of PDLSCs and bone marrow mesenchymal stem cells (BMSCs) with respect to surface markers and multi-differentiation ability were determined. Then, we prepared periodontal ligament cells (PDLCs)-derived and bone marrow cells (BMCs)-derived ECMs (P-ECM and B-ECM) and the related decellularized ECMs (dECMs). Transmission electron microscopy (TEM), scanning electron microscopy (SEM), atomic force microscopy (AFM), and protein mass spectrometry were used to distinguish the ECMs. The expression of Type IV collagen A2 (COL4A2) in the ECMs was inhibited by siRNA or activated by lentiviral transduction of relevant cells. The stemness, proliferation, and differentiation of PDLSCs were determined in vitro in different dECMs. For the in vivo analysis, different dECMs under the regulation of COL4A2 mixed with PDLSCs and Bio-Oss bone powder were subcutaneously implanted into immunocompromised mice or in defects in rat alveolar bone. The repair effects were identified by histological or immunohistochemical staining and micro-CT.
Results: B-dECM exhibited more compact fibers than P-dECM, as revealed by TEM, SEM, and AFM. Protein mass spectrometry showed that COL4A2 was significantly increased in B-dECM compared with P-dECM. PDLSCs displayed stronger proliferation, stemness, and osteogenic differentiation ability when cultured on B-dECM than P-dECM. Interestingly, B-dECM enhanced the osteogenic differentiation of PDLSCs to a greater extent than P-dECM both in vitro and in vivo, whereas downregulation of COL4A2 in B-dECM showed the opposite results. Furthermore, the classical Wnt/β-catenin pathway was found to play an important role in the negative regulation of osteogenesis through COL4A2, confirmed by experiments with the Wnt inhibitor DKK-1 and the Wnt activator Wnt3a.
Conclusion: These findings indicate that COL4A2 in the ECM promotes osteogenic differentiation of PDLSCs through negative regulation of the Wnt/β-catenin pathway, which can be used as a potential therapeutic strategy to repair bone defects.
Keywords: bone defect, extracellular matrix, osteogenic differentiation, periodontal ligament stem cells, type IV collagen A2
Introduction
Periodontitis (PD) is a chronic disease characterized by irreversible and progressive degradation of the periodontal tissue and causes tooth loss and alveolar bone defects [1]. Due to local inflammation, epithelial cells that connect the surface between the teeth and gingival tissue are lost, followed by formation of an infected tooth pocket [2]. The process of PD depends upon the extent of infection and the bacterial species in periodontal plaques as well as various risk factors, such as age, genetic predisposition, systemic disease and smoking [1]. Currently, conventional treatment still focuses on removal of inflammatory factors and the plaques to slow progression of the disease but does not restore the lost alveolar bone. Therefore, alveolar bone regeneration has been the ultimate goal for dentists and researchers.
Recently, seed cells and extracellular matrix (ECM) scaffolds have been widely used in tissue engineering construction, either alone or in combination [3,4]. Stem cell-based therapy, a nascent but rapidly expanding field, has been introduced into the periodontal arena to potentially overcome the limitations of conventional regenerative procedures, leading to more effective therapeutics for predictable periodontal regeneration [5]. Periodontal ligament stem cells (PDLSCs), a type of stem/progenitor cell, are of neuroectodermal origin and have specific properties, such as self-renewal ability and multipotency [6]. PDLSCs have the ability to repair periodontal bone defects in the context of the existing microenvironment in PD and are increasingly being investigated as easily accessible undifferentiated cells [7]. ECM is a key component of the niche and provides critical mechanical and chemical signals to stem cells. Conversely, stem cells also influence ECM properties by secreting proteolytic enzymes and growth factors into the matrix [8,9]. Thus, there is a “give and take” relationship between stem cells and the ECM, which defines cell behavior [10,11].
ECM proteins can be roughly divided into two major categories: fibrous proteins, including collagen, elastin, fibronectin (FN), and laminin, and proteoglycans (PGs) and glycosaminoglycans (GAGs) [12]. Increasing evidence suggests that the ECM plays a specific role in regulation of stem cell functions through its unique mechanical and chemical properties [13-15]. For example, ECMs prepared from bone marrow cells (BMCs)- and adipocytes (ADCs)-derived from stromal cells present unique microenvironments, with variable biomolecules and architectural and mechanical properties [16]. More importantly, the tissue-specific microenvironment has various effects on stem cell behaviors, such as proliferation, morphology, and sensitivity to osteogenic or adipogenic induction [16]. It has been reported that ECM produced from chondrocytes promoted chondrogenic differentiation of stem cells, while ECM generated by both osteoblasts and chondrocytes in co-culture promoted stem cell osteogenic differentiation compared with the ECM prepared by chondrocytes alone [17]. PDLSCs are located in the ECM of the periodontal ligament area, which is formed by periodontal ligament cells (PDLCs). Further, the nearest neighbor is alveolar bone, which contains ECM derived from BMCs [6]. Overall, ECMs prepared from these two sources display different properties and would likely have different effects on PDLSCs.
Type IV collagen A2 (COL4A2) is one of the major structural components of the basement membrane. The C-terminal portion of this protein inhibits tumor growth [18]. COL4A2 forms a heterotrimer with COL4A1, which is essential for the stability and function of the vascular basement membrane [19]. In ECM, this isomerized trimer polymerizes to form a flexible sheet, which not only provides structural integrity but also participates in dynamic biological processes, including cell-matrix and cell-cell communication interactions [20-22]. Mutations in COL4A2 lead to cerebral hemorrhage and perforation and small vessel disease with reduced penetrance and a variable phenotype [23,24]. However, COL4A2 also promotes the differentiation potential of embryonic stem cells to endothelial cells [25]. Emerging evidence has shown that COL4A2 binds bone morphogenetic proteins (such as osteogenin and osteogenic protein-1) involved in angiogenesis and osteogenesis [26,27]. Bound angiogenic and bone morphogenetic proteins are then presented locally in an immobilized form to stem cells and osteoprogenitor-like cells to initiate osteogenesis [28]. Therefore, it is interesting to determine whether COL4A2 exists in PDLCs-derived and BMCs-derived ECMs and influences osteogenic differentiation of PDLSCs.
The Wnt/β-catenin signaling pathway is involved in numerous aspects of growth and development in many organs and tissues, ranging from cell fate determination, polarity, differentiation, migration, and proliferation [29]. Glycogen synthase kinase 3β (GSK-3β), a negative regulator in the canonical Wnt pathway, forms a multiprotein complex with its substrate and phosphorylates β-catenin when there is no upstream Wnt signal [30]. When the Wnt signaling pathway is activated, a cysteine in GSK3β is phosphorylated by Dishevelled (Dvl), accompanied by dephosphorylation of β-catenin [31]. Through regulation of the Wnt signaling pathway, GSK-3β and β-catenin are involved in bone formation and remodeling. In fact, inhibition of GSK-3β is necessary for nuclear accumulation and translocation of β-catenin [32]. Besides, inactivation of GSK-3β leads to the inhibition β-catenin degradation in the cytoplasm. It's known that β-catenin is an important regulator for canonical Wnt pathway activation, which is essential for proper bone development, and downregulation of this pathway impairs bone formation [33].
In this study, we investigated the role of COL4A2 in different ECMs in the maintenance of osteogenic differentiation of PDLSCs. We hypothesized that PDLSCs would exhibit an altered osteogenic capacity when cultured on B-dECM versus P-dECM because these two dECMs possess distinct COL4A2 contents. Therefore, we examined osteogenic differentiation of PDLSCs on B-dECM and P-dECM both in vitro and in vivo. Furthermore, we investigated whether COL4A2 affected osteogenic differentiation of PDLSCs through negative regulation of the canonical Wnt/β-catenin pathway.
Materials and Methods
Study design
Patient samples for cell isolation were collected at the School of Stomatology, Fourth Military Medical University, Xi'an, China. All procedures were performed according to institutional guidelines in accordance with the Declaration of Helsinki and were approved by the Ethics Committee of the Fourth Military Medical University, School of Stomatology (29 May 2015). All donors signed an informed consent form agreeing to the contribution of their teeth and bone for research purposes, and the study was approved by the hospital's ethics committee (license number: IRB-REV-2015038). BMCs were isolated from the cancellous jaw bones of orthognathic patients (three male patients and three female patients aged 18-30 who required segmentation of jaw bones and extraction of premolars during the orthognathic surgery), and PDLCs were isolated from extracted premolars from the same patients. ECM from five groups was used for PDLSC culture: (1) tissue culture plastic (TCP) without ECM (no-ECM group); (2) PDLCs-derived ECM (P-dECM group); (3) BMCs-derived ECM (B-dECM group) (4) BMCs-derived ECM with siRNA-downregulated COL4A2 (B-dECM + COL4A2-siRNA group); and (5) PDLCs-derived ECM with lentivirus-upregulated COL4A2 (P-dECM + LV-COL4A2 group). PDLSCs were purified and cultured on different dECMs. The in vivo transplantation samples also contained ECM from these five groups in addition to PDLSCs. Moreover, PDLSCs were cultured on the donor-matched decellularized ECM derived from one cell line.
Isolation and characterization of BMCs and PDLCs
Cancellous bone was cut into fragments using aseptic eye tweezers. BMCs were incubated at 37 °C in 95% humidified air containing 5% CO2 in Minimum Essential Medium alpha (α-MEM; Gibco, C12571500BT) supplemented with 10% fetal bovine serum (FBS; Gibco, 16000-004), 100 mg/ml streptomycin and 100 U/ml penicillin (HyClone, SV30010). PDLCs were isolated as previously reported [34]. Briefly, periodontal ligament from premolars was digested with 3 mg/ml type I collagenase (Sigma-Aldrich, SCR103) at 37 °C for 1 h, and cells were centrifuged at 190 rcf for 5 min. Subsequently, the PDLCs were suspended in fresh α-MEM and seeded in culture dishes. BMCs collected from a patient's bone marrow were used to prepare B-dECM and PDLCs collected from the same patient's premolars were used to generate P-dECM. Furthermore, to isolate and purify the PDLSCs and BMSCs, single-cell suspensions of primary PDLCs and BMCs were seeded in 96-well plates as reported previously [35]. Single cell-derived colony cultures were obtained from each well using the limiting dilution technique, and passage 0 (P0) cells were cultured. To avoid changes in cell behaviors that are associated with long-term culture in vitro, cells mixed from ten colonies at passages 1-3 (P1-P3) were used for subsequent investigation in the present study. To define human stem cells as per the Mesenchymal and Tissue Stem Cell Committee of the International Society for Cellular Therapy protocol [36], we evaluated surface markers of BMSCs and PDLSCs (P2) with mouse anti-CD90-FITC (1:50; Abcam, ab124527), mouse anti-CD73 (1:50; Abcam, ab81720), mouse anti-CD105 (1:200; Abcam, ab114052) and mouse anti-Stro-1 (1:25; Abcam, ab102969) antibodies to target positive markers and rabbit anti-CD34 (1:50; Abcam, ab81289) and rabbit anti-CD45 (1:100; Proteintech, 20103-1-AP) antibodies to target negative markers. The secondary antibodies were Alexa Fluor@488 goat anti-rabbit IgG H&L (1:1000; Abcam, ab150077) and FITC-conjugated goat anti-mouse IgG H&L (1:1000; Abcam, ab6785). Cell fluorescence was determined using a flow cytometer apparatus (BD Biosciences, San Jose, CA, USA).
Colony-forming assay
PDLSCs and BMSCs (P1) were plated at a density of 1×10³ cells in α-MEM in 10 cm diameter culture dishes for colony-forming unit-fibroblast (CFU-F) assays. After 14 days, the cells were fixed with 4% paraformaldehyde and stained with 1% toluidine blue.
Multiple differentiation of cells in vitro
The multiple differentiation capacities of PDLSCs and BMSCs were determined according to the methods previously described [35,37]. Briefly, 1 × 10⁶ cells (P2) were cultured in α-MEM in 6-well plates without inducers until confluence. At confluence, the medium was changed to osteogenic medium (Cyagen, HUXMA-90021) or adipogenic medium (Cyagen, HUXMA-90031). The induction medium was refreshed at 3-day intervals. For adipogenic induction, the cells were fixed with 4% paraformaldehyde after 3-week culture and stained with Oil Red O (Cyagen, HUXMA-90031), and lipid droplets were identified microscopically. For osteogenic induction, the cells were fixed with 4% paraformaldehyde after 3-week culture and stained with alizarin red (Cyagen, HUXMA-90021). Unbound and nonspecifically bound stain was removed by copious rinsing with distilled water and stained calcium nodules were identified microscopically. For the chondrogenic differentiation induction, 1 × 10⁶ of cells (P2) were cultured in cluster in 15 ml centrifuge tube with the chondrogenic medium (Cyagen, HUXMA-90041). After 21 days of induction, the clusters were fixed with 4% paraformaldehyde and embedded in paraffin. 4-μm section was used for alcian blue staining (Cyagen, HUXMA-90041) for identification.
ECM preparation and decellularization
BMCs and PDLCs were seeded at a density of 1 × 10⁶ cells per well in 6-well plates in α-MEM, which was substituted with medium containing 10% FBS and 50 mg/L ascorbic acid for induction of ECMs (B-ECM and P-ECM). After 10 days, a cell sheet was prepared and then permeabilized with sterile 1% Triton X-100 containing 20 mM NH4OH in PBS according to previously published procedures [38]. The B-dECM and P-dECM were washed twice with PBS. To prepare tissue culture plates (TCPs) coated with COL4A2, the TCPs (for the no-ECM group) were precoated with COL4A2 (0.5 mg/ml, ImmunoClone) dissolved in sterile water, spread on culture dishes, and allowed to dry in a sterile environment. In addition, to prepare P-dECM coated with COL4A2 (P-dECM + COL4A2), P-dECM was coated with COL4A2 after decellularization. The other steps followed to construct P-dECM + COL4A2 were the same as those for P-dECM. TCPs were coated with fibronectin and proteoglycans using the same procedure described above.
Verification of ECMs via Transmission Electron Microscopy (TEM), Scanning Electron Microscopy (SEM), and Atomic Force Microscopy (AFM)
The ultrastructure of ECMs was observed via TEM (Hitachi, H-600, Tokyo, Japan). The ECMs were fixed with 2% glutaraldehyde for 2 h and then rinsed, embedded, and sliced followed by electron staining with lead citrate [39]. SEM was employed to determine the morphology of the ECMs (Hitachi, S-4800, Tokyo, Japan) [38]. Briefly, specific ECMs were fixed in 2.5% glutaraldehyde and incubated at 4 °C overnight. After two washes with PBS, the fixed samples were dehydrated in graded ethanol. Further, the samples were treated by vacuum drying and sputtered with gold-palladium. Finally, images of dry ECM surface topographies in ambient air were recorded using an Agilent 5500 AFM in tapping mode (Agilent, AFM5500, Santa Clara, CA, USA).
LC-MS/MS analysis for protein mass spectrometry analysis of B-dECM and P-dECM
Cells were eluted and the dECM was lysed in PBS under ultrasonic concussion. An equal volume of proteins was processed according to the in-gel digestion protocol using trypsin. Briefly, after Coomassie Blue staining, the entire lanes of interest were excised and cut into small pieces (Figure S1A, B). Gel slices were then digested with modified sequencing-grade trypsin (Promega, V5111, USA) at 37 °C overnight. Peptides were extracted with 50%/80% acetonitrile/0.1% formic acid (FA) (ACROS, USA) twice. The combined supernatant fractions were dried in a SpeedVac (Christ, Germany) and resolved with 0.1% FA for mass spectrometry analysis. The analysis of the peptides was performed as described previously [40]. Briefly, peptide samples were analyzed via LC-MS/MS using a nano UltiMate 3000 UPLC system (Dionex, USA) coupled to a Q-Exactive mass spectrometer (Thermo Fisher Scientific, Germany). Five microliters of each sample were loaded onto a C18 trap column (Eksigent, 5016752, USA) followed by an analytical C18 column (Eksigent, 805-00120, USA). The MS data were analyzed using MaxQuant version 1.5.2.8 software [41]. Label-free quantification was carried out using MaxQuant as previously described [42]. Protein abundance was calculated based on the normalized spectral protein intensity (LFQ intensity). The total protein content was defined as the sum of peptide intensities integrated over the elution profile of each peptide. A t-test was applied to examine differences in protein intensities between the two groups, with a significance threshold value of 0.05.
siRNA for COL4A2 knockdown and lentiviral transduction for COL4A2 upregulation
siRNA was designed by Biomics (Nantong, China) to downregulate COL4A2 expression. The sequences were siRNA-1: Forward CGGGUGUGAAGAAGUUUGA; Reverse UCAAACUUCUUCACACCCG, siRNA-2: Forward GGCAGAAAGGUGAGCCUUA; Reverse UAAGGCUCACCUUUCUGCC and siRNA-3: Forward GGAAUCAGAUGUACAGAA; Reverse UUCUGUACAUCUGCAUUCC. PDLCs and BMCs were seeded at a density of 1 × 10⁶ cells per well in 6-well plates. Transfection of the BMCs with COL4A2 siRNA was performed according to the manufacturer's protocol. Briefly, siRNA/Lipofectamine mixture was transferred to the 6-well plates and incubated with cells for 8 h at 37 °C. Following replacement of the culture medium, the cells were incubated in α-MEM. COL4A2 knockdown was verified by qPCR and Western blotting in BMCs (Figure S2A, B). Following downregulation of COL4A2 expression in BMCs, the dECM was extracted to determine the COL4A2 expression level (Figure S2C). We chose siRNA-2, which achieved approximately 90% knockdown. Next, COL4A2 Lentiviral Activation Particles (h) (Santa Cruz, sc-401462-LAC) were used to upregulate COL4A2 protein expression. Lentiviral transduction utilized the following SAM activation elements: a deactivated Cas9 (dCas9) nuclease (D10A and N863A) fused to the transactivation domain VP64, an MS2-p65-HSF1 fusion protein, and a target-specific 20-nt guide RNA. Control Lentiviral Activation Particles (Santa Cruz, sc-437282) were used a negative control (Figure S2D, E). After upregulation of COL4A2 expression in PDLCs, the dECM was extracted, and COL4A2 expression was determined (Figure S2F).
Wnt3a and DKK-1 treatments
PDLSCs (P2) were seeded at a density of 1 × 10⁶ cells on B-dECM, B-dECM + COL4A2-siRNA, P-dECM, P-dECM + LV-COL4A2 or no-ECM without inducers until confluence. At confluence, the medium was changed to osteogenic differentiation culture condition with human recombinant Wnt3a (100 ng/ml, R&D Systems, 5036-WN) or the soluble Wnt inhibitor human recombinant DKK-1 (100 ng/ml, Pepro-Tech, 120-30). After 7 days in osteogenic culture, cells were harvested and subjected to Western blot analysis. Osteogenic differentiation was determined by alizarin red staining after 14 days.
PDLSC osteogenic differentiation on specific dECMs
PDLSCs at passage 2 were cultured on specific dECMs and no-ECM at a density of 1 × 10⁶ cells per well in 6-well plates at 80% confluence. For osteogenesis assays, the adherent cells were cultured in osteoinductive differentiation medium (Cyagen, HUXMA-90021) [43]. The medium was changed every two days. After osteogenic induction, the formation of mineralized nodules was identified using alizarin red staining at day14 and ALP staining at day 7.
Assessment of mineralized calcium deposition via alizarin red staining
After 14 days of osteogenic induction, alizarin red staining was used to evaluate calcium mineralization. Briefly, cells were fixed with 4% paraformaldehyde for 15 min at room temperature, washed with PBS and stained with alizarin red (Cyagen, HUXMA-90021) for 20 min at room temperature. Cells were washed with PBS, images of mineralized nodules were acquired with an inverted microscope, and absorbance was quantitatively measured at 560 nm for statistical analysis.
Alkaline phosphatase activity assay
Alkaline phosphatase (ALP) activity in whole-cell lysates was quantified on day 7 of osteogenic induction in cells cultured on B-dECM, B-dECM + COL4A2-siRNA, P-dECM, P-dECM + LV-COL4A2, or no-ECM using an alkaline phosphatase assay kit (Nanjing Jiancheng Bioengineering Institute, A059) according to the manufacturer's protocol. The cells were lysed with 1% Triton X-100 on ice. The supernatant was collected and assayed using an ALP activity kit. Briefly, a 30-µl sample was mixed with working assay solution and incubated for 15 min at 37 °C. Absorbance readings were taken at 520 nm, and the concentration of each sample was calculated using a standard curve. The alkaline phosphatase activity was normalized to total cellular protein concentration determined by a bicinchoninic acid (BCA) assay (Beyotime, China).
Cell cycle distribution and reactive oxygen species (ROS) accumulation in PDLSCs
PDLSCs (P2) were seeded at a density of 2 × 10⁵ cells per well in 6-well plates on specific dECMs. After 24 h, cell cycle was examined. PDLSCs were washed with PBS, digested, and centrifuged. Pre-chilled 70% ethanol was added, and the cell suspension was stored overnight at 4 °C. After the cells were fixed for 24 h, PDLSCs were washed with PBS, and 100 μl of RNaseA was added to the suspension, followed by incubation in a 37 °C water bath for 30 min. Finally, 400 μl propidium iodide was added and incubated with cells at 4 °C for 30 min in the dark. Flow cytometry was used to detect the cell cycle distribution (Cytomics FC500, Beckman-Coulter, CA, USA).
Intracellular ROS levels were quantified using the DCF-DA fluorescence method. Briefly, 2 × 10⁵ PDLSCs (P2) were incubated in 10 μM 2′, 7-dichlorofluorescein diacetate (DCF-DA) at 37 °C for 30 min. After three washes with FBS-free medium, fluorescence intensity was measured using a Cytomics FC500 flow cytometer.
Animal study
All procedures and animal care were performed in accordance with institutional guidelines and were approved by the Ethics Committee of the Fourth Military Medical University. All surgeries were performed under sodium pentobarbital anesthesia, and all efforts were made to minimize suffering. Fifty-four 6-week-old female Sprague-Dawley (SD) rats (weight 140-160 g) and 21 6-week-old female immunocompromised mice were obtained from the animal center of the Fourth Military Medical University in Xi'an, China. The animals were housed in groups of 3-4 per cage and acclimatized to the laboratory conditions (12 h light/dark cycle; 22 ± 1 °C room temperature) for 1 week before experimentation. The animals had free access to food and water. The rats and immunocompromised mice were equally divided into five groups for transplantation of implants into a defect or subcutaneous transplantation (n = 6 in each group): no-ECM, P-dECM, P-dECM + LV-COL4A2, B-dECM, and B-dECM + COL4A2-siRNA groups. In addition, 24 SD rats were divided into blank, Bio-Oss, Bio-Oss + P-dECM, and Bio-Oss + B-dECM implantation groups. Six immunocompromised mice were sorted into no-ECM + COL4A2 (TCP coated with COL4A2 peptide) and P-dECM + COL4A2 (P-dECM coated with COL4A2 peptide) implant transplantation groups. Briefly, we used a model of maxillary defects in rats as previously reported [37]. A defect was prepared with a 3-mm-diameter round bur in the mesial-lingual side of the maxillary first molar in each SD rat, ensuring that the size of each defect was the same as that of the round bur. The maxillary alveolar bone defects were created intermittently to prevent alveolar bone necrosis caused by excessive heat. For the immunocompromised mice, we made a longitudinal incision slightly on the left and right side in the middle of the mouse back. Two implants per mouse were inserted. To track the osteogenic ability of cells in vivo in immunocompromised mice, we labeled PDLSCs (P2) with a YFP plasmid. The following plasmid and lentivirus were designed and constructed by Genechem (Genechem Company, Shanghai, China): Ubi-MCS-3FLAG-SV40-YFP-IRES-puromycin for labeling of PDLSCs with YFP luciferase.
After 2 × 10⁶ PDLSCs were centrifuged at 190 rcf for 5 min, the supernatant was discarded, and 1 ml culture medium was added to the 2 ml EP tube with an appropriate amount of Bio-Oss bone (81700578, Geistlich, Switzerland) and incubated at 37 °C for 1 h. PDLSCs treated according to the five dECM groupings described above and Bio-Oss bone powder were implanted in the back of immunocompromised mice or the defect in the rat alveolar bone. Eight weeks after surgery, the animals were euthanized, and the new bone was prepared for histological and immunohistochemical staining.
Micro-CT and immunohistochemical staining (IHC)
Animal samples were fixed with 4% paraformaldehyde and the micro-CT scanning was reconstructed with an isotropic voxel size of 4 μm, and the three-dimensional images acquired from microtomographic slices were utilized for quantitative evaluation [37]. For morphological and immunohistochemical analysis, tissue blocks were embedded in paraffin after decalcification in 10% EDTA (Sigma-Aldrich, 798681) for 4 weeks. Serial sections of the rat and mice samples in the sagittal plane with a thickness of 4 μm were mounted onto poly-L-lysine-coated glass slides (Leica, RM2135, Wetzlar, Germany). Hematoxylin and eosin (H&E) staining was used after deparaffinization and rehydration. IHC was performed via avidin-biotin complex (ABC) staining. The sections were blocked with 5% skim milk powder for 1 h at room temperature and then washed with PBS and incubated with rabbit anti-Collagen-I (Col-I) (1:200; Abcam, ab34710) and rabbit anti-OCN (1:100; Proteintech, 23418-1-AP) primary antibodies. The rabbit IgG negative control was utilized for rat and mouse sections (Figure S3). Images were acquired using a Leica DFC490 system under a light microscope (Leica, DM 2500, Wetzlar, Germany). Differences in matrix composition after decellularization of the B-dECM and P-dECM were detected with primary rabbit anti-Col-I (1:200; Abcam, ab34710) and rabbit anti-fibronectin (1:200; Abcam, ab2413) antibodies followed by secondary antibodies (Zhongshan, China). IHC for Col-I expression in the tissue samples and for cell tracing was performed with rabbit anti-Col-I (1:200; Abcam, ab34710) and goat anti-rabbit IgG H&L-FITC (1:500, Abcam, ab6717) antibodies. The results were examined using a fluorescence microscope (AX10, ZEISS, Japan).
Sirius red staining
For detection of new bone material in animals, Sirius red staining was performed to distinguish type I to IV collagen. After deparaffinization and rehydration, 4-μm sections of samples were stained with Sirius red solution for 8 min and then rinsed with distilled water. Subsequently, the sections were subjected to dehydration with anhydrous alcohol, cleared with xylene and observed under a polarized light microscope.
RNA extraction, reverse transcriptase PCR (RT-PCR) and quantitative real-time PCR (qPCR)
qPCR was used to detect the gene expression of PDLSCs cultured on specific dECMs in osteogenic differentiation culture condition. Total RNA was extracted using Tripure Reagent (Roche) according to the manufacturer's protocol followed by RT-PCR and cDNA synthesis. RT-PCR was performed with 1 µg of total RNA using oligo-deoxythymidine primers (Roche Diagnostics, Basel, Swiss) in 20 µl at 37 °C for 20 min. Gene expression was analyzed by qPCR using SYBR® Premix Ex TaqTM II (RR820A, Takara, Japan) in the CFX96 Real-time PCR machine (Bio-rad, Hercules, CA, USA). qPCR was conducted with Gapdh as the house-keeping gene and the mean values were derived using the formula 2-ΔΔCt. The primer sequences are detailed in Table S1.
Western blotting
For the detection of β-catenin expression in the nuclei, nuclear proteins were extracted with the Nuclear Extraction Kit according to the manufacturer's protocol (KeyGen Biotech, China). Total proteins were extracted from the cells or dECMs by lysis in RIPA buffer. Protein concentrations were determined using the bicinchoninic acid (BCA) assay (Thermo Scientific, Waltham, MA). Proteins were then separated by 10% sodium dodecyl sulfate-polyacrylamide gel electrophoresis (SDS-PAGE; Bio-Rad, Hercules, CA). The separated proteins were transferred onto a polyvinylidene fluoride (PVDF) membrane (Bio-Rad). The primary antibodies for the total proteins included: rabbit anti-Col-IV (1:500; Novus, NBP1-19632), rabbit anti-ALP (1:1000; Abcam, ab108337), goat anti-Runx2 (1:200; Santa Cruz Biotechnology, sc8566), rabbit anti-Col-I (1:1000; Abcam, ab34710), rabbit anti-Sox-2 (1:500; Proteintech, 11064-1-AP), rabbit anti-Nanog (1:500; Proteintech, 14295-1-AP), rabbit anti-Oct-4 (1:500; Cell Signaling Technology, 2750), rabbit anti-Ki67 (1:1000; Abcam, ab16667), rabbit anti-Cyclin B1 (1:500; Proteintech, 55004-1-AP), rabbit anti-Cyclin D1 (1:200; Santa Cruz Biotechnology, sc8396), rabbit anti-β-catenin (1:500; Cell Signaling Technology, 8480), rabbit anti-GSK3β (1:500; Cell Signaling Technology,12456), and rabbit anti-p-GSK3β (1:500; Cell Signaling Technology, 5558). The primary antibodies for nuclear proteins included: rabbit anti-β-catenin (1:500; Cell Signaling Technology, 8480) and rabbit anti-Histone (1:500; Cell Signaling Technology, 7631). After several washes in Tris-buffered saline (Sigma-Aldrich, T5030) with 0.2% Tween (TBST), the membranes were incubated with the corresponding HRP-conjugated secondary antibodies (1:2000, Zhongshan, China) and then developed using electrochemiluminescence (ECL) agents (Millipore, Darmstadt, Germany). To compare the relative protein intensity of each group, loading was normalized using rabbit anti-GAPDH (1:1000; Abcam, ab8245) expression before analysis.
Statistical analysis
All data were obtained from independent samples or observations. The values are presented as the mean ± standard deviation. Statistical analysis was performed using SPSS software, version 17.0 (SPSS, Inc., IL, USA). A Kolmogorov-Smirnov test was performed to evaluate the Gaussian distribution of the data (all P > 0.1). All groups of data were assessed for homogeneity of variance using a Fisher test. Unpaired Student's t-test was used to compare data from two groups if the homogeneity of variance was consistent; Satterthwaite's t-test was used if the homogeneity of variance was not equal. Differences among the three groups were analyzed via one-way analysis of variance (ANOVA), Tukey's test was performed in all pairwise comparisons. P < 0.05 was considered statistically significant. Effect size and statistical power were calculated by G*power 3.1 software (Heinrich-Heine University Duesseldorf, Germany). For all studies, the data were evaluated by Student's t-test, the effect size index d ranged from 1.9537 to 19.2543, and the statistical power ranged from 0.8216 to 0.9998. For the comparison of three groups, the effect size index f ranged from 1.6137 to 28.2940 and the statistical power ranged from 0.9891 to 1.0000.
Results
Culture and characterization of PDLSCs and BMSCs
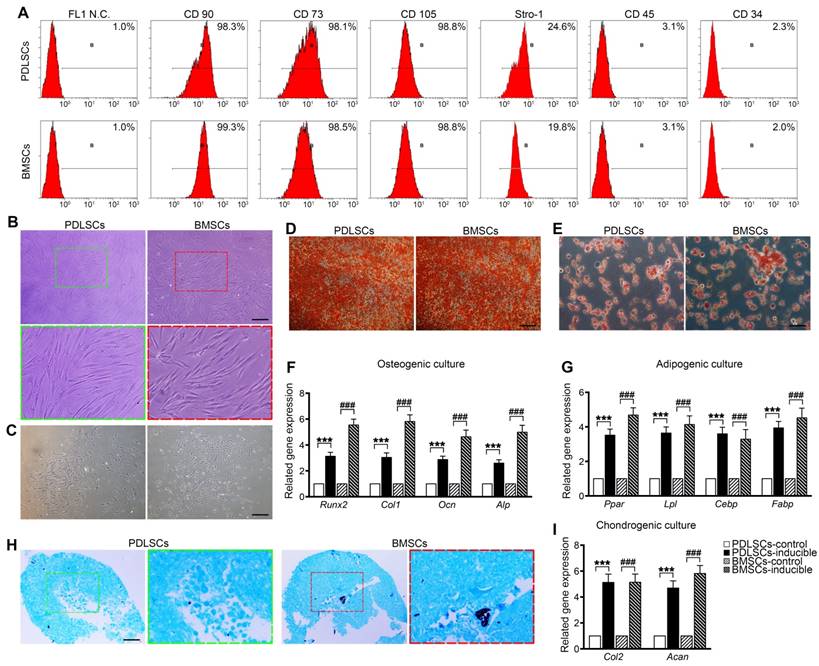
PDLSCs and BMSCs were obtained from primary PDLCs and BMCs by limited dilution. Flow cytometry analysis showed that passage 2 PDLSCs and BMSCs exhibited similar phenotypes based on mesenchymal surface markers, including CD90, CD73, CD105 (more than 98%) and Stro-1 (more than 19.8%), whereas they were negative for CD45 and CD34 (less than 3.1%) [34] (Figure 1A). PDLSCs were mostly long-spindle fibroblast-like cells, and BMSCs exhibited an irregular form, mostly a polygonal shape (Figure 1B). Both PDLSCs and BMSCs exhibited the ability to form colonies from one cell (Figure 1C). Under osteogenic and adipogenic induction, PDLSCs and BMSCs differentiated into osteogenic and adipogenic lineages, detected by alizarin red staining for mineralized nodules and oil red staining for lipid droplets (Figure 1D, E). qPCR results indicated that both BMSCs and PDLSCs, in response to osteogenic or adipogenic induction medium, expressed 3-fold higher levels of osteogenesis-related transcripts, such as Runx2, Col1, Ocn, and Alp, or 3.5-fold higher levels of adipogenesis-related transcripts, including Pparγ, Lpl, Cebp, and Fabp, compared with the untreated controls (Figure 1F, G). Furthermore, chondrogenic medium induced chondroblast differentiation of PDLSCs and BMSCs with 5-fold expression upregulation of chondrogenic-specific genes, such as Acan and Col2 (Figure 1H, I). These results reveal that the isolated PDLSCs and BMSCs exhibited stem cell properties in vitro.
Cell culture and characterization of PDLSCs and BMSCs. (A) Flow cytometric analysis showing positive expression of CD73, CD90, CD105, and STRO-1 and negative expression of CD34 and CD45 in PDLSCs and BMSCs. (B) Morphology of passage 2 PDLSCs and BMSCs. Green box, high magnification of the PDLSCs. Red box, high magnification of the BMSCs. Black bar, 50 µm. (C) Representative images of single clones of PDLSCs and BMSCs. Black bar, 100 µm. (D, E) Osteogenic or adipogenic differentiation ability of PDLSCs and BMSCs assayed by alizarin red staining or oil red staining. Black bar, 25 µm. (F, G) mRNA expression levels of Runx2, Col-I, OCN, and ALP in osteogenic groups and the mRNA expression levels of Pparγ, Lpl, Cebp, and Fabp in adipogenic groups. (H) Chondrogenic differentiation ability of PDLSCs and BMSCs assayed by Alcian Blue staining. Black bar, 25 µm. (I) mRNA expression levels of Col-2 and Acan in chondrogenic groups. The data are presented as the means ± SD; n = 5. *** P < 0.001 represents significant differences in inducible group compared with control group PDLSCs. ### P < 0.001 represents significant differences in inducible group compared with control group BMSCs.
Enhanced proliferation and maintenance of PDLSC stemness induced by decellularized ECM from BMCs
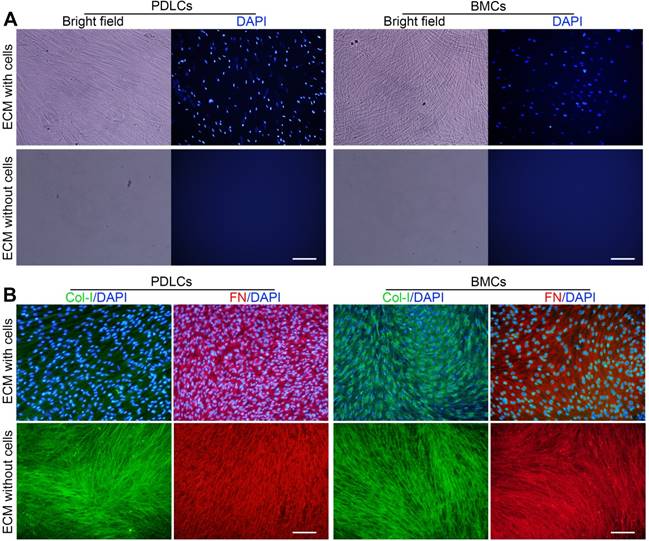
Primary PDLCs and BMCs were cultured for 10 days, and ECM formation was induced. P-dECM and B-dECM were obtained according to previously published procedures [36]. Phase contrast microscopy revealed that the cells were confluent before decellularization and that only the ECM scaffold remained after decellularization (Figure 2A). Immunofluorescence staining showed the presence of distinct cell nuclei before decellularization and a lack of DAPI-positive staining after decellularization, illustrating that the nuclei were disrupted, and the genetic material was degraded and removed (Figure 2A). B-ECM, B-dECM, P-ECM and P-dECM all contained collagen I (Col-I) and fibronectin that were well preserved and exhibited no content differences before and after decellularization (Figure 2B).
Representative images showing decellularization of B-ECM and P-ECM. (A) Phase contrast and fluorescence micrographs of DAPI staining of B-ECM and P-ECM before and after decellularization. White bar, 100 µm. (B) Immunofluorescence images showing localization of Col-I and FN in B-ECM and P-ECM before and after decellularization. White bar, 100 µm.
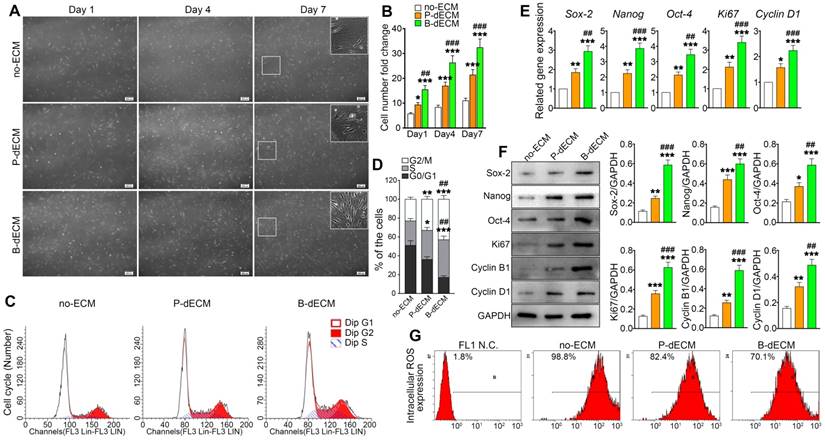
To investigate the effects of specific dECMs on cell proliferation, PDLSCs (P2) were cultured on B-dECM, P-dECM, or no-ECM in a regular growth medium. After 1, 4, and 7 days, PDLSCs cultured on B-dECM showed higher cell number and density compared with cells cultured on P-dECM (1.7-fold, 1.6-fold and 1.4-fold respectively versus the P-dECM), and both dECM groups exhibited more increased cell numbers compared with the no-ECM group (P < 0.05) (Figure 3A, B). Furthermore, flow cytometric analysis results suggested that PDLSCs cultured on no-ECM exhibited a significantly higher fraction of cells in G0/G1 phase versus cells cultured on B-dECM or P-dECM (54.3% vs. 18.9% or 37.6%). Additionally, PDLSCs cultured on B-dECM showed enrichment of cells in S phase compared with those cultured on P-dECM (38.1% vs 29.4%) (Figure 3C, D). To evaluate the rate of PDLSC proliferation at the molecular level, the relative expression of cell cycle-regulated genes, including Ki67 and Cyclin D1, were examined. qPCR results indicated that PDLSCs cultured on B-dECM displayed significantly higher expression of Ki67 and Cyclin D1 (1.6-fold and 1.5-fold respectively versus the P-dECM) (Figure 3E). Western blot analysis of total proteins further confirmed the results obtained from qPCR analysis of Ki67, Cyclin B1 and Cyclin D1 (Figure 3F). Although B-dECM is implicated in triggering cell proliferation, it is important to examine its effect on maintaining the stemness of PDLSCs. Therefore, Sox-2, Nanog, and Oct-4, which are considered stemness markers, were quantitatively analyzed via qPCR and Western blotting (Figure 3E, F). PDLSCs cultured on B-dECM exhibited higher stemness, and both dECMs induced higher proliferative capacity and stemness than no-ECM. Moreover, ROS production determined by flow cytometric analysis showed the lowest ROS accumulation when the cells were cultured on B-dECM (70.1%) compared with P-dECM (82.4%) or no-ECM (98.8%) (Figure 3G). These results suggest that B-dECM exerted a stronger effect on PDLSC proliferation and stemness for self-renewal than P-dECM and both these dECMs had better self-renewal properties than no-ECM.
Proliferation of PDLSCs cultured on B-dECM, P-dECM and no-ECM. (A) Representative images of passage 2 PDLSCs cultured on B-dECM, P-dECM and no-ECM after day 1, day 4, and day 7 to monitor cell density and proliferative ability. White box, high magnification of PDLSCs in different cultured ECMs. Black bar, 200 µm. (B) Number of PDLSCs on specific dECMs and no-ECM at day 1, 4 and 7. (C, D) Changes in cell cycle after expansion for 24 h were measured using flow cytometry. Analytical comparison of cell cycle differences between groups. (E) mRNA expression levels of Sox-2, Nanog, and Oct-4 to assess stemness and Ki67 and Cyclin D1 to assess proliferative ability of PDLSCs cultured on specific dECMs and no-ECM. (F) Western blotting results showing the expression of stemness- and proliferation-related proteins in PDLSCs cultured on specific dECMs and no-ECM. Quantitation of blots (right panel). (G) Intracellular ROS accumulation in PDLSCs cultured on dECMs and no-ECM, labeled with DCF-DA; fluorescence intensity was measured by flow cytometry. The data are presented as the means ± SD; n = 5. * P < 0.05, ** P < 0.01 and *** P < 0.001 represent significant differences in the indicated columns (P-dECM and B-dECM) compared with the no-ECM group. ## P < 0.01 and ### P < 0.001 represent significant differences between the P-dECM and B-dECM groups.
Enhanced COL4A2 expression and fibril formation on B-dECM versus P-dECM
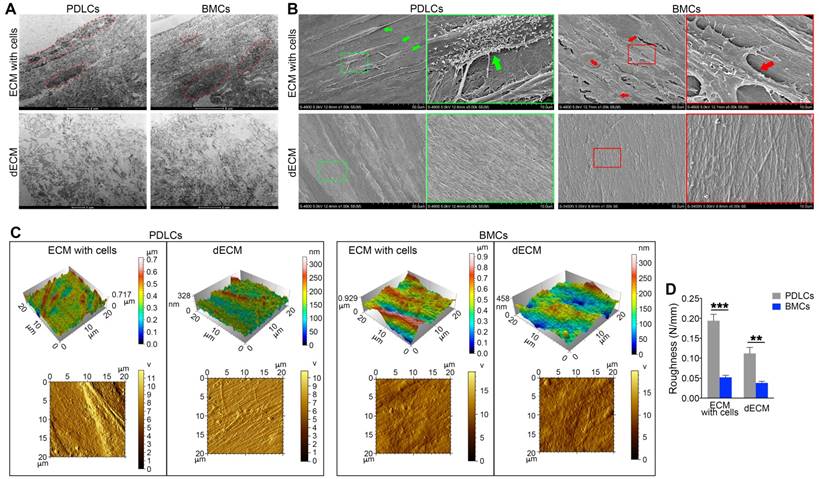
To confirm the enhanced proliferation and self-renewal ability of PDLSCs on different dECMs, we examined the ultrastructure and morphology of dECMs. TEM data showed that cell structures could be discerned in ECMs prepared from either BMCs or PDLCs before cell removal. After decellularization, cell structures in B-dECM and P-dECM disappeared. Significantly, a more regular and compact arrangement of collagen fibers with longer fiber length was observed in B-dECM than in P-dECM (Figure 4A). Further, the SEM results showed elaborate fibers with an identifiable morphology in both B-dECM and P-dECM. After decellularization, the cells were completely removed without debris, while the well-organized fibril structure of the ECMs was preserved. It appeared that collagen fibers within P-dECM were thinner than those in B-dECM. Additionally, B-dECM had stronger and thicker collagen without branching. An excessive density of the fibers, which were closely linked with almost no intervals, was observed (Figure 4B). We next used AFM to examine the surface topography of both ECMs before and after cell removal. Clear and spindle cell contours and collagen were present before decellularization, whereas only ordered collagen could be seen after decellularization. Additionally, images suggested that the roughness of P-dECM was greater than that of B-dECM (2.8-fold, P < 0.01) (Figure 4C, D). These results suggest that the enhanced proliferation and self-renewal ability of PDLSCs in the B-dECM group may be caused by differences in the collagen and fibers, which were thicker and denser than those in P-dECM.
Electron micrographs of decellularization of B-ECM and P-ECM. (A) TEM analysis of ECMs prepared from the two cell types before and after decellularization. Red dots, the indicated cellular structure. (B) SEM analysis of ECMs prepared from the two cell types before and after decellularization. Green box, high magnification of P-ECM. Green arrow, the indicated PDLC cellular structure. Red box, high magnification of B-ECM. Red arrow, the indicated BMC cellular structure. (C) 3D structure phase and tapping mode amplitude AFM images of B-ECM and P-ECM before and after decellularization. (D) Difference in roughness of B-ECM and P-ECM before and after decellularization. The data are presented as the means ± SD; n = 5. ** P < 0.01 and *** P < 0.001 represent significant differences between the indicated columns.
Next, we compared protein components at the molecular level between B-dECM and P-dECM using proteomic analysis. In our analysis, proteins were identified at razor+ unique peptide >1. There was significant up- or down-regulation (P < 0.05) of 44 proteins in B-dECM compared with P-dECM, including COL4A2, RPS8, RPL13, RPL7 and RPL4 (Table 1). Gene ontology (GO) function analysis revealed that the differentially expressed proteins were concentrated in the actin cytoskeleton and in extracellular matrix signaling (Figure S1C, D). COL4A2 is known to be a key component of ECM involved in signaling pathways. Western blotting further confirmed the protein mass spectrometry observations, showing a higher level of COL4A2 in B-dECM than in P-dECM (Figure 5A). Collectively, these results indicate that B-dECM had thicker collagen fibers with increased COL4A2 expression than P-dECM which may provide a unique environment for PDLSCs.
B-dECM/P-dECM distinct protein.
| UniProt AC | Gene Symbol | Razor + unique peptides | Fold Change | P Value | FDR |
|---|---|---|---|---|---|
| B9EGI2 | MPRIP | 30 | +∞ | 2.10E-07 | 1.15E-05 |
| Q16643 | DBN1 | 16 | +∞ | 4.60E-06 | 1.31E-04 |
| H7C2W9 | RPL31 | 6 | +∞ | 4.87E-10 | 3.18E-07 |
| Q71U02 | MYL9 | 3 | +∞ | 6.86E-07 | 3.20E-05 |
| Q5JR95 | RPS8 | 6 | +∞ | 2.44E-07 | 1.23E-05 |
| E9PMS6 | LMO7 | 30 | +∞ | 1.02E-04 | 2.66E-03 |
| P08572 | COL4A2 | 9 | +∞ | 1.22E-06 | 4.43E-05 |
| Q6NZ55 | RPL13 | 6 | +∞ | 1.47E-06 | 5.05E-05 |
| A8MUD9 | RPL7 | 6 | +∞ | 3.30E-08 | 3.60E-06 |
| B4DMJ6 | RPL4 | 6 | +∞ | 8.91E-07 | 3.89E-05 |
| Q9UM54-6 | MYO6 | 21 | +∞ | 2.72E-06 | 8.10E-05 |
| Q5QTS3 | RPL13A | 4 | +∞ | 1.07E-08 | 1.40E-06 |
| P62424 | RPL7A | 8 | +∞ | 4.07E-08 | 3.81E-06 |
| B3KPC7 | ARPC5L | 2 | +∞ | 1.17E-06 | 4.43E-05 |
| Q9H2D6-5 | TRIOBP | 5 | +∞ | 1.25E-07 | 9.07E-06 |
| Q96RW7 | HMCN1 | 32 | +∞ | 5.37E-05 | 1.46E-03 |
| Q9UHB6-4 | LIMA1 | 29 | 19.25 | 1.49E-02 | 2.22E-01 |
| O00159-2 | MYO1C | 55 | 9.17 | 7.39E-03 | 1.37E-01 |
| P35579 | MYH9 | 152 | 7.37 | 2.04E-04 | 5.13E-03 |
| P68032 | ACTC1 | 11 | 7.28 | 4.96E-02 | 5.01E-01 |
| Q86V58 | FBLN2 | 13 | 3.93 | 1.01E-02 | 1.70E-01 |
| Q53R19 | ARPC2 | 15 | 3.87 | 7.54E-03 | 1.37E-01 |
| Q53X45 | MRLC3 | 9 | 3.73 | 7.95E-03 | 1.41E-01 |
| G8JLA8 | TGFBI | 27 | 3.69 | 5.36E-03 | 1.06E-01 |
| F8W1R7 | MYL6 | 8 | 3.60 | 9.85E-04 | 2.22E-02 |
| P06396-2 | GSN | 24 | 3.15 | 1.61E-02 | 2.29E-01 |
| Q8WVW5 | ACTIN | 32 | 2.61 | 8.22E-04 | 1.92E-02 |
| Q86TY5 | LGALS3 | 7 | 0.43 | 8.74E-03 | 1.50E-01 |
| P98160 | HSPG2 | 115 | 0.42 | 1.47E-02 | 2.22E-01 |
| Q6NZX3 | NT5E | 29 | 0.38 | 4.75E-02 | 5.01E-01 |
| P04406 | GAPDH | 11 | 0.34 | 1.87E-02 | 2.61E-01 |
| Q2TNI1 | CAV1 | 8 | 0.34 | 1.21E-02 | 1.94E-01 |
| Q8NBH6 | FBLN1 | 16 | 0.33 | 3.12E-02 | 4.08E-01 |
| P04899 | GNAI2 | 12 | 0.32 | 1.36E-02 | 2.12E-01 |
| P09382 | LGALS1 | 6 | 0.28 | 2.70E-03 | 5.70E-02 |
| Q96PQ9 | LOX | 12 | 0.26 | 3.34E-03 | 6.83E-02 |
| Q96TF5 | MBP1 | 8 | 0.22 | 1.56E-02 | 2.27E-01 |
| D6RHH4 | GNB2L1 | 5 | -∞ | 2.04E-07 | 1.15E-05 |
| Q9BTV4 | TMEM43 | 6 | -∞ | 1.11E-07 | 9.05E-06 |
| F5GY03 | SPARC | 4 | -∞ | 2.20E-06 | 6.84E-05 |
| Q6UVY6 | MOXD1 | 10 | -∞ | 1.15E-06 | 4.43E-05 |
| P39059 | COL15A1 | 13 | -∞ | 1.80E-06 | 5.88E-05 |
| B2R7M1 | AT | 9 | -∞ | 6.27E-09 | 1.34E-06 |
| P08758 | ANXA5 | 14 | -∞ | 2.30E-09 | 7.53E-07 |
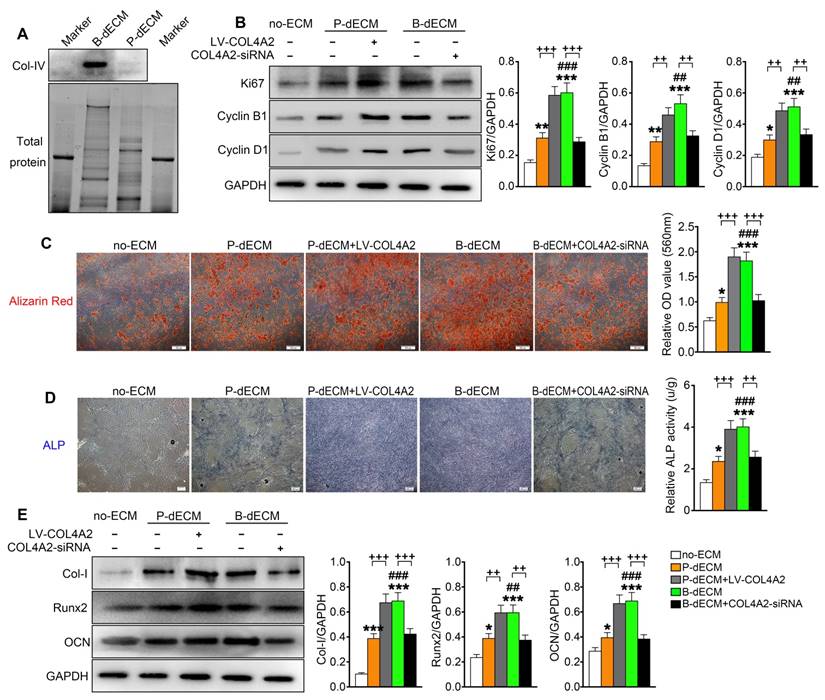
Proliferation and osteogenic differentiation ability of PDLSCs. PDLSCs were cultured on B-dECM, P-dECM or no-ECM. To control the expression of COL4A2 in dECMs, COL4A2 in the P-dECM group was overexpressed via lentivirus-mediated transduction of PDLCs. COL4A2 in the B-dECM group was downregulated via transfection of BMCs with siRNA. (A) Expression levels of COL4A2 in B-dECM and P-dECM determined by Western blotting. (B) Expression of Ki67, Cyclin B1, and Cyclin D1 in PDLSCs cultured on specific dECMs and no-ECM. (C) Alizarin red staining to detect the osteogenic differentiation ability of PDLSCs in five groups. Quantification of positive staining (right panel). (D) ALP activity was assessed to identify the osteogenic differentiation ability of PDLSCs in five groups. Quantification of positive staining (right panel). (E) Western blotting was used to detect the expression of the indicated proteins to assess osteogenic differentiation of PDLSCs cultured on specific dECMs and no-ECM. The data are presented as the means ± SD; n = 5. * P < 0.05, ** P < 0.01 and *** P < 0.001 represent significant differences in the indicated columns (P-dECM and B-dECM) compared with the no-ECM group. ## P < 0.01 and ### P < 0.001 represent significant differences between the P-dECM and B-dECM groups. ++ P < 0.01 and +++ P < 0.001 represent significant differences in the P-dECM or B-dECM group compared with the P-dECM + LV-COL4A2 or B-dECM + COL4A2-siRNA group.
Enhanced osteogenic ability of PDLSCs on B-dECM mediated by COL4A2
To further investigate the effect of COL4A2 in different dECMs on proliferation and osteogenic differentiation of PDLSCs, we first seeded the cells on P-dECM, P-dECM + LV-COL4A2, B-dECM and B-dECM + COL4A2-siRNA in regular culture medium and compared them with cells in the no-ECM group (group design in Methods). The protein components regulated by COL4A2 in B-dECM + COL4A2-siRNA and P-dECM + LV-COL4A2 were examined by proteomic analysis. The results revealed that upregulation of COL4A2 in P-dECM or downregulation in B-dECM did not influence the expression of other proteins (Table 2). PDLSCs cultured on B-dECM + COL4A2-siRNA significantly inhibited protein expression levels of Ki67, Cyclin B1, and Cyclin D1, but P-dECM + LV-COL4A2 promoted PDLSCs proliferation (Figure 5B). Moreover, we assessed osteogenic induction of PDLSCs cultured in the five groups. Alizarin red staining and ALP staining both showed that B-dECM group cells had stronger osteogenic ability (1.8-fold and 2.8-fold respectively versus the P-dECM and no-ECM groups), confirmed by the formation of more mineralization nodules, and exhibited higher ALP activity than cells in the P-dECM and no-ECM groups (1.6-fold and 3.4-fold respectively versus the P-dECM and no-ECM groups) (Figure 5C, D). Interestingly, the upregulation of COL4A2 in the P-dECM + LV-COL4A2 group increased the mineralization nodules and ALP activity (more than 1.7-fold versus the P-dECM group), but the B-dECM + COL4A2-siRNA group exhibited decreased osteogenic differentiation ability (more than 1.5-fold versus the B-dECM group) (Figure 5C, D). The same trend was observed in the protein expression levels by Western blotting (Figure 5E). Notably, neither of the dECMs exhibited mineralization in the absence of PDLSCs (Figure S4A, B). Similarly, we upregulated COL4A2 in B-dECM, which further enhanced the osteogenic induction ability of B-dECM (more than 1.7-fold) (Figure S4C). Since there are many proteins in the ECMs, we coated the culture dishes with different proteins (fibronectin and proteoglycan) and found that only a COL4A2 coating promoted the osteogenic differentiation ability of PDLSCs, further confirming that COL4A2 is the key ECM component that promotes osteogenesis (Figure S4D).
B-dECM and P-dECM protein MS with regulation of COL4A2.
| UniProt AC | Gene Symbol | B-dECM (means[SD]) | B-dECM + COL4A2-siRNA (means[SD]) | P value | P-dECM (means[SD]) | P-dECM + LV-COL4A2 (means[SD]) | P value |
|---|---|---|---|---|---|---|---|
| B9EGI2 | MPRIP | 2.14E+09[1.18E+08] | 2.58E+09[1.33E+08] | >0.999 | 0[0] | 0[0] | / |
| Q16643 | DBN1 | 2.06E+09[1.66E+08] | 2.17E+09[1.54E+08] | >0.999 | 0[0] | 0[0] | / |
| H7C2W9 | RPL31 | 7.29E+08[7.50E+07] | 7.01E+08[6.35E+07] | >0.999 | 0[0] | 0[0] | / |
| Q71U02 | MYL9 | 7.22E+08[3.69E+07] | 7.59E+08[4.72E+08] | >0.999 | 0[0] | 0[0] | / |
| Q5JR95 | RPS8 | 6.12E+08[2.52E+08] | 6.31E+08[3.53E+08] | >0.999 | 0[0] | 0[0] | / |
| E9PMS6 | LMO7 | 1.85E+09[2.60E+08] | 1.56E+09[2.85E+08] | >0.999 | 0[0] | 0[0] | / |
| P08572 | COL4A2 | 6.62E+08[4.75E+07] | 0[0] | <0.001 | 0[0] | 5.41E+08[1.35E+07] | <0.001 |
| Q6NZ55 | RPL13 | 5.90E+08[3.38E+08] | 6.24E+08[3.76E+08] | >0.999 | 0[0] | 0[0] | / |
| A8MUD9 | RPL7 | 4.64E+08[1.46E+08] | 5.13E+08[1.58E+08] | >0.999 | 0[0] | 0[0] | / |
| B4DMJ6 | RPL4 | 4.40E+08[2.48E+07] | 4.59E+08[1.97E+07] | >0.999 | 0[0] | 0[0] | / |
| Q9UM54-6 | MYO6 | 4.83E+08[4.21E+07] | 4.81E+08[4.56E+07] | >0.999 | 0[0] | 0[0] | / |
| Q5QTS3 | RPL13A | 3.65E+08[8.39E+07] | 3.99E+08[4.27E+07] | >0.999 | 0[0] | 0[0] | / |
| P62424 | RPL7A | 2.76E+08[7.59E+07] | 2.92E+08[5.31E+07] | >0.999 | 0[0] | 0[0] | / |
| B3KPC7 | ARPC5L | 1.36E+08[8.91E+07] | 1.51E+08[1.24E+07] | >0.999 | 0[0] | 0[0] | / |
| Q9H2D6-5 | TRIOBP | 8.23E+07[3.35E+07] | 7.68E+08[6.42E+07] | >0.999 | 0[0] | 0[0] | / |
| Q96RW7 | HMCN1 | 1.57E+08[2.29E+07] | 1.66E+08[1.94E+07] | >0.999 | 0[0] | 0[0] | / |
| Q9UHB6-4 | LIMA1 | 3.53E+09[2.29E+09] | 3.42E+09[6.39E+08] | >0.999 | 2.23E+08[1.33E+08] | 2.51E+08[5.43E+07] | >0.999 |
| O00159-2 | MYO1C | 1.07E+10[3.81E+09] | 1.11E+10[2.93E+09] | >0.999 | 1.26E+09[6.55E+08] | 1.36E+09[3.23E+08] | >0.999 |
| P35579 | MYH9 | 9.03E+10[1.61E+10] | 9.25E+10[9.17E+09] | >0.999 | 1.23E+10[2.39E+09] | 1.67E+10[2.58E+09] | >0.999 |
| P68032 | ACTC1 | 1.02E+11[7.33E+10] | 1.34E+11[6.53E+10] | 0.650 | 9.96E+09[2.26E+09] | 1.18E+10[4.25E+09] | >0.999 |
| Q86V58 | FBLN2 | 1.10E+10[3.70E+09] | 1.26E+10[2.93E+09] | >0.999 | 2.77E+09[9.11E+08] | 2.74E+09[5.23E+08] | >0.999 |
| Q53R19 | ARPC2 | 8.47E+08[3.09E+08] | 8.95E+08[1.47E+08] | >0.999 | 2.17E+08[7.40E+07] | 2.59E+08[4.66E+07] | >0.999 |
| Q53X45 | MRLC3 | 3.66E+09[1.20E+09] | 3.87E+09[1.39E+09] | >0.999 | 9.75E+08[3.16E+08] | 7.48E+08[1.12E+08] | >0.999 |
| G8JLA8 | TGFBI | 2.09E+10[8.37E+09] | 2.31E+10[4.36E+09] | >0.999 | 5.46E+09[9.17E+08] | 5.89E+09[7.25E+08] | >0.999 |
| F8W1R7 | MYL6 | 1.14E+10[2.20E+09] | 1.45E+10[7.25E+09] | >0.999 | 3.16E+09[5.31E+08] | 4.23E+09[6.14E+08] | >0.999 |
| P06396-2 | GSN | 2.06E+09[9.50E+08] | 2.35E+09[5.89E+08] | >0.999 | 6.21E+08[1.31E+08] | 7.13E+08[8.24E+07] | >0.999 |
| Q8WVW5 | ACTIN | 5.07E+11[4.09E+10] | 4.87E+11[1.01E+11] | 0.9989 | 1.96E+11[3.35E+10] | 1.73E+11[3.56E+10] | 0.126 |
| Q86TY5 | LGALS3 | 7.92E+08[1.45E+08] | 8.23E+08[1.25E+08] | >0.999 | 1.85E+09[4.41E+08] | 1.77E+09[2.59E+08] | >0.999 |
| P98160 | HSPG2 | 7.78E+10[2.58E+10] | 8.38E+10[1.14E+10] | >0.999 | 1.79E+11[3.14E+10] | 1.93E+11[3.26E+10] | 0.910 |
| Q6NZX3 | NT5E | 1.74E+10[9.55E+09] | 1.55E+10[3.94E+09] | >0.999 | 4.28E+10[1.24E+10] | 4.99E+10[5.85E+09] | >0.999 |
| P04406 | GAPDH | 1.14E+09[4.48E+08] | 1.23E+09[3.37E+08] | >0.999 | 3.22E+09[6.97E+08] | 5.26E+09[7.38E+08] | >0.999 |
| Q2TNI1 | CAV1 | 1.33E+09[2.55E+08] | 1.36E+09[4.25E+08] | >0.999 | 4.10E+09[1.37E+09] | 6.37E+09[9.13E+08] | >0.999 |
| Q8NBH6 | FBLN1 | 2.07E+10[8.37E+09] | 2.38E+10[5.31E+09] | >0.999 | 6.16E+10[2.38E+10] | 8.01E+10[9.26E+09] | 0.472 |
| P04899 | GNAI2 | 1.72E+09[5.73E+08] | 1.82E+09[3.17E+08] | >0.999 | 5.40E+09[1.91E+09] | 4.35E+09[6.49E+08] | >0.999 |
| P09382 | LGALS1 | 2.31E+09[4.56E+08] | 2.14E+09[4.93E+08] | >0.999 | 8.29E+09[2.25E+09] | 7.26E+09[8.77E+08] | >0.999 |
| Q96PQ9 | LOX | 5.03E+08[1.53E+08] | 5.37E+08[8.03E+07] | >0.999 | 1.90E+09[3.97E+08] | 2.57E+09[1.02E+09] | >0.999 |
| Q96TF5 | MBP1 | 3.50E+09[1.89E+09] | 3.77E+09[5.66E+08] | >0.999 | 1.44E+10[2.96E+09] | 1.13E+10[5.25E+09] | >0.999 |
| D6RHH4 | GNB2L1 | 0[0] | 0[0] | / | 1.84E+08[7.90E+07] | 1.63E+08[4.23E+07] | >0.999 |
| Q9BTV4 | TMEM43 | 0[0] | 0[0] | / | 3.30E+08[1.15E+08] | 4.66E+08[4.12E+07] | >0.999 |
| F5GY03 | SPARC | 0[0] | 0[0] | / | 7.80E+08[7.11E+08] | 9.25E+08[1.31E+08] | >0.999 |
| Q6UVY6 | MOXD1 | 0[0] | 0[0] | / | 1.18E+09[6.68E+08] | 8.34E+08[7.25E+07] | >0.999 |
| P39059 | COL15A1 | 0[0] | 0[0] | / | 1.48E+09[9.55E+08] | 1.96E+09[4.33E+08] | >0.999 |
| B2R7M1 | AT | 0[0] | 0[0] | / | 1.32E+09[2.68E+08] | 1.87E+09[3.56E+08] | >0.999 |
| P08758 | ANXA5 | 0[0] | 0[0] | / | 1.48E+09[2.28E+08] | 2.31E+09[5.76E+08] | >0.999 |
We coated culture dishes with different concentrations of COL4A2 and found that osteogenic differentiation was collagen concentration dependent (Figure S4E). We therefore coated the TCPs or P-dECM with 0.5 mg/ml COL4A2 peptide. The observation that the upregulation of COL4A2 in dECM could promote osteogenic ability was confirmed by coating the TCP or P-dECM with COL4A2. We found that the COL4A2 coating also upregulated the proliferation of PDLSCs in culture medium (Figure S5A) and expression of the osteogenic differentiation-related proteins Col-I, Runx2, and OCN in osteogenic medium detected by Western blotting (Figure S5B). Alizarin red staining confirmed the strong osteogenic induction after coating of the TCP or P-dECM with COL4A2 (2-fold and 1.4-fold respectively versus the TCP or P-dECM groups) (Figure S5C).
To validate the osteogenic differentiation observed in vitro by assessing the ability to form skeletal tissue in vivo, we transplanted PDLSCs with the relevant dECMs and Bio-Oss bone powder into the back of immunocompromised mice. We transfected PDLSCs (P2) with YFP fluorescence for cell tracing (Figure 6A, B). Eight weeks after transplantation, the mice were euthanized, and the bone grafts were examined. We observed that Bio-Oss implantation alone had low osteogenic ability without the YFP-positive PDLSCs. Increased formation of Col-I was observed after implantation of the dECMs. Thus, implantation of PDLSCs combined with Bio-Oss and P-dECM led to a large number of tracked YFP-positive cells and upregulation of Col-I (3-fold versus the Bio-Oss + P-dECM group), demonstrating that osteogenic ability was promoted by the dECMs and PDLSCs (Figure 6C).
Formation of new bone-like tissue in immunocompromised mice with cell tracing of PDLSCs. (A) Schematic diagram of PDLSC implantation in the back of immunocompromised mice. (B) PDLSCs transfected with YFP fluorescence. (C) Cell tracing and comparison of different effects of implantation of dECM, Bio-Oss, and PDLSCs. Four PDLSC/dECM/Bio-Oss combinations were implanted into immunocompromised mice. Double labeling of PDLSCs and Col-I was used to examine osteogenic ability and trace cells. White bar, 200 µm. Quantitative analysis of Col-I expression (right panel). * P < 0.05 and *** P < 0.001 represent significant differences in the indicated columns. (D) H&E staining revealed more bone-like tissue and insertion of PDL-like fibers in B-dECM and P-dECM than in the no-ECM group. This effect was increased in the P-dECM + LV-COL4A2 group compared with the P-dECM group. B-dECM + COL4A2-siRNA exhibited the opposite result. Black arrow, newly formed bone-like tissue. Green arrow, newly formed vessels. (E) Higher magnification of H&E staining. Green box represents the enlarged area. (F) Quantitative analysis of the new bone area in H&E staining images was carried out using Image-Pro Plus 6.0 software. (G) Cell tracing study in immunocompromised mice. (H) Higher magnification of cell tracing study. BM, bone meal from Bio-Oss. Black bar and white bar, 200 µm. The data are presented as the means ± SD; n = 6. *** P < 0.001 represents significant differences in the indicated columns (P-dECM and B-dECM) compared with the no-ECM group. ### P < 0.001 represents significant differences between the P-dECM and B-dECM groups. +++ P < 0.001 represents significant differences between the P-dECM or B-dECM group and the P-dECM + LV-COL4A2 or B-dECM + COL4A2-siRNA group.
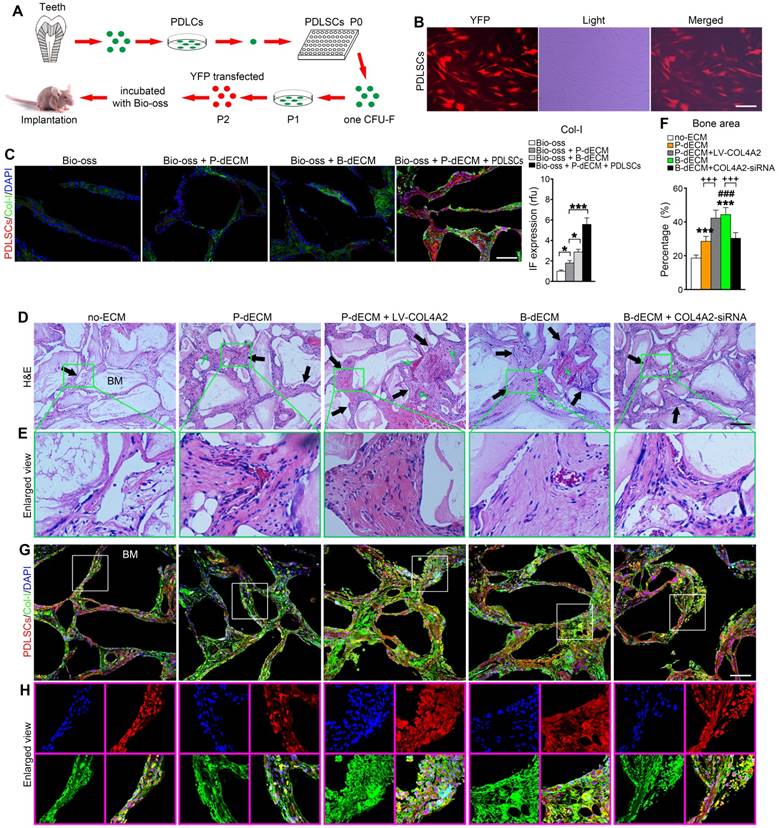
We next implanted cells (along with Bio-Oss) from five groups (group design in Methods) into the back of immunocompromised mice for 8 weeks. H&E staining showed that dense and ordered fibers generated by PDLSCs cultured on the B-dECM closely adhered to the Bio-Oss bone (BM) compared with cells in the P-dECM and no-ECM groups (Figure 6D, E). Quantitative analysis showed more bone formation in the B-dECM and P-dECM + LV-COL4A2 groups than in the B-dECM + COL4A2-siRNA and P-dECM groups (1.4-fold and 1.5-fold respectively versus the B-dECM + COL4A2-siRNA and P-dECM groups) (Figure 6F). Additionally, immunofluorescence staining detected a large number of YFP-positive cells in the new bone and fibers (Figure 6G). Newly formed Col-I surrounded the PDLSCs in the B-dECM and P-dECM + LV-COL4A2 groups, displaying a significantly enhanced osteogenic ability (Figure 6H). Furthermore, the B-dECM group produced more fibers than the P-dECM group, detected by Masson staining (Figure 7A). Sirius red staining was used to distinguish between type I - IV collagens. When examined through a polarized light, the larger collagen fibers were bright yellow or orange, and the thinner ones, including reticular fibers, were green. Type I collagen exhibited red birefringence, type II collagen weak red light, type III collagen green birefringence, and type IV collagen weak yellow birefringence. Sirius red staining demonstrated that the B-dECM and P-dECM + LV-COL4A2 groups produced denser and ordered red birefringence due to the presence of Col-I. A large amount of Col-IV was also present as weak yellow birefringence in these two groups compared with the B-dECM + COL4A2-siRNA, P-dECM, and no-ECM groups (Figure 7B).
Formation of new bone-like tissue around Bio-Oss bone powder in immunocompromised mice following PDLSC implantation. (A) Masson staining of new bone and fibers. (B) Sirius red staining for identification of collagen I to IV fibers. Type I collagen shows red birefringence, type II collagen weak red light, type III collagen green birefringence, and type IV collagen weak yellow birefringence. (C, D) Immunohistochemical staining of Col-I and quantification of the Col-I-positive area. (E, F) Immunohistochemical staining of OCN and quantification of the OCN-positive area. BM, bone meal from Bio-Oss. Black bar and white bar, 200 µm. The data are presented as the means ± SD; n = 6. *** P < 0.001 represents significant differences in the indicated columns (P-dECM and B-dECM) compared with the no-ECM group. ### P < 0.001 represents significant differences between the P-dECM and B-dECM groups. +++ P < 0.001 represents significant differences between the P-dECM or B-dECM group and the P-dECM + LV-COL4A2 or B-dECM + COL4A2-siRNA group.
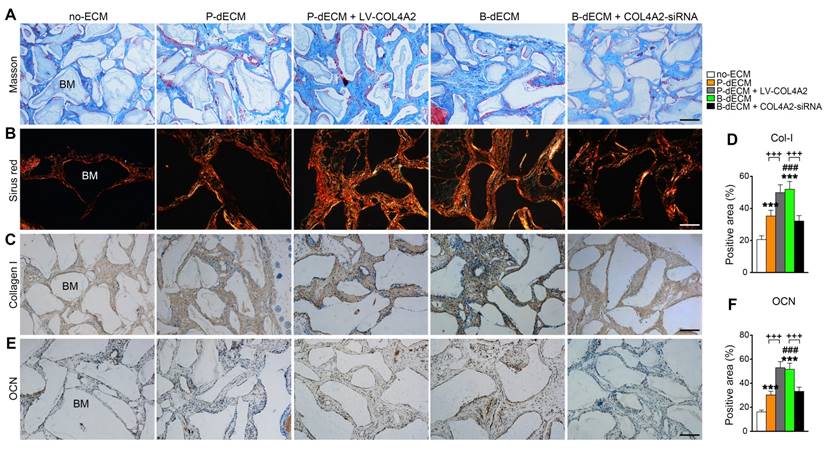
Furthermore, immunohistochemical staining showed that the expression of Col-I and OCN was much higher in the B-dECM group than in the P-dECM and no-ECM groups. The P-dECM + LV-COL4A2 group expressed more Col-I and OCN versus the P-dECM group (1.4-fold and 1.7-fold respectively versus the P-dECM group) (Figure 7C-F and Figure S3A). Additionally, the levels of Col-I and OCN in the B-dECM group were higher than those in the B-dECM + COL4A2-siRNA and no-ECM groups. As expected, the no-ECM and P-dECM coated with COL4A2 also showed that COL4A2 could promote the osteogenic ability of PDLSCs in vivo (Figure S6 and Figure S3B). These findings suggest that when cultured on B-dECM, PDLSCs induce osteogenic differentiation, which was dependent on COL4A2 expression.
Role of the canonical Wnt pathway in regulation of osteogenic differentiation of PDLSCs by COL4A2
It has been reported that the Wnt-mediated pathway controls the process of bone homeostasis through two major molecular mechanisms: the canonical β-catenin-dependent and the β-catenin-independent noncanonical Wnt pathways [44]. We aimed to determine whether the expression of β-catenin plays a key role in the regulation of osteogenesis mediated by COL4A2. After 7 days of culture in osteogenic induction medium, the levels of nuclear and total β-catenin and p-GSK-3β were decreased in PDLSCs cultured on B-dECM compared with P-dECM but were at a maximum in the no-ECM group. Additionally, the levels of nuclear and total β-catenin and p-GSK-3β were lower in the B-dECM group than in the B-dECM + COL4A2-siRNA group and in the P-dECM + LV-COL4A2 group than in the P-dECM group (Figure 8A). We speculated that the COL4A2 upregulation-induced osteogenic differentiation in B-dECM was dependent on downregulation of the canonical β-catenin pathway (a negative regulator).
The Wnt pathway is downstream of COL4A2 and negatively regulates osteogenic differentiation of PDLSCs. (A) PDLSCs were cultured on specific dECMs and no-ECM in osteogenic induction medium. With the regulation of COL4A2, the protein levels of nuclear β-catenin, total β-catenin, GSK-3β, and p-GSK-3β were measured via Western blotting in PDLSCs following 7 days of culture in osteogenic medium. Quantification of blots (right panel). (B) DKK-1 (inhibitor, 100 ng/ml) and Wnt3a (activator, 100 ng/ml) were used to downregulate and upregulate the expression of β-catenin, respectively, in the P-dECM, B-dECM and P-dECM + LV-COL4A2 groups. Alizarin red staining showing quantitative evaluation of osteogenic differentiation ability through modulation of the Wnt pathway. Quantification of positive staining (right panel). (C, D) The expression levels of nuclear β-catenin, total β-catenin, GSK-3β, p-GSK-3β, Col-I, ALP, and Runx2 in the presence of Wnt3a or DKK-1 in PDLSCs grown in osteogenic medium in the P-dECM + LV-COL4A2 group (C) or the B-dECM + COL4A2-siRNA group (D) were measured via Western blotting. The data are presented as the means ± SD; n = 5. *** P < 0.001 represents significant differences in the indicated columns (P-dECM and B-dECM) compared with the no-ECM group. # P < 0.05 and ### P < 0.001 represent significant differences between the P-dECM and B-dECM groups. + P < 0.05, ++ P < 0.01 and +++ P < 0.001 represent significant differences between the indicated columns.
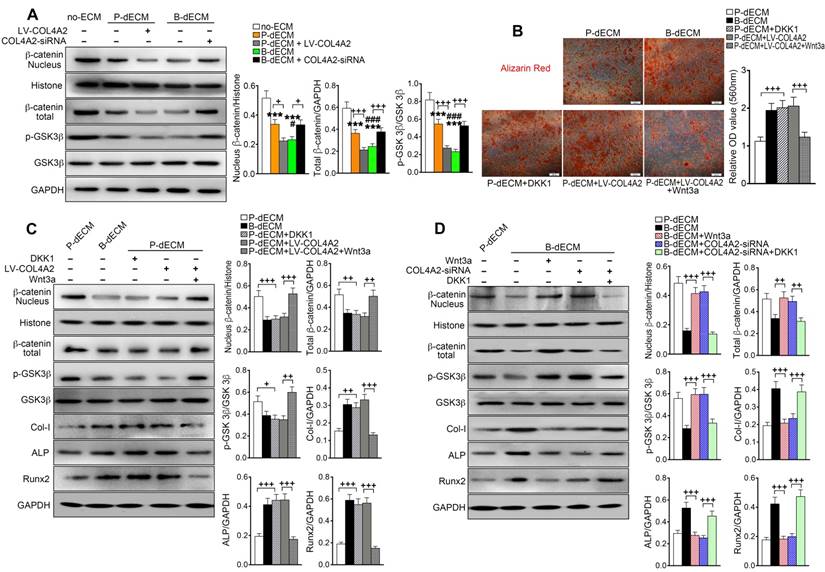
To further investigate the role of the canonical Wnt pathway on the osteogenic differentiation ability of PDLSCs, we modulated the Wnt pathway by administering Wnt3a and DKK-1, an activator and inhibitor of Wnt, respectively, in the osteogenic culture medium. Alizarin red staining revealed that B-dECM had strong osteogenic induction ability, with cells exhibiting lower β-catenin expression. Inhibition of Wnt by treatment with DKK-1 in the P-dECM group promoted osteogenic differentiation of PDLSCs. Further, activation of Wnt by Wnt3a in the P-dECM + LV-COL4A2 group reversed the enhanced osteogenic ability (1.7-fold versus the P-dECM + LV-COL4A2 group) (Figure 8B). Western blotting illustrated that DKK-1 blocked while Wnt3a activated the canonical Wnt/β-catenin pathway in PDLSCs in P-dECM under osteogenic culture conditions, evidenced by the β-catenin and p-GSK-3β expression levels (Figure 8C). A similar trend was noted with alizarin red staining, with increased expression of Col-I, ALP, and Runx2 observed when Wnt was inhibited by DKK-1 in the P-dECM group and decreased osteogenic ability after Wnt3a treatment in the P-dECM + LV-COL4A2 group (Figure 8C). As expected, activation of Wnt by Wnt3a downregulated the osteogenic ability in the P-dECM and B-dECM + COL4A2-siRNA groups, assayed by Western blotting of proteins related to osteogenic differentiation (Figure S7A). Moreover, upregulation of β-catenin by Wnt3a or downregulation by DKK-1 could also be seen in the B-dECM group (Figure 8D). Wnt activation induced by Wnt3a decreased the osteogenic ability of cells in the B-dECM group, whereas inhibition of Wnt upregulated Col-I, ALP, and Runx2 expression in the B-dECM + COL4A2-siRNA group (Figure 8D). DKK-1, which inhibited Wnt signaling, also enhanced osteogenic differentiation in the B-dECM and P-dECM + LV-COL4A2 groups (Figure S7B). Overall, these results demonstrate that P-dECM + LV-COL4A2 and B-dECM promoted osteogenic differentiation of PDLSCs by inhibiting the canonical Wnt signaling pathway. COL4A2 exhibited a negative regulatory relationship with the canonical Wnt pathway in osteogenic differentiation of PDLSCs.
Efficient repair of a rat alveolar defect by PDLSCs with B-dECM
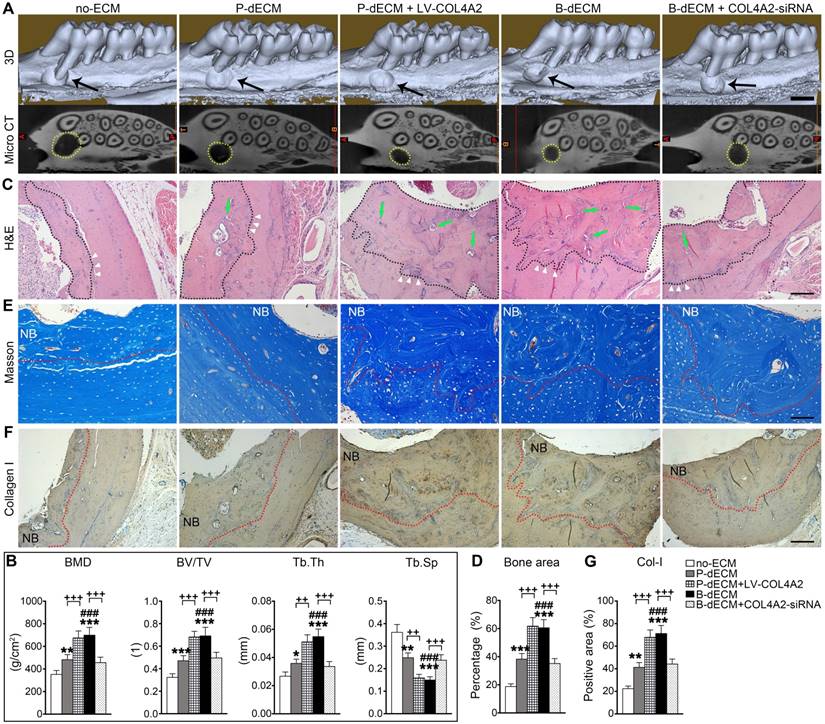
Finally, to determine the ability of PDLSCs implanted with dECMs possessing different COL4A2 contents to repair alveolar bone defects, we implanted the dECMs and Bio-Oss bone powder with or without cells into defects created in rat maxillary alveolar bone. After 8 weeks of transplantation, the rats were euthanized, and the maxillae were examined. First, we found that B-dECM or P-dECM implanted with Bio-Oss had a strong ability to repair the defects compared with the blank control groups (Figure S8A, columns 1-4). H&E and IHC staining revealed that the new bone and Col-I-positive area were increased to a greater extent in the Bio-Oss + B-dECM and Bio-Oss + P-dECM groups than in the blank control group (Figure S8B-E). PDLSCs together with dECMs and Bio-Oss displayed higher new bone formation compared with Bio-Oss + P-dECM group (2.5-fold versus the Bio-Oss + P-dECM group) (Figure S8, the fifth column). Therefore, we next implanted PDLSCs combined with five different groups of dECMs (see Methods) and Bio-Oss into the defects. Micro-CT analysis indicated that the new bone formation induced by PDLSCs to repair the maxillary alveolar bone defect was greater in the B-dECM than in the P-dECM and no-ECM groups. Additionally, the repair effect in the P-dECM + LV-COL4A2 group was greater followed by that in the P-dECM and no-ECM groups but was inhibited in the B-dECM + COL4A2-siRNA group (Figure 9A). Bone histomorphometric analysis via micro-CT revealed that B-dECM and P-dECM + LV-COL4A2 increased the BMD, BV/TV and Tb.Th values (more than 1.3-fold) compared with the B-dECM + COL4A2-siRNA, P-dECM, and no-ECM groups; however, the value of Tb.Sp was decreased (Figure 9B). H&E staining and Masson staining demonstrated the presence of more new bone and collagen fibrils in the B-dECM group than in the P-dECM and no-ECM groups. Notably, the P-dECM + LV-COL4A2 group produced 1.4-fold higher bone and collagen fibrils than the P-dECM group, whereas new bone area was reduced in the B-dECM + COL4A2-siRNA group (Figure 9C-E). In addition, immunohistochemical staining of Col-I confirmed that the B-dECM and P-dECM + LV-COL4A2 groups expressed 1.6- and 1.7-fold higher levels of Col-I than the B-dECM + COL4A2-siRNA and P-dECM groups (Figure 9F, G).
Effects of PDLSCs cultured on specific dECMs and no-ECM on the repair of alveolar bone defects at 8 weeks following transplantation. (A) Representative images of micro-CT 3D images and horizontal cross section. Black arrow, the size of the alveolar bone defects after implantation. Yellow dots, the size of the alveolar bone defects after implantation in the horizontal cross section. Black bar, 1 mm. (B) Bone morphology analysis of the BMD, BV/TV, Tb.Th and Tb.Sp values in alveolar bone defects in rats treated with PDLSCs cultured on specific dECMs and no-ECM at 8 weeks following transplantation. (C) H&E staining of bone defects in these five groups. Black dots, the area of new bone in the defects. Green arrow, newly formed blood vessels. Black bar, 200 µm. (D) Quantitative analysis of the new bone area; H&E staining analysis was carried out using Image-Pro Plus 6.0 software. (E) Masson staining for new bone and fibers. NB, new bone. Red dots, the area of new bone in the defects. Black bar, 200 µm. (F, G) Immunohistochemical staining of Col-I in alveolar bone defects in rats treated with PDLSCs cultured on specific dECMs and no-ECM after 8 weeks of transplantation and quantification of the Col-I-positive area. NB, new bone. Red dots, the area of new bone in the defects. Black bar, 200 µm. The data are presented as the means ± SD; n = 6. * P < 0.05, ** P < 0.01 and *** P < 0.001 represent significant differences in the indicated columns (P-dECM and B-dECM) compared with the no-ECM group. ### P < 0.001 represents significant differences between the P-dECM and B-dECM groups. ++ P < 0.001 and +++ P < 0.001 represent significant differences between the P-dECM or B-dECM group and the P-dECM + LV-COL4A2 or B-dECM + COL4A2-siRNA group.
Overall, the efficient repair effect of the B-dECM group was reversed by COL4A2 downregulation in the B-dECM + COL4A2-siRNA group but enhanced in the P-dECM + LV-COL4A2 group compared with the P-dECM group.
Discussion
Periodontitis is a serious problem that endangers people's health [45]. At present, the traditional treatment for periodontitis cannot restore lost bone tissue. In this regard, PDLSCs are a type of stem/progenitor cells that have highly efficient repair capability in alveolar bone regeneration. Previous studies have shown that ECM is tissue specific and its effects are cell type dependent [16,17]. In this study, we have shown that the higher COL4A2 content in B-dECM compared with P-dECM is a key factor that influences repair of bone defects by inhibiting the Wnt/β-catenin pathway and promoting osteogenic differentiation of PDLSCs.
Stem cells are considered a classic strategy for repairing alveolar bone damage [46,47]. Transplantation of PDLSCs has been shown to enhance periodontal regeneration in animal models and is currently in human clinical trials [48,49]. By contrast, BMSCs tend to form bone-like tissue and a small amount of fibrous tissue [50]. More importantly, PDLSCs constitute a large number of the cells in the periodontal ligament local environment and can be obtained easily from orthodontic teeth of orthodontic patients requiring tooth extraction, but BMSCs can only be obtained through invasive procedures. Our data also suggest that PDLSCs have osteogenic differentiation ability comparable to that of BMSCs. Therefore, we used PDLSCs, which appeared to be the most appropriate seed cell source, for cell-based alveolar bone regenerative therapy. PDLSCs are located in the ECM that is formed by the PDLCs. Further, the nearest neighbor is alveolar bone, which contains ECM from BMCs. Therefore, we used cells derived from periodontal tissue and jaw bone tissue to prepare dECMs to simulate the periodontal microenvironment in vivo; and the data revealed that dECMs prepared from these two sources displayed different properties and influenced osteogenic differentiation of PDLSCs.
dECM is a non-cellular matrix with a macromolecular network arranged in a unique three-dimensional structure, and its composition and structure vary in different tissues [51]. In this study, we used a combination of Triton X-100 and NH4OH for decellularization. Triton X-100 is widely used for decellularization without damage to the ECM. NH4OH, a mild detergent, can remove cellular components and keep the ECM intact [52]. We successfully generated decellularized ECMs from BMCs and PDLCs and compared differences between the B-dECM and P-dECM. Transplantation of dECM scaffolds combined with seed cells had a better therapeutic effect than dECM alone, but the reason was unclear [51]. Microscopic analysis data revealed that the collagen fibers in B-dECM were thicker and denser than those in P-dECM, with less roughness. Further, protein mass spectrometry indicated that the collagen content, especially COL4A2, was different between the two dECMs, which is likely the reason for the difference in osteogenic differentiation of PDLSCs induced by the dECMs.
Interestingly, our data showed that PDLSCs had greater osteogenic differentiation ability when cultured on B-dECM in osteogenic medium [53]. We performed protein mass spectrometry analysis of the two dECM types and found that the difference in the osteogenic differentiation induction ability was due to COL4A2 content differences. We envisaged that the osteogenic differentiation ability of PDLSCs would improve when seeded on P-dECM + LV-COL4A2 rather than on P-dECM alone. Moreover, osteogenic differentiation potential was greater when cells were seeded on B-dECM versus B-dECM + COL4A2-siRNA. However, previous studies have reported that COL4A2 gene mutation is associated with cerebral hemorrhage and small vessel disease, and compared with normal bones, COL4A2 upregulation is observed in osteoporotic bones [24,54]. These contradictory observations may be due to the different microenvironments in various cellular contexts. In the present study, our data indicated that COL4A2 positively influenced PDLSCs in the ECM in osteogenic culture. Furthermore, previously, it has been demonstrated that proteolytic degradation of COL4A2 generates novel binding sites that can further affect and alter the biological functions of COL4A2 [55,56]. This proteolytic cleavage was shown to support angiogenesis and subsequently promote osteogenesis [57].
It has been shown that different repair effects can be obtained by implanting different cells in animals [34]. Thus, we speculated that the difference in repair effect, at least to some extent, may be due to the diverse extracellular matrices secreted by various cells. The extracellular matrix components may influence osteogenesis, thus affecting the repair process. Our data revealed that osteogenic ability was greater in the B-dECM group with high COL4A2 expression and a periodontal ligament-like structure, and newly formed bone appeared to be more compact and thicker than that in the no-ECM group of immunocompromised mice. Cell tracing showed that only implantation of PDLSCs combined with Bio-Oss and dECMs led to new bone formation. We confirmed that the difference in the bone repair effect was due to the regulatory role of COL4A2 in the ECMs. To further investigate the ability of tissue-specific dECM to induce osteogenic differentiation of PDLSCs in vivo, we implanted PDLSCs with different dECMs combined with bone powder into alveolar defects in SD rats. The results indicated that B-dECM and P-dECM + LV-COL4A2 could improve new bone formation in vivo, which is consistent with the in vitro data.
We found that PDLSCs cultured on B-dECM exhibited higher proliferation in regular medium than those cultured on P-dECM. However, the enhanced osteogenic differentiation was due to differentiation promoted by B-dECM and not the large number of cells. We seeded 1.5 × 10⁶ PDLSCs onto B-dECM and P-dECM and cultured them in osteogenic medium to avoid further proliferation. After 7 days of osteogenic induction, the expression levels of COL-1, Runx2 and OCN were higher in the B-dECM group than in the P-dECM group (Figure S9A). Further, there was no significant difference in cell number between the B-dECM group and P-dECM group after osteogenic induction (Figure S9B). Therefore, the enhanced osteogenic differentiation was due to B-dECM and not the cell number. The ability of stem cells to self-renew, differentiate into somatic cells, and release growth factors to affect recipient cells is important in regenerative medicine [58]. Markers of stemness are distinctive features that serve as molecular signatures to discriminate stem cells from other differentiated cell types [59]. SOX-2, Nanog-3, and Oct-4 are key transcription factors that have a critical function in preserving pluripotency and self-renewal of undifferentiated stem cells [60,61]. These transcription factors have been shown to inhibit the expression of developmental genes by attaching to specific promoter regions and to regulate pluripotency in stem cells [62]. Stemness maintenance is directly related to the pattern of division. Stem cells are one cell type that can divide asymmetrically to produce a self-renewed stem cell and a daughter cell with the ability to differentiate. Stem cells can also divide symmetrically to expand the stem cell pool. We speculated that symmetrical and asymmetrical division of stem cells may simultaneously exist in cell culture and observed upregulation of proliferation- and stemness-related genes in our study; the stemness in B-dECM was upregulated together with the proliferation ability but was not associated with cell cycle quiescence. These results were consistent with those of previous studies showing simultaneous upregulation of proliferation and stemness and maintenance of self-renewal ability in PDLSCs [60,61].
The functional role of the Wnt/β-catenin pathway in osteogenesis has been confirmed in osteoblasts and MSCs [63]. Researchers have found that in regular culture medium, activation of the Wnt pathway promotes osteogenic differentiation of PDLSCs, while its inhibition impedes this phenomenon [64]. The effect of Wnt/β-catenin on osteogenic differentiation of PDLSCs is influenced by the microenvironment. As in the complete culture medium, its activation promotes osteogenic differentiation of PDLSCs, which is significantly inhibited in osteogenic induction medium [65]. Our results showed that following osteogenic induction, expression of β-catenin in cells cultured on different dECMs was lower than that in cells in the no-ECM group. We treated PDLSCs in osteogenic induction medium with DKK-1 and Wnt3a and found that the treatments resulted in altered β-catenin expression. In osteogenic induction medium, the reduction in β-catenin induced by DKK-1 promoted osteogenesis of PDLSCs, and the accumulation of β-catenin induced by Wnt3a inhibited osteogenesis of PDLSCs. Furthermore, we found a new negative regulatory relationship between COL4A2 and the Wnt pathway. Our data demonstrated that the upregulation of COL4A2 in P-dECM inhibited the Wnt pathway and promoted osteogenic differentiation of PDLSCs in osteogenic induction medium. However, the COL4A2-promoted osteogenic differentiation was reversed by additional treatment with Wnt3a. Similarly, DKK-1 treatment enhanced osteogenic differentiation by inhibiting the Wnt pathway in cells cultured on B-dECM with COL4A2 downregulation.
Collectively, our study demonstrated that dECMs derived from PDLCs and BMCs have profound but different effects on osteogenic differentiation of PDLSCs and bone defect repair. The distinct level of COL4A2 in ECM is an important mechanism by which osteogenic differentiation of PDLSCs is more efficiently promoted through negative regulation of the Wnt/β-catenin pathway. Under osteogenic conditions, there appears to be an inverse relationship between COL4A2 and the Wnt signaling pathway, suggesting a potential therapeutic strategy for clinical repair of periodontal defects in periodontitis.
Abbreviations
COL4A2: Type IV collagen A2; PDLCs: periodontal ligament cells; PDLSCs: periodontal ligament stem cells; BMCs: bone marrow cells; BMSCs: bone marrow mesenchymal stem cells; ECM: extracellular matrix; PD: periodontitis; TEM: transmission electron microscopy; SEM: scanning electron microscopy; AFM: atomic force microscopy; MS: mass spectrometry; dECM: decellularized ECM; PGs: proteoglycans; GAGs: glycosaminoglycans; ROS: reactive oxygen species; GSK-3β: glycogen synthase kinase 3β.
Supplementary Material
Supplementary figures and table.
Acknowledgements
We thank Hao Guo for assistance with the LC-MS/MS analysis.
Funding source
This work was supported by the National Natural Science Foundation of China grants (No.81100750), the China Postdoctoral Science Foundation funded project (2014M550469), the International Postdoctoral Exchange Fellowship Program of China (2015) and the Shaanxi International Cooperation and Exchange of Scientific Research Projects (2015KW-042).
Author Contributions
J.J. Wu, Z.L Jin, D. Bai, and Y. Wen. conceived and designed the experiments. Y. Wen. and H.X. Yang. performed the experiments and analyzed the data. A.X. Wang. contributed reagents/materials/analysis tools. S.J Hu. performed the LC-MS/MS experiment. Y. Wen. wrote the manuscript. X.D. Chen and Y.X. Zhang edited the manuscript. All authors gave final approval and agreed to be accountable for all aspects of the work.
Competing Interests
The authors have declared that no competing interest exists.
References
1. Bartold PM, Van Dyke TE. Periodontitis: a host-mediated disruption of microbial homeostasis. Unlearning learned concepts. Periodontol 2000. 2013;62:203-17
2. Forner L, Larsen T, Kilian M, Holmstrup P. Incidence of bacteremia after chewing, tooth brushing and scaling in individuals with periodontal inflammation. J Clin Periodontol. 2006;33:401-7
3. Fuoco C, Petrilli LL, Cannata S, Gargioli C. Matrix scaffolding for stem cell guidance toward skeletal muscle tissue engineering. J Orthop Surg Res. 2016;11:86
4. Duffy RM, Sun Y, Feinberg AW. Understanding the Role of ECM Protein Composition and Geometric Micropatterning for Engineering Human Skeletal Muscle. Ann Biomed Eng. 2016;44:2076-89
5. Han J, Menicanin D, Gronthos S, Bartold PM. Stem cells, tissue engineering and periodontal regeneration. Aust Dent J. 2014;59:117-30
6. Fawzy El-Sayed KM, Elahmady M, Adawi Z, Aboushadi N, Elnaggar A, Eid M. et al. The periodontal stem/progenitor cell inflammatory-regenerative cross talk: A new perspective. J Periodontal Res. 2019;54:81-94
7. Romeo L, Diomede F, Gugliandolo A, Scionti D, Lo Giudice F, Lanza Cariccio V. et al. Moringin Induces Neural Differentiation in the Stem Cell of the Human Periodontal Ligament. Sci Rep. 2018;8:9153
8. Gattazzo F, Urciuolo A, Bonaldo P. Extracellular matrix: a dynamic microenvironment for stem cell niche. Biochim Biophys Acta. 2014;1840:2506-19
9. Jones DL, Wagers AJ. No place like home: anatomy and function of the stem cell niche. Nat Rev Mol Cell Biol. 2008;9:11-21
10. Thorne JT, Segal TR, Chang S, Jorge S, Segars JH, Leppert PC. Dynamic reciprocity between cells and their microenvironment in reproduction. Biol Reprod. 2015;92:25
11. Kaul H, Ventikos Y. Dynamic reciprocity revisited. J Theor Biol. 2015;370:205-8
12. Theocharis AD, Skandalis SS, Gialeli C, Karamanos NK. Extracellular matrix structure. Adv Drug Deliv Rev. 2016;97:4-27
13. Hoshiba T, Chen G, Endo C, Maruyama H, Wakui M, Nemoto E. et al. Decellularized Extracellular Matrix as an In Vitro Model to Study the Comprehensive Roles of the ECM in Stem Cell Differentiation. Stem Cells Int. 2016;2016:6397820
14. Lo CM, Wang HB, Dembo M, Wang YL. Cell movement is guided by the rigidity of the substrate. Biophys J. 2000;79:144-52
15. Engler AJ, Sen S, Sweeney HL, Discher DE. Matrix elasticity directs stem cell lineage specification. Cell. 2006;126:677-89
16. Marinkovic M, Block TJ, Rakian R, Li Q, Wang E, Reilly MA. et al. One size does not fit all: developing a cell-specific niche for in vitro study of cell behavior. Matrix Biol. 2016;52-54:426-441
17. Mao Y, Hoffman T, Wu A, Goyal R, Kohn J. Cell type-specific extracellular matrix guided the differentiation of human mesenchymal stem cells in 3D polymeric scaffolds. J Mater Sci Mater Med. 2017;28:100
18. Turner AW, Nikpay M, Silva A, Lau P, Martinuk A, Linseman TA. et al. Functional interaction between COL4A1/COL4A2 and SMAD3 risk loci for coronary artery disease. Atherosclerosis. 2015;242:543-52
19. Jeanne M, Jorgensen J, Gould DB. Molecular and Genetic Analyses of Collagen Type IV Mutant Mouse Models of Spontaneous Intracerebral Hemorrhage Identify Mechanisms for Stroke Prevention. Circulation. 2015;131:1555-65
20. Parkin JD, San Antonio JD, Pedchenko V, Hudson B, Jensen ST, Savige J. Mapping structural landmarks, ligand binding sites, and missense mutations to the collagen IV heterotrimers predicts major functional domains, novel interactions, and variation in phenotypes in inherited diseases affecting basement membranes. Hum Mutat. 2011;32:127-43
21. Bunt S, Hooley C, Hu N, Scahill C, Weavers H, Skaer H. Hemocyte-secreted type IV collagen enhances BMP signaling to guide renal tubule morphogenesis in Drosophila. Dev Cell. 2010;19:296-306
22. Wang X, Harris RE, Bayston LJ, Ashe HL. Type IV collagens regulate BMP signalling in Drosophila. Nature. 2008;455:72-7
23. Yoneda Y, Haginoya K, Arai H, Yamaoka S, Tsurusaki Y, Doi H. et al. De novo and inherited mutations in COL4A2, encoding the type IV collagen alpha2 chain cause porencephaly. Am J Hum Genet. 2012;90:86-90
24. Verbeek E, Meuwissen ME, Verheijen FW, Govaert PP, Licht DJ, Kuo DS. et al. COL4A2 mutation associated with familial porencephaly and small-vessel disease. Eur J Hum Genet. 2012;20:844-51
25. Yamashita J, Itoh H, Hirashima M, Ogawa M, Nishikawa S, Yurugi T. et al. Flk1-positive cells derived from embryonic stem cells serve as vascular progenitors. Nature. 2000;408:92-6
26. Paralkar VM, Nandedkar AK, Pointer RH, Kleinman HK, Reddi AH. Interaction of osteogenin, a heparin binding bone morphogenetic protein, with type IV collagen. J Biol Chem. 1990;265:17281-4
27. Vukicevic S, Latin V, Chen P, Batorsky R, Reddi AH, Sampath TK. Localization of osteogenic protein-1 (bone morphogenetic protein-7) during human embryonic development: high affinity binding to basement membranes. Biochem Biophys Res Commun. 1994;198:693-700
28. Ripamonti U, C. Ferretti and M. Heliotis, Soluble and insoluble signals and the induction of bone formation: molecular therapeutics recapitulating development. J Anat. 2006;209:447-68
29. Moon RT, Bowerman B, Boutros M, Perrimon N. The promise and perils of Wnt signaling through beta-catenin. Science. 2002;296:1644-6
30. Wang HL, Hart J, Fan L, Mustafi R, Bissonnette M. Upregulation of glycogen synthase kinase 3beta in human colorectal adenocarcinomas correlates with accumulation of CTNNB1. Clin Colorectal Cancer. 2011;10:30-6
31. Wu D, Pan W. GSK3: a multifaceted kinase in Wnt signaling. Trends Biochem Sci. 2010;35:161-8
32. Clevers H, Nusse R. Wnt/β-catenin signaling and disease. Cell. 2012;149:1192-1205
33. Zhong Z, Zylstra-Diegel CR, Schumacher CA, Baker JJ, Carpenter AC, Rao S. et al. Wntless functions in mature osteoblasts to regulate bone mass. Proc Natl Acad Sci USA. 2012;109:E2197-E2204
34. Zhang H, Liu S, Zhu B, Xu Q, Ding Y, Jin Y. Composite cell sheet for periodontal regeneration: crosstalk between different types of MSCs in cell sheet facilitates complex periodontal-like tissue regeneration. Stem Cell Res Ther. 2016;7:168
35. Liu Y, Yang H, Wen Y, Li B, Zhao Y, Xing J. et al. Nrf2 Inhibits Periodontal Ligament Stem Cell Apoptosis under Excessive Oxidative Stress. Int J Mol Sci. 2017:18 (5)
36. Dominici M, Le Blanc K, Mueller I, Slaper-Cortenbach I, Marini F, Krause D. et al. Minimal criteria for defining multipotent mesenchymal stromal cells. The International Society for Cellular Therapy position statement. Cytotherapy. 2006;8:315-7
37. Wen Y, Yang H, Liu Y, Liu Q, Wang A, Ding Y. et al. Evaluation of BMMSCs-EPCs sheets for repairing alveolar bone defects in ovariectomized rats. Sci Rep. 2017;7:16568
38. Chen XD, Dusevich V, Feng JQ, Manolagas SC, Jilka RL. Extracellular matrix made by bone marrow cells facilitates expansion of marrow-derived mesenchymal progenitor cells and prevents their differentiation into osteoblasts. J Bone Miner Res. 2007;22:1943-56
39. Huang GF, Zou J, Shi J, Zhang DY, Peng HF, Zhang Q. et al. Electroacupuncture stimulates remodeling of extracellular matrix by inhibiting apoptosis in a rabbit model of disc degeneration. Evid Based Complement Alternat Med. 2015;2015:386012
40. Goto R, Nakamura Y, Takami T, Sanke T, Tozuka Z. Quantitative LC-MS/MS Analysis of Proteins Involved in Metastasis of Breast Cancer. PLoS One. 2015;10:e0130760
41. Cox J, Mann M. MaxQuant enables high peptide identification rates, individualized p.p.b.-range mass accuracies and proteome-wide protein quantification. Nat Biotechnol. 2008;26:1367-72
42. Luber CA, Cox J, Lauterbach H, Fancke B, Selbach M, Tschopp J. et al. Quantitative proteomics reveals subset-specific viral recognition in dendritic cells. Immunity. 2010;32:279-89
43. Lin H, Yang G, Tan J, Tuan RS. Influence of decellularized matrix derived from human mesenchymal stem cells on their proliferation, migration and multi-lineage differentiation potential. Biomaterials. 2012;33:4480-9
44. Maeda K, Takahashi N, Kobayashi Y. Roles of Wnt signals in bone resorption during physiological and pathological states. J Mol Med (Berl). 2013;91:15-23
45. Bosshardt DD. The periodontal pocket: pathogenesis, histopathology and consequences. Periodontol 2000. 2018;76:43-50
46. Merritt EK, Cannon MV, Hammers DW, Le LN, Gokhale R, Sarathy A. et al. Repair of traumatic skeletal muscle injury with bone-marrow-derived mesenchymal stem cells seeded on extracellular matrix. Tissue Eng Part A. 2010;16:2871-81
47. Perniconi B, Costa A, Aulino P, Teodori L, Adamo S, Coletti D. The pro-myogenic environment provided by whole organ scale acellular scaffolds from skeletal muscle. Biomaterials. 2011;32:7870-82
48. Bright R, Hynes K, Gronthos S, Bartold PM. Periodontal ligament-derived cells for periodontal regeneration in animal models: a systematic review. J Periodontal Res. 2015;50:160-72
49. Chen FM, Gao LN, Tian BM, Zhang XY, Zhang YJ, Dong GY. et al. Treatment of periodontal intrabony defects using autologous periodontal ligament stem cells: a randomized clinical trial. Stem Cell Res Ther. 2016;7:33
50. Seo BM, Miura M, Gronthos S, Bartold PM, Batouli S, Brahim J. et al. Investigation of multipotent postnatal stem cells from human periodontal ligament. Lancet. 2004;364:149-55
51. Liu S, Zhang H, Zhang X, Lu W, Huang X, Xie H. et al. Synergistic angiogenesis promoting effects of extracellular matrix scaffolds and adipose-derived stem cells during wound repair. Tissue Eng Part A. 2011;17:725-39
52. Lu H, Hoshiba T, Kawazoe N, Chen G. Comparison of decellularization techniques for preparation of extracellular matrix scaffolds derived from three-dimensional cell culture. J Biomed Mater Res A. 2012;100:2507-16
53. Salasznyk RM, Williams WA, Boskey A, Batorsky A, Plopper GE. Adhesion to Vitronectin and Collagen I Promotes Osteogenic Differentiation of Human Mesenchymal Stem Cells. J Biomed Biotechnol. 2004;2004:24-34
54. Niu T, Chen C, Cordell H, Yang J, Wang B, Wang Z. et al. A genome-wide scan for loci linked to forearm bone mineral density. Hum Genet. 1999;104:226-33
55. Aumailley M, Timpl R. Attachment of cells to basement membrane collagen type IV. J Cell Biol. 1986;103:1569-75
56. Khoshnoodi J, Pedchenko V, Hudson BG. Mammalian collagen IV. Microsc Res Tech. 2008;71:357-70
57. Xu J, Rodriguez D, Petitclerc E, Kim JJ, Hangai M, Moon YS. et al. Proteolytic exposure of a cryptic site within collagen type IV is required for angiogenesis and tumor growth in vivo. J Cell Biol. 2001;154:1069-79
58. Zhu H, Yang A, Du J, Li D, Liu M, Ding F. et al. Basic fibroblast growth factor is a key factor that induces bone marrow mesenchymal stem cells towards cells with Schwann cell phenotype. Neurosci Lett. 2014;559:82-7
59. Dadashpour M, Pilehvar-Soltanahmadi Y, Mohammadi SA, Zarghami N, Pourhassan-Moghaddam M, Alizadeh E. et al. Watercress-based electrospun nanofibrous scaffolds enhance proliferation and stemness preservation of human adipose-derived stem cells. Artif Cells Nanomed Biotechnol. 2018;46:819-830
60. Ou Q, Wang X, Wang Y, Wang Y, Lin X. Oestrogen retains human periodontal ligament stem cells stemness in long-term culture. Cell Prolif. 2018;51:e12396
61. Wang T, Kang W, Du L, Ge S. Rho-kinase inhibitor Y-27632 facilitates the proliferation, migration and pluripotency of human periodontal ligament stem cells. J Cell Mol Med. 2017;21:3100-3112
62. Gulaia V, Kumeiko V, Shved N, Cicinskas E, Rybtsov S, Ruzov A. et al. Molecular Mechanisms Governing the Stem Cell's Fate in Brain Cancer: Factors of Stemness and Quiescence. Front Cell Neurosci. 2018;12:388
63. Ling L, Nurcombe V, Cool SM. Nurcombe and S.M. Cool, Wnt signaling controls the fate of mesenchymal stem cells. Gene. 2009;433:1-7
64. Liu W, Konermann A, Guo T, Jäger A, Zhang L, Jin Y. Canonical Wnt signaling differently modulates osteogenic differentiation of mesenchymal stem cells derived from bone marrow and from periodontal ligament under inflammatory conditions. Biochim Biophys Acta. 2014;1840:1125-34
65. Liu W, Liu Y, Guo T, Hu C, Luo H, Zhang L. et al. TCF3, a novel positive regulator of osteogenesis, plays a crucial role in miR-17 modulating the diverse effect of canonical Wnt signaling in different microenvironments. Cell Death Dis. 2013;4:e539
Author contact
![]() Corresponding authors: Junjie Wu, fmmuwuedu.cn. Zuolin Jin, zuolinjedu.cn; Ding Bai, baidingedu.cn.
Corresponding authors: Junjie Wu, fmmuwuedu.cn. Zuolin Jin, zuolinjedu.cn; Ding Bai, baidingedu.cn.