Impact Factor
- Issue 14; 2026
- Issue 13; 2026
- Issue 12; 2026
- Issue 11; 2026
- Issue 10; 2026
- Volume 16; 2026
- Advance Articles
- Past Issues
- Cover Images
- Cover Suggestion
- Index & Coverage
- Special Issues
Introduction
Methods
Results
Discussion
Conclusions
Abbreviations
Supplementary Material
Acknowledgements
References
International Journal of Biological Sciences
International Journal of Medical Sciences
 Global reach, higher impact

Theranostics 2019; 9(19):5444-5463. doi:10.7150/thno.29367 This issue Cite
Research Paper
Flow cytometry-based FRET identifies binding intensities in PPARγ1 protein-protein interactions in living cells
Verena Trümper1*, Andreas von Knethen1,2*, Annegret Preuß3, Eugeny Ermilov3, Steffen Hackbarth3, Laura Kuchler1, Sandra Gunne2, Anne Schäfer1, Tobias Bornhütter3, György Vereb4,5, Lázló Ujlaky-Nagy4,5, Bernhard Brüne1,2, Beate Röder3, Michael Schindler6, Michael J. Parnham2, Tilo Knape2 ![]() #
#
1. Institute of Biochemistry I - Pathobiochemistry, Faculty of Medicine, Goethe University Frankfurt, Theodor-Stern-Kai 7, 60590 Frankfurt/Main, Germany
2. Branch for Translational Medicine and Pharmacology, Fraunhofer Institute for Molecular Biology and Applied Ecology IME, Theodor-Stern-Kai 7, 60596 Frankfurt/Main, Germany
3. Department of Physics, Humboldt University Berlin, Newtonstraße 15, 12489 Berlin, Germany
4. Department of Biophysics and Cell Biology, Faculty of Medicine, University of Debrecen, Egyetem tér 1, 4032 Debrecen, Hungary
5. MTA-DE Cell Biology and Signaling Research Group, Faculty of Medicine, University of Debrecen, Egyetem tér 1, 4032 Debrecen, Hungary
6. Institute of Medical Virology and Epidemiology of Viral Diseases, University Hospital Tübingen, Karls University Tübingen, Elfriede-Aulhorn-Str. 6, 72076 Tübingen
* These two authors contributed equally to this work.
#Parts of the work were done in the Institute of Biochemistry I and parts in the Branch for Translational Medicine and Pharmacology TMP, Fraunhofer Institute for Molecular Biology and Applied Ecology IME
Received 2018-8-20; Accepted 2019-5-1; Published 2019-7-28
Abstract

PPARγ is a pharmacological target in inflammatory and metabolic diseases. Upon agonistic treatment or following antagonism, binding of co-factors is altered, which consequently affects PPARγ-dependent transactivation as well as its DNA-independent properties. Therefore, establishing techniques to characterize these interactions is an important issue in living cells.
Methods: Using the FRET pair Clover/mRuby2, we set up a flow cytometry-based FRET assay by analyzing PPARγ1 binding to its heterodimerization partner RXRα. Analyses of PPARγ-reporter and co-localization studies by laser-scanning microscopy validated this system. Refining the system, we created a new readout to distinguish strong from weak interactions, focusing on PPARγ-binding to the co-repressor N-CoR2.
Results: We observed high FRET in cells expressing Clover-PPARγ1 and mRuby2-RXRα, but no FRET when cells express a mRuby2-RXRα deletion mutant, lacking the PPARγ interaction domain. Focusing on the co-repressor N-CoR2, we identified in HEK293T cells the new splice variant N-CoR2-ΔID1-exon. Overexpressing this isoform tagged with mRuby2, revealed no binding to Clover-PPARγ1, nor in murine J774A.1 macrophages. In HEK293T cells, binding was even lower in comparison to N-CoR2 constructs in which domains established to mediate interaction with PPARγ binding are deleted. These data suggest a possible role of N-CoR2-ΔID1-exon as a dominant negative variant. Because binding to N-CoR2-mRuby2 was not altered following activation or antagonism of Clover-PPARγ1, we determined the effect of pharmacological treatment on FRET intensity. Therefore, we calculated flow cytometry-based FRET efficiencies based on our flow cytometry data. As with PPARγ antagonism, PPARγ agonist treatment did not prevent binding of N-CoR2.
Conclusion: Our system allows the close determination of protein-protein interactions with a special focus on binding intensity, allowing this system to characterize the role of protein domains as well as the effect of pharmacological agents on protein-protein interactions.
Keywords: binding affinity and intensity, co-localization analysis, flow cytometry-based FRET assay, FRET, N-CoR2, NHR co-factors protein-protein interactions, PPARγ1, RXRα
Introduction
Förster´s resonance energy transfer (FRET) between fluorescent proteins is an elegant non-invasive technique available to detect direct protein-protein interactions in living cells. It is based upon the energy transfer from an excited donor fluorophore to an adjacent acceptor fluorophore, resulting in decreased fluorescence emission by the donor and enhanced fluorescence emission by the acceptor [1-3]. For direct protein-protein interactions, FRET is highly dependent on the distance between the two fluorophores. Accordingly, this phenomenon only occurs when the distance between donor and acceptor ranges between 1-10 nm and the emission spectra of the donor overlaps with the excitation spectra of the acceptor [4]. In addition, FRET is also dependent on the geometry of the fluorophores in a donor-acceptor FRET pair.
A large number of FRET methods, such as fluorescence lifetime imaging microscopy (FLIM), time-correlated single photon counting (TCSPC) or time-resolved (TR) energy transfer by TR-FRET, have been developed to measure fluorescence lifetime over the last few years. However, major limitations still exist [5-7]. Mostly, FRET measurements are done by complex fluorescence microscopy or analysis, which allows only the analysis of a small number of cells and essentially precludes high-throughput-screening (HTS) for protein interactions.
A new innovative method to overcome these limitations is to detect and quantify FRET by flow cytometry [8, 9]. This non-invasive, sensitive and quantitative method allows the study of direct protein-protein interactions in large numbers of living cells and samples in a reasonable amount of time. Another new FRET-based method is related to the assessment of the binding affinity based on the determination of the FRET intensity via the measurement of the median fluorescence intensities (MFI) value to calculate the flow cytometry-based FRET efficiencies to rate the binding strength and thus, it allows detection of changes in the affinity and intensity of protein-protein interactions [10-13].
Cyan and yellow fluorescent proteins (CFPs and YFPs) are generally used as FRET fluorophores. However, photophysical aspects of CFPs and YFPs, like rapid multi-rate and reversible photobleaching are problematic for FRET [14]. Consequently, many CFP- and YFP-based FRET reporters produce only small changes in FRET. Alternative FRET pairings between a green fluorescent protein (GFP) or YFP and an orange or red fluorescent protein (OFP or RFP) have been explored, but still have major limitations, i.e. low signal-to-noise ratio. Consequently, FRET efficiency and shifts in terms of fluorescence intensity upon FRET are too small to measure subtle differences in alterations of protein binding, for instance disturbance of interaction by drugs. A systematically developed, new FRET pair to overcome and minimize these limitations is based on Clover/mRuby2, one of the brightest GFP-based, respectively, brightest RFP-based fluorescence probes characterized so far, with properties better suited to a wide range of FRET applications [14].
In recent years, a few new drug screening systems have been developed to determine the molecular, pharmacological and toxicological potential of new and existing drugs and to identify and characterize drug-induced protein-protein interactions in detail. Preclinical in vitro screening systems are essential for the development and discovery of new drugs but major limitations, such as high costs, low throughput, and limitations with respect to specificity and sensitivity, still exist. For this reason, new innovative screening systems are crucial to be able to identify new therapeutic drugs, their potential combinations with existing drugs and drug-induced protein-protein interactions.
In view of the crucial role of human peroxisome proliferator-activated receptor gamma (PPARγ) in the development of several obesity-related cancers and as a potential therapeutic target for autoimmune and inflammatory diseases [15-17], we developed an improved Clover/mRuby2-based flow cytometry-based FRET assay which proved to be suitable for determination of both protein-protein interactions and alterations in protein binding intensity and affinity upon drug treatment of living cells.
The ligand‑dependent, activated transcription factor, PPARγ belongs to the nuclear hormone receptor (NHR) superfamily and plays a crucial role in the development of several human diseases and as a therapeutic target [15-18]. It is subdivided into four isoforms [19, 20]. PPARγ1 is expressed in nearly all tissues, including heart, muscle, colon, kidney, pancreas, and spleen [21-25], whereas PPARγ2 is mainly expressed in adipose tissues [26-28]. The PPARγ isoform 3 was identified in macrophages, large intestine, and white adipose tissues and isoform 4 in endothelial cells [19, 20]. PPARγ possesses a central deoxyribonucleic acid (DNA)-binding domain that recognizes sequence‑specific PPAR response elements (PPREs) in the promoter region of target genes [26, 29]. After activation by a tissue‑ and natural or synthetic ligand‑specific stimulus, PPARγ is translocated to the nucleus, where it changes its structure and regulates gene transcription which is important for cell differentiation, various metabolic, physiological and pathophysiological processes [30-34].
The PPARγ-regulated transcriptional activation of target genes is a complex multistep process and depends on the binding or not of a cognate ligand to the receptor. The process is achieved by heterodimerization of PPARγ with RXRα, binding to PPREs and finally the recruitment of co-factors and other nuclear co-regulatory proteins [35-39]. PPARγ acts as a ligand-dependent regulator of transcription and this depends on its ability to interact with co-regulator proteins but it can also act in an unbound manner [40]. PPARγ can also bind directly to other proteins and inhibits signal transduction. This capability, called transrepression, is mainly mediated by direct protein-protein interactions between PPARγ and other transcription factors [41-43]. In this way, PPARγ inhibits pro-inflammatory signalling and induces an anti-inflammatory response [44, 45]. Typically, activation of the PPARγ-RXRα heterodimer by a PPARγ agonist triggers conformational changes in the receptor which releases the co-repressor complex and PPARγ recruits co-factor complexes or co-activators, such as steroid receptor co-activator 1 (SRC1), SRC3 and cyclic adenosine monophosphate response element binding protein (CBP)/p300 to the promoter region of target genes to initiate transcription [46-48]. These, in turn, assemble a multi-component complex that stimulates transcription both through direct interaction with the core transcription machinery and through the acetylation of histone tails that make the adjacent chromatin transcriptionally competent. Subsequently, co-repressors are recruited to the DNA-bound PPARγ to nucleate the assembly of the repressor complex.
An important PPARγ co-repressor is N-CoR2, which plays a crucial role in adipocyte differentiation and regulation of adipogenesis, insulin sensitivity and type 2 diabetes mellitus [49, 50]. N-CoR2 consists of N-terminal repressor domains (RDs) that can associate with histone deacetylases and SWI3 - adenosine deaminase 2 (ADA2) - N-CoR2 - transcription factor IIIB (TFIIIB) (SANT) domains that target the histone deacetylases, as well as two C-terminal interaction domains (IDs, ID1, ID2 and depending on the cell type there could be an additional ID3) that contain co-repressor nuclear receptor (CoRNR) box (NHR box) motifs [51-53]. Sequences within and outside these motifs mediate the interaction between co-repressors and many NHRs, including PPARγ, in which NHRs preferentially interact with the different IDs [54, 55]. Therefore, alternative splicing of single IDs themselves or between them is a crucial source of variability when functioning as interaction partner. N-CoR2 is recruited by PPARγ in the absence of an agonist or the presence of an antagonist of PPARγ and represses target gene expression by recruiting a histone deacetylase complex until an agonist triggers its disassembly accompanied by recruitment of co-activators [56-61]. The binding of the agonist to PPARγ results in a conformational change in the receptor, leading to loss of co-repressor binding and subsequent recruitment of co-activators. PPARγ can interact with N-CoR2 in solution, but in some contexts it is only a weak repressor, perhaps because the co-repressor binding affinity of PPARγ is weaker than that of other NHRs and is modulated by DNA binding [57, 62-67].
In this report, a systematically improved flow cytometry-based FRET assay for the molecular verification of specific protein-protein interactions of NHR (PPARγ isoform 1 hereinafter referred as PPARγ1) and co-factors (RXRα and N-CoR2) in living cells is described. This combines, for the first time, the identification and characterization of binding intensity and affinity. Thus, by improving sensitivity, this assay system can be used for the identification of novel therapeutic targets for treatment of human diseases and for the detailed characterization of the binding profile of drugs.
Methods
Chemicals and reagents
All chemicals and reagents were of the highest grade of purity and when not indicated otherwise, commercially available from AppliChem GmbH (Darmstadt, Germany), Carl Roth GmbH (Karlsruhe, Germany), Merck KGaA (Darmstadt, Germany) and Sigma-Aldrich Chemie GmbH (Schnelldorf, Germany). The PPARγ antagonist, GW9662 [68], was acquired from Cayman Chemical Company (Ann Arbor, USA) and the PPARγ agonist, rosiglitazone, from Enzo Life Sciences GmbH (Lörrach, Germany). Cell culture medium and supplements were purchased from PAA Laboratories GmbH (Cölbe, Germany) and Sigma-Aldrich Chemie GmbH.
Cell culture
Human HEK293T cells [69] and murine J774A.1 macrophages (ATCC® TIB-67TM) [70] were obtained from LGC Standards GmbH (Wesel, Germany). HEK293T cells were cultured in Dulbecco's Modified Eagle's Medium (DMEM) and J774A.1 cells in Roswell Park Memorial Institute (RPMI)-1640 in a humidified 5% carbon dioxide (CO2) atmosphere at 37 °C. Cell culture medium contained 10% (v/v) heat-inactivated fetal calf serum (FCS), 100 units/ml penicillin and 100 µg/ml streptomycin. The medium was changed three times a week and cells passaged before reaching confluency. When using dimethyl sulfoxide (DMSO), in all cases, the final concentration of DMSO did not exceed 0.1%, a concentration that was not cytotoxic to the cells.
Generation and cloning of expression vectors
Constructs were generated by inserting the coding sequences of Clover, mRuby2, Clover-PPARγ1, mRuby2-RXRα and N-CoR2-mRuby2 into pHR´SIN-cPPT-SE by replacing the EGFP of the vector. Therefore, the coding regions of Clover, mRuby2 and by a 63bp-linker fused Clover-mRuby were amplified by polymerase chain reaction (PCR) from pcDNA3-Clover (Addgene#40259), pcDNA3-mRuby2 (Addgene#40260) and pcDNA3.1-Clover-mRuby2 (Addgene#49089) elongated with the additional bases of 5´-CGCCCGGGGGGGATCGCCGCCACC-3´ on their 5´ end and 5´-CCTGCAGGCATGCAA-3´ on their 3´ end for subsequent recombination into the BamHI-SbfI linearized target vector by In-Fusion® HD cloning (Clontech Laboratories, Inc., Mountain View, USA). Fusion constructs of Clover-PPARγ1, mRuby2-RXRα and N-CoR2-mRuby2 were generated by multiple fragment cloning via the same approach. The single genes were amplified, whereas both primers for the amplification of the fluorophore had an additional base overhang, one a homologue of the vector and one of its fusion partner genes. In contrast, only one primer for the amplification of the transcription factors/repressor had an overhang for the recombination directly with the vector. Thus, pDsRed-Monomer-C1-PPARγ1 [71] and pEGFP-C1-RXRα [72] were used as template DNA for full length human PPARγ1 and human RXRα, whereas a 5´-truncated human N-CoR2 was amplified from HEK293T cell cDNA (GenBank accession number MH507335.1), which contains only the ID2 and not the ID1 exon (ID2/ΔID1 exon), using 5´- ATGAGCGTCCTCGAGAGGCAAA-3´ as 5´-primer. The coding sequences of the single genes were fused together by In-Fusion® HD cloning, additionally amplified as one gene fragment and then inserted into the target vector.
Since HEK293T do not have the complete exon containing the ID1 box motif, the whole ID1 exon of the sequence 5´-GCCTTATGACCTATAGAAGCCAGGCGGTGCAGGAACATGCCAGCACCAACATGGGGCTGGAGGCCATAATTAGAAAGGCACTCATGG-3´ was synthesized by IDT - Integrated DNA technologies, Inc. (Coralville, USA), amplified and fused into the vector construct of N-CoR2 ID2/∆ID1 exon-mRuby2 to generate N-CoR2-mRuby2. For the generation of the different N-CoR2 mutants, ∆CoRNR box ID2 and ∆CoRNR box ID1 the appropriate DNA sequences 5´-CTGGCCCAGCACATCAGTGAGGTCATC-3´ (for CoRNR box ID2) and 5´-CTGGAGGCCATAATTAGAAAGGCACTC-3´ (for CoRNR box ID1) were deleted out of the N-CoR2 sequence by site directed mutagenesis. The same approach was used for the generation of mRuby2-RXRα Δ414-462. Genbank accession numbers are: Clover (JX489388); mRuby2 (JX489389); human PPARγ1 (NP_005028.4); human RXRα (NP_002948.1), N-terminal truncated human N-CoR2∆1-1105; 2310-2338 (NP_001070729.2).
Transfection, lentiviral transduction and cell sorting
To generate infectious lentiviral particles for transduction of expression vectors, 2 × 10⁶ HEK293T cells were seeded into 10 cm dishes and cultured overnight, as described above, to allow attachment of HEK293T cells. The next day, HEK293T cells were transfected using the JetPRIMETM transfection reagent (PEQLAB Biotechnologie GmbH, Erlangen, Germany), as described by the manufacturer. Transfection was carried out with 1.5 µg of the second-generation lentiviral packaging plasmid psPAX2 (Addgene#12260), 0.5 µg of the envelope expressing plasmid pMD2.G (Addgene#12259) and 2 µg of the cloned expression vector, encoding for the gene of interest. After 4 h, transfection medium was replaced and HEK293T cells were cultured in fresh growth medium for another 24 h to 48 h. Gene activity was analyzed by fluorescence microscopy. Twenty-four to 48 h post transfection the supernatant containing infectious lentiviral particles was harvested, centrifuged (500 x g, 4 °C, 5 min) and filtered through a 0.2 μm filter (Merck KGaA). The Lenti-XTM Concentrator reagent (Takara Bio Europe SAS, Saint-Germain-en-Laye, France) was used as described by the manufacturer for concentrating lentiviral stocks. For transduction, 1 x 10⁵ of target HEK293T or J774A.1 cells were incubated in 6 well plates for 24 h to 48 h in cell culture medium containing concentrated infectious lentiviral particles. Subsequently, the medium was changed daily for at least ten days. Afterwards HEK293T cells were sorted for green- and/or red-positive cells using the BD FACSAria™ III cell sorter (BD Biosciences, Heidelberg, Germany) and the FACS Diva software (BD Biosciences, Heidelberg, Germany).
PPARγ‑dependent transactivation assay of HEK293T cells
For the PPARγ‑dependent transactivation assay, 1 × 10⁴ HEK293T cells per well were seeded into 96‑well plates and cultured overnight, as described above, to allow attachment of the HEK293T cells. The next day, the HEK293T cells were transiently transfected using the JetPRIMETM transfection reagent (PEQLAB Biotechnologie GmbH), as described by the manufacturer. Transfection was carried out with 0.01 µg of the cloned expression vector(s), encoding the gene(s) of interest, 0.09 µg per well p(AOX)3‑TK‑Luc (89, 90) and 0.0005 µg per well pRL‑CMV (Promega GmbH, Mannheim, Germany). After 4 h, the transfection medium was replaced and the HEK293T cells were cultured in fresh growth medium for another 24 h.
The PPARγ‑dependent transactivation assay was based on the PPRE containing reporter vector p(AOX)3‑TK‑Luc. The cloned expression vector(s), encoding for the gene(s) of interest were co‑transfected, as described above, in combination with the control vector pRL‑CMV, encoding Renilla luciferase, to normalize Firefly luciferase activity for transfection efficiency. Following transfection, the cells were incubated with 1 µM rosiglitazone and 10 μM GW9662 for 24 h alone or both in combination. The PPARγ‑dependent transactivation assay in HEK293T cells, using a 96‑well plate format, was performed in quadruple. Transactivation was analyzed using a 96‑well plate format in a Mithras LB940 multimode reader (Berthold Technologies, Bad Wildbad, Germany) or an EnSpire® Multimode Plate Reader (Perkin Elmer, Inc., Waltham, USA).
Western blot analysis
HEK293T cells were resuspended in lysis buffer and sonicated. After centrifugation (15,000 x g, 4 °C, 5 min), the protein concentration was determined in the lysate by a Lowry protein assay kit (Bio-Rad Laboratories GmbH, Munich, Germany). For immune detection of Clover, mRuby2, Clover fused (63bp) mRuby2, Clover-PPARγ1, mRuby2-RXRα, mRuby2-RXRα Δ414-462 and N-CoR2-mRuby2 constructs, 100 µg protein per sample was separated on 10% sodium dodecyl sulfate (SDS) polyacrylamide gels followed by transfer onto nitrocellulose membranes (both Bio-Rad Laboratories GmbH) basically following standard procedures. Subsequently, membranes were incubated with first antibodies against GFP (1:1,000; ab1218, Abcam plc, Cambridge, UK), human PPARγ (1:1,000; D69, Cell Signaling Technology, Danvers, USA), human RXRα (1:1,000; NB100-1466, Novus Biologicals, LLC, Littleton, USA), human N-CoR2 (1:1,000; ab2781, Abcam plc) and tRFP (1:1,000; AB233, Evrogen Joint Stock Company, Moscow, Russia) followed by Alexa Fluor® 488, 546 or 647 (Life Technologies Inc., Carlsbad, USA) fluorescent dyes secondary antibodies (1:10,000). Blots were visualized using the ChemiDoc XRS+ system (Bio-Rad Laboratories GmbH).
Fluorescence microscopy
For fluorescence microscopy, 2 x 10⁴ HEK293T cells per well were seeded on all-in-one 8 wells chamber slides. Cultivation continued for 24 h, as described above, to allow attachment of the HEK293T cells, followed by fixation of cells by incubation with Roti®-Histofix solution (Carl Roth GmbH) combined with concomitant counterstaining of cell nuclei with 1 μg/ml Hoechst 33342 dissolved in DMEM in the dark at 37 °C for 15 min. Subsequently, cells were washed twice with DMEM. The cells were excited with a laser at λex = 405 nm, 488 nm and 561 nm. Clover, mRuby2 and Hoechst 33342 were determined on the chamber slides using a 40x immersion water objective with a Zeiss confocal laser scanning microscope (CLSM) 510 Meta (Carl Zeiss AG, Jena, Germany). Uniform laser conditions regarding master and digital gains, pinholes and laser intensities were used for fluorescence detection among the fluorophores alone and for fluorophores assigned to different cellular functional proteins.
Quantification of subcellular co-localization
Correlation analysis of subcellular co-localization was performed using the open source image processing program ImageJ with the plugin “JACoP” [72]. For this, areas of single whole cells or nuclei were framed in brightfield or Hoechst-stained images and the Pearson´s correlation coefficient (PCC) of these regions were calculated from the images, requiring the use of the 488 nm and 561 nm laser. The single R-values obtained were transformed into Fisher z-values, which converts correlations into interval scales values. From these data means, standard deviation (SD) and significances were calculated and further separately transformed back into R-values.
Fluorescence lifetime imaging microscopy (FLIM)
The fluorescence lifetime of the fluorescent proteins depends on their microenvironment. Intermolecular interactions will change the fluorescence lifetime. Thus, the FLIM method was used to observe the capacity of the proteins to generate a FRET signal inside the cells. The cell images were observed with a FluoViewTM FV1000 CLSM microscope (Olympus Europa SE & Co. KG, Hamburg, Germany) with FLIM-extension (PicoQuant, Berlin, Germany). The cells were excited with a 1 ns pulse laser at λex = 440 nm for fluorescence lifetime measurements.
HEK293T cells were seeded on glass coverslips 24 h before measurement and were viewed directly on the coverslip using a 60x immersion oil objective. All images were obtained from living cells to prevent changes in the protein structure or its microenvironment during the procedure of cell fixing. The result was taken as a standard reference for flow cytometry-based FRET analyses.
Flow cytometry measurements
Flow cytometry-based FRET measurements were performed using a FACSFortessa (BD Bioscience) equipped with standard 488 nm and 561 nm lasers. To measure Clover and FRET, cells were excited with the standard 488 nm laser and fluorescence was detected in the green channel with a standard 525/50 nm filter, while the FRET signal was measured with a standard 610/20 nm filter in the channel. The mRuby2 cells were excited with the standard 561 nm laser, while emission was also detected with a standard 610/20 nm filter. For each sample, we analyzed a minimum of 10,000 Clover- and/or mRuby2-positive cells according to the gating strategy shown in Figure 1F. Analyses of flow cytometric data were performed using the FlowJo software (Version X).
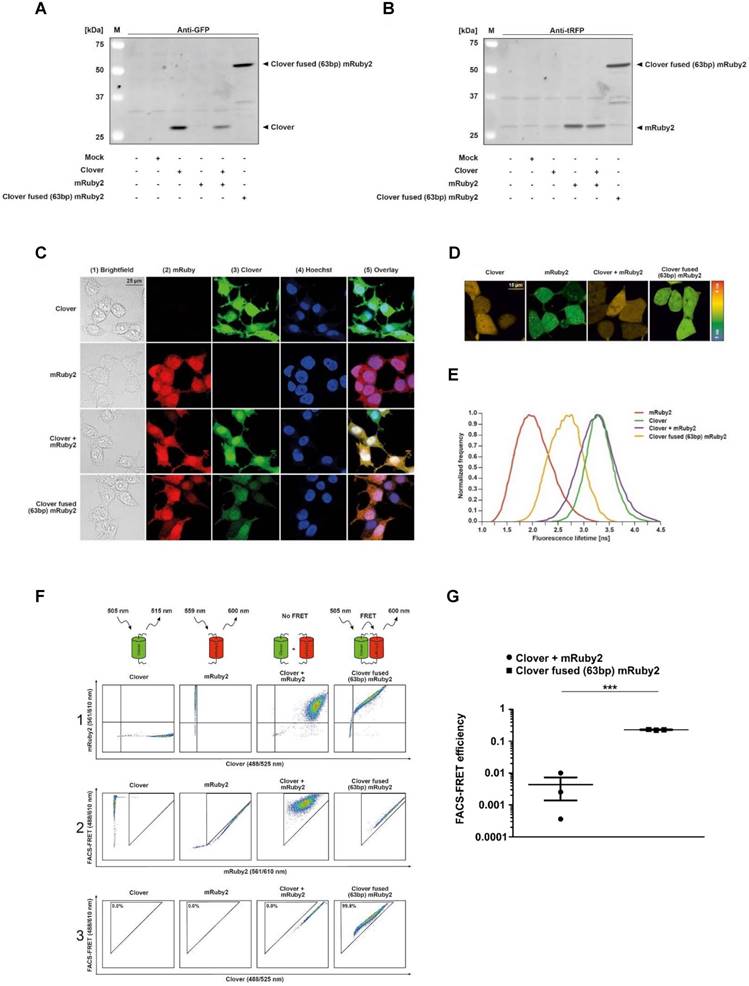
Experimental setup and gating strategy of FRET measurements. Clover, mRuby2, Clover + mRuby2 and Clover fused (63bp) mRuby2 protein expression are shown in total HEK293T cell lysates by Western blot analysis against GFP (A) and tRFP (B). Fluorescence microscopy images (C) of Clover, mRuby2, Clover + mRuby2 and Clover fused (63bp) mRuby2 expressing HEK293T cells. Panel 1 (1) shows the brightfield. Cells expressing mRuby2 are depicted in panel 2 (2), Clover-positive cells in panel 3 (3). Cell nuclei were counterstained with Hoechst 33342 (panel 4 (4)). An overlay to estimate cytosolic and nuclear region is provided in panel 5 (5). FLIM images (D) of HEK293T cells with the controls Clover, mRuby2, Clover + mRuby2 and Clover fused (63bp) mRuby2. The histogram (E) shows the normalized frequency of fluorescence lifetimes in the images. Experimental setup and gating strategy to measure FRET by flow cytometry are depicted in living cells (F). HEK293T cells were stably transduced with the controls Clover, mRuby2, Clover + mRuby2 as well as the Clover fused (63bp) mRuby2 and analyzed using a flow cytometer. Double positive cells were gated in panel 1 (1). False-positive FRET signals resulting from mRuby2 excitation by the 488 nm laser were excluded in panel 2 (2). In panel 3 (3), the remaining cells were evaluated for FRET by adjusting a gate defining cells which were co-transduced with Clover + mRuby2 and should be FRET-negative. The numbers in panel 3 (3) give total percentages of FRET-positive HEK293T cells. Images and flow cytometry-plots are representative for experiments which were performed at least three times. (G) FRET efficiencies were determined as described in Materials and Methods by analyzing Clover/mRuby2-double positive cells only. Experiments were performed at least three times. ***P ≤ 0.001.
Flow cytometry-based FRET efficiency
Following appropriate gating of Clover/mRuby2-double positive cells, flow cytometry-based FRET efficiencies were calculated based on fluorescence medians of Clover (488/525 nm), FRET (488/610 nm), and mRuby2 (561/610 nm) using the FRET calculator protocol provided by Ujlaky-Nagy et al. [11] with reference to our FLIM control setting. Single-positive as well as fluorescence negative cells served as background controls. Gating strategies are depicted in Supplementary Figures 1, 4, 6, 7, 8, and 9.
Statistics
All data are presented as means ± SD. Each experiment was performed at least three times. Statistical analysis was done either with one- or two-way-analysis of variance modified with Bonferroni's multiple comparison test or unpaired and paired Student's t-test, respectively. Differences were considered significant at: *P ≤ 0.05, **P ≤ 0.01 and ***P ≤ 0.001.
Results
Detection of Clover, mRuby2 and Clover fused (63bp) mRuby2 protein expression
To confirm that the fluorophore probes to be used in this study were actually expressed in the cells used, the protein expression of the fluorophores Clover, mRuby2 and Clover fused with a linker sequence to mRuby2 (Clover fused (63bp) mRuby2) in human embryonic kidney 293 T (HEK293T) cells was verified by Western blot analysis. Stained with an antibody against GFP, Clover was only detected in Clover-expressing HEK293T Clover, HEK293T Clover + mRuby2 and HEK293T Clover fused (63bp) mRuby2 cells (Figure 1A). In turn, when stained with an antibody against tRFP, only in mRuby2-expressing HEK293T mRuby2, HEK293T Clover + mRuby2 and HEK293T Clover fused (63bp) mRuby2 cells mRuby2 was observed (Figure 1B). Neither when stained with an antibody against GFP nor with an antibody against tRFP was the protein expression of Clover, mRuby2 or Clover fused (63bp) mRuby2 detected in wild type (WT) and Mock transfected HEK293T cells.
Determination of the cellular localization of Clover, mRuby2 and Clover fused (63bp) mRuby2 by fluorescence microscopy
To determine the cellular localization of the fluorophores used, corresponding Clover- and mRuby2-expressing HEK293T cells were mounted on all-in-one chamber slides and fixed. To distinguish between cytosolic and nuclear localization, Hoechst 33342 was used as a nuclear counterstain. As shown in Figure 1C, mRuby2 (panel 2), Clover (panel 3) and Clover fused (63bp) mRuby2 were evenly distributed throughout the cell.
Validation of Clover, mRuby2 and Clover fused (63bp) mRuby2 for flow cytometry FRET measurements by FLIM
FLIM was used to determine the different fluorescence lifetimes of the intracellular fluorescent proteins. HEK293T cells were transduced to stably express Clover/mRuby2 alone or in combination and Clover fused (63bp) mRuby2 in order to investigate the potential FRET activity of the Clover fused (63bp) mRuby2 protein. As shown in Figure 1D and 1E, the fluorescence lifetime of Clover was highest with a frequency of 3.4 ns ± 0.1 ns, whereas the most frequent fluorescence lifetime of mRuby2 was 1.7 ns ± 0.1 ns. In cells that expressed both Clover and mRuby2 as single proteins, only the fluorescence lifetime of Clover was detectable. In contrast, cells expressing Clover fused (63bp) mRuby2 showed a most frequent fluorescence lifetime of 2.7 ns ± 0.3 ns. This reduction in the fluorescence lifetime from 3.4 ns ± 0.1 ns to 2.7 ns ± 0.3 ns resulted from changes in FRET activity. FRET efficiency of the fusion protein can be calculated from the lifetime of the construct and of the free Clover, roughly resulting in a value of 0.23. This absolute measure of FRET is considered in calculating the flow cytometry-based FRET efficiencies.
Establishment of Clover, mRuby2 and Clover fused (63bp) mRuby2 for FRET measurement by flow cytometry
In a previous study, Banning and colleagues established a flow cytometry-based FRET assay system to identify and analyze protein-protein interactions in living cells [8]. For the analysis of interactions of PPARγ1 with its co-factor RXRα and its co-repressor N‑CoR2 in living cells, we adapted and extended this innovative method. We established a cytometry-based FRET assay with the FRET pair fluorophores Clover/mRuby2 [14]. For FRET measurements by flow cytometry, we first analyzed HEK293T cells stably expressing Clover/mRuby2 alone or in combination and Clover fused (63bp) mRuby2 (Figure 1F). We gated living cells to forward and side scatter (FSC/SSC, not shown) and compensated for Clover and mRuby2 to specifically evaluate FRET in double positive Clover + mRuby2 and Clover fused (63bp) mRuby2 cells. A triangular gate was introduced in panel 2 and false-positive FRET signals resulting from mRuby2 excitation by the 488 nm laser were excluded. A second triangular gate was introduced in panel 3, where FRET was plotted against Clover to determine FRET-positive cells. This gate was adjusted to FRET-negative HEK293T Clover + mRuby2 cells. Consequently, HEK293T Clover and HEK293T mRuby2 cells exhibited no FRET signal, whereas 99.8% of cells expressing Clover fused (63bp) mRuby2 fusion protein (Figure 1F, panel 3) showed a FRET signal. These cells were further used as a positive control. In contrast, 0.0% cells expressing Clover and mRuby2 (Figure 1F, panel 3) as individual proteins showed FRET, thus representing the internal negative control. To verify our data, we analyzed the FRET efficiency. As shown in Supplementary Figure 1, gating for Clover/mRuby-positive cells was performed. Fluorescence medians of Clover (488/525 nm), FRET (488/610 nm), and mRuby2 (561/610 nm) were used to calculate FRET efficiency, including medians of fluorescence negative HEK293T cells as background control (Figure 1G), supporting the information from the raw flow cytometric data shown in Figure 1F.
Verification of Clover-PPARγ1, mRuby2-RXRα and mRuby2-RXRα Δ414-462 protein expression
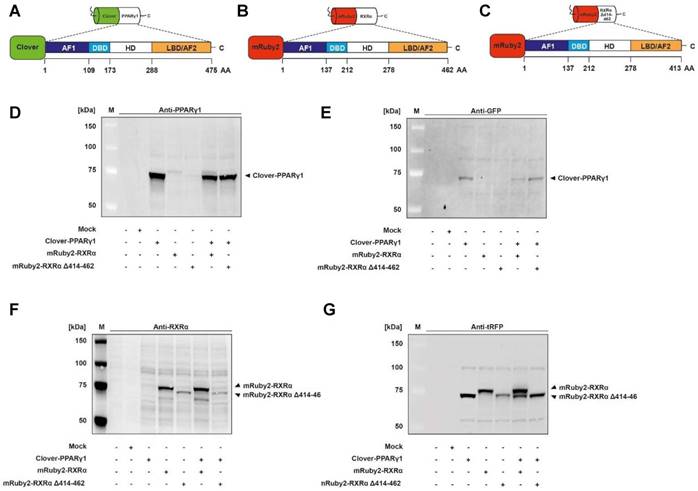
Expression of Clover-PPARγ1 (Figure 2A), mRuby2-RXRα (Figure 2B) and mRuby2-RXRα Δ414-462 (Figure 2C) fusion proteins in HEK293T cells was verified by Western blot analysis. Specific antibodies against GFP, tRFP, human PPARγ and human RXRα were used. As shown in Figure 2D and 2E, the Clover-PPARγ1 fusion protein was detected in cells when stably expressing Clover-PPARγ1, Clover-PPARγ1 + mRuby2-RXRα and Clover-PPARγ1 + mRuby2-RXRα Δ414-462. In the literature it is well established that due to the deletion of the C-terminus of RXRα and the associated lack of the amino acid (AA) sequence 414 to AA 462, RXRα Δ414-462 significantly reduces binding to PPARγ [68]. The protein molecular weight of this deletion construct was 5.7 kDa smaller than the complete mRuby2-RXRα fusion protein (Figure 2F and 2G). Both constructs were only detected in cells expressing mRuby2-RXRα, mRuby2-RXRα Δ414-462, Clover-PPARγ1 + mRuby2-RXRα and Clover-PPARγ1 + mRuby2-RXRα Δ414-462. WT and Mock transfected HEK293T cells were used as negative controls for expression of Clover-PPARγ1 (Figure 2D and 2E), mRuby2-RXRα (Figure 2F and 2G) and mRuby2-RXRα Δ414-462 (Figure 2F and 2G). Our analysis at the protein level by Western blot, depicted in Figure 2G, indicates that the anti-tRFP antibody also binds to Clover, allowing detection of a specific band at the level of Clover-PPARγ1. This band is very prominent in co-transduced HEK293T Clover-PPARγ1 + mRuby2-RXRα cells and thus, shows clearly the simultaneous protein expression of the two fusion proteins in these cells. Due to the deletion of 48 AA (Δ414-462) of the PPARγ1 ID of RXRα, Clover-PPARγ1 and mRuby2-RXRα Δ414-462 are approximately equal in size. For this reason, only one band is visible in co-transduced HEK293 Clover-PPARγ1 + mRuby2-RXRα Δ414-462 cells.
Determination of Clover-PPARγ1, mRuby2-RXRα and mRuby2-RXRα Δ414-462 protein expression. Graphical scheme of the structure of the full length human PPARγ1 protein (A); the full length human RXRα protein (B) and the human RXRα deletion construct with a C-terminal absence of the sequence AA 414-462 (C). PPARγ1 was N-terminally labeled with the green fluorophore Clover and both of the two RXRα constructs N-terminally with the red fluorophore mRuby2. Clover-PPARγ1, mRuby2-RXRα and mRuby2-RXRα Δ414-462 protein expressions are shown in total HEK293T cell lysates visualized by Western blot analysis against human PPARγ (D), GFP (E), human RXRα (F) and tRFP (G). Images are representative of experiments which were performed at least three times.
Mechanistic functionality of Clover, Clover-PPARγ1, mRuby2, mRuby2-RXRα and mRuby2-RXRα Δ414-462
To examine whether PPARγ-dependent transactivation is altered, we performed a set of experiments using a PPRE-dependent reporter system. HEK293T cells expressing Clover, Clover-PPARγ1, mRuby2, mRuby2-RXRα and mRuby2-RXRα Δ414-462 were treated for 24 h with 1 µM of the PPARγ agonist, rosiglitazone and 10 µM of the irreversible binding PPARγ antagonist, 2-chloro-5-nitrobenzanilide (GW9662) [68] or a combination of both. Firefly and control Renilla luciferase luminescence values were determined in each sample. The ratios of Firefly to Renilla luciferase luminescence were used for normalization.
In line with its published action, rosiglitazone alone showed significant agonistic effects and led to an approximately 2.5‑fold PPARγ‑transactivation after 24 h stimulation in Clover-PPARγ1 cells (Figure 3A). In HEK293T WT and Mock transfected cells as well as HEK293T cells expressing Clover and/or mRuby2, rosiglitazone and GW9662 alone or in combination showed no agonistic effects and led to an approximately 1.25‑fold higher transactivation of PPARγ compared to DMSO control treatment (Supplementary Figure 2).
Analysis of protein-protein interactions between Clover-PPARγ1, mRuby2-RXRα and mRuby2-RXRα Δ414-462. A PPARγ‑dependent transactivation assay was used in HEK293T cells to verify the mechanistic functionality of the Clover, Clover-PPARγ1, mRuby2, mRuby2-RXRα and mRuby2-RXRα Δ414-462 (A and B). HEK293T cells expressing protein(s) as indicated were stimulated for 24 h with 1 µM rosiglitazone and 10 µM GW9662 alone or in combination. Values from PPARγ‑dependent transactivation experiments are means ± SD of three to ten individual experiments. Each PPARγ‑dependent transactivation assay experiment was performed in quadruple. *P ≤ 0.05, **P ≤ 0.01 and ***P ≤ 0.001. Fluorescence microscopy images of HEK293T cells expressing Clover-PPARγ1, mRuby2-RXRα, mRuby2-RXRα Δ414-462, Clover-PPARγ1 + mRuby2-RXRα and Clover-PPARγ1 + mRuby2-RXRα Δ414-462 are depicted (C). The brightfield is shown in panel 1 (1). The mRuby2-positive cells are depicted in panel 2 (2), Clover in panel 3 (3), Hoechst 33342-stained cell nuclei in panel 4 (4) and an overlay to estimate the localization is provided in panel 5 (5). Images are representative for experiments which were performed at least three times. The PCC was used for the correlation quantification of the subcellular co-localization of Clover-PPARγ1 expressed in combination with mRuby2-RXRα or mRuby2-RXRα Δ414-462 (D). R-Values are means ± SD of at least 18 individual cells. ***P ≤ 0.001. Representative primary flow cytometry-plots from an experiment which was performed three times showing the amount of FRET-positive living HEK293T cells expressing Clover-PPARγ1 + mRuby2-RXRα and Clover-PPARγ1 + mRuby2-RXRα Δ414-462 (E). The numbers in panel 3 (3) give total percentages of HEK293T cells within the FRET gate. A comparison of the total percentages of FRET-positive living HEK293T Clover-PPARγ1 + mRuby2-RXRα and HEK293T Clover-PPARγ1 + mRuby2-RXRα Δ414-462 cells is depicted in (F). Flow cytometry-based FRET efficiencies, depicted in (G), are calculated as described in Materials and Methods. Values are means ± SD of three experiments. **P ≤ 0.01, ***P ≤ 0.001.
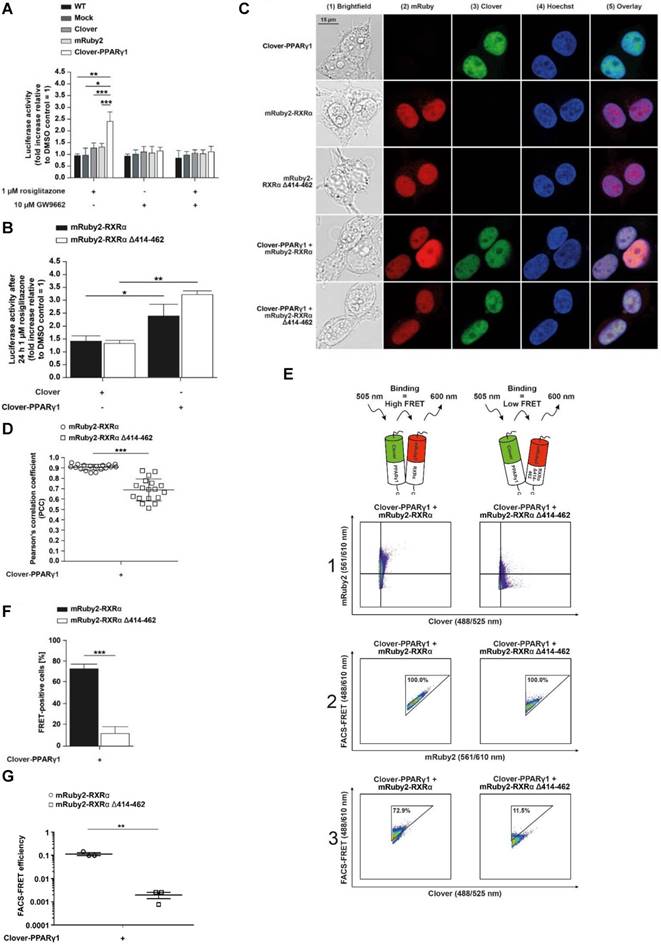
There were no differences between Clover + mRuby2-RXRα and Clover + mRuby2-RXRα Δ414-462 cells in response to rosiglitazone (Figure 3B). In this case, a roughly 1.4‑fold higher transactivation of PPARγ compared to DMSO control treatment was detected. In contrast to this observation, in Clover-PPARγ1 + mRuby2-RXRα and Clover-PPARγ1 + mRuby2-RXRα Δ414-462 cells, a significantly increased 2.5‑fold to 3.25‑fold PPARγ‑transactivation was observed. Altogether, these results indicate that the Clover-PPARγ1 fusion protein is functional and responsive to drug treatment.
Assessment of the fluorescence and cellular localization of Clover-PPARγ1, mRuby2-RXRα and mRuby2-RXRα Δ414-462 by fluorescence microscopy
Fluorescence microscopy was used to assess the cellular localization of Clover-PPARγ1, mRuby2-RXRα and mRuby2-RXRα Δ414-462 in HEK293T cells. Cell nuclei were visualized by Hoechst 33342-staining (Figure 3C, panel 4), confirming the mainly nuclear localization of Clover-PPARγ1 (Figure 3C, panels 3 and 5), mRuby2-RXRα (Figure 3C, panels 2 and 5) and mRuby2-RXRα Δ414-462 (Figure 3C, panels 2 and 5).
The PCC was used to assess the correlation between the subcellular co-localization of Clover-PPARγ1 with mRuby2-RXRα or mRuby2-RXRα Δ414-462. As shown in Figure 3D, significant differences in the PCC of HEK293T Clover-PPARγ1 + mRuby2-RXRα (0.912 ± 0.154) compared to HEK293T Clover-PPARγ1 + mRuby2-RXRα Δ414-462 (0.706 ± 0.226) were detected. Because of the overlapping spectra of the fluorophores Clover and mRuby2, a possible irradiation of fluorescence into each of the confocal microscopy channels was expected. Therefore, the PCC of cells expressing only single fusion proteins was also calculated. The highest background value was measured for Clover-PPARγ1 alone and was in the range of 0.7 (Supplementary Figure 3). Considering this value as background signal, mRuby2-RXRα Δ414-462 does not associate with Clover-PPARγ1, whereas the full-length RXRα seems to specifically co-localize (Figure 3D).
Protein-protein interactions of Clover-PPARγ1 - mRuby2-RXRα and Clover-PPARγ1 - mRuby2-RXRα Δ414-462 determined by flow cytometry-based FRET
Using the established experimental setup and the gating strategy for FRET measurements by flow cytometry (Figure 1F), we analyzed the protein-protein interactions of Clover-PPARγ1 with mRuby2-RXRα and with the RXRα deletion construct mRuby2-RXRα Δ414-462 in living HEK293T cells to substantiate the functionality of our flow cytometry-based FRET assay system. In Figure 3E, a representative flow cytometry-plot is shown. Consequently, due to the deletion of the C-terminus of mRuby2-RXRα Δ414-462, which is necessary for PPARγ1-binding, cells expressing this deletion construct showed reduced binding to Clover-PPARγ1. In this case, only 11.5% of the double positive (Figure 3E, right panel 1, upper right quadrant) HEK293T cells expressing Clover-PPARγ1 and mRuby2-RXRα Δ414-462 showed a FRET signal (Figure 3E, right panel 3) whereas 72.9% of double positive (Figure 3E, left panel 1, upper right quadrant) HEK293T Clover-PPARγ1 + mRuby2-RXRα cells showed a FRET signal (Figure 3E, left panel 3). Overall, the percentage of FRET-positive HEK293T Clover-PPARγ1 + mRuby2-RXRα cells was significantly higher compared to HEK293T cells expressing Clover-PPARγ1 and mRuby2-RXRα Δ414-462. Hence, flow cytometry-based FRET gives a robust readout for the interaction of PPARγ1 with RXRα that is highly superior as compared to non-background corrected co-localization microscopy (Figures 3D vs 3F). FRET efficiencies (Figure 3G) reflect FACS data. Appropriate gating is shown in Supplementary Figure 4.
Functional expression of Clover-PPARγ1 and N-CoR2-mRuby2 constructs protein
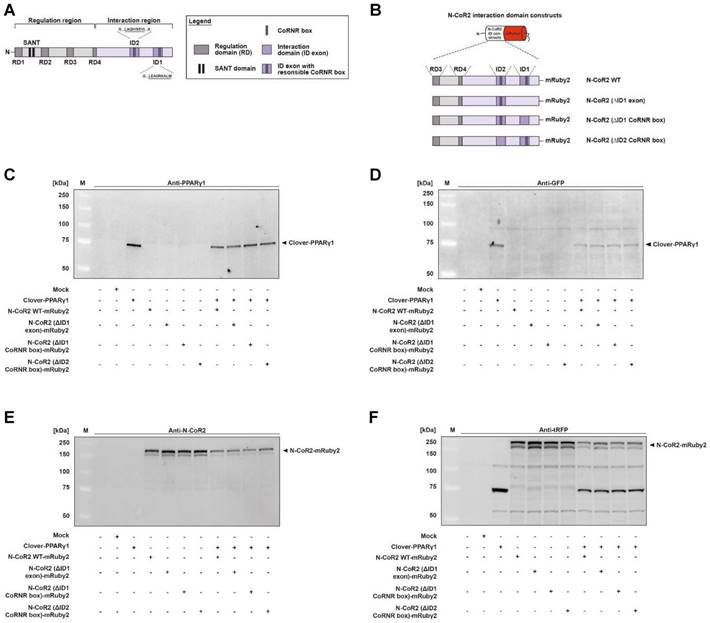
The protein expression of fusion proteins, Clover-PPARγ1, N-CoR2 WT-mRuby2 (Figure 4A and 4B), N-CoR2 (ΔID1 exon)-mRuby2 (Figure 4B), N-CoR2 (ΔID1 CoRNR box)-mRuby2 (Figure 4B) and N-CoR2 (ΔID2 CoRNR box)-mRuby2 (Figure 4B), was determined by Western blot analysis. Clover-PPARγ1 was detected using an anti-PPARγ1 antibody (Figure 4C) and an anti-GFP antibody (Figure 4D) in HEK293T cells stably expressing this fusion protein. In cells stably expressing N-CoR2-mRuby2 constructs alone or in combination with Clover-PPARγ1, N-CoR2 WT-mRuby2, N-CoR2 (ΔID1 exon)-mRuby2, N-CoR2 (ΔID1 CoRNR box)-mRuby2 and N-CoR2 (ΔID2 CoRNR box)-mRuby2 could all be determined with an antibody against N-CoR2 (Figure 4E) and tRFP (Figure 4F). WT and Mock transfected HEK293T cells were used as negative controls for expression of Clover-PPARγ1 (Figure 4C and 4D) and N-CoR2-mRuby2 constructs (Figure 4E and 4F). As mentioned above, our analysis at the protein level by Western blot indicates that the anti-tRFP antibody also recognizes Clover, allowing detection of a specific band at the level of Clover- PPARγ1. This band was very prominent in HEK293T cells co-transduced with Clover-PPARγ1 + N-CoR2 constructs (Figure 4F), thus, showing clearly the simultaneous protein expression of the two fusion proteins in these cells.
Protein expression analysis of Clover-PPARγ1 and N-CoR2-mRuby2 constructs. Graphical scheme of the structure of the full-length human N‑CoR2 protein (A) and the used N-CoR2 constructs, N-CoR2 WT-mRuby2, N-CoR2 (ΔID1 exon)-mRuby2 (amplified out of HEK293T cells cDNA), N-CoR2 (ΔID1 CoRNR box)-mRuby2 and N-CoR2 (ΔID2 CoRNR box)-mRuby2 (B). All N-CoR2 constructs were C-terminally labeled with the red fluorophore mRuby2. Western blot analysis of total lysate of HEK293T cells stably expressing Clover-PPARγ1, N-CoR2 WT-mRuby2, N-CoR2 (ΔID1 exon)-mRuby2, N-CoR2 (ΔID1 CoRNR box)-mRuby2 and N-CoR2 (ΔID2 CoRNR box)-mRuby2 alone or in combination against human PPARγ1 (C), GFP (D), human N-CoR2 (E) and tRFP (F). Images are representative of experiments which were performed at least three times.
Mechanistic functionality of N-CoR2-mRuby2 constructs
To examine whether PPARγ-dependent transactivation is altered when the interaction domain of N-CoR2 is modified, we performed a set of experiments using a PPRE-dependent reporter system. HEK293T cells expressing Clover-PPARγ1 in combination with N-CoR2 WT-mRuby2, N-CoR2 (ΔID1 exon)-mRuby2, N-CoR2 (ΔID1 CoRNR box)-mRuby2 or N-CoR2 (ΔID2 CoRNR box)-mRuby2 were treated for 24 h with 1 µM rosiglitazone and compared to DMSO control treatment. Firefly and control Renilla luciferase luminescence values were determined in each sample. The ratios of Firefly to Renilla luciferase luminescence were used for normalization.
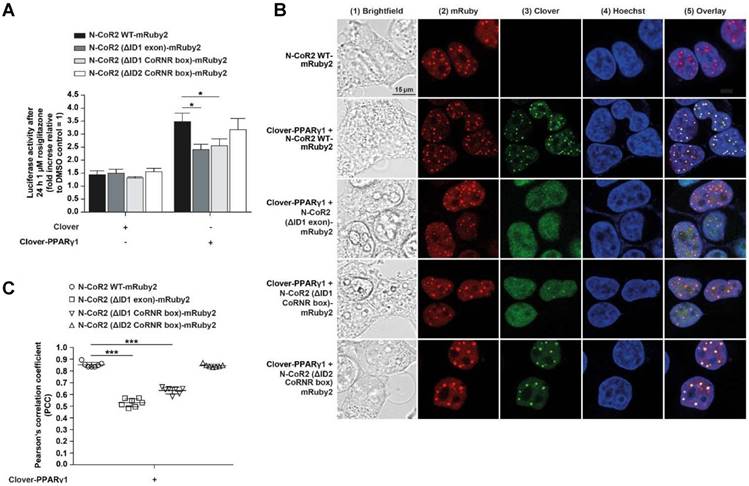
In Clover-PPARγ1 + N-CoR2 WT-mRuby2 cells, rosiglitazone showed agonistic effects and led to an approximately 3.5‑fold PPARγ‑transactivation (Figure 5A). Compared to Clover-PPARγ1 + N-CoR2 (ΔID1 exon)-mRuby2 and Clover-PPARγ1 + N-CoR2 (ΔID1 CoRNR box)-mRuby2 cells, the rosiglitazone-induced PPARγ‑transactivation was significantly increased. In Clover-PPARγ1 + N-CoR2 (ΔID2 CoRNR box)-mRuby2 cells, an approximately similar PPARγ‑transactivation as in Clover-PPARγ1 + N-CoR2 WT-mRuby2 cells was observed.
Mechanistic functionality and cellular localization of Clover-PPARγ1 and N-CoR2-mRuby2 constructs. A PPARγ‑dependent transactivation assay was used to verify the mechanistic functionality of HEK293T cells expressing Clover or Clover-PPARγ1 in combination with N-CoR2 WT-mRuby2, N-CoR2 (ΔID1 exon)-mRuby2, N-CoR2 (ΔID1 CoRNR box)-mRuby2 and N-CoR2 (ΔID2 CoRNR box)-mRuby2 (A). HEK293T cells expressing protein(s) as indicated were stimulated for 24 h with 1 µM rosiglitazone. Values from PPARγ‑dependent transactivation experiments are means ± SD of four to 12 individually experiments. Each PPARγ‑dependent transactivation assay experiment was performed in quadruple. *P ≤ 0.05. Fluorescence microscopy images of HEK293T cells expressing N-CoR2 WT-mRuby2 and Clover-PPARγ1 in combination with N-CoR2 WT-mRuby2, N-CoR2 (ΔID1 exon)-mRuby2, N-CoR2 (ΔID1 CoRNR box)-mRuby2 and N-CoR2 (ΔID2 CoRNR box)-mRuby2 cells are depicted (B). The brightfield is shown in panel 1 (1). The mRuby2-positive cells are depicted in panel 2 (2), Clover in panel 3 (3), Hoechst 33342-stained cell nuclei in panel 4 (4) and an overlay to estimate the localization is provided in panel 5 (5). Images are representative of experiments which were performed at least three times. The PCC was used for the correlation quantification of the sub-cellular co-localization of Clover-PPARγ1 expressed in combination with N-CoR2 WT-mRuby2, N-CoR2 (ΔID1 exon)-mRuby2, N-CoR2 (ΔID1 CoRNR box)-mRuby2 and N-CoR2 (ΔID2 CoRNR box)-mRuby2 in HEK293T cells (C). R-Values are means ± SD of at least seven individual cells. ***P ≤ 0.001.
Determination of the cellular localization of Clover-PPARγ1 and N-CoR2-mRuby2 constructs by fluorescence microscopy
A detailed fluorescence microscopic assessment of the cellular localization of HEK293T cells expressing fusion proteins of Clover-PPARγ1 (panels 3 and 5), N-CoR2 WT-mRuby2, N-CoR2 (ΔID1 exon)-mRuby2, N-CoR2 (ΔID1 CoRNR box)-mRuby2 or N-CoR2 (ΔID2 CoRNR box)-mRuby2 (panels 2 and 5) is shown in Figure 5B. The overlay (panel 5) showed a predominantly nuclear localization of Clover-PPARγ1 and N-CoR2-mRuby2 constructs. In all cases, when analyzing N-CoR2 constructs, strong red spots in the nuclei of cells were evident (here, only shown for N-CoR2 WT-mRuby2). However, in contrast to this unambiguous observation, spots like those seen in cells expressing N-CoR2 constructs were only observed for the Clover-PPARγ protein in a comparable variety and intensity in cells when either N-CoR2 WT-mRuby2 or N-CoR2 (ΔID2 CoRNR box)-mRuby2 (panels 3 and 5) were expressed in combination. This points towards co-localization and possible interaction of these two proteins. In cells expressing Clover-PPARγ1 in combination with N-CoR2 (ΔID1 exon)-mRuby2 or N-CoR2 (ΔID1 CoRNR box)-mRuby2, only a small number of weak spots on diffuse nuclei background were found for the Clover-PPARγ1 protein.
To quantify these observations, the PCC was used. As shown in Figure 5C, significant differences in PCC values are valid in HEK293T cells expressing Clover-PPARγ1 in combination with the different N-CoR2 constructs. Interestingly, the calculated PCC of Clover-PPARγ1 + N-CoR2 WT-mRuby2 (0.855 ± 0.086) was significantly higher compared to Clover-PPARγ1 + N-CoR2 (ΔID1 exon)-mRuby2 (0.532 ± 0.048) or Clover-PPARγ1 + N-CoR2 (ΔID1 CoRNR box)-mRuby2 (0.636 ± 0.048). In contrast, the PCC of Clover-PPARγ1 in combination with N-CoR2 WT-mRuby2 (0.855 ± 0.086) or N-CoR2 (ΔID2 CoRNR box)-mRuby2 (0.846 ± 0.048) remained almost unchanged. In comparison to these data, the background PCC values of cells expressing only the single fusion protein N-CoR2 WT-mRuby2 ID2/ID1 (0.326 ± 0.057) were significantly lower than the PCC data from simultaneously expressed protein couples (Supplementary Figure 5), indicating co-localization analyses of Clover-PPARγ1 with the single different N-CoR2 constructs is meaningful. To finally differentiate binding and/or co-localization, we used our flow cytometry-based-FRET assay system.
Determination of protein-protein interactions of Clover-PPARγ1 and N-CoR2 WT-mRuby2 by flow cytometry-based FRET
Taking into consideration that N-CoR2 is a well-known PPARγ interaction partner [49], we investigated the effects of agonistic activation of PPARγ or its antagonism on this protein-protein interaction. For this, Clover-PPARγ1 and N-CoR2 WT-mRuby2 were stably expressed in HEK293T cells and treated for 24 h either with 1 µM rosiglitazone or 10 µM GW9662 or both added simultaneously. In Figure 6A, a representative flow cytometry-plot is shown. Transferring the previously described setup and gating strategy to the measurement of FRET by flow cytometry in living cells (Figure 1F) resulted in roughly the same number of FRET-positive cells expressing Clover-PPARγ1 and N-CoR2 WT-mRuby2 (Figure 6B), following solvent (first dot blot, panel 3), rosiglitazone (second dot blot, panel 3), GW9662 (third dot blot, panel 3) or combined rosiglitazone + GW9662 (last dot blot, panel 3) treatment.
Flow cytometry-based FRET-measurements to analyze protein-protein interactions between Clover-PPARγ1 and N-CoR2-mRuby2 constructs. Representative primary flow cytometry-plots showing the quantity of FRET-positive living HEK293T Clover-PPARγ1 + N-CoR2 WT-mRuby2 cells are depicted (A). Images are representative of experiments which were performed three times. The cells were cultured for 24 h with DMSO, 1 µM of the PPARγ agonist, rosiglitazone, and 10 µM of the PPARγ antagonist, GW9662, alone or in combination. Panel 1 (1) represents the gating for Clover/mRuby2-double positive cells. Panel 2 (2) depicts cells positive for the first FRET gate of FRET 488/610nm vs. mRuby2 561/610 nm and panel 3 (3) shows cells with a FRET signal. Numbers in panels (2) and (3) represent total percentages of cells within the FRET gates. A comparison of the total percentages of FRET-positive living HEK293T Clover-PPARγ1 + N-CoR2 WT-mRuby2 cells is depicted in (B). The relative flow cytometry-based FRET efficiencies calculated as described in Materials and Methods are presented in (C). Comparison of the total percentages of FRET-positive living HEK293T Clover-PPARγ1 + N-CoR2 WT-mRuby2, Clover-PPARγ1 + N-CoR2 (ΔID1 exon)-mRuby2, Clover-PPARγ1 + N-CoR2 (ΔID1 CoRNR box)-mRuby2 and Clover-PPARγ1 + N-CoR2 (ΔID2 CoRNR box)-mRuby2 cells are depicted in (D). Flow cytometry-based efficiencies of Clover/mRuby2-double positive cells, calculated as described in Materials and Methods, are shown in (E). Values are means ± SD of three experiments. **P ≤ 0.01 and ***P ≤ 0.001.
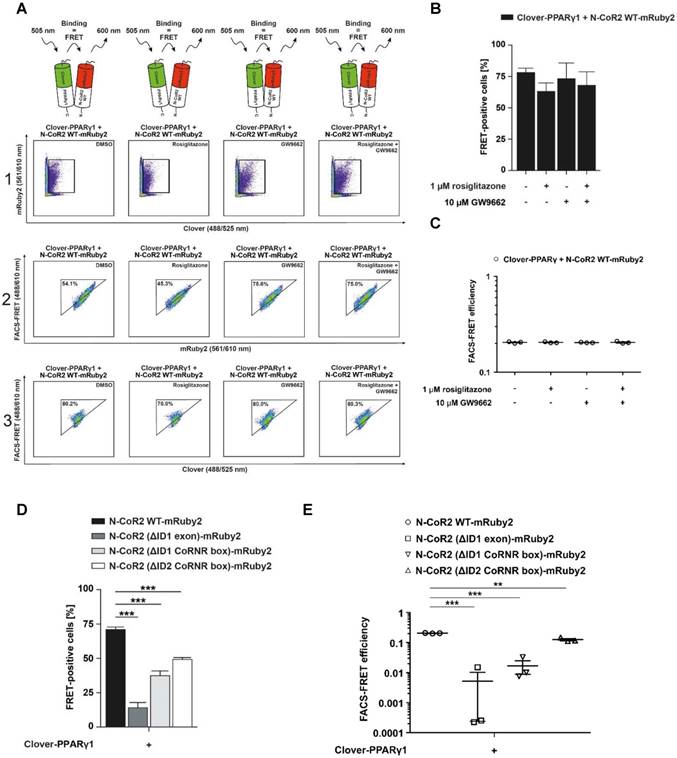
In 2016, Schaufele determined the binding affinity of ligands based on the determination of the FRET intensity via the measurement of the mean relative fluorescence value [13]. In relation to this important aspect, our FRET measurements revealed no differences in FRET intensity following treatment with an agonist or an antagonist, suggesting no altered affinity upon ligand binding. As shown in Figure 6C, flow cytometry-based FRET efficiencies were roughly similar after stimulation for 24 h with 10 µM of the PPARγ antagonist, GW9662, alone or in combination with 1 µM of the PPARγ agonist, rosiglitazone, or the PPARγ agonist rosiglitazone alone (Figure 6C). The gating strategy used is shown in Supplementary Figure 6.
Co-localization analyses suggest that specific N-CoR2 domains modulate PPARγ1 interaction (Figure 5B and C). We verified these results by flow cytometry-based FRET. As demonstrated previously, Clover-PPARγ1 and N-CoR2 WT-mRuby2 showed high FRET signals in the range of ~ 70%. Compared to N-CoR2 WT-mRuby2, the lack of ID1 exon (ΔAA 2310-2338), the ID1 CoRNR box (ΔAA 2329-2337) and the ID2 CoRNR box (ΔAA 2122-2130) significantly reduced the FRET signal, suggesting that these domains all contribute to NCoR2 binding (Figure 6D). Of note, the FRET results again exactly mirror the results from the co-localization analyses, but with much higher statistical confidence and background corrected. As a negative control, since there was no ligand binding in this latter experiment, we also analyzed whether these mutations alter the flow cytometry-based FRET efficiencies (Figure 6E). The gating strategy used is depicted in Supplementary Figure 7. As expected, the mutants showed less FRET with PPARγ1, in line with the number of FRET-positive cells, indicating a reduced overall number of total molecules that interact. Altogether, these data demonstrate that our assay is sensitive and reliable in measuring differences in overall protein-protein interactions (percentage of FRET-positive cells), as well as binding affinity between proteins in the presence or absence of ligands (flow cytometry-based FRET efficiency).
Validation of the flow cytometry-based FRET system in murine J774A.1 macrophages
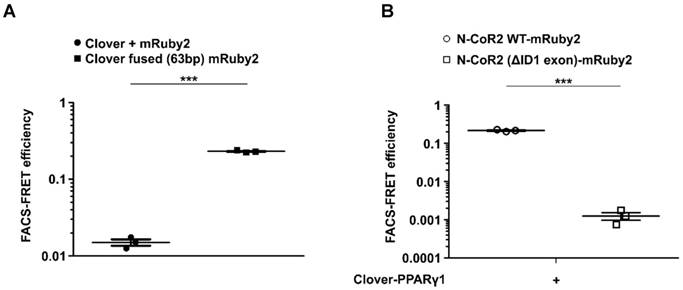
Based on our results obtained in HEK293T cells, we were interested to see, whether the flow cytometry-based FRET system can be used in more difficult to transfect cells as well. Therefore, we performed a final set of experiments using the murine macrophage cell line J774.A1. As shown in Supplementary Figure 8, gating for Clover/mRuby2-positive cells expressing Clover + mRuby2 and Clover fused (63bp) mRuby2 was performed. Fluorescence medians of Clover (488/525 nm), FRET (488/610 nm), and mRuby2 (561/610 nm) were used to calculate FRET efficiency, including medians of fluorescence negative J774A.1 cells as background control. Flow cytometry-based FRET efficiencies in J774A.1 cells (Figure 7A) were similar to the values in HEK293T cells (Figure 1G). Transduced J774A.1 cells expressing Clover-PPARγ1 and NCoR2 WT-mRuby2 or NCoR2 (ΔID1 exon)-mRuby2 were analyzed in analogy to HEK293T cells for protein-protein interaction of PPARγ1 and NCoR2. Following appropriate gating (Supplementary Figure 9), Clover/mRuby2-double-positive cells were analyzed for flow cytometry-based FRET. As shown in Figure 7B, similarly to HEK293T cells, the deletion of ID1 exon in NCoR2 prevented interaction with PPARγ1, which was visible with the NCoR2 WT-mRuby2 construct.
Transfer of the flow cytometry-based FRET system to J774A.1 macrophages. Flow cytometry-based FRET efficiency was determined in murine J774A.1 macrophages following transduction with (A) Clover + mRuby2 or Clover fused (63bp) mRuby2 and (B) Clover-PPARγ1 in combination with N-CoR2 WT-mRuby2 or N-CoR2 (ΔID exon)-mRuby2. Flow cytometry-based FRET efficiencies of Clover/mRuby2-double positive cells were calculated as described in Materials and Methods.
Discussion
In 2010, Banning et al. described a new innovative flow cytometry-based FRET assay to detect protein-protein interactions in living cells [8]. Compared to previous reports that combined flow cytometry and FRET [73, 74], Banning and colleagues designed an assay that allows quantitation and statistical analysis, eliminates cross talk artefacts and is easy to adapt and transferable to other applications [8]. A unique advantage of such a flow cytometry-based FRET assay is that the FRET efficiency can be as easily quantified as the percentage of FRET-positive cells. Besides the many advantages offered by this assay, there are also some critical points that need to be taken into consideration. These include the fluorophores chosen, the steric orientation of the fluorophores, the expression and size of the fusion protein, the quantity of interacting proteins and finally, the distance between both interaction partners. One pivotal aspect of Banning´s flow cytometry-based FRET assay which could be improved, because it is a limiting factor, is the choice of the fluorophores. The FRET pair previously used, CFP/YFP, which are commonly used as donors and acceptors, respectively, have major limitations in their applicability. On the one hand, this is due to the pH-sensitivity of the YFP, which is tightly coupled to halide binding, and on the other, the multiple fluorescent states of CFP, its pH-dependence and low quantum yield [75, 76]. To overcome most of the major problems, we sought to use a new, systematically developed FRET pair consisting of green and red fluorophores. FRET pairs using GFPs as donors and RFPs as acceptors are less commonly used, but exhibit fewer of the above mentioned disadvantages of CFP/YFP pairs [77-81]. In the literature, it is reported that compared to the FRET pair CFP/YFP, the green/red fluorophore pairing of Clover/mRuby2 has an increased Förster distance and an improved dynamic range [14, 82, 83]. In line with the findings of Lam and colleagues, using the “gold standard” method FLIM to verify FRET, we also confirmed that Clover/mRuby2 (Figures 1D and E) are an appropriate fluorophore pair for our cytometry-based FRET measurements. Our FLIM measurements show clearly the prolonged fluorescence lifetime of Clover compared to EGFP (Supplementary Figure 10). In addition, we were able to demonstrate a shift in the fluorescence lifetime of Clover resulting from changes in FRET activity. Such a shift, which is necessary for the FRET detection, could not be shown even for different AA linker lengths between EGFP and mRuby2 in our fluorophore fusion construct. As expected, we were able to easily transfer the adapted setup and gating strategy, using standard flow cytometry equipment, to measure FRET by flow cytometry in living cells with Clover/mRuby2. Thus, responses to these fluorophores either alone, in combination or fused were detectable as a high FRET of the positive control Clover fused (63bp) mRuby2 compared with the undetectable FRET from the negative control in HEK293T cells expressing Clover and mRuby2 simultaneously as distinct proteins (Figure 1F and G as well as Supplementary Figure 1).
The focus of current rational drug development is not only based on whether and where an active substance binds to cause changes in protein-protein interactions, but also on the affinity and the molecular features of the protein-protein interactions. In order to address these current questions, we modified and expanded the flow cytometry-based FRET system, developed by Banning and colleagues [8], with an additional variable. In addition to the findings in 2010 of Banning and colleagues [8], Schaufele determined binding affinity based on the analysis of the FRET intensity via measurement of the MFI value [13]. To our knowledge, currently, no assay system has been described nor is available that combines the aspects of both systems. For this reason, we combined both assay systems for the investigation of binding intensity and affinity during the complex protein-protein interactions of PPARγ to its co-factors RXRα and NCoR2. This interaction plays a crucial role in the development of several obesity-related cancers and as a molecular and pharmacological target for autoimmune and inflammatory diseases [15-17].
PPARγ regulates gene expression upon heterodimerization with RXRα [35, 37]. Thus, RXRα is the most important PPARγ co-factor. The significantly reduced FRET observed in HEK293T Clover-PPARγ1 + mRuby2-RXRα Δ414-462 compared to HEK293T Clover-PPARγ1 + mRuby2-RXRα cells (Figures 3E, F, and G as well as Supplementary Figure 4) showed clearly that such protein-protein interactions can be detected using our flow cytometry-based FRET assay system.
N-CoR2 is expressed ubiquitously and as an important PPARγ co-repressor it plays a crucial role in adipocyte differentiation and regulation of adipogenesis, insulin sensitivity, type 2 diabetes mellitus and PPARγ transcriptional activity [49, 50, 84]. In recent years, a multitude of studies have described NHR - N-CoR2 binding and protein interactions [66, 67, 85, 86]. Current reports show that NHRs generally bind more effectively to N‑CoR2 in the absence of ligands or in the presence of antagonists [49, 54]. Thus, in addition to establishing the combined flow cytometry-based FRET system, we characterized the influence of specific PPARγ ligands on PPARγ1 - N-CoR2 binding and protein-protein interactions (Figure 6A). Interestingly, we found that in the absence (DMSO) or presence of the PPARγ antagonist, GW9662, no change in FRET-positive cells, in terms of total number of PPARγ1 - N-CoR2 binding and protein interactions, was observed (Figure 6B). The administration of the PPARγ agonist, rosiglitazone, also did not significantly alter the number of FRET-positive cells, indicating no change in PPARγ1 - N-CoR2 binding and protein interactions. This observation also confirms data in the current literature.
In the last few years, a variety of studies have shown that agonist binding to PPARγ results in a conformational change in the PPARγ receptor, leading to destabilization of co-repressor interactions and the loss of N-CoR2 binding and subsequent recruitment of co-activators [54, 55, 84]. We propose that this explains our current findings. That the binding of the PPARγ agonist, rosiglitazone [54, 55, 84, 87] to the PPARγ ligand binding domain (LBD) results in a PPARγ conformational change, needs to be verified in further experiments. The consequence of this change and the loss of N-CoR2 binding was experimentally demonstrated, in our case, by a reduced number of FRET-positive cells. The binding of the PPARγ antagonist, GW9662 prevents this conformational change, stabilizes the protein interaction and thus maintains PPARγ1 - N-CoR2 binding and protein interactions, as reflected by a high number of FRET-positive cells. In addition, to verify the affinity of the PPARγ1 - N-CoR2 protein interactions and thereby, the effects of the PPARγ agonist, rosiglitazone, and antagonist, GW9662, in comparison to the absence of a ligand (DMSO), we introduced a new tool, determining the binding affinity based on the determination of the FRET intensity via the measurement of the MFI value [13]. This modification revealed that neither antagonist nor agonist treatment altered PPARγ1 - N-CoR2 binding (Figure 6C and Supplementary Figure 6). Importantly, flow cytometry-based FRET efficiencies have to be calculated from raw flow cytometric data [10-12].
Physiologically relevant variations in the interactions between these two proteins exist with respect to the expressed protein isoforms. In the literature it has been reported that the N-CoR2 - NHR interaction, as well as its functional transcriptional co-repressor activity, is controlled by its protein structure. Crucial for these functions are the two C-terminal IDs (ID1 and ID2) of N-CoR2, that contain CoRNR box (NHR box) motifs which mediate the interaction between co-repressors and NHRs [13, 52, 54, 55, 84, 88]. Furthermore, it has been reported that alternative splicing of single IDs or splicing among them has crucial consequences for their functions as an interaction partner of PPARγ [53-58]. Because of the surprising result of the N-CoR2 amplification of HEK293T cells, in which we amplified the N-CoR2 (ΔID1 exon) variant, we further developed different N-CoR2 constructs to study the influence of selected AA deletions on PPARγ - N-CoR2 protein interactions.
With deletions in the N‑CoR2 interaction sequence, we detected significant differences in FRET-positive HEK293T cells. Compared to N-CoR2 WT-mRuby2, the lack of ID1 exon, CoRNR box ID1 (G…LEAIIRKALM), and CoRNR box ID2 (G…LAQHISEVI…K), which are essential for nuclear receptor binding to N-CoR2, significantly reduced the FRET signal. From these data, we assume that both interacting domains are important for the formation of a PPARγ/N-CoR2 complex. Furthermore, we observed that the deletion of only the ID1 motif itself (ID AA) decreased the binding capacity of the protein couple but not as efficiently as a complete lack of the ID1-containing exon of N-CoR2. Thus, it appears that some AA in the remaining ID1 exon are also important for stabilizing the protein-protein interaction or that the deletion of the exon mediates drastic changes in the quaternary structure of N-CoR2, which hampers the process of successful binding. As reported in the literature, our data indicate that the binding and the associated PPARγ - N-CoR2 protein interactions are strongly dependent on the N-CoR2 AA sequence, in which the interaction between this protein couples is mainly dictated by the ID1 CoRNR box motif. This aspect is also supported by the fluorescent microscopy analysis, which clearly showed a strong co-localization correlation only between PPARγ and the ID1 AA containing N-CoR2. However, where co-localization binding occurs, it appears to be with the same affinity as that during the flow cytometry-based FRET protein-protein interaction measurements, independently of the N-CoR2 AA modification.
Our cytometry-based FRET assay data, especially the outstanding role of ID1 observed during the interaction, were also supported and confirmed by studies of the mechanistic functionality of N-CoR2 WT-mRuby2 and N-CoR2 (ΔID1 exon)-mRuby2, using a PPARγ-dependent transactivation assay. Administration of the PPARγ agonist, rosiglitazone, led to an explicit PPARγ transactivation, whereas, in all cases, the administration of the PPARγ antagonist, GW9662, prevented the PPARγ transactivation, independently of the N‑CoR2 AA sequence modification. The analyses were done in HEK293T cells and therefore, control cells expressing only Clover-PPARγ without N-CoR2-mRuby2 inherit only the endogenous N-CoR2 with the missing ID1 exon, which results in nearly the same transactivation levels as in cells overexpressing N-CoR2 (ΔID1 exon)-mRuby2. In spite of the repressor nature of N-CoR2, we failed to detect a repression of transactivation in comparison to the control PPARγ alone. A possible explanation for this observation could be that the N-CoR2 constructs we utilized lack most of their regular N-Terminus (ΔRD1, SANT, ΔRD2), so that their AA sequence starts with RD3. As a result, N-CoR2 cannot interact to a full extent with other proteins of the normal repressor complex, like SIN3, the G-protein pathway suppressor (GPS2), transducin (beta)-like 1X-linked (TBL1)/transducin (beta)-like 1X-linked receptor 1 (TBLR1) and histone deacetylase 3 (HDAC3) and therefore, the repression of transcription is lost [89, 90]. Nevertheless, with this assay, we could show that the ID1 domain of N-CoR2 enhances the functional outcome of the PPARγ - N-CoR2 interaction, by leading to a strong transactivation rate in rosiglitazone treated cells. This conclusion is well supported by the significant FRET reduction of Clover-PPARγ1 + N-CoR2 (ΔID1 exon)-mRuby2 and also by the absent co-localization of this protein couple in living HEK293T cells. Further detailed studies are needed to elucidate mechanistic details.
We finally proved that our flow cytometry-based FRET system can also be used in cells which can barely be transfected/transduced compared to HEK293T cells. Thus, in murine J774A.1 macrophages, the flow cytometry-based FRET assay revealed similar results compared to HEK293T cells, although the number of double positive cells was significantly lower. These data support the notion that our system is also suitable to determine protein-protein interactions in cells which are more difficult to handle.
NHR such as PPARγ1 are directly involved in many disease pathways. Most of them have been the subject of screening assays to detect protein-protein interactions and to identify compounds for the characterization of co-factor recruitment and selective modulators. For practical reasons, such efforts at drug development have mainly relied on cell-free receptor homo- or heterodimers on DNA [91]. Moreover, the major readout for compound screening assays has been co-regulator recruitment. These studies have been guided by the assumption that different NHR ligands can impart their gene-selective actions strictly through their differential impact on co-regulator affinities. Given that co-regulator availability differs in cell types, the altered affinities are thought to give rise to selective modulator properties in these ligands.
Conclusions
In this report, we clearly show that our innovative, systematically improved, cytometry-based FRET assay provides detailed, reliable, reproducible data and allows the molecular identification and characterization of direct protein-protein interactions of the human nuclear factor PPARγ1 with its co-factors in living cells as well as permitting identification of novel protein interaction partners. The setting opens the possibility of transfer to other NHR to identify their binding characteristics to co-activators and co-repressors also in an HTS approach. Thus, this assay is expected to contribute to the identification of a variety of novel therapeutic targets for treatment of human diseases.
Abbreviations
A: adenine; AA: amino acid; ADA2: adenosine deaminase 2; CBP: cyclic adenosine monophosphate response element binding protein; CCD: charge-coupled device; CFP: cyan fluorescent protein; CLSM: confocal laser scanning microscope; CO2: carbon dioxide; DMEM: Dulbecco's Modified Eagle's Medium; CoRNR: co-repressor nuclear receptor; DMSO: dimethyl sulfoxide; DNA: deoxyribonucleic acid; FCS: fetal calf serum; FLIM: fluorescence lifetime imaging microscopy; FRET: Förster´s resonance energy transfer; FSC: forward scatter; GFP: green fluorescent proteins; GPS2: G-protein pathway suppressor; GW9662: 2-chloro-5-nitrobenzanilide; HDAC3: histone deacetylase 3; HEK293T: human embryonic kidney 293 cells stably expressing the large T antigen of simian vacuolating virus 40; HTS: high-throughput-screening; ID: interaction domain; LBD: ligand binding domain; MFI: median fluorescence intensity; N-CoR2: nuclear receptor co-repressor 2; NHR: nuclear hormone receptor; OFP: orange fluorescent protein; PBS: phosphate-buffered saline; PCC: Pearson´s correlation coefficient; PCR: polymerase chain reaction; PE: phycoerythrin; PFA: paraformaldehyde; PPARγ1: peroxisome proliferator-activated receptor gamma 1; PPREs: PPARγ response elements; RD: regulation domain; RFP: red fluorescent protein; RPMI: Roswell Park Memorial Institute; RXRα: retinoid X receptor alpha; SANT: SWI3 - ADA2 - N-CoR - TFIIIB; SD: standard deviation; SDS: sodium dodecyl sulfate; SMRT: silencing mediator of retinoic acid and thyroid hormone receptor; SRC1: steroid receptor co-activator 1; SSC: side scatter; T: thymine; TBL1: transducin (beta)-like 1X-linked; TBLR1: transducin (beta)-like 1X-linked receptor 1; TCSPC: time-correlated single photon counting; TFIIIB: transcription factor IIIB; TR: time-resolved; YFP: yellow fluorescent protein.
Supplementary Material
Supplementary figures and tables.
Acknowledgements
We thank the members of the Branch for Translational Medicine and Pharmacology TMP of the Fraunhofer Institute for Molecular Biology and Applied Ecology IME, the Institute of Biochemistry I - Pathobiochemistry of the Goethe University Frankfurt and the Department of Physics of the Humboldt University Berlin for their technical help and support. This research was supported by the research funding program Landes-Offensive zur Entwicklung wissenschaftlich-ökonomischer Exzellenz (LOEWE) of the State of Hesse, Germany, the Else Kröner-Fresenius foundation training program “Translational Research Innovation - Pharma” (TRIP), the Collaborative Research Center 815 “Redox-Regulation” (SFB815) TP 03 and TP A08 and German Research Foundation (DFG) KN493/13-1 and the Fraunhofer Cluster of Excellence Immune-mediated Diseases CIMD.
Author Contributions
V.T., A.v.K., A.P., E.E., S.H., M.S. and T.K. conceived the principal question and designed the experiments. V.T., A.v.K., A.P., M.S., M.J.P. and T.K. wrote the manuscript. V.T., A.v.K., L.K., A.S., A.P., E.E., S.G., S.H., T.B. and T.K. conducted the experiments. V.T., A.v.K., A.P., E.E., S.H., T.B., G.V., L.U.-N. and T.K. analyzed the data. V.T., A.v.K., A.P., E.E., S.H., T.B., B.B., B.R., M.J.P., G.V., L.U.-N. and T.K. contributed reagents/materials/analysis tools.
Competing Interests
The authors have declared that no competing interest exists.
References
1. Förster T. Zwischenmolekulare Energiewanderung und Fluoreszenz. Ann Phys (Leipzig). 1948;2:55-75
2. Förster T. Energiewanderung und Fluoreszenz. Naturwissenschaften. 1946;6:166-176
3. Stryer L. Fluorescence energy transfer as a spectroscopic ruler. Annu Rev Biochem. 1978;47:819-846
4. Selvin PR. The renaissance of fluorescence resonance energy transfer. Nat Struct Biol. 2000;7:730-734
5. Bastiaens PI, Squire A. Fluorescence lifetime imaging microscopy. Trends Cell Biol. 1999;9:48-52
6. Wallrabe H, Periasamy A. Imaging protein molecules using FRET and FLIM microscopy. Curr Opin Biotechnol. 2005;16:19-27
7. Lleres D, Swift S, Lamond AI. Detecting protein-protein interactions in vivo with FRET using multiphoton fluorescence lifetime imaging microscopy (FLIM). Curr Protoc Cytom. 2007 Chapter 12: Unit12 10
8. Banning C, Votteler J, Hoffmann D. et al. A flow cytometry-based FRET assay to identify and analyse protein-protein interactions in living cells. PLoS One. 2010;5:e9344
9. Hagen N, Bayer K, Rosch K, Schindler M. The intraviral protein interaction network of hepatitis C virus. Mol Cell Proteomics. 2014;13:1676-1689
10. Horvath GL, Langhoff P, Latz E. Toll-like receptor interactions measured by microscopic and flow cytometric FRET. McCoy CE, Ed. Toll-Like-Receptors, 2nd ed, New York, USA: Springer Nature. 2016:41-64
11. Ujlaky-Nagy L, Nagy P, Szöllősi J, Vereb G. Flow Cytometric FRET Analysis of Protein Interactions. Hawley TS, Hawley RG, Ed. Flow Cytometry Protocols, 4th ed, New York, USA: Springer Nature. 2018:393-420
12. Larbret F, Dubois N, Brau F. et al. Technical Advance: Actin CytoFRET, a novel FRET flow cytometry method for detection of actin dynamics in resting and activated T cell. Journal of Leukocyte Biology. 2013;94:531-539
13. Schaufele F. Studying Nuclear Receptor Complexes in the Cellular Environment. Methods Mol Biol. 2016;1443:79-104
14. Lam A J, St-Pierre F, Gong Y. et al. Improving FRET dynamic range with bright green and red fluorescent proteins. Nat Methods. 2012;9:1005-1012
15. Nickkho-Amiry M, McVey R, Holland C. Peroxisome proliferator-activated receptors modulate proliferation and angiogenesis in human endometrial carcinoma. Mol Cancer Res. 2012;10:441-453
16. Choi JM, Bothwell AL. The nuclear receptor PPARs as important regulators of T-cell functions and autoimmune diseases. Mol Cells. 2012;33:217-222
17. Clark RB. The role of PPARs in inflammation and immunity. J Leukoc Biol. 2002;71:388-400
18. Issemann I, Green S. Activation of a member of the steroid hormone receptor superfamily by peroxisome proliferators. Nature. 1990;347:645-650
19. Evans RM, Barish GD, Wang YX. PPARs and the complex journey to obesity. Nat Med. 2004;10:355-361
20. Tyagi S, Gupta P, Saini AS, Kaushal C, Sharma S. The peroxisome proliferator-activated receptor. J Adv Pharm Technol Res. 2011;2:236-240
21. Tontonoz P, Graves RA, Budavari AI. et al. Adipocyte-specific transcription factor ARF6 is a heterodimeric complex of two nuclear hormone receptors, PPAR gamma and RXR alpha. Nucleic Acids Res. 1994;22:5628-5634
22. Tontonoz P, Hu E, Graves RA, Budavari AI, Spiegelman BM. mPPAR gamma 2. Genes Dev. 1994;8:1224-1234
23. Tontonoz P, Hu E, Spiegelman BM. Stimulation of adipogenesis in fibroblasts by PPAR gamma 2, a lipid-activated transcription factor. Cell. 1994;79:1147-1156
24. Chawla A, Schwarz EJ, Dimaculangan DD, Lazar MA. Peroxisome proliferator-activated receptor (PPAR) gamma. Endocrinology. 1994;135:798-800
25. Chawla A, Lazar MA. Peroxisome proliferator and retinoid signaling pathways co-regulate preadipocyte phenotype and survival. Proc Natl Acad Sci U S A. 1994;91:1786-1790
26. Forman B M, Tontonoz P, Chen J, Brun RP, Spiegelman BM, Evans RM. 15-Deoxy-delta 12, 14-prostaglandin J2 is a ligand for the adipocyte determination factor PPAR gamma. Cell. 1995;83:803-812
27. Tontonoz P, Hu E, Devine J, Beale EG, Spiegelman BM. PPAR gamma 2 regulates adipose expression of the phosphoenolpyruvate carboxykinase gene. Mol Cell Biol. 1995;15:351-357
28. Tontonoz P, Hu E, Spiegelman BM. Regulation of adipocyte gene expression and differentiation by peroxisome proliferator activated receptor gamma. Curr Opin Genet Dev. 1995;5:571-576
29. Kliewer SA, Lenhard JM, Willson TM, Patel I, Morris DC, Lehmann JM. A prostaglandin J2 metabolite binds peroxisome proliferator-activated receptor gamma and promotes adipocyte differentiation. Cell. 1995;83:813-819
30. Willson TM, Brown PJ, Sternbach D, Henke BR. The PPARs. J Med Chem. 2000;43:527-550
31. Wang C, Fu M, D'Amico M. et al. Inhibition of cellular proliferation through IkappaB kinase-independent and peroxisome proliferator-activated receptor gamma-dependent repression of cyclin D1. Mol Cell Biol. 2001;21:3057-3070
32. Mukherjee R, Jow L, Croston GE, Paterniti JR Jr. Identification, characterization, and tissue distribution of human peroxisome proliferator-activated receptor (PPAR) isoforms PPARgamma2 versus PPARgamma1 and activation with retinoid X receptor agonists and antagonists. J Biol Chem. 1997;272:8071-8076
33. Fajas L, Auboeuf D, Raspe E. et al. The organization, promoter analysis, and expression of the human PPARgamma gene. J Biol Chem. 1997;272:18779-18789
34. Yang W, Rachez C, Freedman LP. Discrete roles for peroxisome proliferator-activated receptor gamma and retinoid X receptor in recruiting nuclear receptor coactivators. Mol Cell Biol. 2000;20:8008-8017
35. Chawla A, Repa JJ, Evans RM, Mangelsdorf DJ. Nuclear receptors and lipid physiology. Science. 2001;294:1866-1870
36. Kliewer SA, Xu HE, Lambert MH, Willson TM. Peroxisome proliferator-activated receptors. Recent Prog Horm Res. 2001;56:239-263
37. Nolte RT, Wisely GB, Westin S. et al. Ligand binding and co-activator assembly of the peroxisome proliferator-activated receptor-gamma. Nature. 1998;395:137-143
38. Spiegelman BM, Heinrich R. Biological control through regulated transcriptional coactivators. Cell. 2004;119:157-167
39. Viswakarma N, Jia Y, Bai L. et al. Coactivators in PPAR-Regulated Gene Expression. PPAR Res. 2010. 2010
40. Sucov HM, Evans RM. Retinoic acid and retinoic acid receptors in development. Mol Neurobiol. 1995;10:169-184
41. Chen F, Wang M, O'Connor JP, He M, Tripathi T, Harrison LE. Phosphorylation of PPARgamma via active ERK1/2 leads to its physical association with p65 and inhibition of NF-kappabeta. J Cell Biochem. 2003;90:732-744
42. Wang P, Anderson PO, Chen S, Paulsson KM, Sjogren HO, Li S. Inhibition of the transcription factors AP-1 and NF-kappaB in CD4 T cells by peroxisome proliferator-activated receptor gamma ligands. Int Immunopharmacol. 2001;1:803-812
43. Yang XY, Wang LH, Chen T. et al. Activation of human T lymphocytes is inhibited by peroxisome proliferator-activated receptor gamma (PPARgamma) agonists. PPARgamma co-association with transcription factor NFAT. J Biol Chem. 2000;275:4541-4544
44. Pascual G, Glass CK. Nuclear receptors versus inflammation. Trends Endocrinol Metab. 2006;17:321-327
45. Ricote M, Glass CK. PPARs and molecular mechanisms of transrepression. Biochim Biophys Acta. 2007;1771:926-935
46. McKenna NJ, O'Malley BW. Minireview. Endocrinology. 2002;143:2461-2465
47. McKenna NJ, O'Malley BW. Combinatorial control of gene expression by nuclear receptors and coregulators. Cell. 2002;108:465-474
48. Chambon PA. decade of molecular biology of retinoic acid receptors. FASEB J. 1996;10:940-954
49. Chen JD, Evans RM. A transcriptional co-repressor that interacts with nuclear hormone receptors. Nature. 1995;377:454-457
50. Horlein AJ, Naar AM, Heinzel T. et al. Ligand-independent repression by the thyroid hormone receptor mediated by a nuclear receptor co-repressor. Nature. 1995;377:397-404
51. Hermanson O, Jepsen K, Rosenfeld MG. N-CoR controls differentiation of neural stem cells into astrocytes. Nature. 2002;419:934-939
52. Jepsen K, Rosenfeld MG. Biological roles and mechanistic actions of co-repressor complexes. J Cell Sci. 2002;115:689-698
53. Malartre M, Short S, Sharpe C. Alternative splicing generates multiple SMRT transcripts encoding conserved repressor domains linked to variable transcription factor interaction domains. Nucleic Acids Res. 2004;32:4676-4686
54. Cohen RN, Brzostek S, Kim B, Chorev M, Wondisford FE, Hollenberg AN. The specificity of interactions between nuclear hormone receptors and corepressors is mediated by distinct amino acid sequences within the interacting domains. Mol Endocrinol. 2001;15:1049-1061
55. Makowski A, Brzostek S, Cohen RN, Hollenberg AN. Determination of nuclear receptor corepressor interactions with the thyroid hormone receptor. Mol Endocrinol. 2003;17:273-286
56. Sande S, Privalsky ML. Identification of TRACs (T3 receptor-associating cofactors), a family of cofactors that associate with, and modulate the activity of, nuclear hormone receptors. Mol Endocrinol. 1996;10:813-825
57. Zamir I, Harding HP, Atkins GB. et al. A nuclear hormone receptor corepressor mediates transcriptional silencing by receptors with distinct repression domains. Mol Cell Biol. 1996;16:5458-5465
58. Glass C K, Rosenfeld MG. The coregulator exchange in transcriptional functions of nuclear receptors. Genes Dev. 2000;14:121-141
59. Jepsen K, Hermanson O, Onami TM. et al. Combinatorial roles of the nuclear receptor corepressor in transcription and development. Cell. 2000;102:753-763
60. Wen YD, Perissi V, Staszewski LM. et al. The histone deacetylase-3 complex contains nuclear receptor corepressors. Proc Natl Acad Sci U S A. 2000;97:7202-7207
61. Westin S, Rosenfeld M G, Glass CK. Nuclear receptor coactivators. Adv Pharmacol. 2000;47:89-112
62. Hu E, Tontonoz P, Spiegelman BM. Transdifferentiation of myoblasts by the adipogenic transcription factors PPAR gamma and C/EBP alpha. Proc Natl Acad Sci U S A. 1995;92:9856-9860
63. Reginato MJ, Bailey ST, Krakow SL. et al. A potent antidiabetic thiazolidinedione with unique peroxisome proliferator-activated receptor gamma-activating properties. J Biol Chem. 1998;273:32679-32684
64. Reginato MJ, Krakow SL, Bailey ST, Lazar MA. Prostaglandins promote and block adipogenesis through opposing effects on peroxisome proliferator-activated receptor gamma. J Biol Chem. 1998;273:1855-1858
65. Shao D, Rangwala SM, Bailey ST, Krakow SL, Reginato MJ, Lazar MA. Interdomain communication regulating ligand binding by PPAR-gamma. Nature. 1998;396:377-380
66. Zamir I, Dawson J, Lavinsky RM, Glass CK, Rosenfeld MG, Lazar M. A Cloning and characterization of a corepressor and potential component of the nuclear hormone receptor repression complex. Proc Natl Acad Sci U S A. 1997;94:14400-14405
67. Zamir I, Zhang J, Lazar M. A Stoichiometric and steric principles governing repression by nuclear hormone receptors. Genes Dev. 1997;11:835-846
68. Leesnitzer LM, Parks DJ, Bledsoe RK. et al. Functional consequences of cysteine modification in the ligand binding sites of peroxisome proliferator activated receptors by GW9662. Biochemistry. 2002;41:6640-6650
69. Graham FL, Smiley J, Russell WC, Nairn R. Characteristics of a human cell line transformed by DNA from human adenovirus type 5. The Journal of general virology. 1977;36:59-74
70. Ralph P, Nakoinz I. Phagocytosis and cytolysis by a macrophage tumour and its cloned cell line. Nature. 1975;257:393-394
71. Knethen A von, Soller M, Tzieply N. et al. PPARgamma1 attenuates cytosol to membrane translocation of PKCalpha to desensitize monocytes/macrophages. J Cell Biol. 2007;176:681-694
72. Takano Y, Adachi S, Okuno M. et al. The RING finger protein, RNF8, interacts with retinoid X receptor alpha and enhances its transcription-stimulating activity. J Biol Chem. 2004;279:18926-18934
73. He L, Olson DP, Wu X, Karpova TS, McNally JG, Lipsky PE. A flow cytometric method to detect protein-protein interaction in living cells by directly visualizing donor fluorophore quenching during CFP->YFP fluorescence resonance energy transfer (FRET). Cytometry A. 2003;55:71-85
74. You X, Nguyen AW, Jabaiah A, Sheff MA, Thorn KS, Daugherty PS. Intracellular protein interaction mapping with FRET hybrids. Proc Natl Acad Sci U S A. 2006;103:18458-18463
75. Miyawaki A, Tsien RY. Monitoring protein conformations and interactions by fluorescence resonance energy transfer between mutants of green fluorescent protein. Methods Enzymol. 2000;327:472-500
76. Seward HE, Basran J, Denton R, Pfuhl M, Muskett FW, Bagshaw CR. Halide and proton binding kinetics of yellow fluorescent protein variants. Biochemistry. 2013;52:2482-2491
77. Dixit R, Cyr R. Cell damage and reactive oxygen species production induced by fluorescence microscopy. Plant J. 2003;36:280-290
78. Shaner NC, Lin MZ, McKeown MR. et al. Improving the photostability of bright monomeric orange and red fluorescent proteins. Nat Methods. 2008;5:545-551
79. Tsutsui H, Karasawa S, Okamura Y, Miyawaki A. Improving membrane voltage measurements using FRET with new fluorescent proteins. Nat Methods. 2008;5:683-685
80. Raarup MK, Fjorback AW, Jensen SM. et al. Enhanced yellow fluorescent protein photoconversion to a cyan fluorescent protein-like species is sensitive to thermal and diffusion conditions. J Biomed Opt. 2009;14:34039
81. Malkani N, Schmid JA. Some secrets of fluorescent proteins. PLoS One. 2011;6:e18586
82. Muller SM, Galliardt H, Schneider J, Barisas BG, Seidel T. Quantification of Forster resonance energy transfer by monitoring sensitized emission in living plant cells. Front Plant Sci. 2013;4:413
83. Patterson GH, Piston DW, Barisas BG. Forster distances between green fluorescent protein pairs. Anal Biochem. 2000;284:438-440
84. Cohen RN. Nuclear receptor corepressors and PPARgamma. Nucl Recept Signal. 2006;4:e003
85. Lavinsky RM, Jepsen K, Heinzel T. et al. Diverse signaling pathways modulate nuclear receptor recruitment of N-CoR and SMRT complexes. Proc Natl Acad Sci U S A. 1998;95:2920-2925
86. Gurnell M, Wentworth JM, Agostini M. et al. A dominant-negative peroxisome proliferator-activated receptor gamma (PPARgamma) mutant is a constitutive repressor and inhibits PPARgamma-mediated adipogenesis. J Biol Chem. 2000;275:5754-5759
87. Willson TM, Cobb JE, Cowan DJ. et al. The structure-activity relationship between peroxisome proliferator-activated receptor gamma agonism and the antihyperglycemic activity of thiazolidinediones. J Med Chem. 1996;39:665-668
88. Sutanto MM, Symons MS, Cohen RN. SMRT recruitment by PPARgamma is mediated by specific residues located in its carboxy-terminal interacting domain. Mol Cell Endocrinol. 2006;259:43-49
89. Yoon HG, Chan DW, Huang ZQ. et al. Purification and functional characterization of the human N-CoR complex. EMBO J. 2003;22:1336-1346
90. Zhang J, Kalkum M, Chait BT, Roeder RG. The N-CoR-HDAC3 nuclear receptor corepressor complex inhibits the JNK pathway through the integral subunit GPS2. Mol Cell. 2002;9:611-623
91. Chandra V, Huang P, Hamuro Y. et al. Structure of the intact PPAR-gamma-RXR- nuclear receptor complex on DNA. Nature. 2008;456:350-356
Author contact
![]() Corresponding author: Tilo Knape, Branch for Translational Medicine and Pharmacology TMP, Fraunhofer Institute for Molecular Biology and Applied Ecology IME, Theodor-Stern-Kai 7, 60596 Frankfurt/Main, Phone: +49 69 8700 25072 Email: tilo.knapefraunhofer.de
Corresponding author: Tilo Knape, Branch for Translational Medicine and Pharmacology TMP, Fraunhofer Institute for Molecular Biology and Applied Ecology IME, Theodor-Stern-Kai 7, 60596 Frankfurt/Main, Phone: +49 69 8700 25072 Email: tilo.knapefraunhofer.de