Impact Factor
- Issue 14; 2026
- Issue 13; 2026
- Issue 12; 2026
- Issue 11; 2026
- Issue 10; 2026
- Volume 16; 2026
- Advance Articles
- Past Issues
- Cover Images
- Cover Suggestion
- Index & Coverage
- Special Issues
Introduction
Experimental section
Results and Discussion
Conclusions
Supplementary Material
Acknowledgements
References
International Journal of Biological Sciences
International Journal of Medical Sciences
 Global reach, higher impact

Theranostics 2019; 9(19):5672-5680. doi:10.7150/thno.33867 This issue Cite
Research Paper
Visualizing Autophagic Flux during Endothelial Injury with a Pathway-Inspired Tandem-Reaction Based Fluorogenic Probe
Yu Lei1*, Wenming Ren2*, Cheng-Kun Wang1, Rong-Rong Tao1, Huai-Jiang Xiang1, Li-Li Feng3, Yin-Ping Gao1, Quan Jiang1, Xin Li1 ![]() , Youhong Hu2
, Youhong Hu2 ![]() , Feng Han1,3
, Feng Han1,3 ![]()
1. College of Pharmaceutical Sciences, Zhejiang University, Hangzhou 310058, China
2. State Key Laboratory of Drug Research, Shanghai Institute of Materia Medica, Chinese Academy of Sciences, Shanghai 201203, China
3. School of Pharmacy, Nanjing Medical University, Nanjing 211166, China
*These authors contributed equally
Received 2019-2-6; Accepted 2019-6-7; Published 2019-8-1
Abstract

Autophagy is a dynamic and complicated catabolic process. Imaging autophagic flux can clearly advance knowledge of its pathophysiology significance. While the most common way autophagy is imaged relies on fluorescent protein-based probes, this method requires substantial genetic manipulation that severely restricts the application. Small fluorescent probes capable of tracking autophagic flux with good spatiotemporal resolution are highly demanable.
Methods: In this study, we developed a small-molecule fluorogenic probe (AFG-1) that facilitates real-time imaging of autophagic flux in both intact cells and live mice. AFG-1 is inspired by the cascading nitrosative and acidic microenvironments evolving during autophagy. It operates over two sequential steps. In the first step, AFG-1 responds to the up-regulated peroxynitrite at the initiation of autophagy by its diphenylamino group being oxidatively dearylated to yield a daughter probe. In the second step, the daughter probe responds to the acidic autolysosomes at the late stage of autophagy by being protonated.
Results: This pathway-dependent mechanism has been confirmed first by sequentially sensing ONOO- and acid in aqueous solution, and then by imaging autophagic flux in live cells. Furthermore, AFG-1 has been successfully applied to visualize autophagic flux in real-time in live mice following brain ischemic injury, justifying its robustness.
Conclusion: Due to the specificity, easy operation, and the dynamic information yielded, AFG-1 should serve as a potential tool to explore the roles of autophagy under various pathological settings.
Keywords: Fluorescent imaging, fluorescent probe, autophagy, endothelial injury
Introduction
Autophagy is a homeostatic intracellular degradation process that serves to control protein quality [1-3]. Dysregulation of autophagy can lead to cellular dysfunction and even cell death. Despite evidence indicating that autophagy is linked to a wide variety of prominent diseases including cancer [4], stroke [5], and neurodegeneration [6], very little is known about the cellular pathologic mechanisms [7]. To assess the translational relevance in treating autophagy-related diseases, it is vital to have a reliable assay to detect autophagic flux under pathological contexts. Immunostaining assays have been widely used to detect autophagy, but they are limited to fixed tissues or homogenates and cannot be used in live cells [8]. Electron microscopy is another widely used tool for autophagy detection, but it needs considerable specialized expertise and precludes functional studies [9]. Optical imaging of autophagy is not only technically more accessible, but may facilitate functional studies. Optical imaging has therefore become the method of choice in autophagy study. Currently, optical imaging of autophagy is usually realized by the expression of fluorescent fusion proteins [10]. However, this requires genetic manipulation and is technically highly demanding. Moreover, the incorporation of the non-native big fusions may affect the normal cellular biological process. On the contrary, bio-imaging employing small-molecule probes is not only technically more easily accessible, but poses little interference with normal biological process. Small-molecule probes are therefore more desirable as imagine tools. Actually, several small-molecule probes have been reported to facilitate autophagy imaging. For example, markers of acidic organelles have been used to visualize autophagy due to the acidic feature of autolysosomes [11-13]. But these markers are only limited to detect the late stage of autophagy. Autophagy may also be visualized employing probes targeting reactive oxygen species (ROS), as ROS overproduction is involved in the autophagic process [14]. Nevertheless, due to the extensive involvement of ROS in a wide range of pathophysiology processes other than autophagy, this method is inherently limited by its compromised specificity. Therefore, more reliable probes with improved specificity and sensitivity, and capable of tracing the dynamic autophagic flux in live specimens remain highly demanding.
Herein, we report a small-molecule fluorogenic probe for visualizing the autophagic flux both in vitro and in vivo. The probe is designed based on the characteristic of the autophagic pathway. In the early stage of autophagy, its fluorescence is switched on by the up-regulated peroxynitrite via oxidative dearylation, while in the late stage of autophagy, the daughter probe is protonated by the surrounding acidity to induce a further enhancement of the fluorescence intensity. This pathway-dependent design rationale has been validated by the reliability of probe AFG-1 to record the autophagic flux during endothelial injury in both live cells and mice with high spatiotemporal resolution.
Experimental section
Probe synthesis and characterization
These procedures and details are included in the Supplemental Information.
Cell culture
EA.hy926 cell line was used in this study. Cells were cultured in DMEM culture medium with 10% FBS in the 37°C incubator containing 5% CO2 and certain humidity. To induce autophagy or to inhibit autophagy, cells were exposed to HBSS, HBSS with 3-MA (1 mM), or HBSS with Bafilomycin A1 (100 nM). Cells without treatment served as the control.
Confocal fluorescence staining and analysis
The RFP-LC3 plasmid was transfected into EA.hy926 endothelial cells for 48 h before the cells were cultured on glass cover slips overnight. Cells were then treated with HBSS for 3.5 h. After that, the media was changed to fresh HBSS containing AFG-1 (50 nM) and a further incubation of 30 min was allowed. Cells were then fixed with 4% PFA. Nuclei were stained with 4', 6-diamidino-2-phenylindole (DAPI, Sigma). Intracellular probe fluorescence was visualized by confocal microscopy (Nikon A1R) and intensity was analyzed using Image J software (NIH, Bethesda, MD, USA).
For time-lapse confocal imaging of live cells, endothelial cells were transfected with RFP-LC3 plasmid and then cultured on glass-bottom 6-well plates overnight. After cells were incubated with AFG-1 (50 nM) at 37 °C for 30 min, the dynamic change of AFG-1 and LC3 fluorescence with or without HBSS treatment was captured every minute by time-lapse confocal microscope for 1 h.
Animals and Adenovirus brain injection
Adult (2-3 months old) male C57BL/6 mice were used and were housed on a 12 h light/dark cycle at a constant temperature of 22 ± 1 °C with 40-60% humidity. All animal studies were approved by the Committees for Animal Experiments of Zhejiang University in China and conform to NIH guidelines (Guide for the Care and Use of Laboratory Animals. NIH publication no. 85-23, revised 1996). Adenovirus-RFP-LC3 was injected into the cortex of the mice. Photothrombosis ischemia model was performed 6 days post-injection.
Photothrombosis-induced focal ischemia in mice
Animals were anesthetized with chloral hydrate at a dosage of 400 mg/kg, then mounted on the stereotaxic apparatus. Body temperature was maintained with a heating pad. The thrombotic occlusion of the cortex vessels was induced by the photochemical reaction. An incision was made over the skull. Rose bengal (10 mg/mL solution in saline, Sigma Chemical Co, St Louis, Mo) was injected intraperitoneally (ip, 0.1 mL/10g) 5 min before laser illumination. For illumination, a fiber-optic bundle of a cold light source (Nikon, QXA 10504 LCD, 21V 150W) was used. The periosteum over the skull was removed completely and the cold light source was placed close to the skull. The brain was illuminated for 20 min through the exposed intact skull. Then the skin was sutured, and animals were kept in a heated recovery box until awake.
Open skull operation and probe incubation
At 24 h after the induction of photochemically induced thrombosis stroke, a craniotomy window was prepared in anesthetized mice. AFG-1 (0.05 μM) was dissolved in DMSO and diluted in artificial cerebrospinal fluid (CSF), and was slowly injected (2 µL/s × 3s, delay 30 s, total volume 0.54 µL) into cortex at a depth of 100-300 μm below the cortical surface by standard patch-clamp pipette. Then the craniotomy window was covered by a removable cover glass lid (diameter 6.0 mm). The space between the exposed brain surface and the cover glass was filled with 1.5% (w/v) low melting point agarose in an artificial CSF. A metal frame of diameter 10.0 mm with the cover glass lid was glued to the skull to cover the craniotomy window. A bolus of 5 mg/kg Texas Red dextran (70 kDa, Molecular Probes, Invitrogen, Carlsbad, California) in 0.9% NaCl was injected into the tail vein to map the brain vessels before two-photon laser scanning microscope (TPLSM) imaging.
Results and Discussion
Probe Design and Synthesis
To develop a probe capable of monitoring the autophagic flux with high specificity, we first focused our attention on the chemical basis of the autophagic process. Our previous results show that nitrosative stress induces autophagy in endothelial cells [15], which is in accord with other reports that up-regulated ROS induces autophagy [16]. Once autophagy is initiated, the newly formed autophagosomes become another major site for basal oxidative species generation [17]. After engulfing cytoplasmic materials and damaged organelles, autophagosomes fuse with lysosomes to form autolysosomes which are endowed with both acidic pH levels and hydrolases for cargo degradation. Therefore, the cascading emergence of oxidative species and acidic interstitium may be considered as a potential biomarker for autophagy. Fluorescent probes that can sequentially respond to autophagy-related oxidative species and acidic pH levels may have desirable specificity for monitoring the autophagic process as a whole.
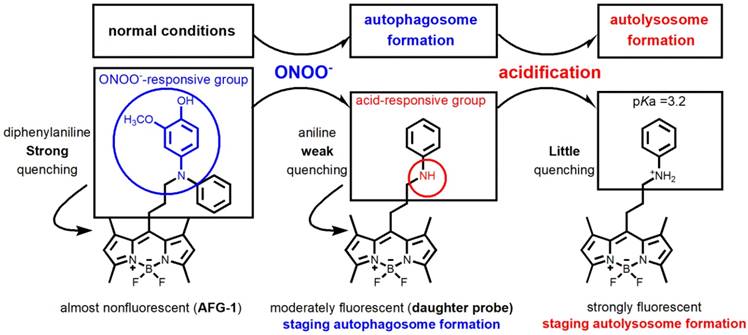
The nitrosative stress marker, peroxynitrite (ONOO-), has been implicated in the initiation of autophagy in endothelial cells and may work as the first target for imaging autophagy [15,18]. Among the various probes reported to image ROS [19-21], those that are designed based on the dearylation of electron-rich diphenylamines into mono-aryl-anilines attracted our interest due to their specifcity towards ONOO- [22-25]. Another merit of employing a diphenylamino group as the sensing trigger lies in its function as a good fluorescence quencher. It is reported that an unsubstituted diphenylamino group usually demonstrates a stronger fluorescence quenching effect than an unsubstituted phenylamino group [26]. While obviously, diphenylamines should show weaker basicity than their dearylated aniline products. Based on these facts, we reason that ONOO- -sensitive diphenylamines should work as an ideal sensing trigger for the autophagic flux. Tailored diphenylamines should respond to ONOO- at the early stage of autophagy via the oxidative dearylation reaction to yield the aniline that is more acidotropic. The resulting aniline should sequentially respond to the acidified microenvironment in the late stage of autophagy by being protonated (Figure 1). Based on these considerations, we designed probe AFG-1 by incorporating a well-tailored diphenylamino group into the BODIPY fluorophore which features two-photo excitation properties [27]. We reason that AFG-1 should be of no fluorescence due to the quenching effect of the diphenylamino group. However, at the early stage of autophagy, a burst of ONOO- should switch on its fluorescence by oxidative dearylation to transform AFG-1 into the daughter probe. As the autophagic process proceeds and autolysosomes are formed at the late stage of autophagy, the daughter probe is protonated and a further fluorescence enhancement should be observed (Figure 1). Facilitated by this two-step activation mechanism, AFG-1 may realize the specific observation of the autophagic flux in real time.
Design of probe AFG-1 inspired by the characteristic of the autophagic pathway. In the initial stage of autophagy, the up-regulated ONOO- oxidizes the electron-rich aryl group (blue) into a quinone which is then cleaved following hydrolysis, yielding the daughter probe accompanied by a fluorescent switch-on response. As autophagy proceeds and autolysosomes form, the increased acidity in the microenvironment protonates the daughter probe, causing a further fluorescence enhancement.
Probe AFG-1 was synthesized via reductive amination of 1, 3, 5, 7-tetramethyl-8- (3-oxopropyl) BODIPY with 2-methoxy-4-(phenylamino)phenol. Detailed procedures were described in the supporting information.
Fluorescence response of AFG-1 to the cascading ONOO- and acid in aqueous solution
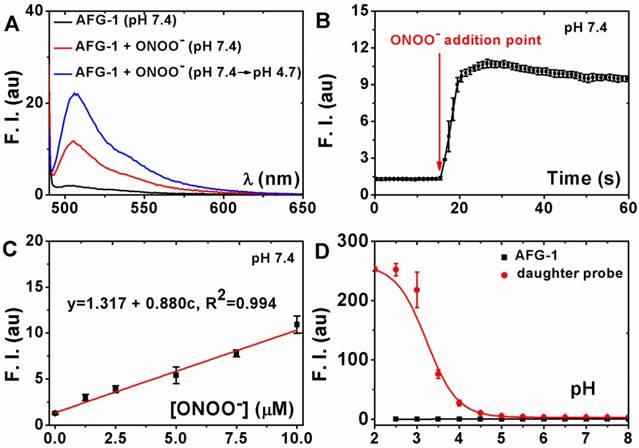
To evaluate the ability of probe AFG-1 to sense sequentially appearing ONOO- and acid, its fluorescent spectra under indicated conditions were recorded in phosphate buffer solution (PBS, 100 mM, with 10% ethonal). AFG-1 was almost non-fluorescent at pH 7.4 (Figure 2A). Treating AFG-1 with two equivalents of ONOO- induced a 7-fold fluorescent intensity enhancement (Figure 2A), suggesting the transformation of AFG-1 to the daughter probe in response to ONOO- stimulation. The production of the daughter probe was also confirmed by tracking the reaction by LCMS (Figure S1-S3). When this solution was acidified to pH 4.7, a further fluorescent intensity enhancement of 7-fold could be observed (Figure 2A), indicating the protonation of the daughter probe in response to acidification. These observations indicate that the fluorescence of AFG-1 can indeed be activated by a cascading stimulation of ONOO- oxidation and acid protonation. We also confirmed that the fluorogenic response of AFG-1 was selective towards ONOO- among a panel of reactive species commonly found in biological system (Figure S4).
Characterization of the fluorogenic response of AFG-1 to the subsequent treatment of ONOO- and acid. A) AFG-1 (5 μM) was first treated with ONOO- (10 μM) for 30 min and then the solution was acidified to pH 4.7 to record the fluorescent spectra. B) The emission intensity of AFG-1 (5 μM) at 505 nm was recorded as time lapsed. During the recording, ONOO- (10 μM) was quickly added to further record the response. C) AFG-1 (5 μM) was first treated with various concentrations of ONOO- and then the spectra were recorded. Data shown were the plot of the intensity at 505 nm against ONOO- concentration. D) Both AFG-1 and the daughter probe were dissolved in PBS (with 10% ethonal) of various pH values to record the fluorescence spectra. Data shown were the plot of their emission intensity at 505 nm against surrounding pH values. All data were obtained on a Cary Elipse spectrofluorimeter with slit widths to be 2.5 and 5 nm (A, B, C) or 2.5 and 2.5 nm (D) for excitement and emission respectively.
The fluorescence quenching mechanism was also studied by a Gaussian calculation on the frontier molecular orbital (FMO) of the excited fluorophore, the diphenylaniline, the aniline and the protonated aniline moiety. Data were shown in Figure S5, which showed an acceptor-excited intramolecular photoinduced electron transfer (a-PeT) mechanism for AFG-1 [28].
Sensitivity of the fluorogenic response of AFG-1 to ONOO- in aqueous solution
Having confirmed the tandem fluorescence-enhancement response of AFG-1 to ONOO- and acid, we then set out to test its sensitivity to ONOO-. For this purpose, the kinetic and stoichiometric characterization of the detection reaction was carried out in PBS (100 mM, with 10% ethonal). It turned out that the fluorescent intensity of AFG-1 (5 µM) increased fast after ONOO- (10 µM) treatment and plateaued in seconds (Figure 2B), suggesting that the detection reaction between AFG-1 and ONOO- favors a fast kinetics. Given this fast response of AFG-1 to ONOO-, we suspect that the probe should be capable to track the burst of biological ONOO- despite its elusive nature.
Next, AFG-1 (5 µM) was treated with various doses of ONOO- to check the ONOO- -dose dependent responsive profile. It turned out that the fluorescent intensity of AFG-1 increased in an ONOO- -dose dependent way. The correlation happens to be linear with ONOO- concentrations ranging from 0 to 10 μM (Figure 2C). Noteworthy, when AFG-1 (5 µM) was treated with a concentration of ONOO- higher than 20 μM, it resulted in a less potent fluorescent intensity enhancement (Figure S6, S7), suggesting that a large excess of ONOO- may destroy the daughter probe presumably by the nitration / nitrosation of the aniline nitrogen atom [29]. We hypothesize this as a desirable feature of AFG-1 to guarantee its specificity to autophagy - if nitrosative stress proceeds without initiating autophagy, the overproduced ONOO- would quench the fluorescence of the probe to avoid giving biased signals.
Sensitivity of the daughter probe towards acidification in aqueous solution
To test the sensitivity of the daughter probe towards acid surroundings, an acid titration experiment was carried out to determine its pKa. When the emission intensity of the daughter probe (at 505 nm) in PBS (100 mM, with 10% ethonal) of various pH values was plotted against the solution pH values, the pKa of the daughter probe was measured to be 3.2 (Figure 2D). We think this pKa should make the daughter probe sensitive enough to image the maturation from autophagosomes (neutral pH) to autolysosomes (with an acidic pH). It should be noted that probe AFG-1 alone is inert toward acidification (Figure 2D), further supporting the two-step activation mechanism of AFG-1 by the cascading autophagic process.
Monitoring autophagy in live endothelial cells
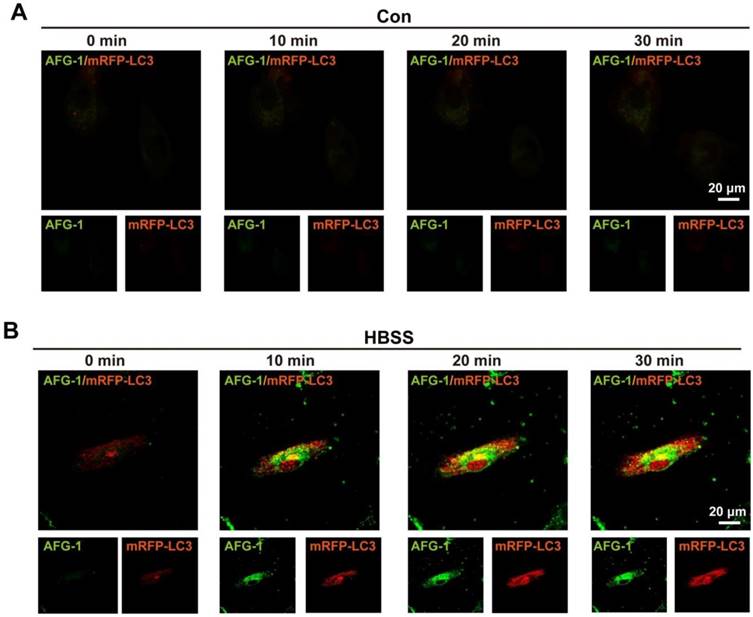
Having confirmed the tandem response of AFG-1 to the sequential treatment of ONOO- and acid in aqueous solution, we moved on to test its feasibility to image autophagy in live cells. For this purpose, endothelial cells were selected because the endothelium has been reported to be one of the major site of excessive autophagy [30]. AFG-1 was first tested to cause no effect on cell viability (Figure S8). Cells were then transfected with mRFP-LC3 as a positive control since fluorescent protein-tagged LC3 is a general marker for autophagosomes [31]. After subjecting the cells to HBSS-induced nutrient starvation to trigger on autophagy [32], the intracellular dynamic fluorescence change of AFG-1 in response to HBSS-treatment was recorded. As shown in Figure 3B, the intracellular AFG-1 fluorescence increased gradually following prolonged HBSS treatment and co-localized well with that of mRFP-LC3 (Pearson correlation coefficient, 0.433). While in contrast, no significant fluorescence intensity change was observed in control cells incubated under normal conditions (Figure 3A). This result highlights AFG-1 as a reliable probe with desirable sensitivity and specificity for tracing the autophagic process. Noteworthy, AFG-1 could still work well to track the autophagic process even after a prolonged HBSS treatment time of 12 h (Figure S10), highlighting the robustness of probe AFG-1 for long-term tracking of autophagy process.
Imaging autophagic flux in live endothelial cells. Data shown were representative confocal images of probe AFG-1 (green, λex 488 nm, λem 505-550 nm) and mRFP-LC3 puncta (red, λex 543 nm,λem 560-615 nm) in 1 min, 10 min, 20 min and 30 min time frame in control (A) and HBSS-treated endothelial cells (B). Scale bar: 20 μm.
Characterization of the pathway-dependent response of AFG-1 to the autophagic process in live cells
Having confirmed the feasibility of probe AFG-1 to image the autophagic process in live endothelial cells, we then moved on forward to characterize its autophagy pathway-dependent response. Cells were subjected to genetic or pharmacological manipulation to intervene in the autophagy pathway, and the effect of these interventions on intracellular AFG-1 fluorescence was recorded.
First, autophagy inhibition at early stage was conducted to examine its effect on the switch-on response of probe AFG-1. For this purpose, Atg5 was knocked down by siRNA to intervene autophagosome formation, as Atg5 is essential for autophagosome elongation [33]. It was observed that siRNA knockdown of Atg5 markedly attenuated starvation-induced increase of AFG-1 fluorescence (Figure 4A). Quantitative analysis of intracellular AFG-1 fluorescence showed a 6-fold intensity enhancement after starvation-stimulation compared with the non-starvation control group. However, this starvation-induced AFG-1 fluorescence attenuated significantly in Atg5-silenced cells (P<0.001, Figure 4B). This result demonstrates that inhibiting autophagosome formation would inhibit the fluorogenic response of probe AFG-1, suggesting the specificity of AFG-1 towards autophagy. Similar observations were obtained when cells were treated with 3-methyladenine (3-MA, 1 mM) to block autophagosome formation via inhibiting class III PI3K (Figure 4C) [10]. These results corroborated the specificity and sensitivity of AFG-1 for autophagosomes.
Imaging early and late stages of autophagy with AFG-1. A) Representative confocal images of AFG-1 and DAPI in endothelial cells under normal or starvation conditions. Inhibiting Atg5 with siRNA to block early stage autophagy resulted in weaker AFG-1 fluorescence compared with the non-inhibiting group. AFG-1 (50 nM) was incubated for 30 min. B) Quantitative analysis of AFG-1 fluorescence in a, N=3 (4 - 6 fields were taken), ***P<0.001 with one-way ANOVA compared with control group, ###P<0.001 with one-way ANOVA compared with HBSS-4 h group. C) Representative confocal images of AFG-1 and DAPI in endothelial cells under normal or starvation conditions. 3-MA (1 mM) significantly decreased AFG-1 fluorescence intensity. AFG-1 probe (50 nM) was incubated for 30 min, scale bar: 20 μm. D) Representative images of AFG-1 and mRFP-LC3 puncta in EA.hy926 cells under normal or starvation conditions. Bafilomycin A1 (100 nM) treatment increased mRFP-LC3 fluorescence while decreased AFG-1 fluorescence as a result of autolysosome-inhibition. Scale bar: 10 μm. AFG-1 fluorescence was recorded with λex 488 nm, λem 505-550 nm (green). DAPI fluorescence was recorded with λex 405 nm, λem 420-480 nm (blue). mRFP fluorescence was recorded with λex 543 nm, λem 560-615 nm (red).
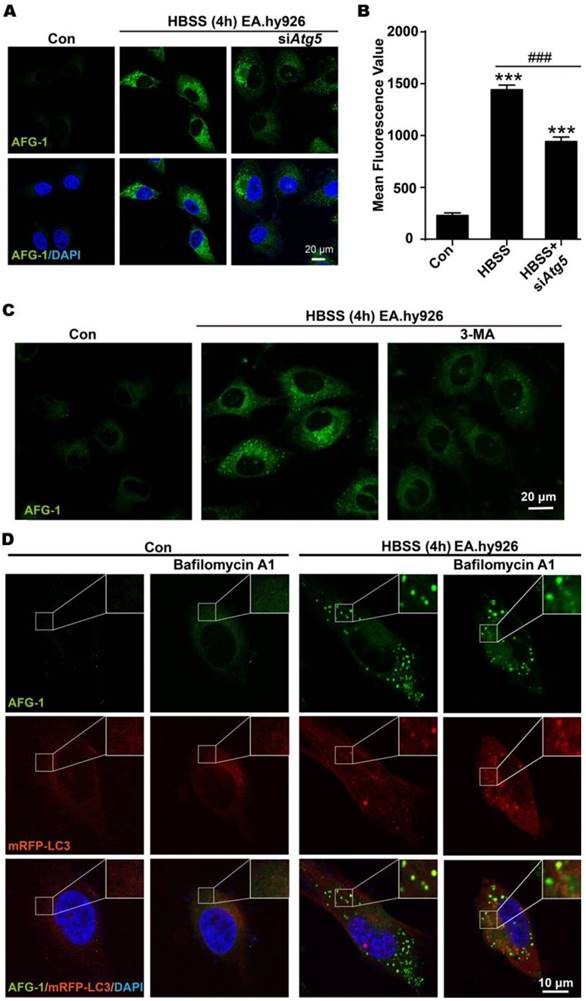
Then, late-stage autophagy was inhibited by treating cells with Bafilomycin A1 to block fusion between autophagosomes and lysosomes [10]. As shown in Figure 4D, HBSS treatment induced the fluorescence switch on of AFG-1, which colocalized well with mRFP-LC3 (Pearson correlation coefficient, 0.74). Inhibiting autolysosome formation with bafilomycin A1 (100 nM) led to the elevation of mRFP-LC3 fluorescence level. While intracellular AFG-1 fluorescence was found less intensified compared with the non-Bafilomycin A1 treatment group, manifesting the blockage of the protonation process of the probe, which is in agreement with Bafilomycin A1-induced fusion blockage of autophagosomes with lysosomes. Moreover, the colocalization of AFG-1 and mRFP-LC3 was decreased in the Bafilomycin A1 treatment group as shown by the decreased Pearson correlation coefficient of 0.51. All these observations agree well with the microenvironment features of autophagy, and further support the AFG-1 probe design rationale.
In vivo real-time imaging of autophagy in living mice after brain ischemia
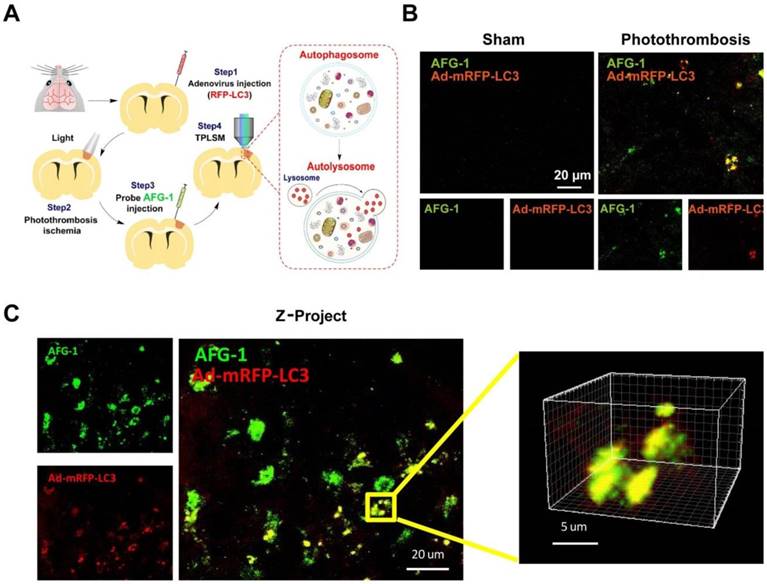
Having validated the capability of AFG-1 to track the autophagic flux in vitro, we next set out to assess its performance in live mice. First, adenovirus carrying mRFP-LC3 was generated to work as a positive control to visualize autophagic vacuoles in neurovascular components in the brain. One week after adenovirus vector (5 μl, titer 5.0 × 10⁶ vector genomes/ml) injection into the brain cortex, the mice were investigated by two-photon microscopy (FV1000MPE2, Olympus) with the thin skull method as described previously [23, 34]. Ischemia was induced by photothrombosis-induced vascular occlusion. Combined with in vivo two-photon laser scanning microscopy (TPLSM), AFG-1 enabled visualization of the dynamic changes of the autophagic flux in penumbra region of live mice. The elevation of local autophagy vacuoles in the ischemic brain was indicated by strong AFG-1 fluorescence, which was recorded over a period of 30 s (Figure 5, Movie S1). Consistent with our live cell imaging results, AFG-1 fluorescence colocalized with the adenovirus-mRFP-LC3 staining (Red, Pearson correlation coefficient, 0.80) in neurovascular components of the brain following ischemia in living mice. While in contrast, no significant AFG-1 fluorescence was observed in the control group without neurovascular insult (Movie S2). These results agreed well with our previous observation on vascular insult-induced ONOO- overproduction [23], and provided the direct observation on ONOO- -initiated autophagy activation upon ischemia injury.
In vivo two-photon fluorescence imaging of autophagy using Probe AFG-1 and adenovirus-mRFP-LC3 following brain ischemia in live mice. A) Schematic illustration of experimental procedures. B) Representative images of probe AFG-1 and adenovirus-mRFP-LC3 staining (red) in mice without or with photothrombosis. AFG-1 fluorescence elevated significantly after photothrombosis ischemia for 24 h, and colocalized well with mRFP-LC3. C) Z-project data for the colocalization of AFG-1 and the adenovirus-mRFP-LC3 in the ischemia brain, 150-200 µm below the cortical surface was selected for imaging. Scale bar: 20 µm. Emission was collected at 495-540 nm for AFG-1 fluorescence and 575-645 nm for mRFP upon two-photon excitation at 800 nm.
Conclusions
Inspired by the cascading microenvironment features of autophagy, we have developed a small-molecule fluorescent probe AFG-1 for the specific visualization of the autophagic flux both in vitro and in vivo. The fluorescence of AFG-1 can be activated first by ONOO- stimulation and then by protonation under acidic context, which are two sequentially emerging microenvironmental features characterizing autophagy. This pathway-dependent responsive profile has been validated by imaging the autophagic process in live cells, which showed that intervening in the autophagic process with genetic or pharmacological manipulation accordingly affected the fluorescence response of AFG-1. Application of probe AFG-1 to live mice imaging has provided the direct evidence on autophagy activation upon brain ischemia injury. Due to its sensitivity and the easy operation, probe AFG-1 should serve as a powerful imaging tool to explore autophagy biology under a variety of pathological contexts in vitro and in vivo. Furthermore, this pathway-dependent probe design strategy as demonstrated in this work should be instructive for future probe design.
Supplementary Material
Supplementary figures and tables.
Movie S1.
Movie S2.
Acknowledgements
This work was supported in part by National Key Research and Development Program of China (2016YFE0125400), National Natural Science Foundations of China (81473202, 81573411, 81225022, 21642007, 21778048), the Zhejiang Provincial Natural Science Foundation of China (Z16H310003, R18H300001), and National Science & Technology Major Project “Key New Drug Creation and Manufacturing Program” (2018ZX09711002).
Competing Interests
The authors have declared that no competing interest exists.
References
1. Galluzzi L, Pietrocola F, Levine B, Kroemer G. Metabolic Control of Autophagy. Cell. 2014;159:1263-1276
2. Ho TT, Warr MR, Adelman ER. et al. Autophagy maintains the metabolism and function of young and old stem cells. Nature. 2017;543:205
3. Mochida K, Oikawa Y, Kimura Y. et al. Receptor-mediated selective autophagy degrades the endoplasmic reticulum and the nucleus. Nature. 2015;522:359
4. Mathew R, Karantza-Wadsworth V, White E. Role of autophagy in cancer. Nat Rev Cancer. 2007;7:961-967
5. Chen W, Sun Y, Liu K, Sun X. Autophagy: a double-edged sword for neuronal survival after cerebral ischemia. Neural Regen Res. 2014;9:1210-1216
6. Nixon RA. The role of autophagy in neurodegenerative disease. Nat Med. 2013;19:983-97
7. Glick D, Barth S, Macleod KF. Autophagy: cellular and molecular mechanisms. J Pathol. 2010 221: 3-12
8. Ktistakis NT. Monitoring the Localization of MAP1LC3B by Indirect Immunofluorescence. Cold Spring Harb Protoc. 2015;2015:751-755
9. Martinet W, De Meyer GR, Andries L, Herman AG, Kockx MM. In situ detection of starvation-induced autophagy. J Histochem Cytochem. 2006;54:85-96
10. Mizushima N, Yoshimori T, Levine B. Methods in mammalian autophagy research. Cell. 2010;140:313-326
11. Mauro-Lizcano M, Esteban-Martinez L, Seco E. et al. New method to assess mitophagy flux by flow cytometry. Autophagy. 2015;11:833-843
12. Liu Y, Zhou J, Wang L. et al. A Cyanine Dye to Probe Mitophagy: Simultaneous Detection of Mitochondria and Autolysosomes in Live Cells. J Am Chem Soc. 2016;138:12368-12374
13. Leung CW, Wang Z, Zhao E. et al. A Lysosome-Targeting AIEgen for Autophagy Visualization. Adv Healthc Mater. 2016;5:427-431
14. Chen Z, Li J, Chen X. et al. Single gold@silver nanoprobes for real-time tracing the entire autophagy process at single-cell level. J Am Chem Soc. 2015;137:1903-1908
15. Han F, Chen YX, Lu YM. et al. Regulation of the ischemia-induced autophagy-lysosome processes by nitrosative stress in endothelial cells. J Pineal Res. 2011;51:124-135
16. Lleonart ME, Abad E, Graifer D, Lyakhovich A. Reactive Oxygen Species-Mediated Autophagy Defines the Fate of Cancer Stem Cells. Antioxid Redox Signal. 2017 doi: 10.1089/ars.2017.7223
17. Kubota C, Torii S, Hou N. et al. Constitutive reactive oxygen species generation from autophagosome/lysosome in neuronal oxidative toxicity. J Biol Chem. 2010;285:667-674
18. Jiang Q, Gao Y, Wang C. et al. Nitration of TRPM2 as a Molecular Switch Induces Autophagy During Brain Pericyte Injury. Antioxid Redox Signal. 2017;27:1297-1316
19. Chen X, Wang F, Hyun JY. et al. Recent progress in the development of fluorescent, luminescent and colorimetric probes for detection of reactive oxygen and nitrogen species. Chem Soc Rev. 2016;45:2976-3016
20. Lou Z, Li P, Han K. Redox-Responsive Fluorescent Probes with Different Design Strategies. Acc Chem Res. 2015;48:1358-1368
21. Zhang J, Zhen X, Zeng J, Pu K. A Dual-Modal Molecular Probe for Near-Infrared Fluorescence and Photoacoustic Imaging of Peroxynitrite. Anal Chem. 2018;90:9301-9307
22. Peng T, Wong NK, Chen X. et al. Molecular imaging of peroxynitrite with HKGreen-4 in live cells and tissues. J Am Chem Soc. 2014;136:11728-11734
23. Li X, Tao RR, Hong LJ. et al. Visualizing peroxynitrite fluxes in endothelial cells reveals the dynamic progression of brain vascular injury. J Am Chem Soc. 2015;137:12296-12303
24. Peng T, Chen X, Gao L, Zhang T, Wang W, Shen J, Yang D. A rationally designed rhodamine-based fluorescent probe for molecular imaging of peroxynitrite in live cells and tissues. Chem Sci. 2016;7:5407-5413
25. Knewtson KE, Rane D, Peterson BR. Targeting Fluorescent Sensors to Endoplasmic Reticulum Membranes Enables Detection of Peroxynitrite During Cellular Phagocytosis. ACS Chem Biol. 2018;13:2595-2602
26. Singh MK, Pal H, Sapre AV. Interaction of the excited singlet state of neutral red with aromatic amines. Photochem Photobiol. 2000;71:300-306
27. Zheng Q, Xu G, Prasad PN. Conformationally Restricted Dipyrromethene Boron Difluoride (BODIPY) Dyes: Highly Fluorescent, Multicolored Probes for Cellular Imaging. Chem. Eur. J. 2008:14 5812 - 5819
28. Sunahara H, Urano Y, Kojima H, Nagano T. Design and synthesis of a library of BODIPY-based environmental polarity sensors utilizing photoinduced electron-transfer-controlled fluorescence ON/OFF switching. J Am Chem Soc. 2007;129:5597-5604
29. Masuda M, Mower HF, Pignatelli B. et al. Formation of N-nitrosamines and N-nitramines by the reaction of secondary amines with peroxynitrite and other reactive nitrogen species: comparison with nitrotyrosine formation. Chem Res Toxicol. 2000;13(4):301-8
30. Nussenzweig SC, Verma S, Finkel T. The role of autophagy in vascular biology. Circ Res. 2015;116:480-488
31. Kabeya Y, Mizushima N, Ueno T. et al. LC3, a mammalian homologue of yeast Apg8p, is localized in autophagosome membranes after processing. EMBO J. 2000;19:5720-5728
32. Shang L, Chen S, Du F. et al. Nutrient starvation elicits an acute autophagic response mediated by Ulk1 dephosphorylation and its subsequent dissociation from AMPK. Proc Natl Acad Sci USA. 2011;108:4788-4793
33. Hocker R, Walker A, Schmitz I. Inhibition of autophagy through MAPK14-mediated phosphorylation of ATG5. Autophagy. 2013;9:426-428
34. Wang H, Hong LJ, Huang JY. et al. P2RX7 sensitizes Mac-1/ICAM-1-dependent leukocyte-endothelial adhesion and promotes neurovascular injury during septic encephalopathy. Cell Res. 2015;25:674-690
Author contact
![]() Corresponding author: lixin81edu.cn, yhhuac.cn, fenghan169edu.cn
Corresponding author: lixin81edu.cn, yhhuac.cn, fenghan169edu.cn