Impact Factor
- Issue 14; 2026
- Issue 13; 2026
- Issue 12; 2026
- Issue 11; 2026
- Issue 10; 2026
- Volume 16; 2026
- Advance Articles
- Past Issues
- Cover Images
- Cover Suggestion
- Index & Coverage
- Special Issues
Introduction
Materials and methods
Results
Discussion
Conclusions
Abbreviations
Supplementary Material
Acknowledgements
References
International Journal of Biological Sciences
International Journal of Medical Sciences
 Global reach, higher impact

Theranostics 2019; 9(26):8221-8238. doi:10.7150/thno.37513 This issue Cite
Research Paper
CD4+ and CD8a+ PET imaging predicts response to novel PD-1 checkpoint inhibitor: studies of Sym021 in syngeneic mouse cancer models
Lotte K. Kristensen1,2*, Camilla Fröhlich3, Camilla Christensen1,2, Maria C. Melander3, Thomas T. Poulsen3, Gunther R. Galler3, Johan Lantto3, Ivan D. Horak3, Michael Kragh3, Carsten H. Nielsen1,2, Andreas Kjaer2 ![]()
1. Minerva Imaging, Copenhagen, Denmark
2. Dept. of Clinical Physiology, Nuclear Medicine & PET and Cluster for Molecular Imaging, Dept. of Biomedical Sciences, Rigshospitalet and University of Copenhagen, Denmark
3. Symphogen A/S, Ballerup, Denmark
*First author
Received 2019-6-11; Accepted 2019-9-9; Published 2019-10-18
Abstract

Predicting the outcome of immunotherapy is essential for efficient treatment. The recent clinical success of immunotherapy is increasingly changing the paradigm of cancer treatment. Accordingly, the development of immune-based agents is accelerating and the number of agents in the global immuno-oncology pipeline has grown 60-70% over the past year. However, despite remarkable clinical efficacy in some patients, only few achieve a lasting clinical response. Treatment failure can be attributed to poorly immunogenic tumors that do not attract tumor infiltrating lymphocytes (TILs). Therefore, we developed positron emission tomography (PET) radiotracers for non-invasive detection of CD4+ and CD8a+ TILs in syngeneic mouse tumor models for preclinical studies.
Methods: Seven syngeneic mouse tumor models (B16F10, P815, CT26, MC38, Renca, 4T1, Sa1N) were quantified for CD4+ and CD8a+ TILs using flow cytometry and immunohistochemistry (IHC), as well as for tumor growth response to Sym021, a humanized PD-1 antibody cross-reactive with mouse PD-1. Radiotracers were generated from F(ab)'2 fragments of rat-anti-mouse CD4 and CD8a antibodies conjugated to the p-SCN-Bn-Desferrioxamine (SCN-Bn-DFO) chelator and radiolabeled with Zirconium-89 (89Zr-DFO-CD4/89Zr-DFO-CD8a). Tracers were optimized for in vivo PET/CT imaging in CT26 tumor-bearing mice and specificity was evaluated by depletion studies and isotype control imaging. 89Zr-DFO-CD4 and 89Zr-DFO-CD8a PET/CT imaging was conducted in the panel of syngeneic mouse models prior to immunotherapy with Sym021.
Results: Syngeneic tumor models were characterized as “hot” or “cold” according to number of TILs determined by flow cytometry and IHC. 89Zr-DFO-CD4 and 89Zr-DFO-CD8a were successfully generated with a radiochemical purity >99% and immunoreactivity >85%. The optimal imaging time-point was 24 hours post-injection of ~1 MBq tracer with 30 µg non-labeled co-dose. Reduced tumor and spleen uptake of 89Zr-DFO-CD8a was observed in CD8a+ depleted mice and the uptake was comparable with that of isotype control (89Zr-DFO-IgG2b) confirming specificity. PET imaging in syngeneic tumor models revealed a varying maximum tumor-to-heart ratio of 89Zr-DFO-CD4 and 89Zr-DFO-CD8a across tumor types and in-between subjects that correlated with individual response to Sym021 at day 10 relative to start of therapy (p=0.0002 and p=0.0354, respectively). The maximum 89Zr-DFO-CD4 tumor-to-heart ratio could be used to stratify mice according to Sym021 therapy response and overall survival was improved in mice with a 89Zr-DFO-CD4 ratio >9 (p=0.0018).
Conclusion: We developed 89Zr-DFO-CD4 and 89Zr-DFO-CD8a PET radiotracers for specific detection and whole-body assessment of CD4+ and CD8a+ status. These radiotracers can be used to phenotype preclinical syngeneic mouse tumor models and to predict response to an immune checkpoint inhibitor. We foresee development of such non-invasive in vivo biomarkers for prediction and evaluation of clinical efficacy of immunotherapeutic agents, such as Sym021.
Keywords: Molecular imaging, positron emission tomography (PET), immune cell imaging, immunotherapy, immune checkpoint inhibition, PD-1, lymphocytes, tumor infiltrating lymphocytes, T-cells, CD4, CD8.
Introduction
The rapidly evolving field of cancer immunotherapy and the clinical success of immune checkpoint inhibitors have boosted the development of immune-based agents and changed the standard of care for many types of cancer [1,2]. Despite remarkable clinical efficacy in some patients, others fail to develop a durable clinical response. The fact that only a subpopulation of patients benefits from immune checkpoint inhibitors [3] highlights the complexity of the immuno-oncology landscape and the strong urgency to develop improved methods to predict and monitor therapeutic responses of such agents.
The level of immune infiltration, i.e. immune status, in tumors can strongly influence patient outcomes for immune checkpoint inhibitors. Treatment failure can be attributed to the poorly immunogenic, so-called “cold” tumors that do not attract tumor infiltrating lymphocytes (TILs). In particular, preclinical and clinical research has focused on targeting tumors by enhancing cytotoxic CD8+ effector function. Indeed, the major players exerting tumor-directed killing are thought to be the CD8+ T cells which can be either resident or attracted to the inflamed tumor microenvironment upon presentation of tumor-antigen on MHC class I molecules [4,5]. Since most tumors do not express MHC class II molecules, the role of CD4+ T cells have been indecipherable. However, several characteristics of CD4+ T cells place them as required players for efficacious anti-tumor immunity. CD4+ T cells orchestrate a broad range of immune responses including initiating, maintaining and integrating adaptive and innate effector functions. Further, studies in mice have shown that CD4+ T cells are required for inducing CD8+ anti-tumor responses [6,7]. Lastly, CD4+ T cells can target tumor cells indirectly by modulating the tumor microenvironment or directly by cytolytic mechanisms [7-10]. Not surprisingly, increasing evidence suggests that the presence, location and density of both CD4+ and CD8+ lymphocytes in the tumor microenvironment of patients are primary drivers for productive anti-tumor immune responses and are predictors of overall survival [11-16].
Despite the association of TIL location and density in the tumor microenvironment with prognosis in various cancers, validated and standardized companion diagnostics assays are still lacking. Common approaches to detect and monitor immune responses are limited to peripheral blood lymphocyte analysis and tumor biopsies that are invasive, prone to sampling error and may not reflect the spatio-temporal dynamics of TILs within the tumor. In contrast, non-invasive molecular imaging with positron emission tomography (PET) allows for a much more comprehensive look at the entire tumor and prospective metastases in vivo over time. The ability to monitor TILs over the course of therapy with PET may allow for early determination of treatment efficacy and has thus fueled the development of T cell specific PET probes targeting a variety of surface markers such as PD-1 [17-19], CTLA-4 [20], CD3+ [21,22], CD4+ [23] and CD8+ [24,25] for the purpose of detection and monitoring of responses to immunotherapy. One key question is however, whether these probes can predict the outcome of checkpoint blockade therapy. To our knowledge, no studies have investigated the predictive value of T cell specific imaging and immune phenotyping prior to immunotherapy. Thus, we sought to develop specific PET radiotracers for non-invasive in vivo detection and quantification of TILs in a panel of commonly used preclinical syngeneic mouse models mimicking a broad patient population prior to immune checkpoint inhibition.
In the present study, we utilize the high specificity of antibodies and produce F(ab)'2 fragments towards CD4 and CD8a surface markers. We radiolabel the F(ab)'2 fragments with Zirconium-89 (89Zr, t1/2=78.4 hours), an isotope well-matched to the biological half-life of F(ab)'2 fragments and validate the specificity of these antibody-based radiotracers for immune phenotyping of tumors. Furthermore, we demonstrate that tumor uptake of CD4+ and CD8a+ specific tracers is overall associated with the tumor growth response to Sym021. Sym021 is a recombinant, fully human, IgG1-LALA antibody derived from chicken that binds human PD-1 with nanomolar affinity and cross-reacts with mouse PD-1 with a stability similar to fully human antibodies in clinical development [26]. Lastly, we show that 89Zr-DFO-CD4 can be used to stratify mice into responders and non-responders.
Materials and methods
Cell culture and animal models
Murine cancer cell lines (B16F10 (skin, CRL-6475), P815 (mast cell, TIB-64), CT26 (colon, CRL-2638), Renca (kidney, CRL-2947), and 4T1 (breast, CRL-2539)) were purchased from the American Type Culture Collection. Murine cancer cell lines (Sa1N (fibroblast) and MC38 (colon)) were a kind gift from Holbrook Kohrt, Stanford University. The CT26, MC38, 4T1, Renca and Sa1N cells were cultured in RPMI-1640+Glutamax, 10% fetal bovine serum (FBS), 1% penicillin-streptomycin (PS), and the Renca cell line was supplemented with 10 mM HEPES, 2 mM sodium pyruvate and 0.1 mM NEAA. The B16F10 and P815 cells were cultured in DMEM+Glutamax, 10% FBS, 1% PS. P815 was supplemented with 1 mM sodium pyruvate.
All cell lines were maintained at 37°C in a humidified incubator containing 5% CO2. Cells were harvested in their exponential growth phase and resuspended in complete growth media at a concentration of 10x106 cells/mL. Cells (100 µL, 1x10⁶ cells) were subcutaneously injected into the right flanks above the hindlimbs in 7-8 week old female mice: C57BL/6 (MC38 and B16F10), BALB/c (CT26, Renca, and 4T1), A/J (Sa1N), and DBA/2 (P815). C57BL/6 and BALB/c mice were supplied by Janvier Labs (France), A/J mice by Envigo (Germany) and DBA/2 mice by Charles River (Germany) and were acclimatized for 1 week prior to experimentation.
Tumor volume was measured by caliper by using the formula (width2×length)×0.52. All animal procedures were conducted under a protocol approved by the Danish National Animal Experiments Inspectorate.
Flow cytometry
Tumors were harvested at an average size of 150-200 mm3 and processed into single cell suspensions using a tumor cell isolation kit and the GentleMACS Octo Dissociator (Miltenyi Biotec) according to the manufacturer's descriptions. One million cells were pre-incubated with Fc block (#553141, BD Pharmingen) washed and stained for cell surface markers according to standard procedures. The following mouse antibodies were used: anti-CD8a (PerCP Cy5.5, clone 53-7.6, #100734, BioLegend) and anti-CD4 (FITC, clone RM4-5, #553046, from BD Pharmingen). Cells were acquired on a FACSVerse flow cytometer (BD Biosciences). Data were collected using BD FACSuite Software (v1.6) and further analyzed with FlowJo v10.4.2 (Tree Star Inc.).
Immunohistochemistry and hematoxylin & eosin staining
Tumors were harvested at an average tumor size of 150-200 mm3 and snap frozen. Tissues were cryosectioned at 8 µm and immunohistochemical (IHC) experiments were conducted as follows: slides were fixed in cold acetone or 4% formalin, blocked in 5% normal mouse serum (Jackson Immunoresearch) and incubated with primary antibodies for 1.5 h at room temperature. Primary antibodies were anti-CD3 (Dako, A0452, #280), anti-CD4 (Affymetrix, #14-0042) and anti-CD8a (Affymetrix, #14-0081). Sections were dried and stained with haematoxylin/eosin in a Leica ST4040 automatic stainer.
Assessment of T cell infiltration was performed in a blinded fashion and scored as 0 (negative), 1 (<150 cells per mm2), 1-2 (150-300 cells per mm2), 2 (300-500 cells per mm2, 2-3 (500-800 cells per mm2), and 3 (>800 cells per mm2). N=3 per syngeneic tumor model.
Generation of F(ab)'2 fragments, conjugation and radiolabelling
F(ab)'2 fragments were generated from rat-anti-mouse CD4 clone CK 1.5 (#BE0003-1, BioXcell), rat-anti-mouse CD8a clone YTS169.4 (#BE0117, BioXcell) and rat-anti-mouse IgG2b clone LTF-2 (#BE0090, BioXcell) using FabRICATOR (#A0-FR1-050, Genovis, Sweden). 2.5 mg of antibody in PBS was incubated with 500 units FabRICATOR for 2.5 hours at 37 °C under continuous rotation. The antibody-enzyme mixture was purified by preparative HPLC (Yarra-2000 SEC column, 0.1 M phosphate buffer, 1 mL/min), yielding isolated F(ab)'2 and Fc fragments. F(ab)'2 fragments were randomly conjugated to p-SCN-Bn-Desferrioxamine (SCN-Bn-DFO, Macrocyclics) by incubating ~ 700 µg purified F(ab)'2 fragments with 10x molar excess SCN-Bn-DFO dissolved in DMSO in 0.1 M NaHCO3 (1 hour, 37 °C, pH=9.0). The reaction mixture was purified on PD-10 desalting columns (GE Healthcare, USA) into PBS resulting in DFO-CD8a, DFO-CD4 and DFO-IgG2 precursor.
89Zr-oxalate (PerkinElmer, the Netherlands) was neutralized to pH ~7 with 1 M Na2CO3. Conjugated F(ab)'2 fragments (100 µg DFO-CD8a, DFO-CD4, and DFO-IgG2 precursor) were incubated with 150 MBq neutralized 89Zr-oxalate (1 hour, 37ºC, pH=7.0) followed by PD-10 purification into PBS. The radiochemical purity at end-of-synthesis was determined by radio-thin-layer chromatography (radio-TLC) using an eluent of 50 mM EDTA (pH 5.5) on silica gel 60 TLC plates, where the antibody construct remains at the baseline, while 89Zr4+ ions and [89Zr]-EDTA elute with the solvent front. All optimization experiments including optimization of dose, imaging time-point and in vivo depletion were conducted with 89Zr-DFO-CD8a.
SDS-page
Full length antibody, purified F(ab)'2 and purified Fc fragments were diluted in NuPAGE LDS sample buffer (#NP0007, Invitrogen), heated at 70 °C for 10 min and loaded onto BoltTM 4-12% Bis-Tris gels (#NW04120BOX, Invitrogen). Electrophoresis was run on the Mini Gel Tank system (Life Technologies) at 200V constant voltage in NuPAGE MES SDS running buffer (#NP0002, Invitrogen). Gels were fixed and stained with Coomassie brilliant blue R-250 (#1610436, Bio-Rad).
Mouse T cell isolation and immuno-reactivity
Murine CD4+ and CD8a+ cells were isolated from mouse spleen using the magnetic activating cell sorting (MACS) technique (CD4+ T cell isolation kit, #130-104-454; CD8a+ T cell isolation kit, #130-104-075, Miltenyi Biotec). Female BALB/c mice (7-8 weeks old) were sacrificed by cervical dislocation and the spleens removed aseptically. Spleens were mashed with a plunger through a moisturized 70 µm nylon mesh and rinsed in FACS buffer (1% BSA, 0.5 mM EDTA in PBS) until complete dissociation. Cells were pelleted and resuspended in red blood cell lysis buffer (#11814389001, Sigma Aldrich), washed in FACS buffer and incubated with biotin-antibody cocktail (4 °C, 5 min) followed by incubation with anti-biotin microbeads (4°C, 10 min). Magnetic separation was performed on a QuadroMACSTM Manual Separator with a pre-rinsed LS column (#130-042-401, Miltenyi Biotec) based on negative selection methods.
The immuno-reactivity of anti-CD4 and anti-CD8a F(ab)'2 fragments following radiolabeling was assessed according to the Lindmo assay [27]. Increasing concentrations of CD4+/CD8a+ cells (0.25x10⁶ - 4x10⁷ cells/mL) were incubated with 2 nM 89Zr-DFO-CD4 or 89Zr-DFO-CD8a for 3 hours at 4°C. Cells were centrifuged at 500g for 5 minutes and the supernatants and pellets counted in a gamma counter (Wizard2, PerkinElmer, Massachusetts, USA). Cell-associated radioactivity was calculated as the ratio of cell-bound radioactivity to the total amount of added radioactivity.
Optimization of dose and imaging time-point
Titration of dose and longitudinal imaging was performed in CT26 tumor-bearing mice (150-200 mm3) and was only performed for 89Zr-DFO-CD8a. Mice were injected with 89Zr-DFO-CD8a (1.34 ± 0.1 MBq) without or with 5, 10, 30 or 100 µg unlabelled CD8a-F(ab)'2 intravenously (total volume ~ 200 µL in PBS, N=3/group). Small animal PET/CT imaging was performed 1, 4, 24 and 72 hours after injection on an Inveon Multimodality PET/CT scanner (Siemens, Germany). Mice were anesthetized with sevoflurane (3-4% in 80% N2, 20% O2) during PET/CT imaging. Static PET data were acquired in list mode with an acquisition time of 300, 300, 600 and 900 seconds for the 1, 4, 24 and 72 time-point, respectively. Images were reconstructed using a 3D maximum a posteriori algorithm with CT based attenuation correction. Image analysis (Inveon Software, Siemens) was performed by drawing CT based regions of interest (ROIs) over the tumor, whole heart, liver, kidney, muscle, inguinal lymph node (ILN), axillary lymph node (ALN) and cervical lymph node (CLN). ROIs over the spleen were drawn by PET based thresholding. The uptake of 89Zr-DFO-CD8a was quantified as % injected dose per gram tissue (%ID/g) assuming a soft tissue density of 1 g/cm3. Blood was withdrawn by cardiac puncture and mice were euthanized after the imaging session, organs resected, weighted and the radioactivity counted in a gamma counter.
In vivo depletion
Mice bearing subcutaneous CT26 tumors (150-200 mm3) were treated for three consecutive days with intraperitoneal injections of either saline, 300 µg of CD8a+ depleting antibody clone 2.43, a full length rat-anti-mouse IgG2b (#BE0061, BioXcell), or 300 µg DFO-CD8a precursor (N=5/group). Single cell suspensions of blood, tumors and spleens were obtained according to the above-described method and stained for viability (#65-0865-18, ThermoFisher Scientific), CD45 (BV480 clone 30-F11, #566095), CD3 (PE, clone 145-2C11, #100308), CD4 (FITC, clone RM4-5, #553047) and CD8a (BV711, clone 53-6.7, #563046) (N=2/group). All antibodies were purchased from BD Biosciences. Analyses were conducted on a LSR-Fortessa flow cytometer (BD) and data analysed with FlowJo software (v10, TreeStar Inc., USA).
After end of therapy, saline and CD8a+ depleted mice (N=3/group) were injected with 89Zr-DFO-CD8a (1.97 ± 0.08 MBq) + 30 µg CD8a-F(ab)'2 intravenously. A group of naïve immunodeficient nude mice was included to determine distribution in antigen-negative mice. Mice were subjected to PET/CT imaging with 300 seconds static PET acquisition 24 hours after injection according to the above-described protocol. Mice were euthanized after the imaging session and underwent conventional ex vivo biodistribution analysis as described above.
Isotype control imaging
Mice bearing subcutaneous CT26 tumors (150-200 mm3, N=3) were intravenously injected with 89Zr-DFO-IgG2b (2.2 - 2.6 MBq, 3.1 ± 0.1 µg) + 30 µg IgG2b-F(ab)'2 and subjected to PET/CT imaging with 300 seconds static PET acquisition 24 hours after injection according to the above-described protocol. Mice were euthanized after the imaging session and underwent conventional ex vivo biodistribution analysis as described above.
External radiation therapy and autoradiography
Mice carrying CT26 subcutaneous tumors (150-200 mm3) were randomized into two groups (N=8/group) and subjected to 2 Gy external radiation therapy (XRT) for three consecutive days at a dose rate of 1 Gy/min (320 kV, 12.5 mA) using a small animal irradiator (XRAD-320, pXi, CT, USA). Mice were placed in the radiation chamber in a restrainer allowing total fixation of the leg and the body was covered by lead shielding so that only the tumor was exposed to radiation. On day 3 after the last radiation dose, mice were intravenously injected with 89Zr-DFO-CD8a (1.12 ± 0.11 MBq) + 30 µg CD8a-F(ab)'2 and subjected to PET/CT imaging with 300 seconds static PET acquisition 24 hours after injection according to the above-described protocol. Image analysis was performed by drawing CT based ROIs over the tumor and PET based thresholding over the spleen.
Following 89Zr-DFO-CD8a PET two mice from each group were subjected to perfusion fixation and tumors snap frozen in chilled isopentane in OCT medium for autoradiographic measurement. Tumors were cryosectioned at 10 µm and slides mounted on SuperFrost ULTRA PLUS slides. Intratumoral distribution of 89Zr-DFO-CD8a was determined by exposing tumor sections to phosphor imaging screens for approximately 16 hours. Phosphor screens were read on an Amersham Typhoon Imager (GE Healthcare, IL, USA). A parallel set of mice subjected to an identical treatment regimen (N=6/group) were euthanized, spleens and tumors isolated and processed into single cell suspensions, stained for viability (#65-0865-18, ThermoFisher Scientific), CD45 (BV480 clone 30-F11, #566095) and CD8a (BV711, clone 53-6.7, #563046) according to the above-described protocol. Data were collected on a LSR-Fortessa flow cytometer (BD) and analysed with FlowJo software (v10, TreeStar Inc., USA).
Small animal PET/CT imaging and Sym021 treatment
Once animals representing each syngeneic mouse model (B16F10, P815, CT26, MC38, Renca, 4T1, Sa1N) reached an average tumor volume of 60-80 mm3 (8-10 days post inoculation) they were randomized into 3 treatment groups; 89Zr-DFO-CD4 (N=5), 89Zr-DFO-CD8a (N=5) and vehicle (N=5). 89Zr-DFO-CD4 (0.4-1.1 MBq, 2.1 ± 0.1 µg) and 89Zr-DFO-CD8a (0.3-0.7 MBq, 1.8 ± 0.3 µg) were injected intravenously and mice were subjected to PET/CT imaging with 300 seconds static PET acquisition 24 hours after injection according to the above-described protocol. Image analysis was performed by drawing CT based ROIs over the tumors and whole heart. Immunotherapy with Sym021 was initiated immediately after image acquisition. Sym021 was dosed intraperitoneally at 10 mg/kg 3x weekly for a total of 6 doses. Tumor growth was monitored 3x weekly for evaluation of therapeutic response and the tumor growth inhibition (TGI) was calculated relatively to the mean tumor volume of the control group to correct for inter-model tumor growth differences. TGI was expressed as % and calculated as ((average tumor volume(day 10)control group - tumor volume(day 10)treated mouse)/ average tumor volume(day 10)control group) x 100. Mice were euthanized at the first tumor measurement above 1,500 mm3.
Statistical analyses
Data are expressed as mean ± SEM. One-way ANOVA with post hoc test corrected for multiple comparisons (Tukey) was applied to test the effect of depletion and compare tumor volumes between treatment groups. Student's t-test was performed to test the effect of external radiation therapy and compare tumor-to-heart ratios between responders and non-responders. For presentation of mean tumor growth over time, carry-forward of tumor volumes was performed until the last day where >50% of the treatment group was alive to account for missing points. Two-way ANOVA with repeated measures was applied to compare the tumor volumes over time. Linear regression analyses were performed to test for correlations and the Log-rank test (Mantel-Cox) was applied for survival analyses. P values ≤ 0.05 were considered statistically significant. Statistical analyses were performed using GraphPad Prism 7.0c (GraphPad Software, CA, USA).
Results
Generation of radiolabelled F(ab)'2 fragments
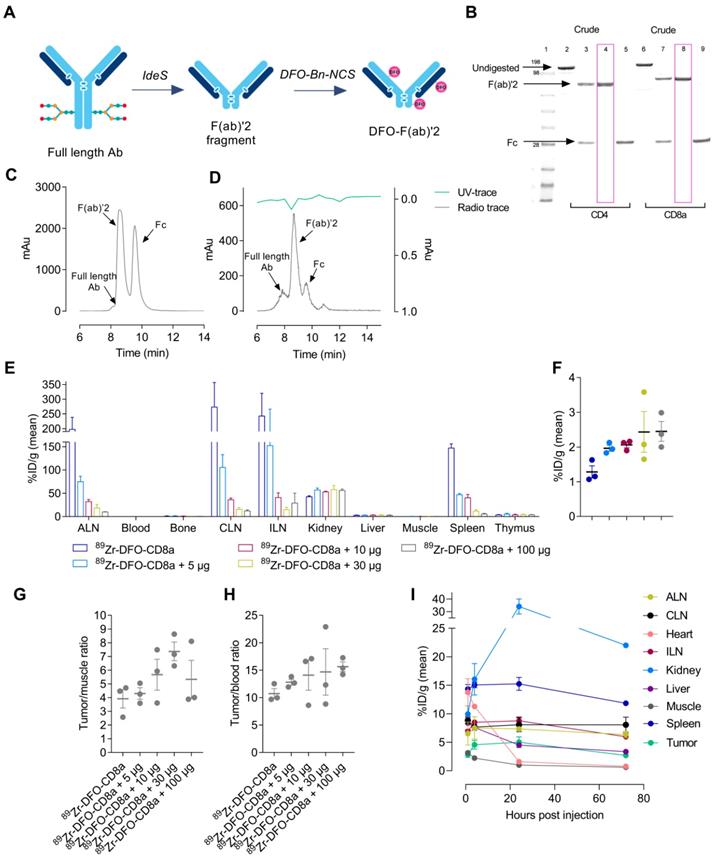
Rat-anti-mouse-CD4, rat-anti-mouse-CD8a and rat-anti-mouse-IgG2b were successfully digested in the hinge region yielding F(ab)'2 and Fc fragments (Figure 1A). SDS-page analysis confirmed the digestion efficiency and revealed F(ab)'2 at 100 kDa (lane 4, 8) with no presence of Fc or full-length antibody in the final product (Figure 1B). F(ab)'2 fragments were conjugated to the SCN-Bn-DFO chelator and radiolabeled with 89Zr with a radiochemical yield of 11.9 ± 2.6, 17.5 ± 4.3 and 37 MBq for 89Zr-DFO-CD4, 89Zr-DFO-CD8a and 89Zr-DFO-IgG2b, respectively. All tracers were >99% pure as assessed by radio-TLC. Representative HPLC chromatograms of digested rat-anti-mouse-CD8a+ and 89Zr-DFO-CD8a are shown in Figure 1C-D, where a major UV peak for F(ab)'2 corresponding with the radioactive peak, and two minor peaks for full-length antibody and Fc were observed (Figure 1D). The immuno-reactivity of 89Zr-DFO-CD4 and 89Zr-DFO-CD8a towards CD4 and CD8a expressing splenocytes was estimated to 90.5 ± 0.6% and 86.7 ± 0.7%, respectively. Specifications of each tracer are summarized in Table 1.
Development and optimization of radiolabeled F(ab)'2 fragments for PET imaging. (A) Schematic illustration of preparation of F(ab)'2 fragments from full length antibodies using FaBRICATOR (IdeS protease). (B) SDS-page of non-digested (lane 2+6), crude antibody mixture (lane 3+7) and purified F(ab)'2 (lane 4+8) and Fc fragments (lane 5+9) of anti-mouse CD4 and anti-mouse CD8a. (C) Representative HPLC chromatogram of crude anti-mouse CD8a antibody mixture used for preparative purification. (D) Representative HPLC chromatogram of 89Zr-DFO-CD8a after PD10 purification at end-of-synthesis. (E) Ex vivo biodistribution 72 hours post-injection of 89Zr-DFO-CD8a in major organs and (F) CT26 tumors with increasing doses of unlabeled CD8a-F(ab)'2 measured by gamma counting and expressed as %ID/g (N=3/dose). (G) Tumor-to-muscle and (H) tumor-to-blood ratio of uptake quantified by gamma counting 72 hours post-injection of 89Zr-DFO-CD8a (N=3/dose). (I) Image-derived biodistribution of dose-optimized mean 89Zr-DFO-CD8a uptake in major organs and tumor based on ROI analysis and expressed as mean %ID/g in CT26 tumor-bearing mice over the imaging time-course (N=3). Data are presented as mean ± SEM. Ab: antibody; ALN: axillary lymph node; CLN: cervical lymph node; ILN: inguinal lymph node; %ID/g: % injected dose per gram tissue.
Specifications of tracers
| 89Zr-DFO-CD4 | 89Zr-DFO-CD8a | 89Zr-DFO-IgG2b | |
|---|---|---|---|
| Radiochemical yield (MBq) | 11.9 ± 2.6 | 17.5 ± 4.3 | 37 |
| Purity (%) | >99 | >99 | >99 |
| Specific activity (MBq/mg) | 218.7 ± 42.3 | 200.5 ± 39.5 | 553.7 |
| Immunoreactivity (%) | 90.5 ± 0.6 | 86.7 ± 0.7 | - |
| Activity injected* (MBq) | 0.8 ± 0.03 [0.4-1.1] | 0.5 ± 0.02 [0.3-0.7] | 2.4 ± 0.4 [2.2-2.6] |
| Protein dose injected* (µg) | 2.1 ± 0.1 | 1.8 ± 0.3 | 3.3 ± 0.1 |
Values are mean ± SEM.
*Doses listed for 89Zr-DFO-CD4/CD8a are from the efficacy study.
Optimization of imaging parameters
Radiolabeled F(ab)'2 fragments were initially evaluated in CT26 tumor-bearing mice to optimize imaging parameters for tumor visualization. 89Zr-DFO-CD8a was titrated with cold doses of CD8a-F(ab)'2 ranging from 0-100 µg where uptake was primarily seen in lymphoid tissue, i.e. spleen and lymph nodes. Retention in kidneys was also observed as expected for radiolabeled antibody fragments [28]. Uptake in lymphoid tissue significantly decreased with increasing co-dose as evident from the representative PET images (Figure S1) and ex vivo biodistribution 72 hours post-injection (Figure 1E). Contrary, availability of 89Zr-DFO-CD8a for tumor accumulation was evident and uptake increased from 1.28 ± 0.17 to 2.45 ± 0.28 % injected dose per gram (%ID/g) with increasing dose of CD8a-F(ab)'2 (Figure 1F, Table S1). Importantly, the tumor-to-muscle (Figure 1G) and tumor-to-blood (Figure 1H) ratios also increased with increasing dose. However, a decrease in the tumor-to-muscle ratio of 89Zr-DFO-CD8a was observed at 100 µg (Table S1). Based on these results 30 µg was chosen as the optimal co-dose.
Temporal in vivo distribution of protein dose-optimized 89Zr-DFO-CD8a by longitudinal PET imaging at 1, 4, 24 and 72 hours post-injection is depicted in Figure 1I. High accumulation was seen in kidney, spleen and lymph nodes which increased over the imaging time-course. However, no further improvement in image contrast was seen beyond 24 hours (Figure S2). Tumor uptake was 2.88 ± 0.71, 4.55 ± 1.07, 5.0 ± 1.3 and 2.68 ± 0.56 % ID/g for the 1, 4, 24 and 72 hour time-points, respectively. Despite high kidney uptake, 24 hours post-injection was chosen as optimal for imaging due to measurable tumor growth resulting in dilution of tumor PET signal and limited gain in image contrast at 72 hours.
Specificity of 89Zr-DFO-CD8a PET signal
To evaluate the specificity of 89Zr-DFO-CD8a towards CD8a, CT26 tumor-bearing mice were treated with CD8a+ depleting antibody. Furthermore, to ensure that 89Zr-DFO-CD8a does not perturb CD8a+ populations in vivo, a group of mice received equally high doses of DFO-CD8a precursor. Flow cytometric analyses showed a >95% reduction in CD45+CD8a+ cells in blood and spleens and a ~85% reduction in the tumors of mice treated with CD8a+ depleting mAb (Figure 2A-B). Importantly, high dose DFO-CD8a precursor did not alter CD45+CD8a+ populations in any of the analysed tissues. 89Zr-DFO-CD8a PET was able to detect the loss of CD45+CD8a+ cells in the spleen as visualized by the representative PET/CT images (Figure 2C). When injected into antigen-negative mice lacking mature T and B lymphocytes, 89Zr-DFO-CD8a uptake in spleen was similar to that of CD8a+ depleted mice confirming the specificity of 89Zr-DFO-CD8a (Figure 2C). Ex vivo biodistribution confirmed a significant decrease in 89Zr-DFO-CD8a uptake in spleen (p<0.05) and lymph nodes (p<0.01) of CD8a+ depleted mice (Figure 2D). Uptake of 89Zr-labeled isotype control antibody (89Zr-DFO-IgG2b) in lymphoid tissue was low (~1-3 %ID/g) and was similar to the 89Zr-DFO-CD8a uptake in CD8a+ depleted mice (p=0.55). To compare the accumulation of 89Zr-DFO-CD8a and 89Zr-DFO-IgG2b in tumors, the tumor uptake was normalized to the blood pool in order to account for an observed difference in circulation time between the probes. The tumor-to-blood ratio of 89Zr-DFO-CD8a was significantly lower in CD8a+ depleted mice compared to control mice (5.6 ± 0.03 vs. 8.3 ± 0.32, p=0.011, Figure 2E). In addition, the tumor-to-blood ratio of 89Zr-DFO-IgG2b was 1.9 ± 0.68 and significantly lower than that of control (p=0.0001) and CD8a+ depleted (p=0.0024) mice.
Specificity of 89Zr-DFO-CD8a in depleted, antigen-negative and tumor-bearing mice. (A) Representative dot plots of median fluorescent intensity of CD4-FITC (y-axis) and CD8a-BV711 (x-axis) measured by flow cytometric analysis of blood, spleen and tumors of control (N=2), CD8a+ depleted (N=2) and DFO-CD8a treated (N=2) CT26 tumor-bearing mice. (B) Depletion with CD8a 2.43 mAb reduced the percentage of CD45+CD8a+ cells in blood, spleen and tumor whereas DFO-CD8a precursor did not change CD45+CD8a+ populations (N=2/group). (C) Representative axial PET/CT images 24 hours post-injection of 89Zr-DFO-CD8a in control, CD8a+ depleted and NMRI nude (antigen-negative) mice. Arrows designate the spleen. (D) Ex vivo biodistribution of 89Zr-DFO-CD8a and 89Zr-DFO-IgG2b (isotype control) in lymphoid tissue. Mean 89Zr-DFO-CD8a uptake was significantly reduced in CD8a+ depleted mice (N=3/group). (E) The 89Zr-DFO-CD8a tumor-to-blood ratio was lowered in CD8a+ depleted mice compared to control mice (p=0.011) (N=3/group). The 89Zr-DFO-IgG2b (isotype control) tumor-to-blood ratio was significantly different than the 89Zr-DFO-CD8a tumor-to-blood ratio in control (p=0.0001) and CD8a+ depleted mice (p=0.0024). (F) Autoradiography of tumors showed increased 89Zr-DFO-CD8a uptake in tumors subjected to fractionated external radiation therapy (XRT, 3x2Gy). (G) XRT (3x2Gy) increased the mean 89Zr-DFO-CD8a uptake in tumors (p=0.0006) and spleens (p=0.0022) of CT26 tumor-bearing mice (N=16/group) that was confirmed by (H) flow cytometric analysis of CD45+CD8a+ cells (N=6/group). Data are presented as mean ± SEM and the significance levels are indicated by asterisks (*). *=p<0.05, **=p<0.01, ***=p<0.001, ****=p<0.0001, ns=no significance. ALN: axillary lymph node; CLN: cervical lymph node; ILN: inguinal lymph node; XRT: external radiation therapy; %ID/g: % injected dose per gram tissue.
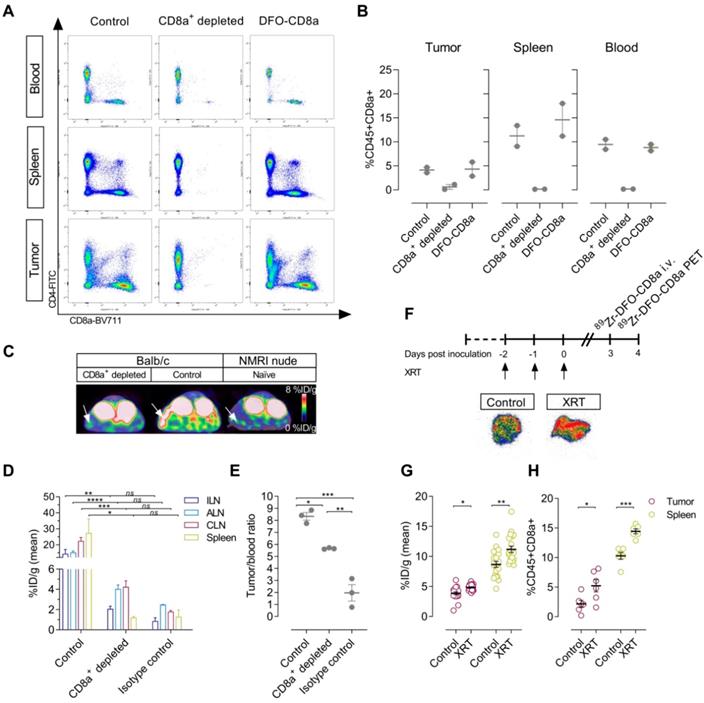
Fractionated XRT was applied to CT26 tumor-bearing mice to investigate whether treatment-induced changes in CD8+ populations [29] could be detected with the probes (Figure 2F). XRT induced lymphocyte infiltration in tumors and spleens of CT26 tumor-bearing mice that was detected by 89Zr-DFO-CD8a PET/CT (Figure 2G, Figure S3). Mean tumor uptake increased from 3.8 ± 0.2 to 4.9 ± 0.1 %ID/g (p=0.0006) and mean spleen uptake increased from 8.7 ± 0.5 to 11.2 ± 0.5 %ID/g (p=0.0022). Ex vivo autoradiographic measurement of 89Zr-DFO-CD8a visualized this distribution pattern in tumors between treated and non-treated groups (Figure 2F). Further, flow cytometric analysis confirmed the increased numbers of CD45+CD8a+ cells in tumors (p=0.0287) and spleens (p=0.0002) of irradiated mice (Figure 2H).
Characterization of syngeneic mouse tumor models
Immune status of a panel of seven subcutaneous syngeneic mouse tumor models was analysed by immunohistochemistry and flow cytometry with respect to their capacity to attract TILs, i.e. CD4+ and CD8a+ cells. Representative immunohistochemical images and flow cytometric plots are shown in Figure 3A, representing a model with low (B16F10) and high (Sa1N) numbers of CD4+ and CD8a+ cells.
Characterization of syngeneic mouse models by CD4+ and CD8a+ subsets. (A) Representative sections from immunohistochemical (IHC) staining of CD4+ and CD8a+, and hematoxylin and eosin (HE) staining in a tumor model with low (B16F10) and high (Sa1N) intensity staining (left panel). Representative dot plots of median fluorescent intensity of CD4-FITC (y-axis) and CD8a-PerCP-Cy5.5 (x-axis) of flow cytometric analysis of CD4+ and CD8a+ cells in a tumor model with low (B16F10) and high (Sa1N) intensity staining (right panel). (B) Agreement between flow cytometric and IHC analysis of CD4+ and (C) CD8a+ subsets revealed clustering of tumor types into hot (red) and cold (blue) areas. N=6/model for flow cytometry, N=3/model for IHC. HE: hematoxylin and eosin; IHC: immunohistochemistry.
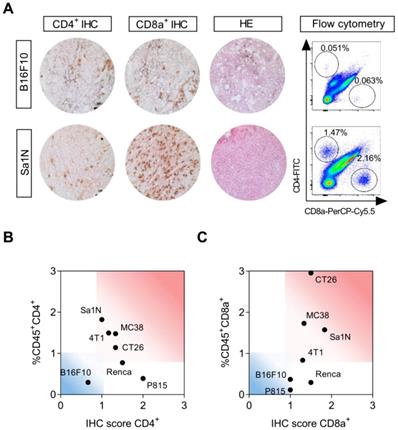
Varying degree of lymphocyte infiltration was observed and tumor types were stratified into immunologically “hot” or “cold” tumors based on their numbers of CD4+ and CD8a+ cells [12,30-32]. Sa1N, MC38, CT26, and 4T1 presented with the highest number of infiltrating CD4+ and CD8a+ T cells and were defined as “hot” tumors (Figure 3B-C, read area). The lowest numbers of CD4+ and CD8a+ cells were found in B16F10 (Figure 3B-C, blue area), defined as a “cold” tumor, and intermediate T cell numbers were found in Renca and P815, although high CD4+ numbers were found in both models based on IHC score only. Quantitative analysis of all models is illustrated in Figure S4 and summarized in Table 2.
Summarized IHC, flow cytometry, PET imaging and efficacy data.
| 89Zr-DFO-CD4 | 89Zr-DFO-CD8a | |||||||||||
|---|---|---|---|---|---|---|---|---|---|---|---|---|
| Model | CD4+ IHC (score) | CD4+ flow (%) | Tumor (max %ID/g) | Tumor / heart ratio (max) | CD8a+ IHC (score) | CD8a+ flow (%) | Tumor (max %ID/g) | Tumor / heart ratio (max) | Immune phenotype | Mean response to Sym021 | Responders / non-responders CD4+ PET (N) | Responders / non-responders CD8a+ PET (N) |
| B16F10 | 0.7 ± 0.3 | 0.30 ± 0.10 | 10.3 ± 0.7 | 5.28 ± 0.68 | 1.0 ± 0.0 | 0.37 ± 0.19 | 9.7 ± 0.9 | 4.6 ± 0.67 | Cold | No response | 0/5 | 0/5 |
| P815 | 2.0 ± 0.3 | 0.39 ± 0.05 | 14.9 ± 0.7 | 6.61 ± 0.96 | 1.0 ± 0.0 | 0.39 ± 0.05 | 17.9 ± 0.4 | 5.15 ± 0.38 | Cold | Partial response | 2/3 | 0/5 |
| CT26 | 1.3 ± 0.2 | 1.14 ± 0.31 | 7.5 ± 0.3 | 8.15 ± 0.44 | 1.5 ± 0.0 | 2.95 ± 0.73 | 8.9 ± 0.5 | 9.25 ± 0.98 | Hot | Responsive | 1/4 | 1/4 |
| MC38 | 1.3 ± 0.2 | 1.48 ± 0.2 | 7.7 ± 0.4 | 7.62 ± 0.28 | 1.3 ± 0.2 | 1.73 ± 0.42 | 7.1 ± 0.5 | 8.25 ± 0.6 | Hot | Responsive | 0/5 | 0/5 |
| Renca | 1.5 ± 0.0 | 0.77 ± 0.46 | 9.5 ± 0.5 | 9.99 ± 0.3 | 1.5 ± 0.0 | 0.29 ± 0.21 | 11.3 ± 0.8 | 10.15 ± 1.09 | Hot/Cold | Responsive | 0/5 | 0/5 |
| 4T1 | 1.2 ± 0.2 | 1.49 ± 0.39 | 11.9 ± 0.7 | 9.05 ± 0.4 | 1.3 ± 0.2 | 0.83 ± 0.23 | 12.6 ± 0.3 | 8.11 ± 0.41 | Hot | Responsive | 0/5 | 0/5 |
| Sa1N | 1.0 ± 0.0 | 1.82 ± 0.66 | 15.6 ± 1.4 | 8.49 ± 0.44 | 1.8 ± 0.6 | 1.57 ± 0.41 | 15.6 ± 0.8 | 7.26 ± 0.4 | Hot | Responsive | 2/3 | 2/3 |
Values are mean ± SEM. %ID/g: % injected dose per gram tissue.
CD4+ and CD8a+ PET imaging in syngeneic mouse models
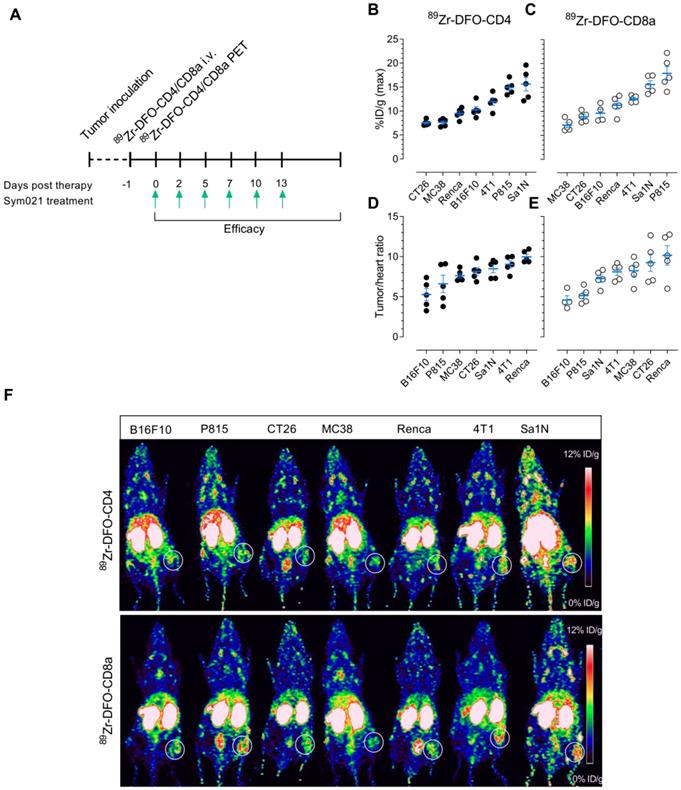
Baseline PET imaging of CD4+ and CD8a+ was conducted in the same panel of syngeneic mouse models prior to treatment with Sym021 to evaluate the predictive value of TIL imaging for treatment response across various tumor types (Figure 4A). Quantitative ROI analysis of 89Zr-DFO-CD4 maximum tumor uptake is depicted in Figure 4B ranked from high to low and revealed uptake levels of 15.6 ± 1.4 (Sa1N), 14.9 ± 0.65 (P815), 11.9 ± 0.74 (4T1), 10.2 ± 0.67 (B16F10), 9.5 ± 0.5 (Renca), 7.65 ± 0.35 (MC38) and 7.53 ± 0.25 (CT26) %ID/g. Likewise, 89Zr-DFO-CD8a uptake is illustrated in Figure 4C and was 17.9 ± 1.4 (P815), 15.6 ± 0.8 (Sa1N), 12.6 ± 0.3 (4T1), 11.3 ± 0.84 (Renca), 9.6 ± 0.9 (B16F10), 8.9 ± 0.5 (CT26) and 7.1 ± 0.5 (MC38) %ID/g. Tumor-to-heart ratios (tumormax/heartmean) were calculated to correct for activity remaining in the blood and were 9.99 ± 0.3 (Renca), 9.05 ± 0.4 (4T1), 8.49 ± 0.44 (Sa1N), 8.15 ± 0.44 (CT26), 7.62 ± 0.28 (MC38), 6.61 ± 0.96 (P815) and 5.28 ± 0.68 (B16F10) for 89Zr-DFO-CD4 (Figure 4D). Similarly, the 89Zr-DFO-CD8a tumor-to-heart ratios are illustrated in Figure 4E and were 10.15 ± 1.09 (Renca), 9.25 ± 0.98 (CT26), 8.25 ± 0.6 (MC38), 8.11 ± 0.41 (4T1), 7.26 ± 0.4 (Sa1N), 5.15 ± 0.38 (P815) and 4.6 ± 0.67 (B16F10). Representative maximum intensity projection PET images for each model are shown in Figure 4F, where 89Zr-DFO-CD4 and 89Zr-DFO-CD8a clearly visualized the tumors 24 hours post-injection. Representative axial PET/CT images of the tumor and heart for each model are shown in Figure S5. Mean tumor uptake and tumor-to-heart (tumormean/heartmean) ratios are depicted in Figure S6A-B. Overall, the mean and maximum tumor-to-heart ratios of 89Zr-DFO-CD4 and 89Zr-DFO-CD8a were in agreement with flow cytometric analysis of CD4+ (Figure S6C-D, top panel) and CD8a+ (Figure S6C-D, bottom panel) numbers across syngeneic mouse tumor models.
Experimental design and PET imaging of 89Zr-DFO-CD4 and 89Zr-DFO-CD8a in a panel of syngeneic mouse models. (A) Overview of the timing of tumor inoculation, 89Zr-DFO-CD4 and 89Zr-DFO-CD8a injections, PET imaging and therapy dosing. Sym021 (10 mg/kg) was dosed 6 times over two weeks and efficacy monitored until humane endpoints were reached. (B) Maximum 89Zr-DFO-CD4 and (C) 89Zr-DFO-CD8a uptake in syngeneic mouse models quantified from PET ROI analysis of tumors and expressed as %ID/g 24 hours post-injection of tracer ranked from low (left) to high (right). Tumor-to-heart ratios of the maximum (D) 89Zr-DFO-CD4 and (E) 89Zr-DFO-CD8a uptake quantified from PET ROI analysis and expressed as %ID/g 24 hours post-injection of tracer ranked from low (left) to high (right). (F) Representative coronal maximum intensity projection PET images of 89Zr-DFO-CD4 (top panel) and 89Zr-DFO-CD8a (bottom panel) for each model. The PET acquisition time was 300 seconds. White circles designate the tumor. Data are presented as mean ± SEM. %ID/g: % injected dose per gram tissue.
Tumor growth response to Sym021
Following PET imaging, mice were subjected to immunotherapy with Sym021. All groups, within each model and across models, had equal mean tumor volumes at day -1 relative to start of therapy (Figure S7). Tumor growth curves for Sym021 treated mice (N=10/group) are shown in Figure 5 for each model and were compared to corresponding vehicle-treated animals (N=5/group) that were not subjected to CD4+ or CD8a+ PET imaging. Sym021 effectively inhibited tumor growth in CT26 (p=0.0029), MC38 (p=0.0002), Renca (p<0.0001), 4T1 (p=0.0011) and Sa1N (p<0.0001) at 10 mg/kg. No overall effect of Sym021 was found in B16F10 (p=0.49) and P815 (p=0.1721) tumor models. Mice were terminated when reaching humane endpoints or at study end at day 65, where no signs of tumor regrowth was apparent. Due to issues with wound formation and/or necrosis in certain models humane endpoints were reached prematurely for P815 (~500 mm3) and 4T1 (~1000 mm3).
Efficacy of immunotherapy with Sym021 in syngeneic mouse models. Therapy with Sym021 (green) at 10 mg/kg over two weeks effectively inhibited tumor growth in CT26 (p=0.0029), MC38 (p=0.0002), Renca (p<0.0001), 4T1 (p=0.0011) and Sa1N (p<0.0001) compared to vehicle-treated animals (grey). No effect of Sym021 was observed in B16F10 (p=0.49) and P815 (p=0.1721) tumor models. The grey area indicates the treatment period. Mice were euthanized after first tumor measurement above 1,500 mm2 except in the case of the P815 and 4T1 model, where humane endpoints were reached prematurely. Mean tumor volumes of treatment groups are presented with carry-forward of tumor volumes from euthanized mice until the last day where >50% of the group was alive. N=5 for vehicle-treated animals, N=10 for Sym021 treated animals. Data are presented as mean ± SEM and the significance levels are indicated by asterisks (*). * = p<0.05, ** = p<0.01, *** = p<0.001, **** = p<0.0001.
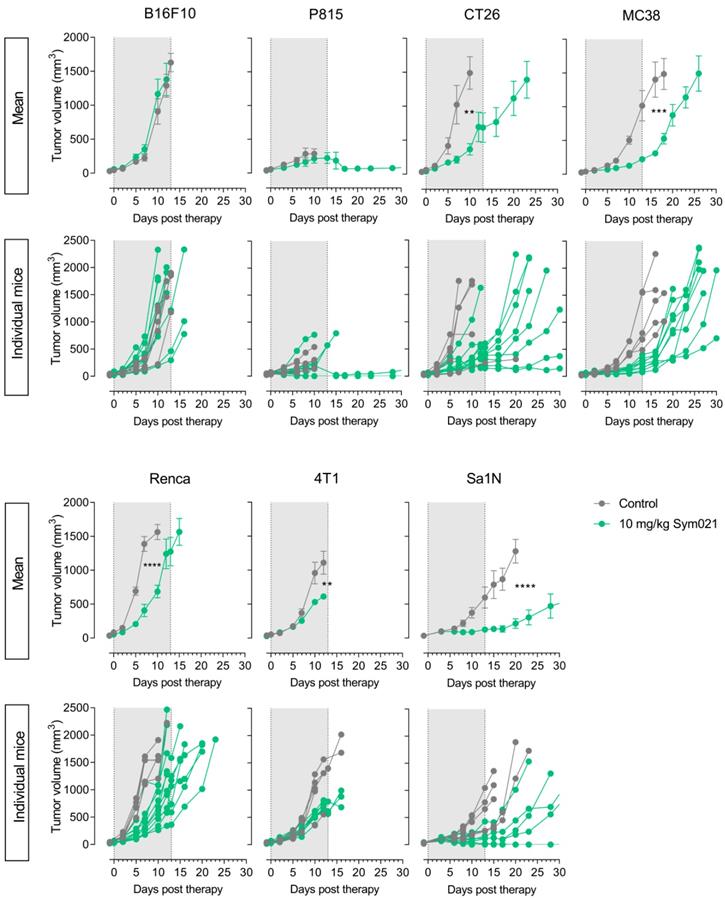
It is noteworthy, that inter-model efficacy seemed to be overall associated with the immune status, since models with the highest number of CD4+ and CD8a+ cells according to combined IHC, flow cytometry and PET tumor-to-heart ratios (Sa1N, 4T1, CT26 and MC38), demonstrated significantly reduced tumor growth in response to Sym021 (Figure 3B-C). In contrast, models with the lowest numbers of CD4+ and CD8a+ cells (B16F10 and P815) exhibited no response to Sym021.
Sym021 efficacy correlates with PET imaging of tumor-infiltrating lymphocytes
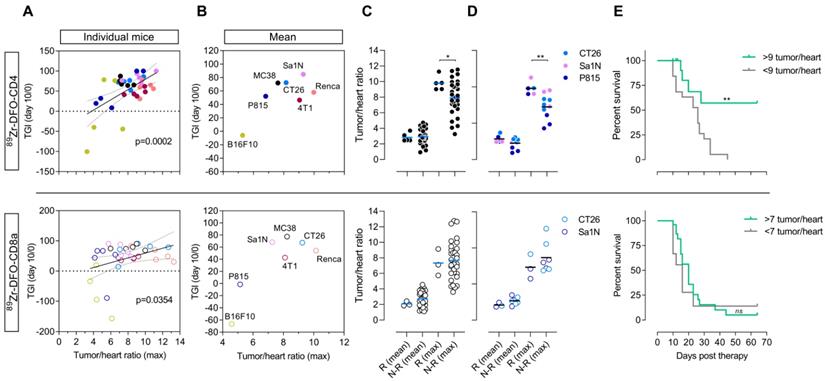
To investigate the predictive value of 89Zr-DFO-CD4 and 89Zr-DFO-CD8a the TGI from day 0 to day 10 in Sym021 treated mice relative to the growth of the control group was compared to the maximum baseline tumor-to-heart ratio of 89Zr-DFO-CD4 and 89Zr-DFO-CD8a. Day 10 was the latest day post-therapy initiation with sufficient mice in the control group across models. The relative tumor growth against PET tumor-to-heart ratio was plotted for individual mice across all tumor models (Figure 6A) as well as for the mean of each tumor model (Figure 6B). Color coding of the different models clearly demonstrated the heterogeneity within each model and across models. The maximum 89Zr-DFO-CD4 (p=0.0002) and 89Zr-DFO-CD8a (p=0.0354) tumor-to-heart ratio were found to correlate with the relative TGI at day 10 post therapy initiation, although the correlation appeared stronger for 89Zr-DFO-CD4. There was no association between the mean 89Zr-DFO-CD4 (p=0.0817) or 89Zr-DFO-CD8a (p=0.0651) tumor-to-heart ratio and the relative TGI at day 10 post therapy initiation (Figure S8).
89Zr-DFO-CD4 PET predicts Sym021 treatment outcome in syngeneic mouse models. (A) The tumor growth inhibition (TGI) from day 0 til day 10 in Sym021 treated mice (10 mg/kg) relative to the growth of the control group expressed as % correlated with the maximum tumor-to-heart ratio of 89Zr-DFO-CD4 (p=0.0002, top panel) and 89Zr-DFO-CD8a (p=0.0354, bottom panel) in individual mice across all models (N=35/tracer). (B) Average TGI until day 10 relative to start of therapy with 10 mg/kg Sym021 (day 0) expressed as % for each model plotted against the average maximum tumor-to-heart ratio of 89Zr-DFO-CD4 (top panel) and 89Zr-DFO-CD8a (bottom panel) for each model (N=35/tracer, N=5/model). (C) Mean and maximum tumor-to-heart ratio of 89Zr-DFO-CD4 (top panel) and 89Zr-DFO-CD8a (bottom panel) in responders (Rs) and non-responders (N-Rs) across all models (N=35/tracer). Responders (N=5) had higher maximum 89Zr-DFO-CD4 tumor-to-heart ratio than all non-responders (N=30) (p=0.0306, top panel). (D) Mean and maximum tumor-to-heart ratio of 89Zr-DFO-CD4 (top panel) and 89Zr-DFO-CD8a (bottom panel) in responders and non-responders of the models where responders were found. Responders (N=5) had higher maximum 89Zr-DFO-CD4 tumor uptake than the non-responders of the models were responders were found (N=10) (p=0.0097, top panel). (E) Stratification of mice across all models based on their maximum tumor-to-heart ratio of 89Zr-DFO-CD4 (top panel) and 89Zr-DFO-CD8a (bottom panel) resulted in improved overall survival of mice with a maximum 89Zr-DFO-CD4 tumor-to-heart ratio >9 (N=5) compared to the <9 group (N=30) (p=0.0018). All tumor and heart uptake values of 89Zr-DFO-CD4 and 89Zr-DFO-CD8a were derived from PET ROI analysis and expressed as %ID/g. Data are presented as mean ± SEM and the significance levels are indicated by asterisks (*). * = p<0.05, ** = p<0.01, *** = p<0.001, **** = p<0.0001, ns = no significance. N-Rs: non-responders; ROI: region of interest; Rs: responders; %ID/g: % injected dose per gram tissue.
89Zr-DFO-CD4 predicts treatment outcome
As evident from the tumor growth curves in Figure 5, three of the Sym021 responding tumor models showed pronounced effect on tumor growth with 1-2 responders in each model that did not regrow during the entire study period of 65 days. Responders among mice subjected to pre-therapy 89Zr-DFO-CD4 PET were found in the CT26 (N=1), Sa1N (N=2) and P815 (N=2) models. Responders among mice subjected to pre-therapy 89Zr-DFO-CD8a PET included CT26 (N=1) and Sa1N (N=2). When comparing the mean and maximum 89Zr-DFO-CD4 tumor-to-heart ratios of responders (N=5) and non-responders among all mice (N=30), irrespective of tumor model, a significantly increased maximum 89Zr-DFO-CD4 tumor-to-heart ratio was found in the responders (p=0.0306) (Figure 6C, top panel). This difference was more prominent when comparing the intra-model responders (N=5) with non-responders (N=10, p=0.0097) (Figure 6D, top panel). No difference in the 89Zr-DFO-CD4 mean tumor-to-heart ratio was found when comparing responders with non-responders among all mice (p=0.8298) or intra-model mice (p=0.1529). Further, no difference between the maximum 89Zr-DFO-CD8a tumor-to-heart ratio in responding mice (N=3) was found when comparing to all non-responding mice (N=32, p=0.8248) nor intra-model mice (N=12, p=0.9352) (Figure 6C-D, bottom panel).
All mice in the baseline 89Zr-DFO-CD4 responding group presented with a maximum tumor-to-heart ratio >9 (average 9.79 ± 0.37), whereas the non-responding group presented with a maximum 89Zr-DFO-CD4 tumor-to-heart ratio of 7.73 ± 0.35. We therefore speculated whether the maximum 89Zr-DFO-CD4 tumor-to-heart ratio could be used to stratify mice into subgroups that respond to Sym021 and predict overall survival. Based on the maximum 89Zr-DFO-CD4 tumor-to-heart ratio in the Sym021 responding group, 9 was chosen as cut-off value in a retrospective analysis. Overall survival was improved in mice with a tumor-to-heart ratio >9 of 89Zr-DFO-CD4 (p=0.0018), with a median survival of 51 days compared to 23 days in the <9 group (Figure 6E, top panel). A similar analysis was performed for 89Zr-DFO-CD8a, where the tumor-to-heart ratio of the responding group was 7.32 ± 0.63. Overall survival was not improved in mice with a tumor-to-heart ratio >7 of 89Zr-DFO-CD8a (p=0.5037), with a median survival of 20 days compared to 16 days in the <7 group (Figure 6E, bottom panel).
Discussion
Immunotherapy has recently emerged as a particularly effective strategy for treating several types of cancer. Sym021 is a newly developed, humanized antibody targeting the PD-L1/PD-1 interaction between tumor cells and cells of the immune system, boosting the reactivity of primarily PD-1 expressing T lymphocytes towards tumor cells [33]. Alongside the rapid development of immune-targeting agents the necessity of developing methods for reliably identifying patients that would respond to therapy becomes apparent. Companion diagnostic methods should preferably be non-invasive and sensitive to the dynamic changes in immune populations to ease the translation into clinical use. In the present study, we developed specific tracers for non-invasive PET imaging of CD4+ and CD8a+ cells to enable quantification of these lymphocytes on a whole-body level in mice. We applied the developed PET procedures to seven different syngeneic mouse tumor models and demonstrate that 89Zr-DFO-CD4 can be a predictor of tumor growth response and overall survival to Sym021.
After successful radiolabeling the tracers retained in vitro binding to target with immuno-reactivities > 85%. In vivo studies with 89Zr-DFO-CD8a showed effective targeting to CD8a+ tissue, i.e. lymph nodes and spleen in antigen-positive mice. The accumulation of tracer in lymphoid tissue was extremely high as expected for antigen-dense tissues. This phenomenon, commonly referred to as the antigen-sink, typically results in faster clearance at low antibody doses [34]. We therefore titrated the total protein dose to saturate endogenous target and increase the availability of the tracer for tumor accumulation. Co-dosing with CD8a-F(ab)'2 increased the tumor uptake ~2-3 fold, which is quite substantial considering the relatively low target-abundance as opposed to tumor surface markers. The co-dosing strategy in the development of antibody-based PET tracers is increasingly debated. To visualize a target that is more abundant in non-tumor tissues is not a common approach in the utilization of PET within oncology. Therefore, a dose optimization can be essential to obtain sufficient imaging signal, however, with the risk of also perturbing the binding of tracers to intratumoral T cells. Importantly, the 30 µg co-dose did not block tumor uptake as illustrated by the tumor-to-background ratios in this study. In addition, the splenic uptake was not blocked completely (12.17 ± 2.15 %ID/g, 30 µg) when comparing to non-blocked mice (147.9 ± 8.1 %ID/g). Thus, a good balance between blocking the antigen sink without displacing tumor uptake was achieved.
A similar uptake in spleen and lymph nodes was previously shown by Tavaré et al., who developed CD8a-targeting antibody-based PET probes of similar size, such as the 64Cu-NOTA-Mbs (~80 kD) [35]. Compared to 64Cu-NOTA-Mbs, 89Zr-DFO-CD8a exhibited higher kidney accumulation (~4-6 vs. 16 ± 3.9 %ID/g, 4 hours p.i.). This can be explained by the higher protein dose injected (4-12 µg 64Cu-NOTA-Mbs vs. 30 µg 89Zr-DFO-CD8a), which can lead to a higher aggregation state since high antibody concentrations can promote protein association and thus kidney trapping [36-38]. Furthermore the longer circulation time of 89Zr-DFO-CD8a compared to 64Cu-NOTA-Mbs (11.3 ± 0.09 vs. ~1 %ID/g, 4 hours p.i.) probably contributes to the kidney uptake due to the highly perfused nature of this organ. Lastly, the low pH environments that may exist in the kidneys and Kupffer cell lysosomes have been suggested to contribute to transchelation of 89Zr at these sites [39].
The target-specificity was further examined by depletion studies, where the lowered number of CD8a+ cells in tumors and spleens of CD8a+ depleted mice as confirmed by flow cytometry, was detected by 89Zr-DFO-CD8a PET. However, CD8a+ depleted mice accumulated some degree of tracer in tumors despite normalizing to the blood pool. Reasons for this could be multi-fold. PET imaging was not conducted in the same mice as used for flow cytometry and even though all mice were treated equally with CD8a+ depleting antibody depletion might have been insufficient in some mice. Another causative factor could be the enhanced permeability and retention (EPR) effect contributing to non-specific uptake of larger proteins such as antibodies and fragments hereof in tumors [40]. The tumor-to-blood ratio of 89Zr-DFO-IgG2b was ~ 2 and represents the non-specific uptake of 89Zr-DFO-CD8a. Adding to this, an inflamed tumor microenvironment created by high therapeutic doses of immune-perturbing antibody could also contribute to a further increased permeability and retention of 89Zr-DFO-CD8a in tumors [41,42].
CD8a+ is mainly expressed on effector T cells but can also be found on regulatory T cells, natural killer cells and dendritic cells [43,44], all of which can be found at an early disease state in the tumor microenvironment [45,46]. This is also in line with previous studies suggesting that agents targeting immune populations might have pleiotropic effects on T cell dynamics as well as inducing immune cell trafficking into tumors [47]. It is crucial to the development of new imaging agents that they are biologically inert, especially when targeting immune cells. Importantly, we confirmed that our F(ab)'2 based agents lacking the Fc domain do not deplete CD8a+ cells in vivo and thus do not display any Fc-dependent biological activity, as expected.
The ability of 89Zr-DFO-CD8a to detect changes in response to radiation therapy was not limited to tumoral CD8a+ cell infiltration, but whole-body effects such as increased splenic infiltration were also detected, which was confirmed by flow cytometric analysis. These results underline the additive value of whole-body visualization with PET imaging, when monitoring dynamic populations such as trafficking T lymphocytes.
Unlike spontaneous-derived tumors in humans, syngeneic tumors are often engrafted subcutaneously in a microenvironment that is distinct from the site of origin and progress more rapidly than most spontaneous human tumors. Despite these differences from human cancer, each syngeneic tumor model is likely to be more or less immunogenic and have a unique immunophenotype that may reflect tumor profiles in humans. Indeed, studies of the immune infiltrate in subcutaneous versus orthotopic tumors in mice have shown differences in numbers, subtypes and the distribution of immune cell populations, suggesting that the efficacy of tumor-immune modulating agents might be different between inoculation sites [48]. The level of CD4+ and CD8+ infiltration however, has been shown to be similar between subcutaneous and orthotopic colon or renal cancer models [49,50]. Nevertheless, orthotopic tumors are generally considered to be more immuno-suppressive in nature and less sensitive to immunotherapy than their subcutaneous counterparts [48]. Here we assessed the T cell infiltrate in multiple syngeneic mouse models representing various types of solid cancers of colon, breast, kidney and skin - tumor types among which PD-1/PD-L1 blockade has shown clinical success [51-53]. Syngeneic tumor models were initially characterized by common ex vivo methods, IHC and flow cytometry of tumors, and classified into “hot” and “cold” tumors. The hot and highly immunogenic tumor models (Sa1N, CT26, MC38 and 4T1) were responsive to Sym021 treatment. The cold and poorly immunogenic tumor models B16F10 and P815 did not respond to Sym021 treatment. This response to immune checkpoint therapy as well as relative CD4+ and CD8a+ tumor numbers in syngeneic tumor models were similar to reported elsewhere [54-57].
When merely looking at the PET tumor uptake of 89Zr-DFO-CD4 and 89Zr-DFO-CD8a across syngeneic mouse models, imaging of CD4+ and CD8a+ cells did not completely match the assessment of immune status by IHC and flow cytometry in this study with discrepancies mainly found among the immunogenic CT26 and MC38 models (low uptake) and poorly immunogenic P815 (high uptake) model. However, when correcting for background levels of tracer, we found a good agreement between the mean and maximum tumor-to-heart ratios and flow cytometric analysis of CD4+ and CD8a+, which makes sense from a physiological perspective when assessing different tumor types. Several factors besides target abundance are known to influence tumor accumulation of compounds and larger molecules, such as micro-vessel density, vascular permeability, stromal content, intra-tumoral pressure and diffusion. Different tumor types display a great deal of heterogeneity. Moreover, a large degree of heterogeneity is also found within tumors of the same type. Indeed, tumor growth responses to anti-PD-1 antibody Sym021 therapy were rather heterogeneous across models and within models consistent with the variable therapeutic responses to monotherapy with PD-1 inhibitors seen among patients [58]. For these reasons, all concurrent analyses of the utility of 89Zr-DFO-CD4/89Zr-DFO-CD8a PET as predictors of immunotherapeutic response were based on the background corrected tumor-to-heart values.
We utilize here a diverse panel of syngeneic tumors to represent the heterogeneity found within patient tumors with respect to differences in vascularization, contributions to the EPR effect and response to PD-1 checkpoint inhibition, and found that maximum tumor-to-heart values of 89Zr-DFO-CD8a and to a larger degree 89Zr-DFO-CD4 were indicators of response to therapy. Interestingly, no association between the mean tumor-to-heart ratios of 89Zr-DFO-CD4 or 89Zr-DFO-CD8a and tumor growth response to therapy was found. Maximum values of tumor imaging markers are the preferred choice clinically and have become the de facto standard [59]. Additionally, they largely relate more strongly to prognosis as they reflect the most aggressive phenotype of the tumor [60,61]. Moreover, in the context of immune cell markers maximum values might be even more applicable as immune cells are more dynamic, migrate and cluster at inflamed sites. In addition, it was demonstrated that when individual tumors were divided into groups with a maximum tumor-to-heart ratio above or below 9, 89Zr-DFO-CD4 stratified the population into responders and non-responders to Sym021 therapy. Yet, the fraction of responders was limited to 5 out of 35 treated mice distributed among 3 models and the predictivity of 89Zr-DFO-CD4 PET thus might be limited to certain tumor types.
To the best of our knowledge this is the first report on the predictive value of CD4+ PET imaging in oncology mouse models. A 89Zr-labeled CD4+ cDb has been evaluated in naïve [23] and colitis [62] mice as well as a model of hematopoietic stem cell transplantation [63]. Probes targeting CTLA-4 [20,64], which is generally expressed on activated T cells, and CD3+ [22], a global T cell marker, have shown success in discriminating responders from non-responders after immunotherapy was initiated. In contrast, attention in other previous studies has focused on the cytotoxic CD8+ T cells. In these studies it was also indicated that immuno-PET strategies were successful with correlating post-therapy CD8+ PET imaging and response to immunotherapy in a few animal models [24,25,65]. Also, the CD8+-targeting minibody 89Zr-IAB22M2C is currently being tested clinically in patients undergoing immunotherapy [66]. The radiotracers developed in our study are targeting murine CD4+ and CD8a+ cells. Accordingly, our probes can be used in preclinical studies using syngeneic tumor models enabling investigation of immunotherapy drugs in a host with a fully functional immune system. Currently, the majority of preclinical work within immuno-oncology development is indeed undertaken in such syngeneic tumor models and therefore we believe our probes are important additions to the available armamentarium within this research field. Further, to our knowledge no probes specific for CD4+ are presently being evaluated for immunotherapy assessment in the clinic. Indeed, the role of CD4+ T cells in the tumor microenvironment is of growing interest as these cells have been shown to be required for efficacious anti-tumor immunity and can target tumor cells in various ways (reviewed by Borst et. al. [8]). However, the presence of several different subtypes of CD4+ T cells with opposing actions on anti-tumor activity in the tumor microenvironment has confounded the efforts to specifically induce CD4+ T cell responses for cancer immunotherapy. Tumor-specific CD4+ T cells in the tumor microenvironment can be reprogrammed into regulatory CD4+ T cells (Tregs) that counteract cytotoxic T cell activity and are generally considered to contribute to an immuno-suppressive tumor microenvironment. The proportion of CD4+ Tregs to total CD4+ in the tumor microenvironment of syngeneic tumors however, has been reported to ~ 0.5-8% [54,56]. Further, it should be noted that CD4+ Treg infiltration and accumulation can correlate with a positive prognosis in certain malignancies, including colorectal, gastric and NSCLC cancer [67-69]. Also, preclinical and clinical studies have shown that CD4+ T cells can induce durable immune-mediated tumor control, and in some cases to an even larger extent than CD8+ T cells [7,70-72]. Together, these findings place CD4+ T cells as a highly relevant actor in tumor immunity and thus a potential, central prognostic marker for outcome of cancer immunotherapy. As opposed to the sole purpose of CD8+ T cells at the tumor site, the multifaceted and wide-ranging role of CD4+ T cells potentially makes CD4+ a better target for following T cell activity by PET imaging. By exploiting humane antibodies, the F(ab)'2 imaging approach described here can easily be modified into clinical use warranting the further development of a human version of 89Zr-DFO-CD4.
The immune frame-work in and around tumors is complex, making it difficult to identify broad biomarkers embracing a wide range of patients. The presence of many additional immune subsets, such as myeloid-derived suppressor cells and tumor-associated macrophages, in the periphery and the tumor microenvironment has been suggested to be a key denominator for the outcome of immunotherapy [73]. Imaging markers directly reflecting the functional status, i.e. activation or exhaustion state of specific cells, have the potential to be more predictive [74] and PET imaging of activated T cells has successfully been pursued [75,76] in addition to the secreted activation markers Granzyme B [77] and IFNγ [78]. Indeed, it can be debated whether a specific cellular subtype and/or activation state or the simple presence of immune cells in the tumor microenvironment is the paramount biomarker of immunotherapeutic response. Nevertheless, the PET signal from low abundance cell populations might not be sensitive enough to detect changes in response and imaging of CD4+ or CD8a+ TILs might be a useful surrogate. Future studies with a radioisotope with a shorter half-life, such as 64Cu (t1/2=12.7 hours) will enable multiple scans during and after treatment and ease the interpretation of data since the baseline T cell infiltration can vary widely, as demonstrated in this study.
Conclusions
In the present study, we developed and validated the specificity of PET imaging radiotracers for whole-body detection and assessment of CD4+ and CD8a+ status in preclinical mouse models. These radiotracers are promising candidates as powerful, non-invasive predictors of response during the course of therapy, as they can be used to phenotype tumors at an early stage and yet allow following the treatment response within the same animal at multiple timepoints. To the best of our knowledge, this is the first report demonstrating predictivity of tumor growth response and survival using a CD4+-targeting PET tracer. Furthermore, it is the first study linking individual baseline CD4+ or CD8a+ levels as visualized by PET to overall response to immune checkpoint inhibition. The murine F(ab)'2 imaging approach described here can easily be modified into clinical use with human antibodies and the potential extends beyond oncology with probable value in any CD4+ or CD8a+ driven indication.
Abbreviations
%ID/g: % injected dose per gram tissue; 89Zr: zirconium-89; ANOVA: analysis of variance; BSA: bovine serum albumin; CD3: cluster of differentiation 3; CD4: cluster of differentiation 4; CD8a: cluster of differentiation 8 alpha; CT: computed tomography; CTLA-4: cytotoxic T-lymphocyte-associated protein 4; DFO: desferrioxamine; DMSO: dimethyl sulfoxide; EDTA: ethylenediaminetetraacetic acid; FACS: fluorescence activated cell sorting; FBS: fetal bovine serum; Fc: fragment crystallizable region; HPLC: high-performance liquid chromatography; IFNγ: interferon gamma; IgG: immunglobulin G; IHC: Immunohistochemistry; LDS: lithium dodecyl sulfate; mAb: monoclonal antibody; MACS: magnetic activating cell sorting; MBq: mega becquerel; MFI: median fluorescent intensity; NaHCO3: sodium bicarbonate; Na2CO3: sodium carbonate; SDS: sodium dodecyl sulfate; PBS: phosphate buffered saline; PD-1: programmed cell death protein 1; PD-L1: programmed death-ligand 1; PET: positron emission tomography; SCN-Bn-DFO: p-SCN-Bn-Desferrioxamine; PS: penicillin-streptomycin; radio-TLC: radio-thin-layer chromatography; ROIs: region of interests; SEM: standard error of mean; TGI: tumor growth inhibition; TILs: tumor-infiltrating lymphocytes; TLC: thin-layer chromatography; XRT: external radiation therapy.
Supplementary Material
Supplementary figures and tables.
Acknowledgements
This project received funding from the European Union's Horizon 2020 research and innovation programme under grant agreements no. 670261 (ERC Advanced Grant) and 668532 (Click-It), the Lundbeck Foundation, the Novo Nordisk Foundation, the Innovation Fund Denmark, the Danish Cancer Society, Arvid Nilsson Foundation, Svend Andersen Foundation, the Neye Foundation, the Research Foundation of Rigshospitalet, the Danish National Research Foundation (grant 126), the Research Council of the Capital Region of Denmark, the Danish Health Authority, the John and Birthe Meyer Foundation and Research Council for Independent Research.
Financial support
This project received funding from the European Union's Horizon 2020 research and innovation programme under grant agreements no. 670261 (ERC Advanced Grant) and 668532 (Click-It), the Lundbeck Foundation, the Novo Nordisk Foundation, the Innovation Fund Denmark, the Danish Cancer Society, Arvid Nilsson Foundation, Svend Andersen Foundation, the Neye Foundation, the Research Foundation of Rigshospitalet, the Danish National Research Foundation (grant 126), the Research Council of the Capital Region of Denmark, the Danish Health Authority, the John and Birthe Meyer Foundation and Research Council for Independent Research.
Competing Interests
C.F., M.C.M., T.T.P., G.R.G, J.L., I.D.H. and M.K. are employed by Symphogen A/S that holds the right of Sym021. All other authors declare no competing interests.
References
1. Pardoll DM. The blockade of immune checkpoints in cancer immunotherapy. Nat Rev Cancer. 2012;12:252-264
2. Tang J, Shalabi A, Hubbard-Lucey VM. Comprehensive analysis of the clinical immuno-oncology landscape. Ann Oncol. 2018;29:84-91
3. Wolchok JD, Chiarion-Sileni V, Gonzalez R, Rutkowski P, Grob J-J, Cowey CL. et al. Overall Survival with Combined Nivolumab and Ipilimumab in Advanced Melanoma. N Engl J Med. 2017;377:1345-1356
4. Bai X, Gao J, Liu J, Wen J, Zheng P, Liu Y. On the site and mode of antigen presentation for the initiation of clonal expansion of CD8 T cells specific for a natural tumor antigen. Cancer Res. 2001;61:6860-6867
5. Thompson ED, Enriquez HL, Fu Y, Engelhard VH. Tumor masses support naive T cell infiltration, activation, and differentiation into effectors. J Exp Med. 2010;207:1791-1804
6. Kim HJ, Cantor H. CD4 T-cell subsets and tumor immunity: the helpful and the not-so-helpful. Cancer Immunol Res. 2014;2:91-98
7. Melssen M, Slingluff Jr. CL. Vaccines targeting helper T cells for cancer immunotherapy. Curr Opin Immunol. 2017;47:85-92
8. Borst J, Ahrends T, Bąbała N, Melief CJM, Kastenmüller W. CD4+ T cell help in cancer immunology and immunotherapy. Nat Immunol. 2018;18:635-647
9. Quezada SA, Simpson TR, Peggs KS, Merghoub T, Vider J, Fan X. et al. Tumor-reactive CD4+ T cells develop cytotoxic activity and eradicate large established melanoma after transfer into lymphopenic hosts. J Exp Med. 2010;207:637-650
10. Takeuchi A, Bads Mel S, Miyauchi K, Ishihara C, Onishi R, Guo Z. et al. CRTAM determines the CD4+ cytotoxic T lymphocyte lineage. J Exp Med. 2016;213:123-138
11. Gooden MJM, De Bock GH, Leffers N, Daemen T, Nijman HW. The prognostic influence of tumour-infiltrating lymphocytes in cancer: a systematic review with meta-analysis. Br J Cancer. 2011;105:93-103
12. Tumeh PC, Harview CL, Yearley JH, Shintaku IP, Taylor EJM, Robert L. et al. PD-1 blockade induces responses by inhibiting adaptive immune resistance. Nature. 2014;515:568-571
13. Hadrup S, Donia M, Thor Straten P. Effector CD4 and CD8 T cells and their role in the tumor microenvironment. Cancer Microenviron. 2013;6:123-133
14. Fridman WH, Pagès F, Sautès-Fridman C, Galon J. The immune contexture in human tumours: impact on clinical outcome. Nat Rev Cancer. 2012;12:298-306
15. Gentles AJ, Newman AM, Liu CL, Bratman S V, Feng W, Kim D. et al. The prognostic landscape of genes and infiltrating immune cells across human cancers. Nat Med. 2015;21:938-945
16. Galon J, Costes A, Sanchez-Cabo F, Kirilovsky A, Mlecnik B, Lagorce-Pagès C. et al. Type, density, and location of immune cells within human colorectal tumors predict clinical outcome. Science. 2006;313:1960-1964
17. Hettich M, Braun F, Bartholomä MD, Schirmbeck R, Niedermann G. High-Resolution PET Imaging with Therapeutic Antibody-based PD-1/PD-L1 Checkpoint Tracers. Theranostics. 2016;6:1629-1640
18. Natarajan A, Mayer AT, Reeves RE, Nagamine CM, Gambhir SS. Development of Novel ImmunoPET Tracers to Image Human PD-1 Checkpoint Expression on Tumor-Infiltrating Lymphocytes in a Humanized Mouse Model. Mol Imaging Biol. 2017;19:903-914
19. England CG, Jiang D, Ehlerding EB, Rekoske BT, Ellison PA, Hernandez R. et al. 89Zr-labeled nivolumab for imaging of T-cell infiltration in a humanized murine model of lung cancer. Eur J Nucl Med Mol Imaging. 2018;45:110-120
20. Ehlerding EB, Lee HJ, Jiang D, Ferreira CA, Zahm CD, Huang P. et al. Antibody and fragment-based PET imaging of CTLA-4+ T-cells in humanized mouse models. Am J Cancer Res. 2018;9:53-63
21. Vera DRB, Smith CC, Bixby LM, Glatt DM, Dunn S, Saito R. et al. Immuno-PET imaging of tumor-infiltrating lymphocytes using zirconium-89 radiolabeled anti-CD3 antibody in immune-competent mice bearing syngeneic tumors. PLoS One. 2018;13:e0193832
22. Larimer BM, Wehrenberg-Klee E, Caraballo A, Mahmood U. Quantitative CD3 PET Imaging Predicts Tumor Growth Response to Anti-CTLA-4 Therapy. J Nucl Med. 2016;57:1607-1611
23. Freise AC, Zettlitz KA, Salazar FB, Lu X, Tavaré R, Wu AM. ImmunoPET Imaging of Murine CD4+ T Cells Using Anti-CD4 Cys-Diabody: Effects of Protein Dose on T Cell Function and Imaging. Mol Imaging Biol. 2017;19:599-609
24. Seo JW, Tavaré R, Mahakian LM, Silvestrini MT, Tam S, Ingham ES. et al. CD8+ T-cell density imaging with 64Cu-labeled cys-diabody informs immunotherapy protocols. Clin Cancer Res. 2018;24:4976-4987
25. Rashidian M, Ingram JR, Dougan M, Dongre A, Whang KA, Legall C. et al. Predicting the response to CTLA-4 blockade by longitudinal noninvasive monitoring of CD8 T cells. J Exp Med. 2017;214:2243-2255
26. Gjetting T, Gad M, Fröhlich C, Lindsted T, Melander MC, Bhatia VK. et al. Sym021, a promising anti-PD1 clinical candidate antibody derived from a new chicken antibody discovery platform. MAbs. 2019;11:666-680
27. Lindmo T, Boven E, Cuttitta F, Fedorko J, Bunn P. Determination of the Immunoreactive Fraction of Radiolabeled Monoclonal Antibodies by Linear Extrapolation to Binding at Infinite Antigen Excess. J Immunol Methods. 1984;72:77-89
28. Vegt E, de Jong M, Wetzels JFM, Masereeuw R, Melis M, Oyen WJG. et al. Renal Toxicity of Radiolabeled Peptides and Antibody Fragments: Mechanisms, Impact on Radionuclide Therapy, and Strategies for Prevention. J Nucl Med. 2010;51:1049-1058
29. Demaria S, Formenti SC. Role of T lymphocytes in tumor response to radiotherapy. Front Oncol. 2012;2:95
30. Chen DS, Mellman I. Elements of cancer immunity and the cancer-immune set point. Nature. 2017;541:321-330
31. Gajewski TF, Corrales L, Williams J, Horton B, Sivan A, Spranger S. Cancer Immunotherapy Targets Based on Understanding the T Cell-Inflamed Versus Non-T Cell-Inflamed Tumor Microenvironment. Adv Exp Med Biol. 2017;1036:19-31
32. Hegde PS, Karanikas V, Evers S. The where, the when, and the how of immune monitoring for cancer immunotherapies in the era of checkpoint inhibition. Clin Cancer Res. 2016;22:1865-1874
33. Freeman GJ, Long AJ, Iwai Y, Bourque K, Chernova T, Nishimura H. et al. Engagement of the PD-1 immunoinhibitory receptor by a novel B7 family member leads to negative regulation of lymphocyte activation. J Exp Med. 2000;192:1027-1034
34. Keizer RJ, Huitema ADR, Schellens JHM, Beijnen JH. Population pharmacokinetics of therapeutic monoclonal antibodies. Clin Pharmacokinet. 2010;49:493-507
35. Tavaré R, Mccracken MN, Zettlitz KA, Knowles SM, Salazar FB, Olafsen T. et al. Engineered antibody fragments for immuno-PET imaging of endogenous CD8+ T cells in vivo. Proc Natl Acad Sci U S A. 2014;111:1108-1113
36. Ratanji KD, Derrick JP, Dearman RJ, Kimber I. Immunogenicity of therapeutic proteins: influence of aggregation. J Immunotoxicol. 2014;11:99-109
37. Li W, Prabakaran P, Chen W, Zhu Z, Feng Y, Dimitrov D. Antibody Aggregation: Insights from Sequence and Structure. Antibodies. 2016;5:19
38. Lucas A, Price L, Schorzman A, Storrie M, Piscitelli J, Razo J. et al. Factors Affecting the Pharmacology of Antibody-Drug Conjugates. Antibodies. 2018;7:10
39. Pandya DN, Bhatt N, Yuan H, Day CS, Ehrmann BM, Wright M. et al. Zirconium tetraazamacrocycle complexes display extraordinary stability and provide a new strategy for zirconium-89-based radiopharmaceutical development. Chem Sci. 2017;8:2309-2314
40. Xenaki KT, Oliveira S, van Bergen En Henegouwen PMP. Antibody or Antibody Fragments: Implications for Molecular Imaging and Targeted Therapy of Solid Tumors. Front Immunol. 2017;8:1287
41. Siegler EL, Kim YJ, Wang P. Nanomedicine targeting the tumor microenvironment: Therapeutic strategies to inhibit angiogenesis, remodel matrix, and modulate immune responses. J Cell Immunother. 2016;2:69-78
42. Nehoff H, Parayath NH, Domanovitch L, Taurin S, Greish K. Nanomedicine for drug targeting: strategies beyond the enhanced permeability and retention effect. Int J Nanomedicine. 2014;4:2539-2555
43. Baume DM, Caligiuri MA, Manley TJ, Daley JF, Ritz J. Differential expression of CD8 alpha and CD8 beta is associated with MHC-restricted and non-MHC-restricted cytolytic effector cells. Cell Immunol. 1990;131:352-365
44. Pomiê C, Mênager-marcq I, Meerwijk JPM Van. Murine CD8+ regulatory T lymphocytes: the new era. Hum Immunol. 2008;69:708-714
45. Pitt JM, Marabelle A, Eggermont A, Soria J, Kroemer G, Zitvogel L. Targeting the tumor microenvironment: removing obstruction to anticancer immune responses and immunotherapy. Ann Oncol. 2016;27:1482-1492
46. Gajewski TF, Schreiber H, Fu YX. Innate and adaptive immune cells in the tumor microenvironment. Nat Immunol. 2013;14:1014-1022
47. Maute RL, Gordon SR, Mayer AT, Mccracken MN, Natarajan A, Ring NG. et al. Engineering high-affinity PD-1 variants for optimized immunotherapy and immuno-PET imaging. Proc Natl Acad Sci U S A. 2015;112:E6506-E6514
48. Coffelt SB, Visser KE De. Immune-mediated mechanisms influencing the efficacy of anticancer therapies. Trends Immunol. 2015;36:198-216
49. Zhao X, Li L, Starr TK, Subramanian S. Tumor location impacts immune response in mouse models of colon cancer. Oncotarget. 2017;8:54775-54787
50. Devaud C, Westwood JA, John LB, Flynn JK, Paquet-Fifield S, Duong CPM. et al. Tissues in different anatomical sites can sculpt and vary the tumor microenvironment to affect responses to therapy. Mol Ther. 2014;22:18-27
51. Motzer RJ, Escudier B, McDermott DF, George S, Hammers HJ, Srinivas S. et al. Nivolumab versus Everolimus in Advanced Renal-Cell Carcinoma. N Engl J Med. 2015;373:1803-1813
52. Borghaei H, Paz-Ares L, Horn L, Spigel DR, Steins M, Ready NE. et al. Nivolumab versus Docetaxel in Advanced Nonsquamous Non-Small-Cell Lung Cancer. N Engl J Med. 2015;373:1627-1639
53. Hamid O, Robert C, Daud A, Hodi FS, Hwu W-J, Kefford R. et al. Safety and tumor responses with lambrolizumab (anti-PD-1) in melanoma. N Engl J Med. 2013;369:134-144
54. Mosely SIS, Prime JE, Sainson RCA, Koopmann J-O, Wang DYQ, Greenawalt DM. et al. Rational selection of syngeneic preclinical tumor models for immunotherapeutic drug discovery. Cancer Immunol Res. 2017;5:29-42
55. Woo S, Turnis ME, Goldberg MV, Bankoti J, Selby M, Nirschl CJ. et al. Immune inhibitory molecules LAG-3 and PD-1 synergistically regulate T-cell function to promote tumoral immune escape. Cancer Res. 2012;72:917-927
56. Yu JW, Bhattacharya S, Yanamandra N, Kilian D, Shi H, Yadavilli S. et al. Tumor-immune profiling of murine syngeneic tumor models as a framework to guide mechanistic studies and predict therapy response in distinct tumor microenvironments. PLoS One. 2018;13:e0206223
57. Selby MJ, Engelhardt JJ, Johnston RJ, Lu LS, Han M, Thudium K. et al. Preclinical Development of Ipilimumab and Nivolumab Combination Immunotherapy: Mouse Tumor Models, In vitro Functional Studies, and Cynomolgus Macaque Toxicology. PLoS One. 2016;11:e0161779
58. Schmidt EV. Developing combination strategies using PD-1 checkpoint inhibitors to treat cancer. Semin Immunopathol. 2019;41:21-30
59. Wahl RL, Jacene H, Kasamon Y, Lodge MA. From RECIST to PERCIST: Evolving considerations for PET response criteria in solid tumors. J Nucl Med. 2009;50(Suppl 1):122S-150S
60. Lin C, Itti E, Haioun C, Petegnief Y, Luciani A, Dupuis J. et al. Early 18F-FDG PET for prediction of prognosis in patients with diffuse large B-Cell lymphoma: SUV-based assessment versus visual analysis. J Nucl Med. 2007;48:1626-1632
61. Nielsen CH, Jensen MM, Kristensen LK, Dahlman A, Fröhlich C, Jacobsen HJ. et al. In vivo imaging of therapy response to a novel Pan-HER antibody mixture using FDG and FLT positron emission tomography. Oncotarget. 2015;6:37486-37499
62. Freise AC, Zettlitz KA, Salazar FB, Tavaré R, Tsai WTK, Chatziioannou AF. et al. Immuno-PET in inflammatory bowel disease: Imaging CD4+ T cells in a murine model of colitis. J Nucl Med. 2018;59:980-985
63. Tavaré R, McCracken MN, Zettlitz KA, Salazar FB, Olafsen T, Witte ON. et al. Immuno-PET of Murine T Cell Reconstitution Postadoptive Stem Cell Transplantation Using Anti-CD4 and Anti-CD8 Cys-Diabodies. J Nucl Med. 2015;56:1258-1264
64. Higashikawa K, Yagi K, Watanabe K, Kamino S, Ueda M, Hiromura M. et al. 64Cu-DOTA-anti-CTLA-4 mAb enabled PET visualization of CTLA-4 on the T-cell infiltrating tumor tissues. PLoS One. 2014;9:e109866
65. Tavaré R, Escuin-Ordinas H, Mok S, McCracken MN, Zettlitz KA, Salazar FB. et al. An Effective Immuno-PET Imaging Method to Monitor CD8-Dependent Responses to Immunotherapy. Cancer Res. 2016;76:73-82
66. Pandit-Taskar N, Postow M, O'Donoghue J, Harding J, Ziolkowska M, Lyashchenko S. et al. First in Human Phase I Imaging Study With 89Zr-IAB22M2C Anti CD8 Minibody in Patients with Solid Tumors. J Nucl Med. 2018;59:596
67. Haas M, Dimmler A, Hohenberger W, Grabenbauer GG, Niedobitek G, Distel LV. Stromal regulatory T-cells are associated with a favourable prognosis in gastric cancer of the cardia. BMC Gastroenterol. 2009;9:65
68. Salama P, Phillips M, Grieu F, Morris M, Zeps N, Joseph D. et al. Tumor-infiltrating FOXP3+ T regulatory cells show strong prognostic significance in colorectal cancer. J Clin Oncol. 2009;27:186-192
69. Jackute J, Zemaitis M, Pranys D, Sitkauskiene B, Miliauskas S, Bajoriunas V. et al. The prognostic influence of Foxp3(+)CD4(+), CD4(+) and CD8(+) tumor cells in resected non-small cell lung cancer. J Inflamm (Lond). 2015;12:63
70. Spitzer MH, Carmi Y, Reticker-Flynn NE, Kwek SS, Madhireddy D, Martins MM. et al. Systemic Immunity Is Required for Effective Cancer Immunotherapy. Cell. 2017;168:487-502.e15
71. Hunder NN, Wallen H, Cao J, Hendricks DW, Reilly JZ, Rodmyre R. et al. Treatment of metastatic melanoma with autologous CD4+ T Cells against NY-ESO-1. N Engl J Med. 2008;358:2698-2703
72. Perez-Diez A, Joncker NT, Choi K, Chan WFN, Anderson CC, Lantz O. et al. CD4 cells can be more efficient at tumor rejection than CD8 cells. Blood. 2007;109:5346-5354
73. Veglia F, Perego M, Gabrilovich D. Myeloid-derived suppressor cells coming of age. Nat Immunol. 2018;19:108-119
74. Mayer KE, Mall S, Yusufi N, Gosmann D, Steiger K, Russelli L. et al. T-cell functionality testing is highly relevant to developing novel immuno-tracers monitoring T cells in the context of immunotherapies and revealed CD7 as an attractive target. Theranostics. 2018;8:6070-6087
75. Alam IS, Mayer AT, Sagiv-Barfi I, Wang K, Vermesh O, Czerwinski DK. et al. Imaging activated T cells predicts response to cancer vaccines. J Clin Invest. 2018;128:2569-2580
76. Ronald JA, Kim BS, Gowrishankar G, Namavari M, Alam IS, D'Souza A. et al. A PET Imaging Strategy to Visualize Activated T Cells in Acute Graft-versus-Host Disease Elicited by Allogenic Hematopoietic Cell Transplant. Cancer Res. 2017;77:2893-2902
77. Larimer BM, Wehrenberg-Klee E, Dubois F, Mehta A, Kalomeris T, Flaherty K. et al. Granzyme B PET Imaging as a Predictive Biomarker of Immunotherapy Response. Cancer Res. 2017;77:2318-2327
78. Gibson HM, McKnight BN, Malysa A, Dyson G, Wiesend WN, McCarthy CE. et al. IFNγ PET imaging as a predictive tool for monitoring response to tumor immunotherapy. Cancer Res. 2018;78:5706-5717
Author contact
![]() Corresponding author: Prof. Andreas Kjaer, Dept. of Clinical Physiology, Nuclear Medicine & PET, Rigshospitalet, KF-4012, Blegdamsvej 9, DK-2100 Copenhagen, Denmark. +45 35454216 akjaerku.dk
Corresponding author: Prof. Andreas Kjaer, Dept. of Clinical Physiology, Nuclear Medicine & PET, Rigshospitalet, KF-4012, Blegdamsvej 9, DK-2100 Copenhagen, Denmark. +45 35454216 akjaerku.dk