Impact Factor
- Issue 14; 2026
- Issue 13; 2026
- Issue 12; 2026
- Issue 11; 2026
- Issue 10; 2026
- Volume 16; 2026
- Advance Articles
- Past Issues
- Cover Images
- Cover Suggestion
- Index & Coverage
- Special Issues
Introduction
Materials and Methods
Results
Discussion
Acknowledgements
Supplementary Material
References
International Journal of Biological Sciences
International Journal of Medical Sciences
 Global reach, higher impact

Theranostics 2020; 10(3):1033-1045. doi:10.7150/thno.38137 This issue Cite
Research Paper
Fructose-1,6-bisphosphatase loss modulates STAT3-dependent expression of PD-L1 and cancer immunity
Bo Wang1,2*, Yingke Zhou1,2*, Jun Zhang4, Xin Jin2,3 ![]() , Heshui Wu1
, Heshui Wu1 ![]() , Haojie Huang2,5,6
, Haojie Huang2,5,6 ![]()
1. Department of Pancreatic Surgery, Union Hospital, Tongji Medical College, Huazhong University of Science and Technology, Wuhan, 430022, China;
2. Department of Biochemistry and Molecular Biology, Mayo Clinic College of Medicine and Science, Rochester, MN 55905, USA.
3. Department of Digestive Surgical Oncology, Union Hospital, Tongji Medical College, Huazhong University of Science and Technology, Wuhan, 430022, China.
4. Department of Laboratory Medicine and Pathology, Mayo Clinic College of Medicine and Science, Rochester, MN 55905, USA;
5. Department of Urology, Mayo Clinic College of Medicine and Science, Rochester, MN 55905, USA;
6. Mayo Clinic Cancer Center, Mayo Clinic College of Medicine and Science, Rochester, MN 55905, USA.
*These authors contributed equally to this work.
Received 2019-7-3; Accepted 2019-10-15; Published 2020-1-1
Abstract

Rationale: Abnormal expression of programmed death-1 (PD-1) ligand-1(PD-L1) in cancer cells plays a crucial role in cancer immune evasion and progression. The immune checkpoint molecules PD-1 and PD-L1 have been targeted for cancer treatment with significant benefits for cancer patients. However, the response rate is relatively low in certain types of cancer and the underlying mechanism remains poorly understood. Better understanding of the molecular mechanism of PD-L1 expression regulation in cancer cells is urgently needed to improve the treatment response rate and overall survival of patients. Fructose-1, 6-biphosphatase (FBP1) is a key enzyme in gluconeogenesis and is implicated in human cancer due to its frequent loss in various cancer types.
Methods: Expression of FBP1 and PD-L1 was analyzed in various cancer cell lines. Western blot and RT-qPCR were performed to determine whether FBP1 regulates PD-L1 expression. Co-immunoprecipitation and glutathione S-transferase (GST) pulldown assay were employed to define the underlying regulatory mechanisms. Immunohistochemistry was conducted to determine the correlation between FBP1 and PD-L1 expression in a cohort of patients. A cancer syngeneic mouse model was utilized to examine how FBP1 affects tumor immunity.
Results: We demonstrated that in a manner independent of its enzymatic activity FBP1 downregulates the expression of PD-L1 in various cell lines of different cancer types including pancreatic and prostate cancer. We further showed that this regulation occurs at the transcriptional level and is mediated by FBP1 inhibition of signal transducer and activator of transcription-3 (STAT3)-dependent PD-L1 transcription. Moreover, FBP1 and PD-L1 protein expression were negatively correlated in pancreatic ductal adenocarcinoma (PDAC) specimens from a cohort of patients. Most importantly, we demonstrated that decreased FBP1 expression promotes tumor growth and resistance to immune checkpoint blockade therapy in mice.
Conclusions: Our findings reveal a new tumor suppressor function of FBP1 in inhibiting PD-L1 expression and enhancing cancer immunity. They also suggest that FBP1-deficient human cancers could be therapeutically targeted by PD-1/PD-L1-based immune checkpoint blockade therapy.
Keywords: PD-L1, FBP1, STAT3, cancer immunity, checkpoint blockade therapy
Introduction
Immune evasion is one of the key oncogenesis hallmarks of human cancers [1]. While the neonatal antigens derived from solid tumor remain capable of triggering cancer immunity, tumors often escape from immune attack. Recent studies have shown that immune evasion of cancers can be achieved by many mechanisms, including the abnormal upregulation of immune checkpoint molecules [2].
Programmed death-1 (PD-1) and its ligand PD-L1 are two well-studied checkpoint molecules [3-5]. PD-L1 expressed in cancer cells binds to PD-1 in T cells and induces inactivation and/or apoptosis of T cells, resulting in the immune escape of cancer [3-6]. Existent studies have shown that PD-L1expression in cancer cells is regulated by various mechanisms. Up-regulation of PD-L1 in cancer cells heavily depends on the activation of TLR- or IFN-γ-mediated signaling pathways, such as NF-κB, MAPK, PI3K, mTOR and JAK. Activation of these signaling cascades results in nuclear translocation of numerous transcription factors that transactivate expression of PD-L1 gene [7-11]. These transduction pathways can be activated by pro-inflammatory cytokines such as IFN-γ, TNF-α, IL-1β or due to loss or inactivation of tumor suppressor genes such as PTEN and RB [12, 13]. Additionally, PD-L1 levels can also be upregulated due to deregulated proteolytic degradation of PD-L1 protein [14, 15].
Anti-PD1 and anti-PD-L1 antibodies are utilized for cancer treatment in patients. FDA has approved anti-PD therapy for at least 11 cancers including metastatic melanoma, lung cancer, renal cell carcinoma urothelial carcinoma, gastric cancer, liver cancer, Hodgkin's lymphoma and so on [16]. Existent data have shown that PD-1/PD-L1 immune checkpoint-based therapy has significantly improved progress-free survival in a subset of patients, especially in carcinogen-induced cancers or cancers caused by viral infections. Hodgkin's lymphoma [17], desmoplastic melanoma [18] and virials induced Merkel cell carcinoma are cancer indications with highest response rate (50-90%) [19]. However, the response rate is relatively low in certain cancer types [20-23]. The most common reasons of the low response rate are rare T cell infiltration in tumor or impaired antitumor T cells by other checkpoints, such as CTLA-4 or immune suppressive cells in tumor microenvironment or cancer cells insensitive to IFN-γ leading to no or low reactively expressed PD-L1 [24-27]. Thus, better understanding of the molecular mechanism that regulates PD-L1 expression in cancer cells is of significant importance to improve patient response to anti-PD-1/PD-L1 therapy in clinic.
Fructose-1, 6-biphosphatase (FBP1) primarily functions as a negative regulator of glycolysis. Increasing evidence suggests that it possesses a tumor suppressor function and it is often downregulated in many types of human cancer [28]. Loss of FBP1 is associated with tumor progression and patient prognosis in various cancer types examined [28-30]. Previous studies have showed that FBP1 suppresses the aggressive features of hepatocellular carcinoma cells through regulating the Warburg effect or modulating the metabolism of breast cancer cells via inhibition of expression of hypoxia inducible factor 1α (HIF-1α) [30, 31]. In the present study, we identified a role of FBP1 in suppressing the expression of PD-L1 and this effect is mediated by its interaction with STAT3. Our findings also suggest that FBP1 loss may be a pervasive mechanism that contributes to the deregulation of PD-L1 in various human cancers.
Materials and Methods
Cell lines and cell culture
Prostate and breast cancer cell lines VCaP, PC-3, MCF-7, T47D and MDA-MB-231 were purchased from ATCC. PTEN-CaP8 murine Pten-deficient CRPC cell line was kindly provided by Dr. Hong Wu at UCLA [32]. The pancreatic cancer cell lines PANC-1 and MIA PaCa-2 were obtained from Dr D.D. Billadeau at Mayo Clinic (Rochester, MN). Cell lines were cultured in DMEM or RPMI supplied with 10% fetal bovine serum (FBS) and routinely maintained at 37 ℃, 5% CO2 incubator.
Plasmids and antibodies
Flag-FBP1, HA-FBP1 and Flag-STAT3 expression vectors were generated using the pCMV backbone plasmid. The FBP1 mutant G260R and STAT3 mutant Y705D were generated using KOD-Plus Mutagenesis Kit (Toyobo). Antibodies used in this study were purchased from the following companies: FBP1 (Abcam); PD-L1, STAT3 and p-STAT3 (Y705) (Cell Signaling Technology); ERK2 (Santa Cruz Biotechnology); HA tag (Covance), and Flag tag (Sigma).
Western blot
Cells were harvested and lysed in cell lysis buffer on ice for more than 15 minutes and the lysate was centrifuged at 13,000 rpm at 4 ℃ for 10 minutes. The supernatant was transferred into a new tube for BCA protein quantification assay (Thermo Fisher Scientific). 4x loading buffer (Thermo Fisher Scientific) was added into equal amount of protein sample and boiled for 5 minutes. The sample was used for SDS-PAGE analysis and transferred to nitrocellulose membrane. The membrane was blocked with 5% non-fat milk in room temperature for 1 hour and incubated with primary antibody at 4 ℃ overnight. The membrane was washed with 1x TBST 5 minutes for 3 times, and incubated with horseradish peroxidase-conjugated secondary antibody for 1 hour in room temperature. The protein was visualized by SuperSignal West Pico Stable Peroxide Solution (Thermo Fisher Scientific).
Real-time reverse transcription-polymerase chain reaction (RT-PCR)
Total RNA was extracted from cells using Trizol reagent (Thermo Fisher Scientific). First strand cDNA was synthesized from 1 µg of total RNA using the cDNA Reverse Transcription Kit. Real-time PCR analysis was performed according to the guidance of manufacturer's protocol. Sequences of primers for RT-qPCR are provided in Supplementary Table 1.
Co-immunoprecipitation (co-IP)
Cells were harvested and lysed with IP buffer on ice for more than 15 minutes and the lysate was centrifuged at 13,000 rpm at 4 ℃ for 10 minutes. The supernatant was transferred into a new tube. The supernatant was incubated overnight with protein A/G agarose beads (Thermo Fisher Scientific) and primary antibodies under 4 ℃ with mild rocking. After incubation, the beads were washed 6 times with IP buffer on ice and then subjected into western blotting analysis.
Tissue microarray (TMA) and immunohistochemistry (IHC)
TMA slides of pancreatic ductal adenocarcinomas (PDACs) were purchased from Biomax US (Catalog no. PA1001a). The specimens were immunostained with FBP1, PD-L1 and p-STAT (Y705) antibodies. Staining intensity was graded in a blinded fashion: 1 = weak staining at 100x magnification but little or no staining at 40x magnification; 2= medium staining at 40x magnification; 3= strong staining at 40x magnification. The final staining index was calculated by the formula: staining intensity x staining percentage.
Glutathione S-transferase (GST) pulldown assay
Cells were lysed with cell lysis buffer (20 mM Tris-HCl (pH=7.5), 150 mM NaCl, 0.1% Nonidet P40, 1 mM dithiothreitol, 10% glycerol, 1 mM EDTA, 2.5 mM MgCl2 and 1 µg/ml leupeptin) for 30 minutes at 4 ℃. The GST fusion proteins were immobilized on glutathione-Sepharose beads (GE Healthcare Lifesciences), and the beads were washed with lysis buffer. The beads were incubated with cell lysate for 4 hours, and were washed four times with binding buffer and re-suspended in sample buffer. The bound proteins were analyzed by SDS/PAGE and western blot.
RNA interference
Lentivirus-based control and gene-specific small hairpin RNAs (shRNAs) were purchased from Sigma-Aldrich. Lipofectamine 2000 was used to transfect 293T cells with shRNA plasmids and viral packaging plasmids (pVSV-G and pEXQV). At 24 hours after transfection, the medium was replaced with fresh DMEM, containing 10% FBS and 1 mM of sodium pyruvate. 48 hours after transfection, the virus culture medium was collected, filtered and added to cancer cells supplemented with 12 µg/mL of polybrene. At 24 hours after infection, the infected cells were selected with 10 µg /mL of puromycin. The shRNA and sgRNA sequence is provided in the Supplementary Table 2.
Glucose consumption measurement assay
Cells were plated in 6-well plates and cultured in DMEM medium without phenol red (Thermo Fisher Scientific). 24 hours after plasmid transfection or 48 hours after lentivirus infection, the spent medium was collected. Glucose concentration of the spent medium was measured using a Glucose (GO) Assay Kit according to the manufacturer's instructions (Sigma-Aldrich). Glucose consumption was calculated by the difference of glucose concentration between the spent medium and unused medium.
Generation of a prostate cancer syngeneic mouse model for anti-PD-L1 antibody treatment
C57BL/6 male mice at 6-week old were purchased from Jackson Laboratory. The animal study was approved by the Mayo Clinic IACUC. All mice were housed in standard conditions with 12-hour light/dark cycle and access to food and water ad libitum. PTEN-CaP8 murine prostate cancer cells (5× ) infected with lentivirus expressing control or Fbp1-specific shRNAs was injected subcutaneously into the right flank of mice. The volume of allografts was measured every other day until the tumor volume reached 300 mm3 and calculated by the formula (L × W2 × 0.5). At the end of measurement, mice were euthanized and tumors were isolated and weighed.
Flow cytometry analysis
PANC-1 and MIA PaCa-2 cells infected with shRNA were harvested and washed with 1× PBS. Cells were fixed with 4% paraformaldehyde for 15 minutes. Cells were incubated with ice-cold 100% methanol for 30 minutes on ice followed by wash with 1× PBS. Cells were washed with 1× PBS one more time and incubated with antibody or isotype IgG for 1 hour at room temperature. Cells were incubated with secondary antibody conjugated with Alexa Fluor (Thermo Fisher Scientific) for 1 hour at room temperature followed by wash with 1× PBS. After washed three times with 1× PBS, cells were resuspended with 1× PBS and analyzed using flow cytometer.
For the preparation of flow cytometry analysis of mouse tissue samples, tumors were cut into small pieces and digested with 2 mg/ mL collagenase (Sigma Aldrich) in DMEM for 1 hour at 37 ℃. Cells were filtered through 70 µm nylon strainer and resuspended in red blood cell lysis buffer (Biolegend) for 3 minutes at room temperature. Cells were suspended in 1× PBS with 2% BSA and co-stained with antibodies. After incubated with antibody for 30 minutes, cells were washed with 1× PBS and analyzed with flow cytometer.
Statistical analysis
Statistical analysis were carried out by one-sided or two-sided paired Student's t-test for single comparison and one-way ANOVA with a post-hoc test for multiple comparisons, and P values < 0.05 was considered statistically significant. All the values are expressed as the means ± SD.
Results
FBP1 negatively regulates PD-L1 expression in multiple cell lines of different cancer types
It has been shown previously that FBP1 is frequently lost in many types of human cancers including renal carcinoma, basal-like breast cancer, hepatocellular carcinoma and pancreatic cancer and that loss of FBP1 promotes cancer progression, metabolic reprogramming and drug resistance [28, 31, 33, 34]. Given that PD-L1 is a key immune checkpoint molecule and it is often deregulated in human cancers [3-5, 15, 35], we sought to determine whether FBP1 expression influence cancer immunity by regulating PD-L1 expression in cancer cells. To this end, we knocked down endogenous FBP1 using two independent shRNAs in PANC-1 and MIA PaCa-2 pancreatic cancer cell lines. FBP1 knockdown (KD) invariably increased expression of PD-L1 at both protein and mRNA levels as demonstrated by western blot and quantitative RT-PCR (Figures 1A and 1B). These results are consistent with increased expression of PD-L1 on the surface of FBP1 KD cells as demonstrated by FACS (Figure 1C). Similar results were observed in breast cancer cell lines MCF-7 and T47D and prostate cancer cell lines VCaP and PC-3 (Figures 1D and 1E). Accordingly, overexpression of FBP1 decreased PD-L1 expression at both protein and mRNA level in a dose dependent manner (Figures 1F and 1G). These data indicate that FBP1 has an inhibitory effect on the expression of PD-L1 in multiple cancer cell lines.
FBP1 negatively regulates PD-L1 expression in multiple cancer cell lines. (A-C) PANC-1 and MIA PaCa-2 cells were infected with lentivirus expressing control shRNA or FBP1-specific shRNA. After 48 hours of puromycin selection, cells were harvested for western blot (A), quantitative RT-PCR (B) and FACS (C). All data shown are mean values ± SD (n=3), *** P < 0.001. (D, E) MCF-7, T47D, VCaP and PC-3 cells were harvested for western blot and quantitative RT-PCR at 48 hours after infected with lentivirus expressing control shRNA or FBP1-specific shRNA. All data shown are mean values ± SD (n=3), *** P < 0.001. (F, G) PANC-1 cells were infected with control or FBP1 expressing plasmid. 24 hours later cells were harvested for western bolt (F) and quantitative RT-PCR (G). All data shown are mean values ± SD (n=3), * P < 0.05, *** P < 0.001. (H-J) PANC-1 cells were infected with indicated plasmids. After 24 hours cells were harvested for western blot (H) and quantitative RT-PCR (I). Spent medium was collected for measurement of glucose consumption (J). All data are shown as mean values ± SD (n=3). ns, not significant, *** P < 0.001.
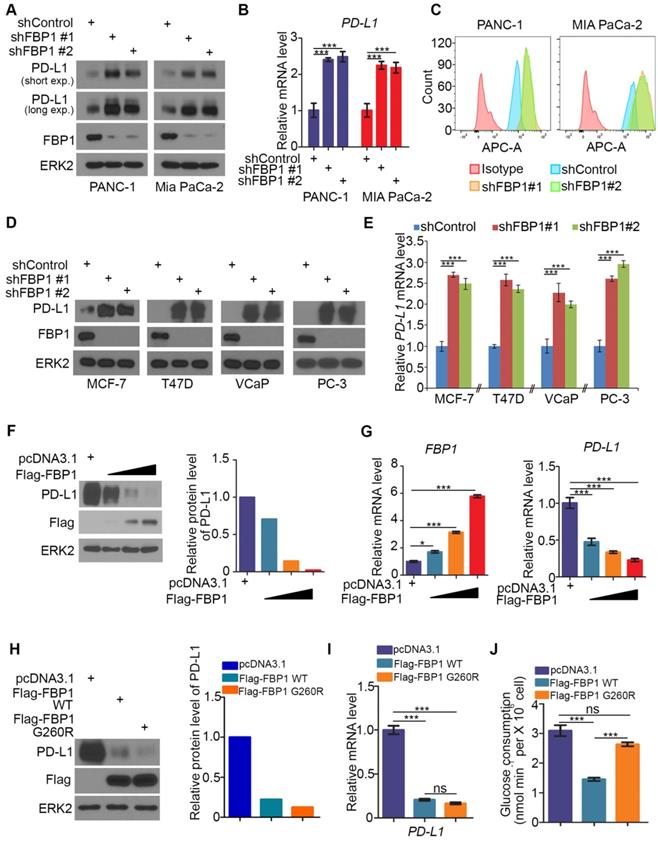
FBP1 is the key enzyme that inhibits glycolysis. To determine whether enzyme activity is required for FBP1 to inhibit the expression of PD-L1, a catalytically inactivated mutant of FBP1 (G260R) was constructed as described [36, 37]. FBP1-WT and FBP1-G260R plasmids were transfected into PANC-1 cells. We demonstrated that ectopic expression of FBP1-WT and FBP1-G260R resulted in a similar inhibitory effect on the expression of PD-L1 at both protein and mRNA level (Figures 1H and 1I). As expected, ectopic expression of FBP1-WT, but not FBP1-G260R, inhibited the glucose consumption in these cells (Figure 1J). Our data indicates that FBP1 inhibits the expression of PD-L1 in a manner independent of its enzyme activity.
FBP1 and PD-L1 expression are negatively correlated in PDAC patient specimens
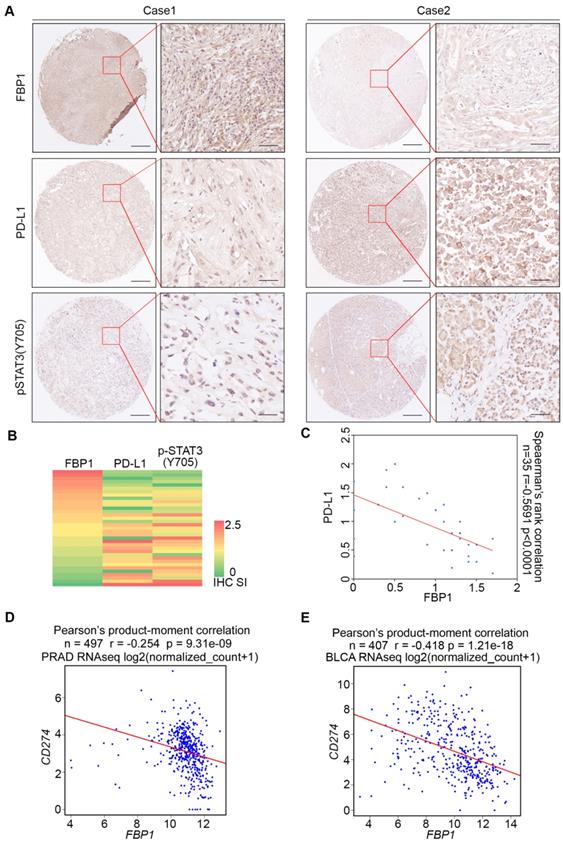
To assess the clinical relevance of FBP1 inhibition of PD-L1 expression, we examined the correlation between FBP1 and PD-L1 expression in PDAC patient samples by performing immunohistochemistry (IHC) on a TMA containing PDAC specimens from a cohort of 35 patients. IHC was evaluated by both staining intensity and percentage of positive cells. Representative IHC images displaying the high and low/no staining of FBP1 and PD-L1 are shown in Figure 2A. Further analysis showed that there exists a negative correlation between the level of FBP1 and the expression of PD-L1 among these patients (Spearman's rank correlation r = -0.5691, P < 0.0001) (Figures 2B and 2C). Meta-analysis of previously published data showed that expression of FBP1 and PD-L1 mRNA also inversely correlated in prostate adenocarcinoma (PRAD) and bladder urothelial carcinoma (BLCA) patient specimens (Figures 2D and 2E). Thus, these data suggest FBP1 may also negatively regulate PD-L1 expression in patients of different cancer types.
FBP1 and PD-L1 expression are negatively correlated in PDAC patient specimens. (A) Representative images of IHC of anti-FBP1, anti-PD-L1 and anti-pSTAT3 (Y705) antibodies of TMA (n=35) tissue sections. (B) Heat map showing the staining index of FBP1, PD-L1 and pSTAT3 (Y705) in TMA. (C) Correlation analysis of the staining index for expression of FBP1 and PD-L1 in specimens of PDAC patients (n=35). Spearman's rank correlation coefficient and P values are shown. (D, E) Correlation analysis of mRNA level between PD-L1 and FBP1 in patient specimens of PRAD (n=497) and BLCA (n=407). Pearson product-moment correlation coefficient and P values are shown.
FBP1 interacts with STAT3, a transcriptional regulator of PD-L1
It has been reported that PD-L1 is upregulated by interleukin 6 (IL-6) through STAT3 signaling [38]. We sought to determine whether FBP1 expression affects this process. As expected, IL-6 treatment induced upregulation of PD-L1 at both protein and mRNA level in three different cell lines including MCF-7, T47D, and MDA-MB-231, although IL-6 treatment had no effect on FBP1 protein expression (Figures 3A and 3B). Notably, we found that compared to FBP1 highly expressed cell lines MCF-7 and T47D, PD-L1 induction by IL-6 was much greater in MDA-MB-231 cells in which FBP1 was barely detectable (Figures 3A and 3B), suggesting that FBP1 might negatively influence the regulation of PD-L1 via the IL-6-STAT3 signaling pathway. To test this hypothesis, we first examined whether FBP1 interacts with STAT3. To this end, we performed co-immunoprecipitation (co-IP) assays. Reciprocal co-IP studies showed that ectopically expressed FBP1 formed a protein complex with STAT3 (Figure 3C). We further confirmed that FBP1-STAT3 interaction also occurs at the endogenous level in the cytoplasm (Figures 3D and S1A).
FBP1 interacts with STAT3, a transcriptional regulator of PD-L1. (A, B) MCF7, T47D and MDA-MB-231 cells were treated with IL-6 (200 ng) or PBS. 48 hours after treatment cells were harvested for western blot (A) and quantitative RT-PCR (B). All data are shown as mean values ± SD (n=3). (C, D) Western blot analysis of ectopically expressed HA-FBP1 and FLAG-STAT3 reciprocally immunoprecipitated by anti-HA and anti-FLAG in 293T cells (C), and endogenous FBP1 and STAT3 proteins reciprocally immunoprecipitated by anti-FBP1 and anti-STAT3 in MIA PaCa-2 cells (D). (E) Schematic diagram depicting two GST-FBP1 recombinant proteins. (F) Western blot analysis of Flag-STAT3 proteins in 293T whole cell lysate pulled down by GST or GST-FBP1 recombinant proteins. (G) Schematic diagram of a set of STAT3 mutant proteins. (H) Western blot analysis of ectopically expressed HA-FBP1 proteins in 293T whole cell lysate pulled down by FLAG or FALG-STAT3 WT and mutant proteins.
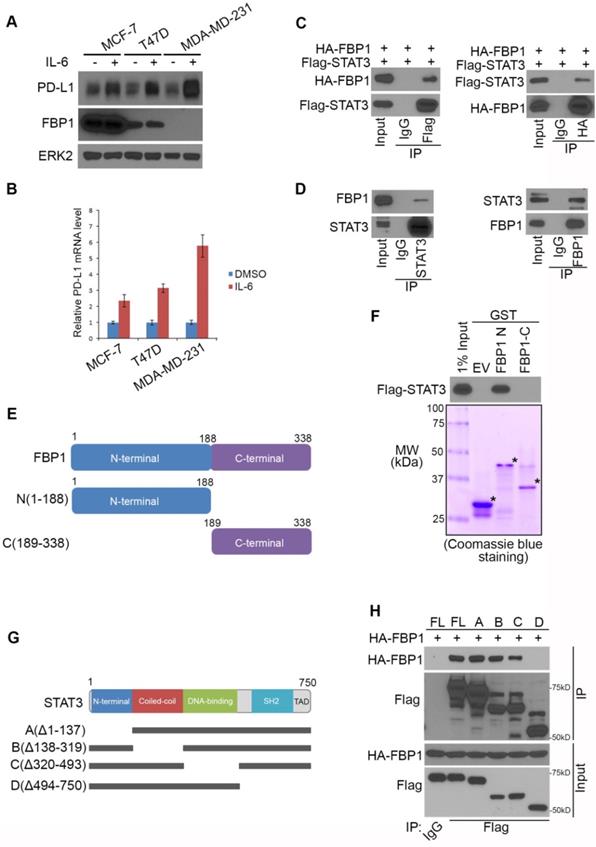
To define which domain of FBP1 mediates its interaction with STAT3, we constructed glutathione S-transferase (GST) expression plasmids for two truncatedFBP1 recombinant proteins (Figure 3E). GST pulldown assay demonstrated that GST-FBP1 N-terminal fragment (amino acids 1-188), but not GST or GST-FBP1 C-terminal fragment (amino acids 189-338) interacted with STAT3 (Figure 3F). To determine which domain(s) of STAT3 are responsible for the binding with FBP1, we generated four mutant plasmids of STAT3 according to four well-characterized functional domains of STAT3 (Figure 3G). Co-IP assay indicated that the SH2 domain of STAT3 is necessary for the interaction between STAT3 and FBP1 (Figure 3H). These data indicate that FBP1 can interact with STAT3 at endogenous level.
STAT3 phosphorylation induced by ionizing radiation and IL-6 diminishes FBP1-STAT3 interaction
It has been shown previously that induction of PD-L1 by IL-6 is highly associated with phosphorylation of STAT3 [38, 39]. We sought to determine whether phosphorylation of STAT3 affects its binding to FBP1. FBP1 and STAT3 were ectopically expressed in 293T cells and cell lysate was treated with λ protein phosphatase. We demonstrated that phosphatase treatment of cell lysate markedly enhanced FBP1-STAT3 interaction (Figure 4A), indicating protein phosphorylation inhibits FBP1 interaction with STAT3.
STAT3 phosphorylation induced by ionizing radiation and IL-6 diminishes FBP1-STAT3 interaction. (A) Western blot analysis of whole cell lysate and co-IP samples from 293T cells 24 hours after being transfected with the plasmids as indicated. (B) MIA PaCa-2 cells were treated with gamma radiation (12 Gy) or mock treatment. 24 hours later cells were harvested for western blot analysis of whole cell lysate and co-IP samples. (C) Western blot analysis of whole cell lysate and co-IP samples from MIA PaCa-2 cells 24 hours after being treated with IL-6 (200 ng) or mock treatment. (D) Western blot analysis of whole cell lysate and co-IP samples from 293T cells 24 hours after being transfected with the indicated plasmids.
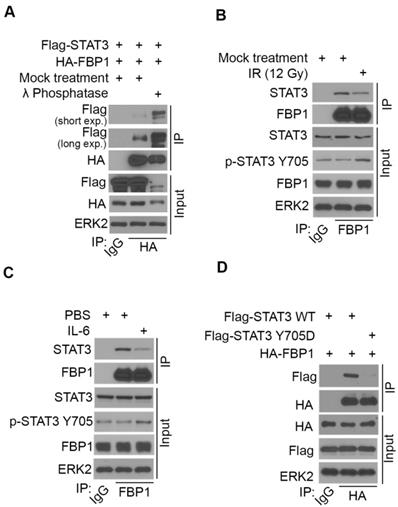
We have shown previously that ionizing radiation (IR) upregulates PD-L1 expression in various cancer cell lines [13]. We examined whether IR affects STAT3 phosphorylation and FBP1-STAT3 interaction. While IR increased STAT3 phosphorylation at tyrosine 705 (Y705), IR dampened the interaction between FBP1 and STAT3 in MIA PaCa-2 cells (Figure 4B). Similarly, administration of IL-6 increased Y705 phosphorylation of STAT3, but decreased association of FBP1 with STAT3 (Figure 4C). Since phosphorylation of STAT3 at Y705 reduces the interaction between FBP1 and STAT3, we were interested to determine whether unphosphorylated Y705 in STAT3 is essential for its interaction with FBP1. We demonstrated that conversion of Y705 to aspartic acid (Y705D), a phosphor-mimicking mutant completely abolished FBP1 binding with STAT3 in 293T cells (Figure 4D). These data indicate that both IR and IL-6 can increase phosphorylation of STAT3, which prevents its interaction with FBP1 and that this effect is mediated by Y705 phosphorylation on STAT3.
To determine if there exists any association of pSTAT3 levels with FBP1 or PD-L1 in clinical patients, we also performed pSTAT3 (Y705) IHC on TMA of PDAC patients. Representative images of pSTAT3 IHC showed in Figure 2A displayed the high and low staining of pSTAT3. Further analysis showed that pSTAT3level is negatively correlated with FBP1 level (Spearman's rank correlation r= -0.7193, P< 0.0001) while pSTAT3 level is positively correlated with the expression of PD-L1 (Spearman's rank correlation r= 0.4704, P< 0.0001) (Figure S1B and S1C). These data suggest that signaling pathways influencing STAT3 phosphorylation can modulate FBP1 interaction with STAT3 and FBP1 regulation of PD-L1 expression.
FBP1 represses PD-L1 expression via STAT3
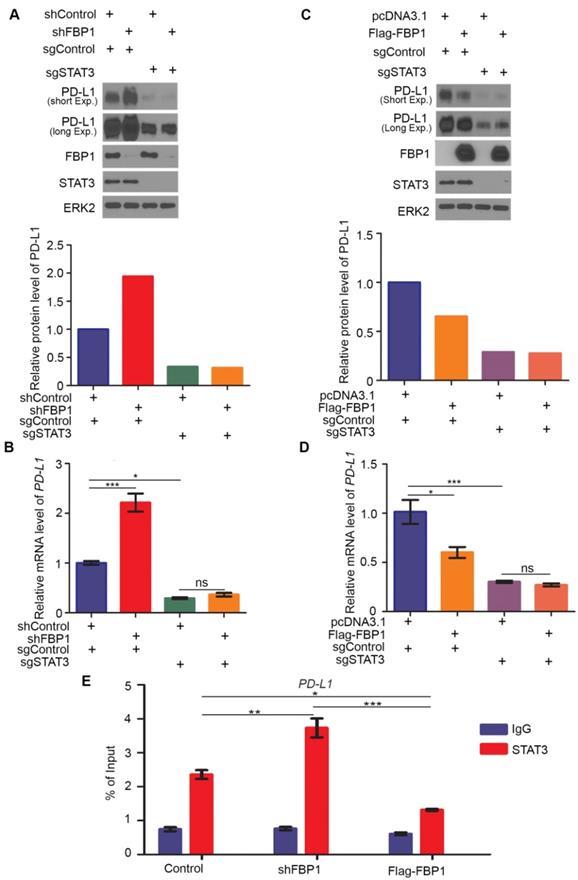
Our finding that FBP1 interacts with STAT3 suggests that FBP1 may regulate PD-L1 via STAT3. To test this hypothesis, we generated control and STAT3 knockout MIA PaCa-2 cells using CRISPR/Cas-9 (Figure 5A). We demonstrated that FBP1 KD upregulated PD-L1 expression at both protein and mRNA level in sgControl cells, but these effects were abolished in sgSTAT3 cells (Figures 5A and 5B). In contrast, FBP1 overexpression downregulated PD-L1 expression at both protein and mRNA level in sgControl cells, but such effects were abolished in sgSTAT3 cells (Figures 5C and 5D). Furthermore, chromatin immunoprecipitation-coupled quantitative PCR (ChIP-qPCR) analysis showed that STAT3 bound at the PD-L1 gene locus (Figure 5E). Importantly, STAT3 occupancy at the PD-L1 locus was increased by FBP1 KD but decreased by FBP1 overexpression (Figure 5E). Our data suggest that FBP1 inhibits PD-L1 expression in a way dependent on STAT3.
FBP1 represses PD-L1 expression via STAT3. (A, B) Western blot analysis of proteins (A) and quantitative RT-PCR measurement of the mRNA level of PD-L1 (B) in MIA PaCa-2 cells 48 hours after transfected with shRNA and sgRNA as indicated. All data are shown as mean values ± SD (n=3). ns, not significant, * P < 0.05, *** P < 0.001. (C, D) Western blot analysis of proteins (C) and mRNA level of PD-L1 (D) in MIA PaCa-2 cells 24 hours after transfected with plasmids and sgRNAs indicated. All data are shown as mean values ± SD (n=3). ns, not significant, * P < 0.05, *** P < 0.001. (E) ChIP-qPCR analysis of STAT3 binding at the PD-L1 promotor in MIA PaCa-2 cells treated with shFBP1 or Flag-FBP1. All data are shown as mean values ± SD (n=3). *P < 0.05, ** P < 0.01, *** P < 0.01.
Decreased expression of FBP1 promotes tumor growth and resistance to anti-PD-L1 treatment
Next, we examined how FBP1 affects tumor immunity. We knocked down Fbp1 in PTEN-CaP8 murine prostate cancer cells and Fbp1 knockdown significantly increased Pd-l1 expression at both mRNA and protein level in these cells (Figures 6A and 6B). We injected control or Fbp1 stable knockdown PTEN-CaP8 cells into immune-proficient C57BL/6 mice and mice were treated with control IgG or anti-Pd-l1 antibody when tumors reached the average size of 50 mm3 (Figure 6C). We demonstrated that knockdown of Fbp1 promoted the tumor growth (Figure 6D). To our surprise, while Fbp1-deficient cells expressed much more Pd-l1 proteins compared to control cells (Figure 6A), Fbp1-deficient tumors were more resistant to anti-Pd-l1 treatment than the control tumors (Figure 6D). Fractionation and cellular localization assays showed that there was substantial amount of Pd-l1 protein localized in the nucleus (Figures S1D and S1E). It has been shown previously that in addition to the immune checkpoint function, PD-L1 can also execute multiple intracellular functions, such as inducing activation of the mTOR-AKT pathway[40], facilitating glucose metabolism[41, 42] and acting as an RNA binding protein to inhibit DNA damage-related protein degradation[43]. Therefore, it is possible that nuclear PD-L1 in Fbp1 knockdown cells may acquire certain cellular functions, which provides a plausible explanation for the anti-PD-L1 therapy resistance observed in Fbp1 knockdown tumors in mice, but this notion warrants further investigation.
Decreased expression of Fbp1 promotes tumor growth and resistance to anti-Pd-l1 treatment. (A, B) PTEN-CaP8 murine prostate cancer cells were infected with lentivirus expressing control or Fbp1-specific shRNA. Cells were harvested for western blots (A) and quantitative RT-PCR (B). All data are shown as mean values ± SD (n=3), *** P < 0.001. (C-E) PTEN-CaP8 murine prostate cancer cells (5× ) were infected with lentivirus as in (A) and injected subcutaneously into C57BL/6 mice (n=8/group). Mice were treated with anti-Pd-l1 (200 µg) or non-specific IgG when the allografts reached 50 mm³ and the treatment was repeated 3 days and 6 days later. Mice were euthanized when the tumor volume reached 300 mm3 (C). At the end of treatment, tumor volume was calculated by the formula L × W2 × 0.5 (D). The number of infiltrated T and myeloid cells in tumors was analyzed by FACS (E). All data are shown as mean values ± SD (n=8), ns, not significant, * P < 0.05, *** P < 0.001. (F) A hypothetical model depicting FBP1 repression of PD-L1 expression via the competitive interaction with STAT3. FBP1 loss, ionizing radiation or Y705 phosphorylation of STAT3 induced by IL-6 dampens the interaction between FBP1 and STAT3, thereby abolishing FBP1-mediated inhibition of PD-L1 expression and cancer progression.
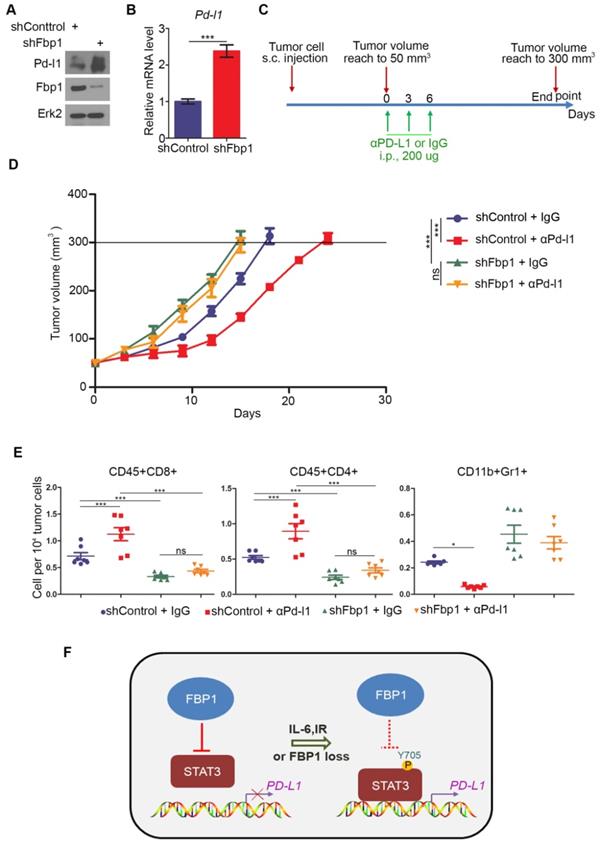
FACS analysis showed that knockdown of Fbp1 significantly decreased tumor infiltration of CD45+CD8+ T and CD45+CD4+ T cells, but increased the infiltration of CD11b+Gr1+ myeloid-derived suppressor cells (MDSCs) (Figure 6E). Furthermore, co-administration of Fbp1 knockdown and anti-pd-l1 antibody additively increased the tumor infiltration of CD45+CD8+ T and CD45+CD4+ T cells and a substantial reduction of CD11b+Gr1+ MDSCs (Figure 6E). These data indicate that knockdown of Fbp1 promotes prostate tumor growth and resistance to anti-Pd-l1 treatment in mice.
Discussion
The major finding of the current study is the identification of a previously unrecognized molecular mechanism that causes cancer immune evasion and cancer progression. FBP1, a putative tumor suppressor, has been shown previously to inhibit tumor progression by inhibiting aerobic glycolysis and reducing the Warburg effect [30] and/or antagonizing the function of HIF in renal cancer [31]. Here we demonstrated that FBP1 plays a pivotal role in regulating PD-L1 expression and cancer immunity in a manner independent of its enzymatic activity, thereby defining a new role of FBP1 in regulating the process of tumor progression. We found that FBP1 downregulates PD-L1 expression through the interaction with STAT3 and that FBP1 inhibits STAT3-dependent PD-L1 expression. Mechanistically, we further showed that FBP1 competitively sequesters the unphosphorylated STAT3, significantly decreases STAT3 occupancy on the genomic locus of PD-L1 gene, and downregulates the expression of PD-L1. In contrast, ionizing radiation or IL-6 treatment increases Y705 phosphorylation of STAT3 and impairs the interaction between FBP1 and STAT3, thereby diminishing the inhibitory effect of FBP1 on PD-L1 expression (Figure 6F). These findings not only help us explain our observation that FBP1 downregulates the protein and mRNA level of PD-L1 in multiple cancer cell lines, but also provides a mechanistic explanation for the immune evasion caused by radiotherapy or inflammatory response in clinic. More importantly, we provide evidence showing that it is possibly a pervasive regulatory mechanism commonly occurring in different cancer types. Given that upregulation of PD-L1 expression in antigen-presenting cells (APCs) is also very important for cancer immune evasion, whether the FBP1-involved mechanism accounts for this upregulation in a paracrine dependent fashion warrants further investigation.
As a rate-limiting enzyme in the process of gluconeogenesis, FBP1 converts fructose-1,6-biphosphate into fructose-6-phophate and inorganic phosphate [34]. Previous studies have showed that FBP1 is often downregulated in multiple types of solid tumors [28, 31, 44]. The mechanism of the downregulation may associate with DNA hypermethylation of its promoter and copy number loss [28, 45], histone deacetylation due to the deregulation of HDACs [33] or the post-transcriptional modification mediated by MAGE-TRIM28 leading to the degradation of FBP1 in cancer cells [46]. Importantly, the downregulation of FBP1 often links to the Warburg effect which is a common metabolic character of many solid tumors, including PDAC [34]. In this study, we demonstrated that FBP1 inhibits PD-L1 expression via interacting with the STAT3 pathway. Consistent with the finding that FBP1 is often downregulated in human cancers, we provide compelling evidence that loss of FBP1 contributes to immune evasion of malignant tumors. Thus, our findings define a new role of FBP1 in tumor suppression.
STAT3 plays an important role in wound healing and tissue repair in normal tissues [47]. However, excessive activation of STAT3 in malignant tumors results in inflammation-driven repair that promotes drug resistance or tumor progression [48-51]. Previous studies have reported that activation of STAT3 or the IL-6-JAK-STAT3 signaling cascade in cancer cells promotes oncogenesis [52-55]. Further studies show that STAT3 induces immunosuppression in cancer by upregulating PD-L1 and overexpression of PD-L1 significantly associates with the level of phosphorylated STAT3 [38, 39]. In the current study, we demonstrated that FBP1 interacts with STAT3 and inhibits the recruitment of STAT3 to the PD-L1 gene locus. This inhibitory effect is attenuated by IL-6 treatment or ionizing radiation due to increased Y705 phosphorylation of STAT3. Our findings reveal FBP1 as an upstream inhibitor of STAT3 and uncover a new mechanism that regulates the function of STAT3 in cancer. The significance of these findings is further accentuated by our observations that expression of FBP1 and PD-L1 is negatively corrected in cell lines of multiple cancer types and PDAC patient specimens.
In summary, we discover a new role of FBP1 in antagonizing STAT3-dependent expression of PD-L1 and the mechanism through which FBP1 loss in human cancer cells contributes to the upregulation of PD-L1 and resistance to anti-PD-L1 treatment. This finding suggests that loss of FBP1 loss may be involved in immune evasion in human cancers although the direct evidences linking FBP1 expression to immune responses in patients is currently lacking. Further investigation of this mechanism in clinic could lead to define new strategies to improve the patient response to anti-PD-1/PD-L1 therapy in clinic.
Acknowledgements
This work was partially supported by funding from Mayo Clinic Foundation (to H.H.) and the National Natural Science Foundation of China (81702374 to X.J.).
Contributions of authors
H.H. conceived the study. B.W., Y.Z. performed experiments, and analyzed the data. X.J., H.W., J.Z. supervised and performed patient tissue collection and IHC data analysis. H.H., B.W., Y.Z. wrote the manuscript.
Supplementary Material
Supplementary tables S1-S2 and figures.
Table S3.
Competing Interests
The authors have declared that no competing interest exists.
References
1. Hanahan D, Weinberg RA. Hallmarks of cancer: the next generation. Cell. 2011;144:646-74
2. Sharma P, Allison JP. Immune checkpoint targeting in cancer therapy: toward combination strategies with curative potential. Cell. 2015;161:205-14
3. Dong H, Strome SE, Salomao DR, Tamura H, Hirano F, Flies DB. et al. Tumor-associated B7-H1 promotes T-cell apoptosis: a potential mechanism of immune evasion. Nat Med. 2002;8:793-800
4. Dong H, Zhu G, Tamada K, Chen L. B7-H1, a third member of the B7 family, co-stimulates T-cell proliferation and interleukin-10 secretion. Nat Med. 1999;5:1365-9
5. Freeman GJ, Long AJ, Iwai Y, Bourque K, Chernova T, Nishimura H. et al. Engagement of the PD-1 immunoinhibitory receptor by a novel B7 family member leads to negative regulation of lymphocyte activation. J Exp Med. 2000;192:1027-34
6. Ishida Y, Agata Y, Shibahara K, Honjo T. Induced expression of PD-1, a novel member of the immunoglobulin gene superfamily, upon programmed cell death. EMBO J. 1992;11:3887-95
7. Kondo A, Yamashita T, Tamura H, Zhao W, Tsuji T, Shimizu M. et al. Interferon-gamma and tumor necrosis factor-alpha induce an immunoinhibitory molecule, B7-H1, via nuclear factor-kappaB activation in blasts in myelodysplastic syndromes. Blood. 2010;116:1124-31
8. Lee SK, Seo SH, Kim BS, Kim CD, Lee JH, Kang JS. et al. IFN-gamma regulates the expression of B7-H1 in dermal fibroblast cells. J Dermatol Sci. 2005;40:95-103
9. Liu J, Hamrouni A, Wolowiec D, Coiteux V, Kuliczkowski K, Hetuin D. et al. Plasma cells from multiple myeloma patients express B7-H1 (PD-L1) and increase expression after stimulation with IFN-{gamma} and TLR ligands via a MyD88-, TRAF6-, and MEK-dependent pathway. Blood. 2007;110:296-304
10. Loke Pn, Allison JP. PD-L1 and PD-L2 are differentially regulated by Th1 and Th2 cells. Proc Natl Acad Sci U S A. 2003;100:5336-41
11. Qian Y, Deng J, Geng L, Xie H, Jiang G, Zhou L. et al. TLR4 signaling induces B7-H1 expression through MAPK pathways in bladder cancer cells. Cancer Invest. 2008;26:816-21
12. Parsa AT, Waldron JS, Panner A, Crane CA, Parney IF, Barry JJ. et al. Loss of tumor suppressor PTEN function increases B7-H1 expression and immunoresistance in glioma. Nat Med. 2007;13:84-8
13. Jin X, Ding D, Yan Y, Li H, Wang B, Ma L. et al. Phosphorylated RB Promotes Cancer Immunity by Inhibiting NF-kappaB Activation and PD-L1 Expression. Mol Cell. 2019;19:82-96
14. Zhang J, Bu X, Wang H, Zhu Y, Geng Y, Nihira NT. et al. Cyclin D-CDK4 kinase destabilizes PD-L1 via cullin 3-SPOP to control cancer immune surveillance. Nature. 2018;553:91-5
15. Lim SO, Li CW, Xia W, Cha JH, Chan LC, Wu Y. et al. Deubiquitination and Stabilization of PD-L1 by CSN5. Cancer Cell. 2016;30:925-39
16. Ribas A, Wolchok JD. Cancer immunotherapy using checkpoint blockade. Science. 2018;359:1350-5
17. Ansell SM, Lesokhin AM, Borrello I, Halwani A, Scott EC, Gutierrez M. et al. PD-1 blockade with nivolumab in relapsed or refractory Hodgkin's lymphoma. N Engl J Med. 2015;372:311-9
18. Eroglu Z, Zaretsky JM, Hu-Lieskovan S, Kim DW, Algazi A, Johnson DB. et al. High response rate to PD-1 blockade in desmoplastic melanomas. Nature. 2018;553:347-50
19. Nghiem PT, Bhatia S, Lipson EJ, Kudchadkar RR, Miller NJ, Annamalai L. et al. PD-1 Blockade with Pembrolizumab in Advanced Merkel-Cell Carcinoma. N Engl J Med. 2016;374:2542-52
20. Pardoll DM. The blockade of immune checkpoints in cancer immunotherapy. Nat Rev Cancer. 2012;12:252-64
21. Brahmer JR, Drake CG, Wollner I, Powderly JD, Picus J, Sharfman WH. et al. Phase I study of single-agent anti-programmed death-1 (MDX-1106) in refractory solid tumors: safety, clinical activity, pharmacodynamics, and immunologic correlates. J Clin Oncol. 2010;28:3167-75
22. McDermott DF, Drake CG, Sznol M, Sosman JA, Smith DC, Powderly JD. et al. A phase I study to evaluate safety and antitumor activity of biweekly BMS-936558 (Anti-PD-1, MDX-1106/ONO-4538) in patients with RCC and other advanced refractory malignancies. J Clin Oncol. 2011;29:331-331
23. Sznol M, Powderly JD, Smith DC, Brahmer JR, Drake CG, McDermott DF. et al. Safety and antitumor activity of biweekly MDX-1106 (Anti-PD-1, BMS-936558/ONO-4538) in patients with advanced refractory malignancies. J Clin Oncol. 2010;28:2506-2506
24. Garcia-Diaz A, Shin DS, Moreno BH, Saco J, Escuin-Ordinas H, Rodriguez GA. et al. Interferon Receptor Signaling Pathways Regulating PD-L1 and PD-L2 Expression. Cell Rep. 2017;19:1189-201
25. Shin DS, Zaretsky JM, Escuin-Ordinas H, Garcia-Diaz A, Hu-Lieskovan S, Kalbasi A. et al. Primary Resistance to PD-1 Blockade Mediated by JAK1/2 Mutations. Cancer Discov. 2017;7:188-201
26. Sharma P, Hu-Lieskovan S, Wargo JA, Ribas A. Primary, Adaptive, and Acquired Resistance to Cancer Immunotherapy. Cell. 2017;168:707-23
27. Schumacher TN, Schreiber RD. Neoantigens in cancer immunotherapy. Science. 2015;348:69-74
28. Dong C, Yuan T, Wu Y, Wang Y, Fan TW, Miriyala S. et al. Loss of FBP1 by Snail-mediated repression provides metabolic advantages in basal-like breast cancer. Cancer Cell. 2013;23:316-31
29. Jameson KL, Mazur PK, Zehnder AM, Zhang J, Zarnegar B, Sage J. et al. IQGAP1 scaffold-kinase interaction blockade selectively targets RAS-MAP kinase-driven tumors. Nat Med. 2013;19:626-630
30. Hirata H, Sugimachi K, Komatsu H, Ueda M, Masuda T, Uchi R. et al. Decreased Expression of Fructose-1,6-bisphosphatase Associates with Glucose Metabolism and Tumor Progression in Hepatocellular Carcinoma. Cancer Res. 2016;76(11):3265-76
31. Li B, Qiu B, Lee DS, Walton ZE, Ochocki JD, Mathew LK. et al. Fructose-1,6-bisphosphatase opposes renal carcinoma progression. Nature. 2014;513:251-5
32. Jiao J, Wang S, Qiao R, Vivanco I, Watson PA, Sawyers CL. et al. Murine cell lines derived from Pten null prostate cancer show the critical role of PTEN in hormone refractory prostate cancer development. Cancer Res. 2007;67:6083-91
33. Yang J, Jin X, Yan Y, Shao Y, Pan Y, Roberts LR. et al. Inhibiting histone deacetylases suppresses glucose metabolism and hepatocellular carcinoma growth by restoring FBP1 expression. Sci Rep. 2017;7:43864
34. Jin X, Pan Y, Wang L, Ma T, Zhang L, Tang AH. et al. Fructose-1,6-bisphosphatase Inhibits ERK Activation and Bypasses Gemcitabine Resistance in Pancreatic Cancer by Blocking IQGAP1-MAPK Interaction. Cancer Res. 2017;77:4328-41
35. Dorand RD, Nthale J, Myers JT, Barkauskas DS, Avril S, Chirieleison SM. et al. Cdk5 disruption attenuates tumor PD-L1 expression and promotes antitumor immunity. Science. 2016;353:399-403
36. Asberg C, Hjalmarson O, Alm J, Martinsson T, Waldenstrom J, Hellerud C. Fructose 1,6-bisphosphatase deficiency: enzyme and mutation analysis performed on calcitriol-stimulated monocytes with a note on long-term prognosis. J Inherit Metab Dis. 2010;33(Suppl 3):S113-21
37. Choe JY, Fromm HJ, Honzatko RB. Crystal structures of fructose 1,6-bisphosphatase: mechanism of catalysis and allosteric inhibition revealed in product complexes. Biochemistry. 2000;39:8565-74
38. Bu L, Yu G, Wu L, Mao L, Deng W, Liu J. et al. STAT3 induces immunosuppression by upregulating PD-1/PD-L1 in HNSCC. J Dent Res. 2017;96:1027-34
39. Zhang X, Zeng Y, Qu Q, Zhu J, Liu Z, Ning W. et al. PD-L1 induced by IFN-gamma from tumor-associated macrophages via the JAK/STAT3 and PI3K/AKT signaling pathways promoted progression of lung cancer. Int J Clin Oncol. 2017;22:1026-33
40. Escors D, Gato-Canas M, Zuazo M, Arasanz H, Garcia-Granda MJ, Vera R. et al. The intracellular signalosome of PD-L1 in cancer cells. Signal Transduct Target Ther. 2018;3:26
41. Chang CH, Qiu J, O'Sullivan D, Buck MD, Noguchi T, Curtis JD. et al. Metabolic Competition in the Tumor Microenvironment Is a Driver of Cancer Progression. Cell. 2015;162:1229-41
42. Palmer CS, Ostrowski M, Balderson B, Christian N, Crowe SM. Glucose metabolism regulates T cell activation, differentiation, and functions. Front Immunol. 2015;6:1
43. Tu X, Qin B, Zhang Y, Zhang C, Kahila M, Nowsheen S. et al. PD-L1 (B7-H1) Competes with the RNA Exosome to Regulate the DNA Damage Response and Can Be Targeted to Sensitize to Radiation or Chemotherapy. Mol Cell. 2019;74:1215-26.e4
44. Phillips R. Kidney cancer: FBP1 depletion feeds ccRCC. Nat Rev Urol. 2014;11:482
45. Pan D, Mao C, Wang YX. Suppression of gluconeogenic gene expression by LSD1-mediated histone demethylation. PLoS One. 2013;8:e66294
46. Jin X, Pan Y, Wang L, Zhang L, Ravichandran R, Potts PR. et al. MAGE-TRIM28 complex promotes the Warburg effect and hepatocellular carcinoma progression by targeting FBP1 for degradation. Oncogenesis. 2017;6:e312
47. Huynh J, Chand A, Gough D, Ernst M. Therapeutically exploiting STAT3 activity in cancer - using tissue repair as a road map. Nat Rev Cancer. 2019;19:82-96
48. Yu H, Lee H, Herrmann A, Buettner R, Jove R. Revisiting STAT3 signalling in cancer: new and unexpected biological functions. Nat Rev Cancer. 2014;14:736-46
49. Jarnicki A, Putoczki T, Ernst M. Stat3: linking inflammation to epithelial cancer - more than a "gut" feeling? Cell Div. 2010;5:14
50. Lankadasari MB, Aparna JS, Mohammed S, James S, Aoki K, Binu VS. et al. Targeting S1PR1/STAT3 loop abrogates desmoplasia and chemosensitizes pancreatic cancer to gemcitabine. Theranostics. 2018;8:3824-40
51. Zhu H, Chang LL, Yan FJ, Hu Y, Zeng CM, Zhou TY. et al. AKR1C1 Activates STAT3 to promote the metastasis of non-small cell lung cancer. Theranostics. 2018;8:676-92
52. Grivennikov S, Karin E, Terzic J, Mucida D, Yu G-Y, Vallabhapurapu S. et al. IL-6 and Stat3 are required for survival of intestinal epithelial cells and development of colitis-associated cancer. Cancer Cell. 2009;15:103-13
53. Bollrath J, Phesse TJ, von Burstin VA, Putoczki T, Bennecke M, Bateman T. et al. gp130-mediated Stat3 activation in enterocytes regulates cell survival and cell-cycle progression during colitis-associated tumorigenesis. Cancer Cell. 2009;15:91-102
54. Bromberg J, Wang TC. Inflammation and cancer: IL-6 and STAT3 complete the link. Cancer Cell. 2009;15:79-80
55. Hu B, Elinav E, Huber S, Strowig T, Hao L, Hafemann A. et al. Microbiota-induced activation of epithelial IL-6 signaling links inflammasome-driven inflammation with transmissible cancer. Proc Natl Acad Sci U S A. 2013;110:9862-7
Author contact
![]() Corresponding authors: Haojie Huang (huang.haojieedu); Heshui Wu (heshuiwuedu.cn); Xin Jin (jinxinunionedu.cn).
Corresponding authors: Haojie Huang (huang.haojieedu); Heshui Wu (heshuiwuedu.cn); Xin Jin (jinxinunionedu.cn).