Impact Factor
- Issue 14; 2026
- Issue 13; 2026
- Issue 12; 2026
- Issue 11; 2026
- Issue 10; 2026
- Volume 16; 2026
- Advance Articles
- Past Issues
- Cover Images
- Cover Suggestion
- Index & Coverage
- Special Issues
Introduction
Materials and Methods
Results
Discussion
Conclusions
Abbreviations
Supplementary Material
Acknowledgements
References
International Journal of Biological Sciences
International Journal of Medical Sciences
 Global reach, higher impact

Theranostics 2020; 10(26):12072-12089. doi:10.7150/thno.51231 This issue Cite
Research Paper
YTHDF1-enhanced iron metabolism depends on TFRC m6A methylation
Jing Ye1*, Zhanggui Wang2*, Xiaozhen Chen3, Xiaohua Jiang1, Zhihuai Dong1, Sunhong Hu1, Wenya Li1, Yuehui Liu4, Bing Liao4, Weidong Han5 ![]() , Jiaying Shen5
, Jiaying Shen5 ![]() , Mang Xiao1
, Mang Xiao1 ![]()
1. Department of Otolaryngology Head and Neck Surgery, Sir Run Run Shaw Hospital, College of Medicine, Zhejiang University, Hangzhou, Zhejiang, China.
2. Department of Radiotherapy, The Second People's Hospital of Anhui Province, Hefei, Anhui, China.
3. Laboratory of Cancer Biology, Institute of Clinical Science, Sir Run Run Shaw Hospital, College of Medicine, Zhejiang University, Hangzhou, Zhejiang, China.
4. Department of Otorhinolaryngology Head and Neck Surgery, The Second Affiliated Hospital Of Nanchang University, Nanchang, Jiangxi, China.
5. Department of Medical Oncology, Sir Run Run Shaw Hospital, College of Medicine, Zhejiang University, Hangzhou, Zhejiang, China.
*These authors contributed equally to this work.
Received 2020-7-28; Accepted 2020-10-3; Published 2020-10-26
Abstract

Background: Among head and neck squamous cell carcinomas (HNSCCs), hypopharyngeal squamous cell carcinoma (HPSCC) has the worst prognosis. Iron metabolism, which plays a crucial role in tumor progression, is mainly regulated by alterations to genes and post-transcriptional processes. The recent discovery of the N6-methyladenosine (m6A) modification has expanded the realm of previously undiscovered post-transcriptional gene regulation mechanisms in eukaryotes. Many studies have demonstrated that m6A methylation represents a distinct layer of epigenetic deregulation in carcinogenesis and tumor proliferation. However, the status of m6A modification and iron metabolism in HPSCC remains unknown.
Methods: Bioinformatics analysis, sample analysis, and transcriptome sequencing were performed to evaluate the correlation between m6A modification and iron metabolism. Iron metabolic and cell biological analyses were conducted to evaluate the effect of the m6A reader YTHDF1 on HPSCC proliferation and iron metabolism. Transcriptome-wide m6A-seq and RIP-seq data were mapped to explore the molecular mechanism of YTHDF1 function in HPSCC.
Results: YTHDF1 was found to be closely associated with ferritin levels and intratumoral iron concentrations in HPSCC patients at Sir Run Run Shaw Hospital. YTHDF1 induced-HPSCC tumorigenesis depends on iron metabolism in vivo in vitro. Mechanistically, YTHDF1 methyltransferase domain interacts with the 3'UTR and 5'UTR of TRFC mRNA, then further positively regulates translation of m6A-modified TFRC mRNA. Gain-of-function and loss-of-function analyses validated the finding showing that TFRC is a crucial target gene for YTHDF1-mediated increases in iron metabolism.
Conclusion: YTHDF1 enhanced TFRC expression in HPSCC through an m6A-dependent mechanism. From a therapeutic perspective, targeting YTHDF1 and TFRC-mediated iron metabolism may be a promising strategy for HPSCC.
Keywords: Hypopharyngeal squamous cell carcinoma, N6-methyladenosine (m6A) modification, YTHDF1, Iron metabolism, TFRC
Introduction
Head and neck squamous cell carcinoma (HNSCC) is the sixth most common cancer worldwide, with approximately 700,000 cases diagnosed per year [1]. Of all the areas affected (oral, oropharyngeal, nasal/paranasal, laryngeal, hypopharyngeal, cervical esophageal locations, etc.), hypopharyngeal squamous cell carcinoma (HPSCC) has the worst prognosis. HPSCC is generally detected at an advanced stage because of a lack of biomarkers for early diagnosis [2,3].
To date, except for EGFR inhibitors, no FDA-approved targeted therapies are available. With current standard multimodality therapies, the 5-year overall survival (OS) rate remains low, varying between 28% and 41% [4,5]. Increasing evidence indicates that the unique clinical and biological characteristics of HPSCC are due to anatomic location of the tumor and genetic and transcriptome alterations [6,7]. For example, co-occurring CCND1 and CDKN2A mutations, and chromosomal instability markers are associated with chemoradiotherapy outcomes in advanced stage HPSCC patients [8]. We found that multiple genomic alterations have been analyzed in relevance of sensitivity to chemotherapy, targeted therapy, and ionizing radiation [9]. However, few specific biomarkers and therapeutic targets for HPSCC management have identified and validated. Therefore, a better understanding of the molecular mechanism of HPSCC progression is critical.
Iron plays a crucial role in tumor progression due to both its major contributions to tumor survival and reprogramming of the tumor microenvironment [10]. Large-scale epidemiological studies have shown a direct correlation between systemic iron levels and increased cancer risk [11,12]. Dysregulation of iron homeostasis typically manifests as upregulation of iron uptake and downregulation of iron efflux [13]. First, tumor cells exhibit uncontrolled growth and proliferation and require more iron than do normal cells [14-16]. In other words, excessive iron intake by cells is one of the hallmarks of carcinogenesis. Second, cytoplasmic iron is stored mainly as ferritin, which is critical for the maintenance of iron metabolism and protection of cells from oxidative damage [17]; however, the levels of iron and ferritin in malignant tumors can be 5~6-fold higher than those in benign tumors [18]. Excessive iron may cause redox imbalance and generate reactive oxygen species (ROS) in tumor cells, which increase genomic instability and proliferation [19]. Moreover, serum ferritin is also increased in cancer patients compared to healthy individuals [20]. Several studies have suggested that the reprogramming of iron metabolism is a major aspect of HNSCC. Multiple iron-related genes are significantly elevated in HNSCC relative to those in normal squamous epithelium, resulting in increased intratumoral iron accumulation and cell proliferation [21,22]. To date, there is limited knowledge regarding the molecular regulation of intracellular iron metabolism in HNSCC [22].
The identification and functional characterization of proteins that specifically recognize the m6A modification in RNA (RNA m6A) revealed that this modification induces cells to accelerate mRNA metabolism and translation. These proteins include methyltransferase complexes, demethylases, and a group of specific RNA-binding proteins, also known as “writers”, “erasers”, and “readers” [23]. Writers (such as METTL3/METTL14 complexes) and erasers (such as FTO and ALKBH5) determine the prevalence and distribution of m6A. Previous studies demonstrated that the m6A modification mediated by writers METTL3 and METTL14 enhanced the stability of LncAROD, thus exacerbating the malignant behavior of HNSCC cells [24]. METTL14 also drives Epstein-Barr virus (EBV)-mediated tumorigenesis [25]. The m6A reader IGF2BP2 was reported to be upregulated in HNSCC tumor tissues, and high IGF2BP2 expression is associated with poor prognosis for patients with HNSCC [26]. Readers (such as YTHDFs) primarily recruit proteins that mediate the effects of m6A modification on mRNAs [27-29]. For YTHDFs, including YTHDF1, YTHDF2 and YTHDF3; YTHDF1, are enriched in the cytoplasm and have been recognized to enhance the translational efficiency of m6A-modified mRNAs [30]. YTHDF1 expression is amplified in various types of cancers, including HNSCC; furthermore, it has a critical oncogenic role [31-38]. Recent findings also showed that YTHDF1-deficient mice show an elevated antigen-specific CD8(+) T cell anti-tumor response [32]. YTHDF2 mediates mRNA instability [30,39], while YTHDF3 facilitates translation in conjunction with YTHDF1 and affects the decay of m6A-modified mRNAs [40].
Previous studies demonstrated that the m6A modification was correlated with carcinogenesis, tumor proliferation and chemoresistance of cancer cells [31,34,41-43]. However, the effect of m6A modifications on cancer progression depends on whether the m6A target gene is an oncogene or a tumor suppressor, the extent of the change in m6A level in cancer cells, and, most importantly, the post-modification regulation of target mRNA. Despite the numerous discoveries highlighting the association between m6A modification and cancer development, the underlying regulatory mechanism of m6A modification in HPSCC, especially with regard to iron metabolism of HPSCC, remains poorly understood. Herein, we investigated the role of the m6A modification in HPSCC and identified the oncogenic role of YTHDF1. By thoroughly investigating the role of YTHDF1 deregulation in HPSCC, we found that YTHDF1 is closely associated with tumor proliferation and iron metabolism. Our study illustrates the critical role of YTHDF1 in human HPSCC carcinogenesis and iron transport pathways. These results might shed light on possible clinical therapies for treating HPSCC patients with high iron overload.
Materials and Methods
Patient specimens
Two cohorts of HPSCC patients who underwent surgery at individual medical centers between 2012 and 2020 were included in this study.
Tissue specimens from patients in cohort 1 included whole blood, freshly resected cancerous and normal tissues, and paraffin-embedded tissues, all of which obtained from Sir Run Run Shaw Hospital, College of Medicine, Zhejiang University. The blood and excised cancerous and normal tissues were stored and numbered in the Sir Run Run Shaw Hospital biological specimen bank, whereas the paraffin-embedded surgical specimens were permanently stored in the Department of Pathology at Sir Run Run Shaw Hospital.
The tissue specimens from patients in cohort 2 comprised paraffin-embedded surgical specimens, which were obtained from The Second Affiliated Hospital of Nanchang University Medical College.
None of these patients had received radiotherapy or chemotherapy prior to surgery and had no history of hepatic disease.
Iron assay and intracellular chelatable iron (Fe2+) and ROS measurements
Intracellular iron (ferrous iron and ferric iron) levels were determined using an iron assay kit from Sigma-Aldrich (MAK025). Intracellular chelatable iron (Fe2+) was measured with the fluorescent indicator Phen Green SK fluorescent probe (#P- 14313, Life Technologies, Grand Island, NY, USA). Levels of ROS were determined using DCFH-DA (Solarbio, D6470) according to the manufacturer's instructions. The detailed protocols are described in the Supplementary Materials and Methods.
m6A quantification
The global m6A levels in mRNA were measured with an EpiQuik m6A RNA methylation quantification kit (Colorimetric) (Epigenetic, Farmingdale, NY) following the manufacturer's protocol.
RNA-Seq, MeRIP and anti-m6A immunoprecipitation (MeRIP-qPCR)
Total RNA was extracted using Trizol reagent (Invitrogen, CA, USA) following the manufacturer's protocol. Eluted m6A-containing fragments (IP) and untreated input control fragments were converted into the final cDNA library by the dUTP method in accordance with strand-specific library preparation. The average insert size for the paired-end libraries was ~ 100 ± 50 bp. Then, we performed paired-end 2 × 150 bp sequencing on an Illumina NovaSeq 6000 platform at LC-BIO Bio-tech Ltd. (Hangzhou, China) following the vendor's recommended protocol. Real-time PCR was carried out following m6A-IP to quantify the changes in the m6A methylation levels of a specific target gene. The detailed MeRIP and MeRIP-qPCR protocols are described in the Supplementary Materials and Methods.
RNA immunoprecipitation (RIP) and high-throughput sequencing
The enrichment of RNA was normalized to the IgG level. cDNA libraries were produced by employing an NEBNext UltraRNA Library Prep Kit for Illumina (New England Biolabs) and sequenced on an Illumina NovaSeq 6000 platform at LC-BIO Bio-tech Ltd. (Hangzhou, China) following the vendor's recommended protocol. RIP was performed using an EZ-Magna RIP RNA-binding protein immunoprecipitation kit (Millipore) following the manufacturer's protocol with some modifications. The detailed protocol is described in the Supplementary Materials and Methods.
Statistical analyses
Bioinformatic analyses, including Gene Ontology (GO), Kyoto Encyclopedia of Genes and Genomes (KEGG), and gene set enrichment analysis (GSEA), were performed using the OmicStudio tools at https://www.omicstudio.cn/tool. All statistical analyses were carried out using GraphPad Prism version 7 (GraphPad Software, CA) for Windows or R software (www.r-project.org). Statistical significance was assessed by unpaired two tailed Student t-tests, analysis of variance (ANOVA) or Spearman rank correlation. Recurrence-free survival was evaluated by the Kaplan-Meier method and log-rank test. The data are expressed as the means ± SD. Statistical significance was indicated as follows: n.s. no significance, *p < 0.05; **p < 0.01; ***p < 0.001, ****p < 0.0001. Each experiment was repeated independently at least three times.
More detailed materials and methods are in the Supplementary Materials and Methods.
Results
YTHDF1 is closely correlated with iron metabolism in HPSCC
To investigate the potential factors and mechanisms involved in intracellular iron levels in the general context of HNSCC, we analyzed the expression levels of iron-related genes by evaluating RNA-sequencing (RNA-seq) data from The Cancer Genome Atlas (TCGA) HNSCC data set, which contains 504 pairs of HNSCC and matched normal specimens. The expression patterns of genes critical for iron metabolism, including aconitase 1 (ACO1, also known as IRP1), cytochrome b reductase 1 (CYBRD1), ferritin heavy chain (FTH1), ferroportin (FPN, also known as SLC40A1), hepcidin antimicrobial peptide (HAMP), SLC11A1 and transferrin receptors (TFRCs), were assessed. Among those iron-related genes, FTH1 and TFRC showed significantly elevated expression (Figure 1A). Next, the expression patterns of m6A RNA methylation regulators were assessed, which revealed that the expression levels of multiple regulators were remarkably different between the HNSCC tumor samples and normal control samples (Figure S1A).
YTHDF1 is closely correlated with iron metabolism in HPSCC cells. (A) The results of iron regulatory gene expression assessments determined by RNA-seq with TCGA data are shown. *p < 0.05; **p < 0.01; ***p < 0.001; ***p < 0.0001. (B) The correlation matrix shows the relationship between the expression of m6A-modified genes and serum ferritin levels in 50 HPSCC patients in cohort 1. The expression of m6A- modified genes was detected by quantitative real-time PCR (qPCR). (C) Correlation between YTHDF1 expression and serum ferritin level in 50 HPSCC patients from cohort 1. YTHDF1 expression was detected by qPCR. (D) Correlation between YTHDF1 expression and intratumoral iron content (nmol) in 50 HPSCC patients from cohort 1. YTHDF1 expression was detected by qPCR. (E) Representative cervical contrast MR images and YTHDF1 IHC images of samples from HPSCC patients with high and low intratumoral iron concentrations (ICs) in cohort 1. Representative T1- and T2-weighted (WI) cervical MR images of patients with different levels of iron overload. Scale bar = 100 µm (10×, 40×). (F) Statistical analysis of the relative expression of YTHDF1 (IHC score) in HPSCC patients with high and low ICs based on unpaired Student's t-tests. (G-H) Gene Ontology (GO) (G) and Kyoto Encyclopedia of Genes and Genomes (KEGG) (H) analyses of 860 significantly enriched upregulated genes and 889 significantly enriched downregulated genes as identified by RNA-seq. (I) GSEA plots showing the pathways of differentially expressed genes altered by YTHDF1 and involved in HPSCC.
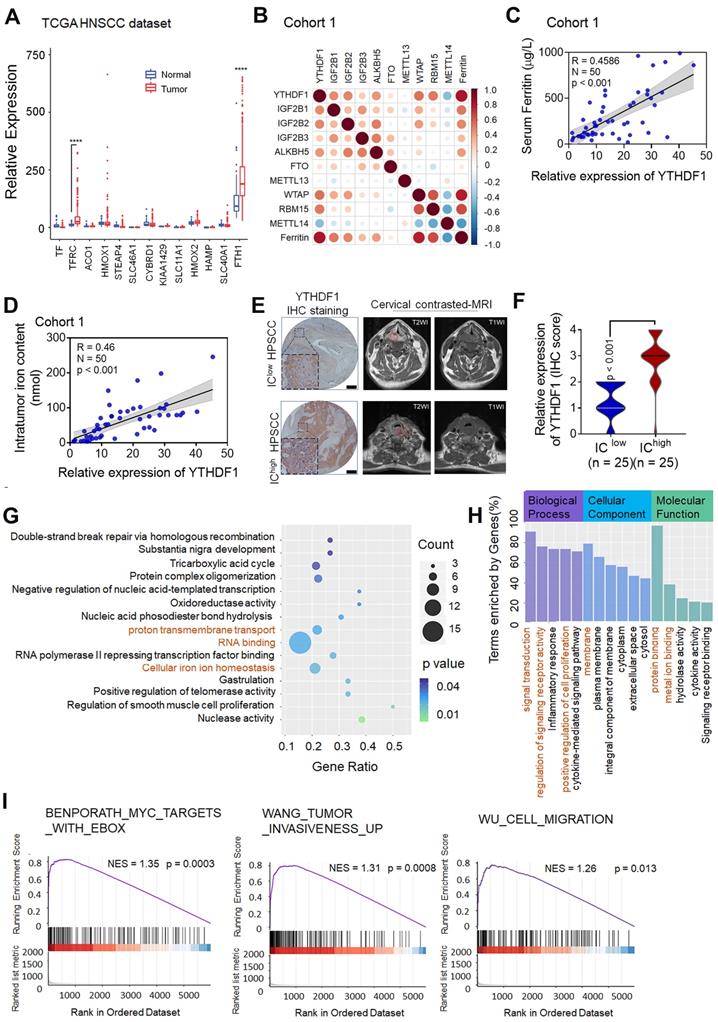
Because ferritin is encoded by FTH1 and TFRC is the most important gene for intracellular iron uptake, we concentrated on exploring the correlation between m6A modification and both ferritin level and intratumoral iron concentration in HPSCC patients. Analyses of ferritin expression and m6A modifications were then undertaken using samples from 50 primary HPSCC patients in cohort 1 with measured ferritin expression and pre-operative cervical magnetic resonance imaging (MRI). There was a significant positive correlation between serum ferritin and YTHDF1 expression, as measured by serum ferritin concentration (Figure 1B-C). In addition, a significant correlation between intratumoral iron content (nmol) and relative YTHDF1 expression was observed in the HPSCC patients of cohort 1 (Figure 1D). To validate this correlation, intratumoral iron concentration (IC) based on the relaxation rates R2 (1/T2) of the cervical contrast MRI was measured by an experienced radiologist at Sir Run Run Shaw Hospital (Figure 1E). The R2 and R2* values generated comparable estimates of non-invasive intratumoral IC in a study by Wood et al [44]. Data analysis revealed a remarkable correlation between high IC values and YTHDF1 immunohistochemical (IHC) staining (Figure 1F). However, quantification of RNA methylation revealed that the level of m6A modification was not increased in the HPSCC patients with higher serum ferritin, nor did it affect the intratumoral iron content (nmol) (Figure S1B-C).
To elucidate whether YTHDF1 plays a role in HPSCC iron metabolism and tumorigenesis, we performed transcriptome sequencing (RNA-seq) with YTHDF1-knockdown and control HPSCC FaDu cells. YTHDF1 knockdown induced by lentiviral shRNAs was confirmed at both the mRNA and protein levels (Figure S1D-E). A total of 34083 genes were identified and quantified by RNA-seq. YTHDF1 knockdown resulted in 1749 significantly altered genes (Student's t-test, p < 0.05) comprising 860 upregulated genes (49.1%) and 889(50.8%) downregulated genes (Figure S1F). KEGG and GO analysis showed that the following pathways were enriched with these genes: signal transduction, regulation of signaling receptor activity, protein binding, oxidation-reduction process, cellular iron homeostasis and cell proliferation (Figure 1G-H). GSEA of the RNA-seq data revealed gene signatures relating to tumor invasiveness, migration and Myc proto-oncogene protein (MYC, a known major contributor to TFRC upregulation in cancer cells), which were enriched in the control HPSCC cells compared with the YTHDF1-knockdown cells, indicating a role for YTHDF1 in HPSCC tumorigenesis and proliferation [45] (Figure 1I). Taken together, these data suggest that YTHDF1 promotes tumor progression and iron metabolism in HPSCC.
YTHDF1 promotes iron metabolism in HPSCC cells
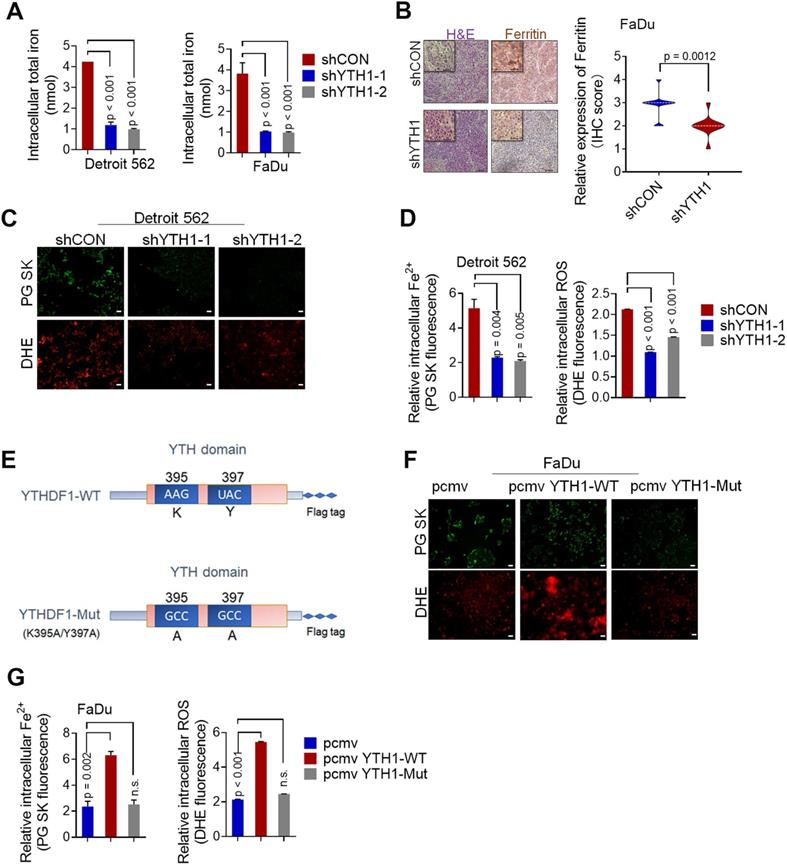
According to the literature, iron accumulation in the cell via extracellular transport into cells or ferritin release result in the formation of a common labile iron (Fe2+) pool (LIP) that is available for redox cycling [46,47]. The LIP can readily contribute to steady-state levels of ROS in cancer cells through Fe2+-dioxygen biochemistry and Fenton reactions, increasing genomic instability and proliferation [48-50]. Therefore, the LIP is an active hub in the genesis of cancer that links iron metabolism to the hallmarks of cancer [51]. In vitro experiments showed that YTHDF1 knockdown significantly decreased total HPSCC intracellular iron levels (Figure 2A), whereas in vivo experiments indicated that tumor xenografts with YTHDF1 knockdown had lower ferritin expression, as determined by IHC analysis (Figure 2B). To determine whether YTHDF1 directly promotes HPSCC iron metabolism, we conducted intracellular Fe2+ and ROS analyses. As predicted, knocking down YTHDF1 remarkably reduced the intracellular Fe2+ and ROS levels, as determined by Phen Green SK fluorescence iron staining and dihydroethidium (DHE) ROS staining, respectively (Figure 2C-D). To elucidate whether YTHDF1-regulated iron metabolism is dependent on m6A modifications, we generated two point mutations, K395 and Y397, in the YTH domain and added a FLAG tag. Mutating the YTH domain abrogated the binding capacity of YTHDF1 with mRNA (Figure 2E), as reported in previous studies [52,53]. Both YTHDF1 wild-type (YTH1-WT) and mutant (YTH1-Mut) recombination plasmids were successfully transfected into FaDu cells (Figure S1G). We found that ectopic expression of YTH1-WT increased intracellular Fe2+ and ROS levels, while abrogating the activity of the YTH domain dramatically decreased both intracellular Fe2+ and ROS levels in FaDu cells (Figure 2F-G). Considering these results, we suggest that YTHDF1 promotes HPSCC iron metabolism in an m6A-dependent manner.
YTHDF1 promotes iron metabolism in HPSCC cells. (A) Intracellular iron levels (nmol) were measured using an iron assay kit with Detroit 562 and FaDu HPSCC cells transfected with shCON or shYTHDF1. (B) Xenograft tumor masses harvested from shCON- or shYTHDF1-transfected FaDu cells. Representative images of H&E stained cells were used to evaluate ferritin expression. (C) Representative fluorescence microscopy was used to evaluate intracellular Fe2+ and ROS levels in Detroit 562 cells transfected with shCON or shYTHDF1 and then stained with Phen Green (green) and LDH (red). Scale bar = 100 µm. (D) Quantification of Phen Green- and LDH-positive cells shown in (b), analysed by flow cytometry. The ratio of the mean fluorescence intensity (MFI) was calculated for each sample. The data were normalized to those of the control samples as shown by the relative Fe2+ or ROS ratios. (E) Schematic representation of the wild-type (YTHDF1-WT) and mutant (YTHDF1-Mut) YTHDF1 constructs. (F) Representative fluorescence microscopy showing intracellular Fe2+ and ROS levels in Detroit 562 cells transfected with a control vector, pCMV-YTHDF1-WT or pCMV-YTHDF1- Mut plasmid and stained with Phen Green (green) and LDH (red) (F). Scale bar = 100 µm. (G) Quantification of Phen Green- and LDH-positive cells shown in (e), analysed by flow cytometry. The ratio of the mean fluorescence intensity (MFI) was calculated for each sample. The data were normalized to those of the control samples as shown by the relative Fe2+ or ROS ratios. Means±SEM, unpaired Student's t-tests. WT: Wild-type, YTH1:YTHDF1, PG: Phen Green.
YTHDF1-induced HPSCC proliferation depends on the promotion of iron metabolism
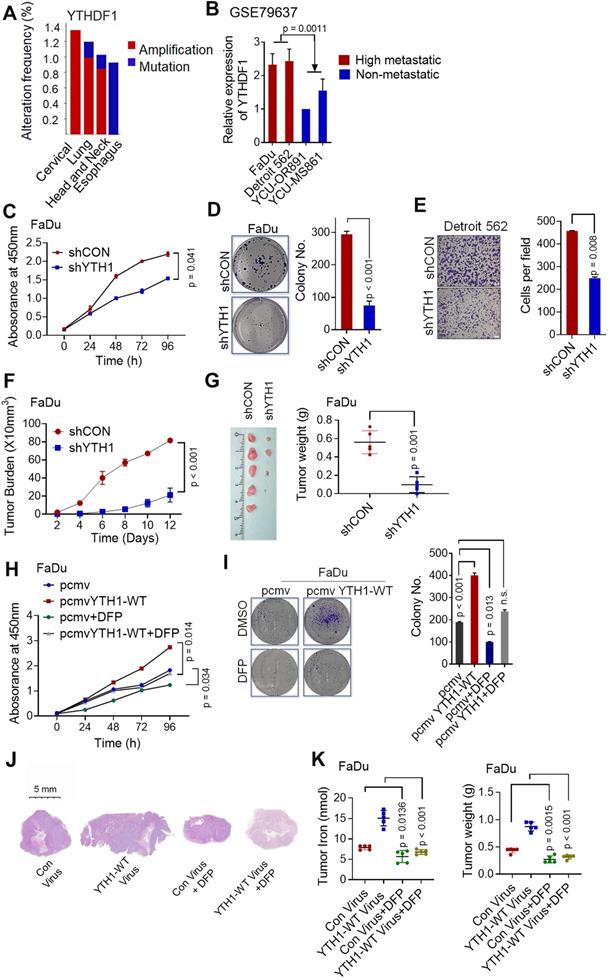
Shown by the cBioPortal network, YTHDF1 is frequently amplified and mutated in various squamous cell carcinomas (cervical, lung, head and neck, and esophageal cancers) (Figure 3A). In addition, based on a GEO dataset (GSE79637) of HNSCC specimens, YTHDF1 expression was more prominent in highly metastatic lines (FaDu origin: hypopharynx, Detroit 562 origin: pleural effusion) than in nonmetastatic lines (YCU-OR891 origin: oral floor, YCU-MS861 origin: maxillary sinus) (Figure 3B). The function of YTHDF1 in HPSCC has never been reported. Our functional validation data showed that, compared with the shRNA control cells, Detroit 562 and FaDu cells with YTHDF1 knockdown showed significant reductions in viability (Figure 3C), colony formation (Figure 3D), and migration (Figure 3E) in vitro. Knocking down YTHDF1 dramatically mitigated tumor growth, as reflected by tumor volumes and weights in the xenograft mouse models (Figure 3F-G). Furthermore, overexpression of YTHDF1-WT increased the proliferation (Figure S2A), colony formation (Figure S2B) and migration (Figure S2C) of Detroit 562 cells. YTHDF1 overexpression also remarkably increased xenograft tumor volumes (Figure S2D) and weights (Figure S2E); however, the same significant oncogenic effect was not observed in cells overexpressing YTHDF1-Mut in vitro (Figure S2A-C) or in vivo (Figure S2D-E). In addition, treatment with deferiprone (DFP, a new generation of intracellular iron chelators in clinical trials [48,54,55]) significantly blocked YTHDF1-induced HPSCC iron accumulation, growth and colony formation in vivo and in vitro (Figure 3H-L). The data strongly suggest that YTHDF1 plays a pivotal role in cancer progression by regulating intracellular iron metabolisms. We also confirmed that the YTHDF1 protein in the xenograft mouse models were not significantly affected upon DFP treatment by Western blot analysis (Figure S2F), excluding the possibility that cellular iron level regulated YTHDF1 levels. These data strongly suggest that YTHDF1 plays a pivotal role in cancer progression by regulating intracellular iron metabolism.
YTHDF1 promotes HPSCC cell proliferation by regulating intracellular iron metabolism. (A) YTHDF1 is frequently amplified in various squamous cell cancers (cervical, lung, head and neck, oesophagus, etc.) according to cBioPortal data sets. Colors indicate mutations (green), deletions (blue), and amplifications (red). (B) Expression of YTHDF1 mRNA in highly metastatic cell lines (FaDu origin: hypopharynx, Detroit 562 origin: pleural effusion) and nonmetastatic lines (YCU-OR891 origin: oral floor, YCU-MS861 origin: maxillary sinus); data were generated from a network database. (C-E) CCK-8 (C), colony formation (D) and Transwell (E) assays were performed to determine the proliferation and growth of HPSCC cells with YTHDF1 knockdown. Magnification: E, 5 ×, scale bar = 100 µm. (F,G) Xenograft tumor masses harvested from shCON- and shYTHDF1-transfected FaDu cells. Tumor burden was measured at the indicated time points (F), and tumor weight was measured 12 days after injection (G). (H,I) CCK-8 (H) and colony formation (I) assays were performed with FaDu cells transfected with a control vector or pCMV-YTHDF1-WT plasmid and subsequently treated with 1 mM DFP. (J-L) Representative images of H&E-stained tissues to evaluate xenograft tumor formation (J), tumor volumes (K), and intratumoral iron levels (L) in nude mice bearing FaDu cells transfected with a control vector or pCMV-YTHDF1-WT plasmid with or without DFP treatment (1 mg/mL in drinking water). The results are presented as the mean± SEM of 5 mice per group per time point, unpaired Student's t-test. WT: wild-type, YTH1: YTHDF1; DFP: deferiprone. Figure 3K and Figure S2E show the same control virus and YTHDF1-WT virus xenograft groups.
Transcriptome-wide m6A-seq, RNA-seq and RIP-seq assays identify potential targets of YTHDF1 in HPSCC
To identify and localize m6A sites, YTHDF1-knockdown and control FaDu cells were subjected to transcriptome-wide m6A-sequencing (m6A-seq and MeRIP-seq) assays. Principal component analysis (PCA) showed that two repeats (shCON: control1 and control2; shYTHDF1: shY11 and shY12) of each sample clustered together, suggesting good repeatability among the two replicates of each group (Figure S3A). By applying the HOMER motif discovery tool, we found that the “GGAC” consensus sequence was the primary motif enriched in the m6A peaks (Figure 4A). In agreement with previous reports, we found that the m6A peak density was not significantly changed (Figure 4B). Peaks were located in protein-coding transcripts and enriched in the 5'UTR and 3′UTR, especially near stop codons (Figure 4B-C).
Transcriptome-wide m6A-seq, RNA-seq and RIP-seq assays. (A) The m6A motif detected by the HOMER motif discovery tool with m6A-seq data. Metagene plot depicting nearly unchanged m6A-peak distributions and similar GGAC consensus motifs in the shCON- and shYTHDF1-transfected FaDu cells (both replicates). (B) Density distribution of the m6A peaks across mRNA transcripts. The upstream untranslated region (5′UTR), coding region (CDS), and downstream untranslated region (3′UTR) were divided into 100 segments, and the percentages of peaks within each segment were determined. (C) Proportion of m6A peak distribution in the 5'UTR, start codon, CDS, stop codon and 3'UTR region in the entire set of mRNA transcripts. (D) Distribution of genes with a significant change in both m6A level (log2 FC) and gene expression level (log2 FC) in the shCON- and shYTHDF1-transfected FaDu cells. (E) Venn diagram illustrating the overlapping genes identified by m6A-seq, RIP-seq, and RNA-seq. (F) Flow chart of the selected candidate YTHDF1 target genes in FaDu cells. (G-I) IGV tracks displaying the distribution of m6A peaks and YTHDF1-binding peaks among the indicated genes according to m6A-seq and YTHDF1 RIP-seq of FaDu cells.
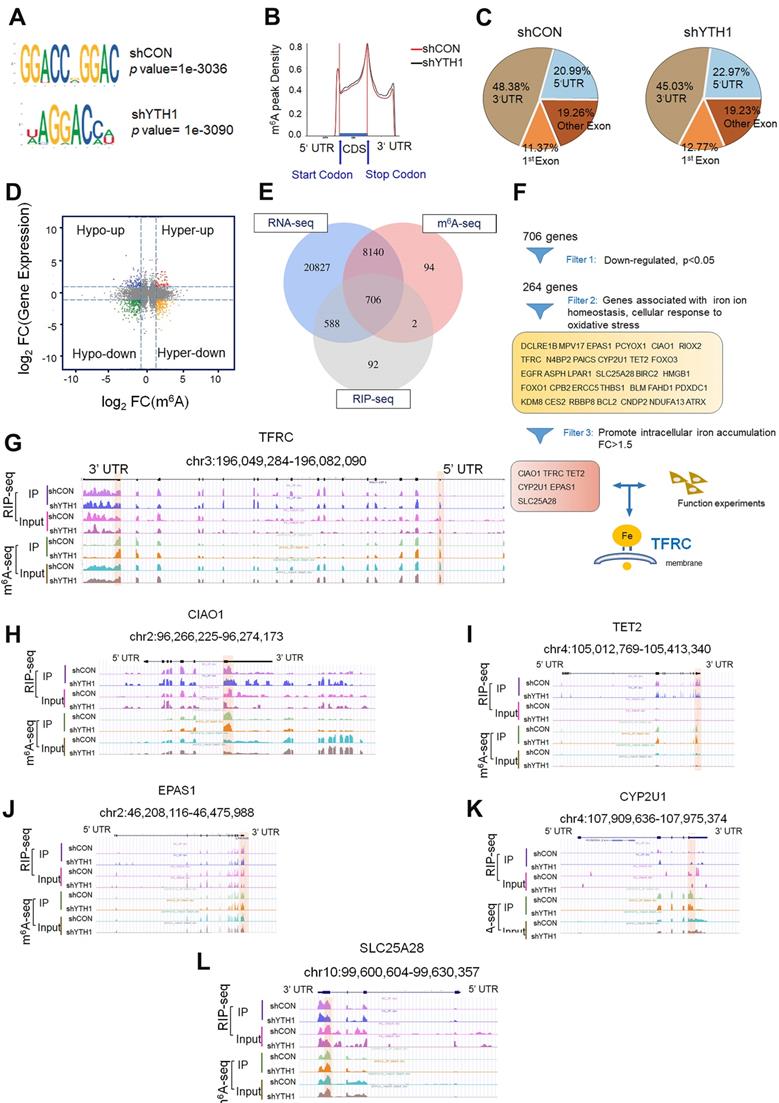
Upon analysis of the RNA-seq data, the general transcription level did not change after YTHDF1 was knocked down in HPSCC cells, suggesting that the loss of YTHDF1 did not change the RNA abundance (Figure S3B-C). A total of 8846 (29.2%) m6A-modified transcripts overlapped with the RNA-seq data. The general m6A level of transcripts was not significantly changed, as 51.5% (7505 of 14562) of the genes were downregulated, and 48.5% (7050 of 14562) of the genes were upregulated. However, the general gene expression of YTHDF1 targets was downregulated in the YTHDF1-knockdown FaDu cells compared with that in the shCON cells (Figure 4D). We verified this result by quantitative analysis of global RNA m6A levels in YTHDF1-knockdown and control FaDu cells, as measured with an EpiQuik m6A quantification assay. Indeed, no noticeable difference was found in the m6A levels of the two samples (Figure S3D). These results were in line with previous findings showing that YTHDF1 does not affect the RNA abundance of its targets but rather regulates protein synthesis by interacting with m6A-methylated mRNAs [32,35].
As a crucial m6A reader, YTHDF1 promotes the translation of m6A-methylated mRNAs and recruits translation initiation factors, thereby significantly improving translation efficiency [56]. Therefore, we sequenced RNA obtained from the immunopurified complex of YTHDF1 (RIP-seq) to identify YTHDF1-bound mRNAs. RIP-seq revealed 2450 mRNAs as candidate targets of YTHDF1 (Figure S3E). Overlapping genes found through the RNA-seq, m6A-seq, and RIP-seq data analyses showed that 706 genes bound by YTHDF1 were marked with m6A (Figure 4E). Among these 706 genes, 264 were downregulated. YTHDF1 is known to bind and affect m6A-methylated transcripts [30,57]. Therefore, mRNA transcripts of proteins that were downregulated in YTHDF1-knockdown cells were likely potential targets. Moreover, GSEA showed that these 264 downregulated genes are involved in RNA metabolic processes, including GO_RNA binding, Reactome_Metabolism of RNA, GO_cellular iron homeostasis, and GO_Regulation_of_Transmembrane_Transport (Figure S3F). Six genes (CIAO1, TFRC, TET2, CYP2U1, EPAS1, and SLC25A28) with significantly decreased expression in the YTHDF1-knockdown cells (p < 0.05, fold change > 1.5) were selected as potential candidates (Figure 4F). Noticeably, the m6A peaks fit well with YTHDF1-binding enrichment sequences (m6A-seq+RIP-seq) in these transcripts, as shown by Integrative Genomics Viewer (IGV) software (Figure 4G-L). Significant m6A peaks as well as YTHDF1 binding enrichment in the TFRC were observed (Figure 4G).
TFRC is overexpressed on the extracellular surface of the plasma membrane in a variety of solid cancer cells, where they enable increased iron uptake [45]. Upon release from the TF-TFRC complex into the cytosol, ferric iron is reduced to ferrous iron by ferrireductases within endosomes [58,59]. Moreover, TFRC is involved in the gene enrichment of RNA binding, iron homeostasis, and WEI_mycn targets with e-boxes. Several studies have suggested that the group of transcription factors regulating TFRC has oncogenic implications [48]. Consistent with our results, previously reported m6A, RIP and CLIP data from the m6A2Target Database (http://m6a2target.canceromics.org/#/search/TFR) identified TFRC mRNA as a potential target of m6A readers (GSE78030, GSE92021, GSE78507, and GSE86214) on the 3'UTR, exons or promoter-TSS sites. In conclusion, TFRC is a functional target of YTHDF1 in HPSCC cells.
YTHDF1 regulates TFRC expression in HPSCC in an m6A methyltransferase- dependent manner
The best-studied m6A-dependent functions of the YTH family include regulation of mRNA stability, translation, splicing and lncRNA-mediated gene silencing [56]. YTHDF1 facilitates the translation of m6A-modified mRNAs and induces a rapid gene expression response and controlled protein production capacity without changing the overall of mRNA levels [56]. To examine whether TFRC is a direct target of YTHDF1, we assessed the transcription and translation of TFRC upon YTHDF1 knockdown. In line with the documented functions of YTHDF1, knocking down YTHDF1 decreased the protein level of TFRC without affecting mRNA expression in both Detroit 562 and FaDu cells (Figure 5A-B).
YTHDF1 regulates TFRC expression in HPSCC cells in an m6A methyltransferase-dependent manner. (A) Relative RNA level of TFRC in Detroit 562 and FaDu cells upon YTHDF1 knockdown. (B) Western blot analysis of the protein level of TFRC in Detroit 562 and FaDu cells upon YTHDF1 knockdown. (C,D) RIP analysis of the interaction of the 5'UTR (C) and 3'UTR (D) of TFRC mRNA in FaDu cells transfected with the FLAG-YTHDF1-WT plasmid. Enrichment of TFRC with FLAG was measured by qPCR and normalized to the input level. (E) Western blot analysis of the protein level of TFRC in Detroit 562 and FaDu cells transfected with the YTHDF1-WT or YTHDF1-Mut plasmid. (F) Schematic representation of wild-type (TFRC-WT) and m6A mutant (TFRC-Mut) TFRC constructs. (G) Relative luciferase activity of the WT or Mut TFRC-5′UTR and TFRC-3′UTR luciferase reporter in FaDu cells transfected with control vector or shYTHDF1. Firefly luciferase activity was measured and normalized to Renilla luciferase activity. (H) Relative luciferase activity of WT and Mut (A-to-T mutation) TFRC-5′UTR and TFRC- 3′UTR luciferase reporters in Detroit 562 cells transfected with pCMV-YTHDF1-WT or pCMV-YTHDF1-Mut plasmid. Firefly luciferase activity was measured and normalized to Renilla luciferase activity. (I,J) The m6A modification in the 5'UTR (I) and 3'UTR (J) of TRFC mRNA in Detroit 562 and FaDu cells with YTHDF1 knockdown, as assessed by gene-specific m6A-RIP-qPCR assays. Error bars indicate the means ± SEM, n = 3; unpaired Student's t-test.
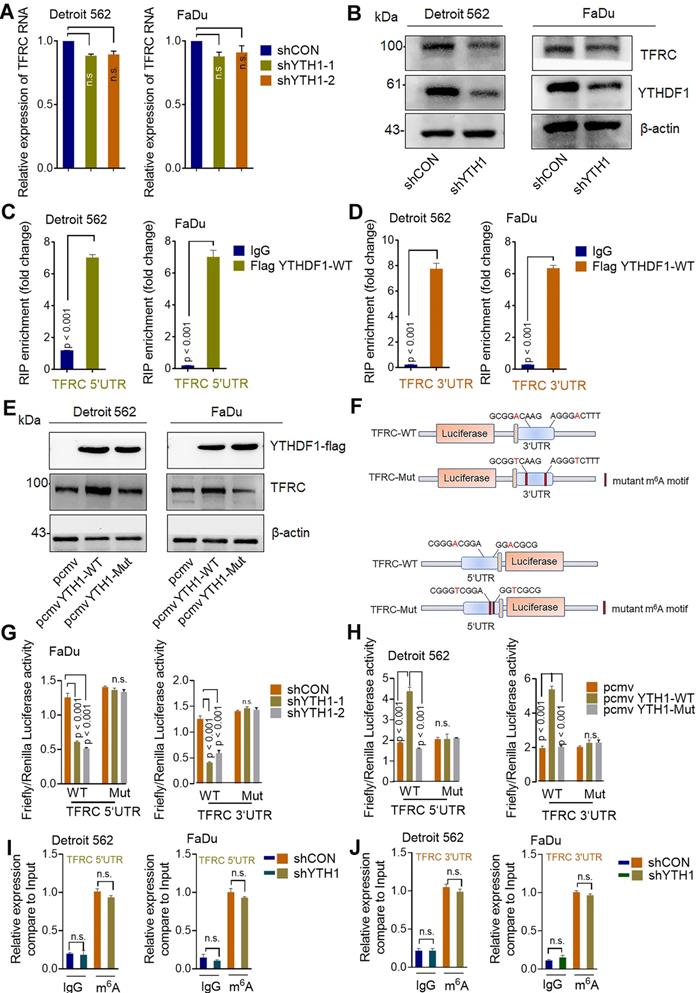
Moreover, RIP using an antibody against FLAG followed by qPCR (RIP-qPCR) revealed that the 3'UTR and 5'UTR of TFRC mRNA were immunoprecipitated effectively in both Detroit 562 and FaDu HPSCC cells transfected with YTHDF1-WT (Figure 5C-D). Moreover, we found that cells transduced with YTHDF1-WT but not YTHDF1-Mut exhibited increased protein expression of TFRC (Figure 5E). Additionally, we constructed both WT and mutant TFRC luciferase reporter plasmids, which contained the WT 3'UTR and 5'UTR of TFRC or mutated sequences in which an adenosine residue that undergoes the m6A modification was replaced by a T residue (TFRC-m6A Mut) (Figure 5F). As expected, compared with shCON cells, shYHDF1 cells showed substantially reduced luciferase activity of the individual reporter constructs carrying the WT 3′UTR and 5'UTR fragments of TFRC, and this decrease was completely abrogated in cells expressing the 3′UTR and 5'UTR mutant variants (Figure 5G). Furthermore, overexpression of WT YTHDF1 but not mutant YTHDF1 significantly increased the luciferase activity of the individual reporter constructs carrying the WT 3′UTR and 5'UTR fragments of TFRC in FaDu cells (Figure 5H). Then, we assessed the m6A modification status of TFRC mRNA by a gene-specific m6A assay, but no significant enrichment of TFRC mRNA was observed in HPSCC cells (Figure 5I-J). To test whether YTHDF1 contributed to TFRC protein degradation, control and YTHDF1-knockdown Detroit 562 cells were treated with the protein translation inhibitor cycloheximide (CHX) [60,61]. Western blot analysis revealed that knocking down YTHDF1 had no effect on the stability of TFRC protein in HPSCC cells (Figure S4A).
Next, we performed the polysome profiling assay. Polysome profiling supported the decreases of 80S monosome assembly and polysomes in shYTHDF1 Detroi562 cells (Figure S4B). The qRT- PCR showed that YTHDF1 knockdown resulted in significant lower TFRC mRNA in translation fractions (Figure S4C). These results support the notion that YTHDF1 regulates protein synthesis while excluding the possibility that YTHDF1 affects TFRC protein stability. Noticeably, TFRC is predominantly regulated by the iron regulatory protein (IRP/IRE) system at both the transcriptional and post-transcriptional levels [62]. To determine whether YTHDF1 regulates the IRE/IRP system, we reanalyzed the sequence data. Neither different m6A peaks in the mRNA nor significant gene expression of these proteins was observed in the m6A-seq data. RIP-seq data indicated that IREB2 and YTHDF1 could bind each other, but RIP-qPCR failed to validate this finding (data not shown). These results confirmed that YTHDF1 enhanced TRFC expression via its methyltransferase domain at translational level.
TFRC is a crucial target gene for the YTHDF1 promotion of iron metabolism
The major mechanism by which m6A exerts its effects is determined by m6A-binding proteins [56]. Therefore, we conducted functional experiments to investigate whether TRFC participates with YTHDF1 in promoting iron metabolism. WT and YTHDF1-knockdown HPSCC cells were transfected with control or TFRC-overexpressing plasmids. The overexpression efficiency of TFRC in Detroit 562 and FaDu cells was confirmed by Western blot analysis (Figure S5A). Ectopic expression of TFRC partially restored the viability (Figure 6A), colony formation ability (Figure 6B) and xenograft tumor growth (Figure 6C) of YTHDF1-knockdown cells. The efficiency of TFRC shRNAs was confirmed by qPCR and Western blot analysis (Figure S5B-C). TFRC downregulation also led to significantly impaired YTHDF1-induced increases in cell viability and migration (Figure S5D-E). These results strongly indicated that TFRC is a critical target gene of YTHDF1 in HPSCC cells.
TFRC is a crucial target gene for the YTHDF1 promotion of iron metabolism. (A,B) CCK-8 (A) and colony formation (B) assays were performed after shCON and YTHDF1- knockdown Detroit 562 cells were transfected with the GV272 or GV272-TRFC-WT plasmid. (C) Masses of the xenograft tumors harvested from different groups. Tumor weight was measured 12 days after injection. (D) Intracellular iron levels (nmol) were measured in the GV272- and GV272-TRFC-WT- transfected shCON and YTHDF1-knockdown Detroit 562 and FaDu cells. (E,F) Flow cytometry and quantification of Phen Green- and LDH-positive shCON and YTHDF1-knockdown Detroit 562 cells transfected with the GV272 or GV272-TRFC-WT plasmid showing intracellular Fe2+ levels (E) and ROS levels (F).
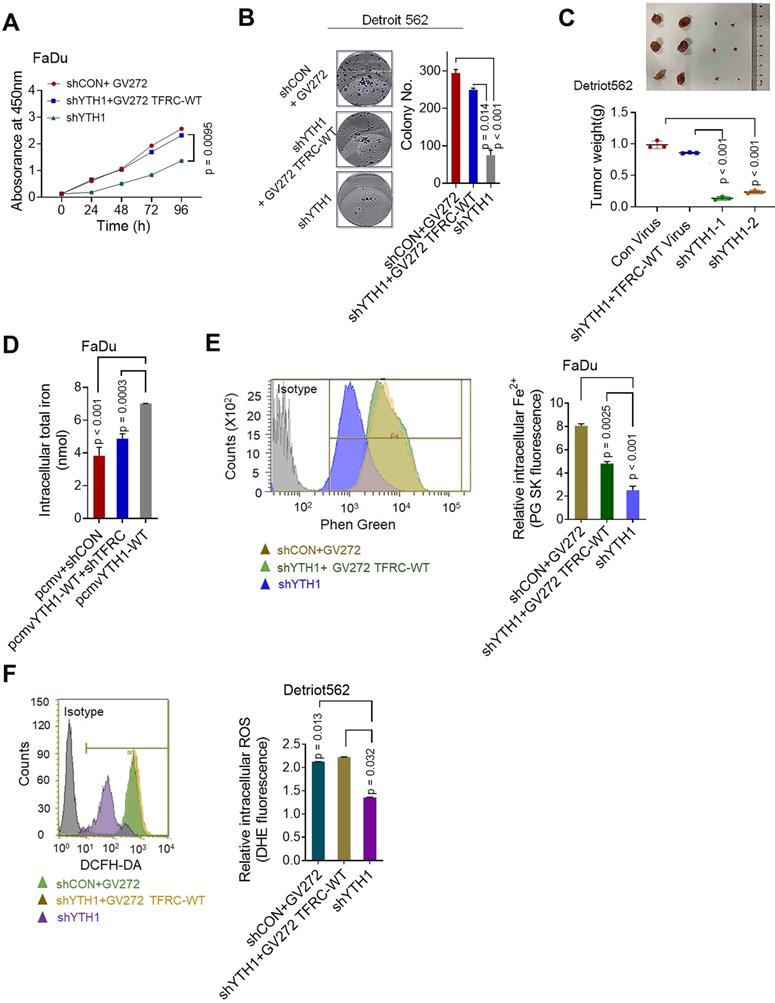
The intracellular iron level and ROS were synchronously assessed. As expected, TRFC overexpression restored the reductions in intracellular iron content, Fe2+ levels and ROS levels in YTHDF1-knockdown cells (Figure 6E-F). Furthermore, the downregulation of TFRC significantly reduced YTHDF1-mediated increases in iron content, intracellular Fe2+ level and ROS level in FaDu cells (Figure S5F-H). As TFRC expression led to increased iron uptake, we next measured the expression of STEAP4, an important ferrireductase that facilitates increased iron uptake by cells [63]. FTH1 is a protein with ferroxidase activity that facilitates the conversion of excess Fe2+ to Fe3+ and then stores it in ferritin. Western blot analysis showed that TFRC downregulation also reduced the YTHDF1-induced increase in the protein levels of STEAP4 and FTH1, TRFC overexpression restored the protein levels of STEAP4 and FTH1 in YTHDF1-knockdown cells (Figure S5I). Taken together, the data show that TRFC mediates the iron regulatory function of YTHDF1 in HPSCC cells.
YTHDF1 is linked to poor prognoses of HPSCC patients receiving CCT/RT treatment
We next performed IHC analyses of HPSCC and paracancerous tissues from patients in cohort 1 and cohort 2. The percentage of YTHDF1-expressing cells was significantly higher in HPSCC tissues (65.7%; 67/102) than in normal epithelium tissues (17.1%; 12/70) (Figure 7A). A significant difference was found between the clusters of T stage and N stage tissues (Figure 6SA-B). In addition, samples with higher YTHDF1 expression showed intense TFRC staining, while samples with low YTHDF1 expression displayed lower levels of TFRC staining (Figure 7B-C). Surprisingly, Kaplan-Meier analysis showed that elevated TFRC expression in HPSCC cells was associated with poor prognosis; however, patients with high YTHDF1 expression did not have shorter disease-free survival, in contrast to our expectations (Figure 7D-E). We obtained similar results when analyzing the TCGA head and neck dataset (Figure 6SC-D).
YTHDF1 links poor prognosis in HPSCC patients with CCT/RT treatments. (A) Quantification of YTHDF1 expression in cancerous and paired paracancerous tissues from patients in cohort 1 and cohort 2. (B) Representative IHC images of YTHDF and TFRC in HPSCC tissues from patients in cohort 1 and cohort 2. Scale bar = 100 µm (40 ×). (C) Pearson's rank correlation of YTHDF1 and TFRC proteins in HPSCC tissues from patients in cohort 1 and cohort 2 based on the IHC analysis. (D,E) Kaplan-Meier analysis of HPSCC patients to determine the correlations between YTHDF1 expression (D), TRFC expression (E) and recurrence-free survival based on data generated from IHC staining of HPSCC tissues. (F,G) Statistical analysis of the relative expression of TFRC (F) and serum ferritin (G) in HPSCC patients treated with or without CCT/RT, as assessed by the Mann-Whitney U test. (H,I) Kaplan-Meier analysis of HPSCC patients treated with CCT/RT to determine the correlations between YTHDF1 expression (H), TRFC expression (I) and recurrence-free survival. (J) Proposed model of the relationship between TFRC expression enhanced by the m6A modification reader YTHDF1, HPSCC cell progression, cell response to CCT/RT upon tumor hypoxia, and iron metabolism.
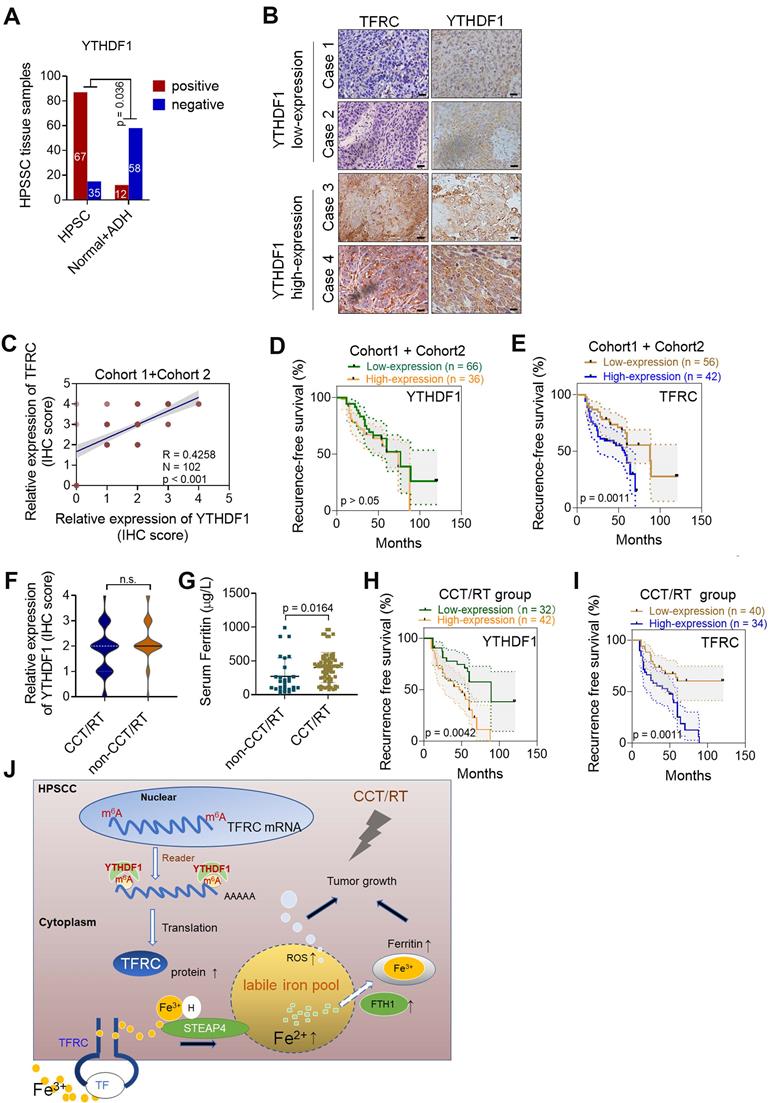
Then, we reanalyzed the clinical characteristics and treatments for patients in cohort 1 and cohort 2. We found that 72.5% of the patients were treated with postoperative platinum-based chemoradiotherapy (CCT) or radiation (RT) alone. High TFRC expression correlated with a reduced response to chemoradiotherapy because it enhanced iron uptake and storage [10,64]. Based on the significant increase in intratumoral IC and serum ferritin levels in HPSCC tissues, we suspected that YTHDF1 might also ameliorate the response to radiation because of TFRC-induced iron accumulation. Then, we reassessed the association between YTHDF1 staining and recurrence-free survival in patients treated with adjuvant CCT/RT. As expected, YTHDF1 did not differ between patients who receives CCT/RT treatment and those who did not (Figure 6SE), but TFRC expression and serum ferritin levels were significantly upregulated in patients who received adjuvant CCT/RT treatment (Figure 7F-G). High YTHDF1 and TFRC levels were associated with poor prognosis in patients receiving adjuvant CCT/RT treatments (Figure 7H-I). Taken together, these data suggest that YTHDF1 enhances TFRC expression in HPSCC through an m6A- dependent mechanism.
Discussion
Although the m6A modification has been researched for decades, the potential involvement of m6A modification on RNA is poorly defined in the context of human HNSCC and iron metabolism. Data from epidemiological studies and in vivo and in vitro models have corroborated the critical role of iron in HNSCC [21,22,65,66]. Because of its high invasive capacity at all subsites, HPSCC was the focus of our study. Here, through bioinformatics analysis, sample detection, transcriptome-wide high-resolution m6A-seq, RNA-seq and RIP-seq assay analyses, and cell biological analyses, we demonstrated that the m6A reader YTHDF1 regulates HPSCC iron uptake via m6A-modified TFRC mRNA, thereby regulating tumorigenesis and tumor proliferation. Moreover, high expression of YTHDF1 might also be linked to radiation resistance by promoting intratumoral iron accumulation (Figure 7J). Through bioinformatics analyses, we demonstrated that the expression of iron-related genes, especially FTH1 and TFRC (which regulate ferritin and the intratumoral iron levels, respectively), were elevated in cancer tissues. Noticeably, among the m6A readers, YTHDF1 had remarkably different expression levels between HNSCC tumor samples and normal control samples. Both upregulated transcription and amplified DNA copy number of YTHDF1 have been observed in various human cancers, making this protein a robust and reproducible cancer biomarker [37]. YTHDF1 was also found to maintain intestinal stem cell features during Wnt-driven intestinal regeneration and tumorigenesis [37]. Our findings supported the notion that YTHDF1 is the major effector of m6A during tumorigenesis. In addition, we firstly demonstrated the relationship between iron metabolism and YTHDF1.
Despite exhibiting generally comparable m6A RNA methylation levels, HPSCC patients with higher serum ferritin and intratumoral iron levels show highly upregulated m6A reader YTHDF1 expression compared to those patients with lower serum ferritin and intratumoral iron. Combining the results from GO, KEGG and GSEA demonstrated that cellular iron homeostasis and cell proliferation were significantly enriched in response to YTHDF1 knockdown in HPSCC cells. In vitro and in vivo experiments indicated that downregulating YTHDF1 suppressed cancer growth, colony formation, and immigration and reduced intracellular iron content, Fe2+ and ROS levels in HPSCC cells. Importantly, YTHDF1 mutant plays dominant-negative effect to inhibit the function. The current data indicate that m6A can be recognized by proteins that contain a YTH (YT521B homology) domain [56]. Therefore, YTH domain functional deletion would interrupt the binding of YTHDF1 to its m6A- methylated targets in our study, deletion of the YTH domain of YTHDF1 blocked YTHDF1-induced iron metabolism in HPSCC cells. Overexpression YTHDF1 using YTHDF1-WT virus xenograft mouse models increased the tumorigenesis in vivo (Figure 3H-L). But overexpression YTHDF1-mut did not have such effect (Figure S2D-E). In addition, DFP (intracellular iron chelators) treatment significantly blocked YTHDF1-induced iron uptake and tumorigenesis in vivo (Figure 3H-L). These results elucidated that YTHDF1-induced HPSCC iron metabolism depends on its RNA m6A function, consistently with other data showing that during tumor development, YTHDF1 activates the translation of methylated mRNAs for sufficient protein production [67]. A recent study by Shi, Y et al investigated the function of YTHDF1 in non-small-cell lung cancer (NSCLC) under hypoxia [31]. Downregulated YTHDF1 in NSCLC has a protective role against cellular stresses, such as hypoxia and DDP treatment, through the Keap-Nrf2 axis. We found that YTHDF1 increased ROS levels upon regulating iron metabolism, expanding the function of YTHDF1 in intracellular ROS regulation.
YTHDF1 was only once reported to bind to the m6A site in CDS region of Snail mRNA and enhance its translation by recruiting the translation elongation factor eEF-2. They also firstly assessed the most common sites 3'UTR, but they found that it was not involved in m6A modification regulated target gene expression. They speculated that YTHDF1 could function via regulating translation elongation as well as translation initiation. Here in our study, m6A methylation on 5'UTR and 3'UTR are the main locations of m6A modification. YTHDF1 increases the expression of the TFRC gene mainly at the 3′UTR and 5′UTR, which in turn leads to the upregulation of TFRC at the protein level but not at the mRNA level. Notably, mutagenesis assays indicate that the m6A sites in the 5'UTR and 3'UTR of TFRC mRNA are essential for YTHDF1 to post-transcriptionally regulate TRFC expression. This finding was further supported by RIP-qPCR and Western blot data. Polysome profiling assay supported that YTHDF1 regulates TFRC translations efficiency. mRNA transcripts with m6A modifications have differing fates primarily based on their interaction with different m6A readers, which contain a YTH domain, IGF2BPs or eukaryotic initiation factor 3 (eIF3) [56]. YTHDF1 did not have a substantial effect on mRNA stability, as indicated by an analysis of DF1-depleted cells [30]. In contrast to YTHDF1, YTHDF2, YTHDF3, and YTHDC2 tend to reduce gene expression by promoting m6A-modified mRNA decay, while IGF2BPs regulate gene expression by promoting mRNA stability [68]. In this study, we did not observe a change in m6A modification in TFRC mRNA upon alterations in YTHDF1 expression. In addition, the protein level but not the mRNA level of TFRC declined upon YTHDF1 knockdown. Importantly, our polysome profiling assay showed that YTHDF1 knockdown resulted in significant lower TFRC mRNA in translation fractions, supporting the notion that YTHDF1 regulates protein synthesis.
Whether YTHDF1 interacts with other m6A writers and erasers in HPSCC cells remains unknown and needs further investigation. We speculated that YTHDF1 enhanced TFRC expression by promoting translation, which was revealed by an analysis of previously reported transcriptome- wide m6A, RIP and CLIP data (GSE78030, GSE92021, GSE78507, and GSE86214). YTHDF1 was shown to promote translation elongation and translation initiation in multiple studies [32,35,53,69]. Further studies should focus on initiation factor identification and determine how YTHDF1 promotes translation upon the binding of these initiation factors [56].
We found that high YTHDF1 and TFRC levels were associated with poor prognosis in patients treated with CCT/RT. Interestingly, increased ferritin concentrations were also observed in this group. A previous study demonstrated that cancer cells preferentially exhibit elevated expression of TFRC, which can increase iron uptake [48]. Logically, by regulating TRFC-induced iron uptake, YTHDF1 is expected to cause CCT/RT resistance in HPSCC, thereby causing poor prognosis. Thus far, we have shown that YTHDF1 may function as an oncogene by enhancing TFRC protein expression in HPSCC cells, which results in increased iron uptake. Ultimately, imported iron enters the bioactive LIP for proliferation and metabolic purposes [10]. However, we cannot definitively point to a direct link between YTHDF1 and LIP. The amount of LIP is detected by post-transcriptional mechanisms of IRP1 and IRP2 [62]. In our pilot experiments, we failed to observe binding between YTHDF1 and IRP1/IRP2 in our culture systems (data not shown). However, we hypothesized that TFRC is a crucial target gene for YTHDF1-mediated promotion of iron metabolism in HPSCC. Previous studies have demonstrated that TRFC-induced iron uptake is the most important mechanism by which cancer cells internalize iron [70,71]. Here, we first revealed that YTHDF1 enhanced TRFC expression via m6A recognition to promote iron metabolism. Multiple strategies for anticancer therapies, including utilization of TFRC-mediated cytotoxic drug conjugates and iron chelators, have been designed to disrupt the intracellular iron balance needed to meet the urgent metabolic demand of cancer cells [62]. In our study, DFP treatment significantly blocked YTHDF1- induced HPSCC growth and colony formation in vitro and in vivo. Fe2+ is an essential cofactor for the delivery of oxygen to cells, protecting cancer cells from hypoxia-induced stress. However, excessive intracellular iron accumulation can cause cells to experience extreme oxidative stress and may induce tumor death. Iron-dependent cancer death, also known as “ferroptosis”, can be inhibited by iron chelators. The functions and mechanisms of TFRC in cancer cell ferroptosis have been observed, but their relevance is still unclear [72]. In other words, TFRC regulation may mark a watershed event during iron accumulation. Depending on primary recognition by the various m6A readers, mRNA transcripts with m6A modifications undergo different fates [56]. Therefore, understanding the functional mechanism of YTHDF1 may enable the reconstitution of TFRC activity, thus enabling the development of specific therapeutic targets according to different intratumoral iron levels.
Conclusions
In summary, we found that YTHDF1 is closely correlated with iron metabolism and tumor progression in HPSCC. Mechanistically, TFRC was identified as a direct target of YTHDF1 in HPSCC cells and promoted iron metabolism, thereby increasing tumor growth and proliferation. From a therapeutic perspective, targeting YTHDF1 and TFRC-mediated iron metabolism may be a promising strategy for HPSCC.
Abbreviations
ADH: atypical hyperplasia; ALOX15: arachidonate 15-lipoxygenase; CHX: cycloheximide; CP: ceruloplasmin; CYP4F11: cytochrome P450 family 4 subfamily F member; DFP: deferiprone DFO deferoxamine; EGLN3: Egl-9 family hypoxia inducible factor; FTH1: ferritin heavy chain 1; FTL: ferritin light chain; FTR1: ferroportin 1; GTEx: genotype-tissue expression; HNSCC: head and neck squamous cell carcinoma; HPSCC: hypopharyngeal carcinomas; IC: iron concentration; IHC: immunohistochemical staining; KEGG: Kyoto Encyclopedia of Genes and Genomes; LCN2: lipocalin 2; MRI: magnetic resonance imaging; MYC: Myc proto-oncogene protein; m6A: N6-methyladenosine; NSCLC: non-small cell lung cancer; ROS: reactive oxygen species; STEAP4: six transmembrane epithelial antigen of prostate; TFRC: transferrin receptors; YTHDF: YTH domain-containing family.
Supplementary Material
Supplementary figures and tables.
Acknowledgements
We gratefully thank medical radiologist Dr. Qinbing,Ke of Sir the Run Run Shaw Hospital Radiology Department, who has 5 years of experience measuring hepatic iron concentrations (HICs) using MRI. He helped read the cervical contrast MRI images from patients in cohort 1.
Funding
This work was supported by the Natural Science Foundation of Zhejiang Province (No. LY21H160031), National Natural Science Foundation of China (No. 62071415, No.81903160), Medical Health Science and Technology Project of Zhejiang Provincial Health Commission Grants (No. 2019336033 and No. 2020367813).
Author contributions
- Conceptualization: Mang Xiao Data curation: Mang Xiao;
- Formal analysis: Zhanggui Wang, Xiaohua Jiang Funding acquisition: Jiaying Shen, Mang Xiao Investigation: Xiaohua Jiang, Yuehui Liu, Bing Liao Methodology: Jing Ye, Zhanggui Wang, Xiaozhen Chen;
- Project administration: Jing Ye, Zhanggui Wang, Xiaozhen Chen Resources: Yuehui Liu, Sunhong Hu, Bing Liao;
- Software: Zhihuai Dong, Wenya Li, Supervision: Jiaying Shen, Mang Xiao Validation: Mang Xiao;
- Visualization: Jiaying Shen, Jing Ye Roles/Writing - original draft: Jing Ye, Mang Xiao;
- Writing - review & editing: Weidong Han, Jiaying Shen, Mang Xiao.
Competing Interests
The authors have declared that no competing interest exists.
References
1. Siegel RL, Miller KD, Jemal A. Cancer statistics, 2020. CA Cancer J Clin. 2020;70:7-30
2. Arends CR, Petersen JF, van der Noort V, Timmermans AJ, Leemans CR, de Bree R. et al. Optimizing Survival Predictions of Hypopharynx Cancer: Development of a Clinical Prediction Model. Laryngoscope. 2020;130:2166-72
3. Gatta G, Botta L, Sanchez MJ, Anderson LA, Pierannunzio D, Licitra L. Prognoses and improvement for head and neck cancers diagnosed in Europe in early 2000s: The EUROCARE-5 population-based study. Eur J Cancer. 2015;51:2130-43
4. Carvalho AL, Nishimoto IN, Califano JA, Kowalski LP. Trends in incidence and prognosis for head and neck cancer in the United States: a site-specific analysis of the SEER database. Int J Cancer. 2005;114:806-16
5. Petersen JF, Timmermans AJ, van Dijk B, Overbeek L, Smit LA, Hilgers F. et al. Trends in treatment, incidence and survival of hypopharynx cancer: a 20-year population-based study in the Netherlands. Eur Arch Otorhinolaryngol. 2018;275:181-9
6. Morris L, Chandramohan R, West L, Zehir A, Chakravarty D, Pfister DG. et al. The Molecular Landscape of Recurrent and Metastatic Head and Neck Cancers: Insights From a Precision Oncology Sequencing Platform. JAMA Oncol. 2017;3:244-55
7. Hajek M, Sewell A, Kaech S, Burtness B, Yarbrough WG, Issaeva N. TRAF3/CYLD mutations identify a distinct subset of human papillomavirus-associated head and neck squamous cell carcinoma. Cancer-Am Cancer Soc. 2017;123:1778-90
8. Yamashita Y, Ikegami T, Suzuki M, Hirakawa H, Maeda H, Yamada S. et al. Hypopharyngeal cancer risk in Japanese: Genetic polymorphisms related to the metabolism of alcohol- and tobacco- associated carcinogens. J Cancer Res Ther. 2019;15:556-63
9. Jiang X, Ye J, Dong Z, Hu S, Xiao M. Novel genetic alterations and their impact on target therapy response in head and neck squamous cell carcinoma. Cancer Manag Res. 2019;11:1321-36
10. Jung M, Mertens C, Tomat E, Brune B. Iron as a Central Player and Promising Target in Cancer Progression. Int J Mol Sci. 2019 20
11. Merk K, Mattsson B, Mattsson A, Holm G, Gullbring B, Bjorkholm M. The incidence of cancer among blood donors. Int J Epidemiol. 1990;19:505-9
12. Osborne NJ, Gurrin LC, Allen KJ, Constantine CC, Delatycki MB, McLaren CE. et al. HFE C282Y homozygotes are at increased risk of breast and colorectal cancer. Hepatology. 2010;51:1311-8
13. Lok CN, Ponka P. Identification of a hypoxia response element in the transferrin receptor gene. J Biol Chem. 1999;274:24147-52
14. Bleackley MR, Wong AY, Hudson DM, Wu CH, Macgillivray RT. Blood iron homeostasis: newly discovered proteins and iron imbalance. Transfus Med Rev. 2009;23:103-23
15. Saito H. Metabolism of iron stores. Nagoya J Med Sci. 2014;76:235-54
16. Hileti D, Panayiotidis P, Hoffbrand AV. Iron chelators induce apoptosis in proliferating cells. Br J Haematol. 1995;89:181-7
17. Theil EC. Ferritin: at the crossroads of iron and oxygen metabolism. J Nutr. 2003;133:1549S-1553S
18. Chekhun SV, Lukyanova NY, Shvets YV, Burlaka AP, Buchinska LG. Significance of ferritin expression in formation of malignant phenotype of human breast cancer cells. Exp Oncol. 2014;36:179-83
19. Keyer K, Imlay JA. Superoxide accelerates DNA damage by elevating free-iron levels. Proc Natl Acad Sci U S A. 1996;93:13635-40
20. Orlandi R, De Bortoli M, Ciniselli CM, Vaghi E, Caccia D, Garrisi V. et al. Hepcidin and ferritin blood level as noninvasive tools for predicting breast cancer. Ann Oncol. 2014;25:352-7
21. Lenarduzzi M, Hui AB, Yue S, Ito E, Shi W, Williams J. et al. Hemochromatosis enhances tumor progression via upregulation of intracellular iron in head and neck cancer. Plos One. 2013;8:e74075
22. Kaomongkolgit R, Cheepsunthorn P, Pavasant P, Sanchavanakit N. Iron increases MMP-9 expression through activation of AP-1 via ERK/Akt pathway in human head and neck squamous carcinoma cells. Oral Oncol. 2008;44:587-94
23. Zhao BS, Roundtree IA, He C. Post-transcriptional gene regulation by mRNA modifications. Nat Rev Mol Cell Biol. 2017;18:31-42
24. Ban Y, Tan P, Cai J, Li J, Hu M, Zhou Y. et al. LNCAROD is stabilized by m6A methylation and promotes cancer progression via forming a ternary complex with HSPA1A and YBX1 in head and neck squamous cell carcinoma. Mol Oncol. 2020;14:1282-96
25. Lang F, Singh RK, Pei Y, Zhang S, Sun K, Robertson ES. EBV epitranscriptome reprogramming by METTL14 is critical for viral-associated tumorigenesis. Plos Pathog. 2019;15:e1007796
26. Deng X, Jiang Q, Liu Z, Chen W. Clinical Significance of an m6A Reader Gene, IGF2BP2, in Head and Neck Squamous Cell Carcinoma. Front Mol Biosci. 2020;7:68
27. Patil DP, Pickering BF, Jaffrey SR. Reading m(6)A in the Transcriptome: m(6)A-Binding Proteins. Trends Cell Biol. 2018;28:113-27
28. Lee M, Kim B, Kim VN. Emerging roles of RNA modification: m(6)A and U-tail. Cell. 2014;158:980-7
29. Fu Y, Dominissini D, Rechavi G, He C. Gene expression regulation mediated through reversible m(6)A RNA methylation. Nat Rev Genet. 2014;15:293-306
30. Wang X, Zhao BS, Roundtree IA, Lu Z, Han D, Ma H. et al. N(6)-methyladenosine Modulates Messenger RNA Translation Efficiency. Cell. 2015;161:1388-99
31. Shi Y, Fan S, Wu M, Zuo Z, Li X, Jiang L. et al. YTHDF1 links hypoxia adaptation and non-small cell lung cancer progression. Nat Commun. 2019;10:4892
32. Han D, Liu J, Chen C, Dong L, Liu Y, Chang R. et al. Anti-tumour immunity controlled through mRNA m(6)A methylation and YTHDF1 in dendritic cells. Nature. 2019;566:270-4
33. Nishizawa Y, Konno M, Asai A, Koseki J, Kawamoto K, Miyoshi N. et al. Oncogene c-Myc promotes epitranscriptome m(6)A reader YTHDF1 expression in colorectal cancer. Oncotarget. 2018;9:7476-86
34. Liu T, Wei Q, Jin J, Luo Q, Liu Y, Yang Y. et al. The m6A reader YTHDF1 promotes ovarian cancer progression via augmenting EIF3C translation. Nucleic Acids Res. 2020;48:3816-31
35. Zhuang M, Li X, Zhu J, Zhang J, Niu F, Liang F. et al. The m6A reader YTHDF1 regulates axon guidance through translational control of Robo3.1 expression. Nucleic Acids Res. 2019;47:4765-77
36. Bai Y, Yang C, Wu R, Huang L, Song S, Li W. et al. YTHDF1 Regulates Tumorigenicity and Cancer Stem Cell-Like Activity in Human Colorectal Carcinoma. Front Oncol. 2019;9:332
37. Han B, Yan S, Wei S, Xiang J, Liu K, Chen Z. et al. YTHDF1-mediated translation amplifies Wnt- driven intestinal stemness. EMBO Rep. 2020;21:e49229
38. Zhao X, Cui L. Development and validation of a m(6)A RNA methylation regulators-based signature for predicting the prognosis of head and neck squamous cell carcinoma. Am J Cancer Res. 2019;9:2156-69
39. Wang X, Lu Z, Gomez A, Hon GC, Yue Y, Han D. et al. N6-methyladenosine-dependent regulation of messenger RNA stability. Nature. 2014;505:117-20
40. Li A, Chen YS, Ping XL, Yang X, Xiao W, Yang Y. et al. Cytoplasmic m(6)A reader YTHDF3 promotes mRNA translation. Cell Res. 2017;27:444-7
41. Lin X, Chai G, Wu Y, Li J, Chen F, Liu J. et al. RNA m(6)A methylation regulates the epithelial mesenchymal transition of cancer cells and translation of Snail. Nat Commun. 2019;10:2065
42. Zhao Q, Zhao Y, Hu W, Zhang Y, Wu X, Lu J. et al. m(6)A RNA modification modulates PI3K/Akt/mTOR signal pathway in Gastrointestinal Cancer. Theranostics. 2020;10:9528-43
43. Chen Z, Wu L, Zhou J, Lin X, Peng Y, Ge L. et al. N6-methyladenosine-induced ERRgamma triggers chemoresistance of cancer cells through upregulation of ABCB1 and metabolic reprogramming. Theranostics. 2020;10:3382-96
44. Wood JC, Enriquez C, Ghugre N, Tyzka JM, Carson S, Nelson MD. et al. MRI R2 and R2* mapping accurately estimates hepatic iron concentration in transfusion-dependent thalassemia and sickle cell disease patients. Blood. 2005;106:1460-5
45. Shen Y, Li X, Dong D, Zhang B, Xue Y, Shang P. Transferrin receptor 1 in cancer: a new sight for cancer therapy. Am J Cancer Res. 2018;8:916-31
46. Torti SV, Torti FM. Iron and cancer: more ore to be mined. Nat Rev Cancer. 2013;13:342-55
47. Schneider BD, Leibold EA. Regulation of mammalian iron homeostasis. Curr Opin Clin Nutr Metab Care. 2000;3:267-73
48. Petronek MS, Spitz DR, Buettner GR, Allen BG. Linking Cancer Metabolic Dysfunction and Genetic Instability through the Lens of Iron Metabolism. Cancers. 2019;11:1077
49. Spitz DR. Manipulations of Redox Metabolism for Enhancing Radiation Therapy Responses: A Historical Perspective and Novel Hypothesis. Semin Radiat Oncol. 2019;29:1-5
50. Kumari S, Badana AK, G MM, G S, Malla R. Reactive Oxygen Species: A Key Constituent in Cancer Survival. Biomark Insights. 2018;13:91914689
51. Schoenfeld JD, Sibenaller ZA, Mapuskar KA, Wagner BA, Cramer-Morales KL, Furqan M. et al. O2(-) and H2O2-Mediated Disruption of Fe Metabolism Causes the Differential Susceptibility of NSCLC and GBM Cancer Cells to Pharmacological Ascorbate. Cancer Cell. 2017;31:487-500
52. Xu C, Liu K, Ahmed H, Loppnau P, Schapira M, Min J. Structural Basis for the Discriminative Recognition of N6-Methyladenosine RNA by the Human YT521-B Homology Domain Family of Proteins. J Biol Chem. 2015;290:24902-13
53. Liu T, Wei Q, Jin J, Luo Q, Liu Y, Yang Y. et al. The m6A reader YTHDF1 promotes ovarian cancer progression via augmenting EIF3C translation. Nucleic Acids Res. 2020
54. Tury S, Assayag F, Bonin F, Chateau-Joubert S, Servely JL, Vacher S. et al. The iron chelator deferasirox synergises with chemotherapy to treat triple-negative breast cancers. J Pathol. 2018;246:103-14
55. Simoes RV, Veeraperumal S, Serganova IS, Kruchevsky N, Varshavsky J, Blasberg RG. et al. Inhibition of prostate cancer proliferation by Deferiprone. Nmr Biomed. 2017 30
56. Meyer KD, Jaffrey SR. Rethinking m6 A Readers, Writers, and Erasers. Annu Rev Cell Dev Bi. 2017;33:319-42
57. Wang S, Sun C, Li J, Zhang E, Ma Z, Xu W. et al. Roles of RNA methylation by means of N(6)- methyladenosine (m(6)A) in human cancers. Cancer Lett. 2017;408:112-20
58. Ohgami RS, Campagna DR, McDonald A, Fleming MD. The Steap proteins are metalloreductases. Blood. 2006;108:1388-94
59. Gomes IM, Maia CJ, Santos CR. STEAP proteins: from structure to applications in cancer therapy. Mol Cancer Res. 2012;10:573-87
60. Emerald BS, Chen Y, Zhu T, Zhu Z, Lee K, Gluckman PD. et al. αCP1 Mediates Stabilization of hTERT mRNA by Autocrine Human Growth Hormone. J Biol Chem. 2006;282:680-90
61. Kao SH, Wang WL, Chen CY, Chang YL, Wu YY, Wang YT. et al. Analysis of Protein Stability by the Cycloheximide Chase Assay. Bio Protoc. 2015 5
62. Shen Y, Li X, Dong D, Zhang B, Xue Y, Shang P. Transferrin receptor 1 in cancer: a new sight for cancer therapy. Am J Cancer Res. 2018;8:916-31
63. Grunewald TG, Bach H, Cossarizza A, Matsumoto I. The STEAP protein family: versatile oxidoreductases and targets for cancer immunotherapy with overlapping and distinct cellular functions. Biol Cell. 2012;104:641-57
64. Greene CJ, Attwood K, Sharma NJ, Gross KW, Smith GJ, Xu B. et al. Transferrin receptor 1 upregulation in primary tumor and downregulation in benign kidney is associated with progression and mortality in renal cell carcinoma patients. Oncotarget. 2017;8:107052-75
65. Maier H, Fischer G, Sennewald E, Heller WD. Occupational risk factors for pharyngeal cancer. Results of the Heidelberg Pharyngeal Cancer Study. Hno. 1994;42:530-40
66. Matsha T, Brink L, van Rensburg S, Hon D, Lombard C, Erasmus R. Traditional home-brewed beer consumption and iron status in patients with esophageal cancer and healthy control subjects from Transkei, South Africa. Nutr Cancer. 2006;56:67-73
67. Ries RJ, Zaccara S, Klein P, Olarerin-George A, Namkoong S, Pickering BF. et al. m6A enhances the phase separation potential of mRNA. Nature. 2019;571:424-8
68. Huang H, Weng H, Sun W, Qin X, Shi H, Wu H. et al. Recognition of RNA N(6)-methyladenosine by IGF2BP proteins enhances mRNA stability and translation. Nat Cell Biol. 2018;20:285-95
69. Shi Y, Fan S, Wu M, Zuo Z, Li X, Jiang L. et al. YTHDF1 links hypoxia adaptation and non-small cell lung cancer progression. Nat Commun. 2019 10
70. Jeong SM, Lee J, Finley LW, Schmidt PJ, Fleming MD, Haigis MC. SIRT3 regulates cellular iron metabolism and cancer growth by repressing iron regulatory protein 1. Oncogene. 2015;34:2115-24
71. Jeong SM, Hwang S, Seong RH. Transferrin receptor regulates pancreatic cancer growth by modulating mitochondrial respiration and ROS generation. Biochem Biophys Res Commun. 2016;471:373-9
72. Stockwell BR, Friedmann AJ, Bayir H, Bush AI, Conrad M, Dixon SJ. et al. Ferroptosis: A Regulated Cell Death Nexus Linking Metabolism, Redox Biology, and Disease. Cell. 2017;171:273-85
Author contact
![]() Corresponding authors: Weidong Han, Sir Run Run Shaw Hospital, College of Medicine, Zhejiang University, East Qingchun Road Nr.3, Hangzhou, Zhejiang, 310016, China. E-mail: hanwdedu.cn; Jiaying Shen, Sir Run Run Shaw Hospital, College of Medicine, Zhejiang University, East Qingchun Road Nr.3, Hangzhou, Zhejiang, 310016, China. E-mail: 11318167edu.cn; Mang Xiao, Sir Run Run Shaw Hospital, College of Medicine, Zhejiang University, East Qingchun Road Nr.3, Hangzhou, Zhejiang, 310016, China. E-mail: joelxmedu.cn.
Corresponding authors: Weidong Han, Sir Run Run Shaw Hospital, College of Medicine, Zhejiang University, East Qingchun Road Nr.3, Hangzhou, Zhejiang, 310016, China. E-mail: hanwdedu.cn; Jiaying Shen, Sir Run Run Shaw Hospital, College of Medicine, Zhejiang University, East Qingchun Road Nr.3, Hangzhou, Zhejiang, 310016, China. E-mail: 11318167edu.cn; Mang Xiao, Sir Run Run Shaw Hospital, College of Medicine, Zhejiang University, East Qingchun Road Nr.3, Hangzhou, Zhejiang, 310016, China. E-mail: joelxmedu.cn.