Impact Factor
- Issue 14; 2026
- Issue 13; 2026
- Issue 12; 2026
- Issue 11; 2026
- Issue 10; 2026
- Volume 16; 2026
- Advance Articles
- Past Issues
- Cover Images
- Cover Suggestion
- Index & Coverage
- Special Issues
Introduction
Materials and methods
Results
Discussion
Abbreviations
Supplementary Material
Acknowledgements
References
International Journal of Biological Sciences
International Journal of Medical Sciences
 Global reach, higher impact

Theranostics 2020; 10(4):1649-1677. doi:10.7150/thno.40919 This issue Cite
Research Paper
Nerve growth factor activates autophagy in Schwann cells to enhance myelin debris clearance and to expedite nerve regeneration
Rui Li1,2,3, Duohui Li1, Chengbiao Wu2, Libing Ye1, Yanqing Wu4, Yuan Yuan1, Shengnan Yang1, Ling Xie1, Yuqin Mao1, Ting Jiang1, Yiyang Li1, Jian Wang1, Hongyu Zhang1, Xiaokun Li1, Jian Xiao1 ![]()
1. Department of Hand Surgery and Peripheral Neurosurgery, The First Affiliated Hospital and School of Pharmaceutical Sciences, Wenzhou Medical University, Wenzhou, Zhejiang, 325000, China
2. Research Center, Affiliated Xiangshang Hospital, Wenzhou Medical University, Ningbo, Zhejiang, 315700, China
3. PCFM Lab, School of Chemistry, Sun Yat-sen University, Guangzhou, Guangdong 510127, China
4. The Institute of Life Sciences, Wenzhou University, Wenzhou 325035, China
Received 2019-10-5; Accepted 2019-10-27; Published 2020-1-1
Abstract

Rationale: Autophagy in Schwann cells (SCs) is crucial for myelin debris degradation and clearance following peripheral nerve injury (PNI). Nerve growth factor (NGF) plays an important role in reconstructing peripheral nerve fibers and promoting axonal regeneration. However, it remains unclear if NGF effect in enhancing nerve regeneration is mediated through autophagic clearance of myelin debris in SCs.
Methods: In vivo, free NGF solution plus with/without pharmacological inhibitors were administered to a rat sciatic nerve crush injury model. In vitro, the primary Schwann cells (SCs) and its cell line were cultured in normal medium containing NGF, their capable of swallowing or clearing degenerated myelin was evaluated through supplement of homogenized myelin fractions.
Results: Administration of exogenous NGF could activate autophagy in dedifferentiated SCs, accelerate myelin debris clearance and phagocytosis, as well as promote axon and myelin regeneration at early stage of PNI. These NGF effects were effectively blocked by autophagy inhibitors. In addition, inhibition of the p75 kD neurotrophin receptor (p75NTR) signal or inactivation of the AMP-activated protein kinase (AMPK) also inhibited the NGF effect as well.
Conclusions: NGF effect on promoting early nerve regeneration is closely associated with its accelerating autophagic clearance of myelin debris in SCs, which probably regulated by the p75NTR/AMPK/mTOR axis. Our studies thus provide strong support that NGF may serve as a powerful pharmacological therapy for peripheral nerve injuries.
Keywords: Myelin debris clearance, Autophagic flux, Nerve growth factor (NGF), Schwann cells, Nerve regeneration
Introduction
Traumatic peripheral nerve damage is a chronic disease resulting in significant disability [1]. Establishing an optimal microenvironment that favors axonal regrowth and remyelination is vital for peripheral nerve regeneration and functional recovery [2, 3]. Following axonal trauma, the distal fibers are disconnected from the neuronal stump and undergo Wallerian degeneration (WD), in which the neural cytoskeleton becomes disintegrated to produce a large quantity of axonal and myelin debris [4, 5]. In addition, the presence of myelin sheet fragments surrounding the lesion sites further compounds the difficulty of nerve regeneration. Therefore, the rate and extent of myelin debris clearance is essential for effective nerve repair after injury [6].
Schwann cells (SCs) in the peripheral nervous system (PNS), play an active role in removing myelin debris [7, 8]. Upon axonal injury, SCs begin to dedifferentiate and undergo extensive proliferation to acquire increased intrinsic digestive capacity, which affords SCs the ability to remove myelin fragments, often with the cooperation of macrophages [9]. For instance, during WD, SCs interacted with macrophages to catabolize myelin sheath segments into smaller intracellular debris [10, 11]. Subsequently, SCs migrate to form bands of Büngner that guide the regenerative axon to the target organs via a direct pathway. Meanwhile, the newly synthesized axonal and myelin proteins largely occurred at as early as 14 days post-injury [1, 12]. Therefore, targeting SCs to eliminate myelin debris will be a powerful means for axon regeneration and reinnervation. However, the precise molecular mechanisms by which SCs mediate myelin fragment clearance are yet to be defined.
Macroautophagy (hereafter called autophagy) is an intracellular dynamic process for degrading senescent or damaged organelles/proteins [13], through which damaged organelles and pathological proteins are encapsulated in autolysosomes and are subsequently degraded by the lysosome. Conversely, dysregulation of autophagy is linked to a growing number of diseases, including neurodegenerative diseases, infections, and inflammation [14, 15]. In neurons, autophagy has a protective effect that is essential for neuronal maintenance and survival [16]. Autophagy thus offers an important cellular protection mechanism against various pathological processes [17, 18].
The role of autophagy in SCs in peripheral nerve injury (PNI) and repair has been investigated. SC autophagy has been found to be beneficial for scar reduction and myelination [19], which plays an important role in preventing or delaying the onset and chronification of neuropathic pain and neuropathy [20, 21]. Moreover, recent evidence has revealed that SCs initiate myelin breakdown via selective autophagy during WD [22, 23]. Rapamycin, an activator of autophagy, is effective in promoting nerve regeneration and motor recovery in a sciatic nerve crush model [24]. Additionally, autophagy is involved in structural plasticity during the myelination process [25]. For instance, conditional knockouts of the ATG-7 gene, an important autophagy regulator, resulted in accumulation of cytosolic organelles and proteins during segmental demyelination, as a result, causing a delay in myelin clearance [26]. Therefore, enhancing the autophagy pathway at the early phase after PNI is a new therapeutic strategy for peripheral nerve repair.
Nerve growth factor (NGF), the first isolated neurotrophic factor, has been shown to stimulate neuronal survival, and promote axonal growth and elongation [27-34]. Importantly, NGF has a robust neuroprotective effect against nerve system disorders, especially PNI [35, 36]. NGF exerts its effects through the two Type-1 cell surface receptors, the 140 kD tyrosine kinase receptor A (TrkA) and the 75 kD neurotrophin receptor (p75NTR) [31-34, 37-41]. Although p75NTR has been thought to be a death signaling molecule that can initiate cell apoptosis under certain conditions [42], recent data suggest that increasing p75NTR expression also contributes to neuronal survival and regeneration in injured nerves [43-45]. SCs also express abundant p75NTR during development [46]. NGF is capable of binding to p75NTR with high affinity in SCs following PNI [47]. The NGF/ p75NTR-medicated signaling pathways in SCs have been linked to cell proliferation, myelination, and synaptic plasticity [48-50].
The AMP-activated protein kinase (AMPK), a cellular energy modulator, is also involved in regulating autophagy. Under stress conditions, such as starvation and debris accumulation, AMPK activates autophagy or enhances autophagic flux by repressing the mammalian target of the rapamycin (mTOR), a negative regulator of autophagy [51, 52].
However, little is known about the role and mechanisms of NGF/p75NTR signaling in SCs in mediating rapid and efficient clearance of myelin debris to shorten the time of peripheral nerve regeneration during WD. In the present study, we investigated the effect and molecular mechanism of NGF on myelin fragment clearance using a sciatic nerve crush injury PNI rat model. We found that NGF administration accelerated the degradation and removal of myelin during WD. NGF treatment significantly shortened the time of regrowth and remyelination in crushed nerves. We further showed that these effects by NGF are likely mediated by the p75NTR/AMPK/mTOR dependent pathways to enhance autophagic activities in SCs.
Materials and methods
Ethical Statement
All procedures and protocols involving the use and care of animals were approved by the Institutional Animal Care and Use Committee of Wenzhou Medical University according strictly to the National Institutes of Health Guide.
Reagents and antibodies
We purchased each from the indicated suppliers: NGF (Sigma-Aldrich, SRP3015), Compound C (Cpd C, an AMPK inhibitor, Aladdin, D139352), 3-methyladenine (3-MA, an autophagy inhibitor, Aladdin, M129496), chloroquine (CQ; a lysosomal inhibitor, Aladdin, C193834), TAT-Pep5 (the p75NTR inhibitor, Merck Millipore, 506181), hematoxylin and eosin (HE, Beycotime Biotechnology, C0105), Masson's trichrome staining (Masson, Solarbio, G1340), a luxol fast blue kit (LFB, Solarbio, G3245), toluidine blue solution (TB, Solarbio, G3665), oil red O solution (ORO, Solarbio, G1260), and 4' 6-diamidino-2-phenylindole-dihydrochloride (DAPI, Beycotime Biotechnology, C1006. The following antibodies against proteins were used in the study: anti-p-AMPK (CST, #2535), anti-AMPK (CST, #5831), anti-p-p70s6k (CST, #9204), anti-p70s6k (CST, #2708), anti-p-mTOR (CST, #5536), anti-mTOR (CST, #2083), anti-p75NTR (Abcam, ab52987), anti-beclin-1 (Abcam, ab62557), anti-P62 (Abcam, ab56416), anti-LC3 (Abcam, ab128025), anti-MBP (Abcam, ab62631), anti-MPZ (Abcam, ab31851), anti-S-100 (Abcam, ab4066), anti-GFAP (Abcam, ab10062), NF-200 (Abcam, ab4680), LAMP1 (Abcam, ab25639), β-actin (Abcam, ab8227), anti-ATG7 (Bioworld, BS6046), anti-ATG5 (Bioworld, AP6026), GAPDH (Millipore, AB2302), anti-CD68 (Abcam, ab955).
Sciatic nerve crush model and drug treatments
Wistar male rats of 8 weeks old were obtained from the Laboratory Animals Center of Wenzhou Medical University. Rats were adapted to the local animal facilities (5 rats per cage) and maintained at controlled temperature (23 ± 2 °C) and relative humidity (50-60%) with free access to water and regular food. All animals were habituated in the animal care facility for ≥7 days before the experiments.
The procedure for the sciatic nerve surgery has been described previously [53]. Briefly, rats were anesthetized by i.p. injection of 4% pentobarbital sodium (30 mg/kg) before surgery. The upper thigh was shaved and sterilized using iodophor. The sciatic nerve in the right mid-thigh was exposed and visualized via blunt dissection using glass needle and clamped for 2 min with a pair of vascular clips (approximately 2-mm distance, 30 g force, Oscar, China), The surgical wounds were then closed with 4-0 stitches.
Following surgery, each rat with sciatic nerve crushing rapidly received 0.2 mL NGF solution (20 μg mL-1) [54] or an equal volume of saline via intramuscular injection once daily for 5 days. The sciatic nerve crushed rats administered with NGF was as the NGF group or the PNI+NGF group. The remaining injured rats administered with saline treatment were as the PNI group. For the sham operation group, the rats were subjected to exposure of the sciatic nerve without contusion. Each group contained 8 rats. To explore the effect of NGF on AMPK signaling or autophagic activation, the inhibitor Cpd C (20 mg kg-1) [55] or 3-MA (50 mg kg-1) [24] was administered via intraperitoneal administration at days 1 and 3. Both of these two drugs were firstly dissolved in sterile saline to get the final concentration of 20 mg mL-1 (Cpd C) and 50 mg mL-1 (3-MA), respectively. To determine NGF signaling via the p75NTR, TAT-Pep5 was intravenously injected into each animal at 40 μg [56] provided 4 h prior to the injection of NGF solution and then administered once per day until the rats were sacrificed. This drug was directly solubilized in sterile saline to obtain the final concentration of 0.2 mg mL-1 before treatment. To exclude NGF-TrkA signaling, Trk A inhibitor K252a (200 nM, merck, 420298) or GW441756 (10 mg/kg, selleck, S2891) was intraperitoneally injected for continuous 5 days after nerve contusion [57, 58]. K252a was initially dissolved in DMSO (10 mM) and then diluted in sterile saline to achieve the working solution with the final concentration of 200 nM. As for GW441756, it was originally dissolved in DMSO (1 g mL-1) and then diluted in sterile saline to achieve the working solution with the final concentration of 10 mg mL-1. To evaluate autophagic flux, CQ was intraperitoneally (i.p.) administered at the dose of 10 μg kg-1 [20] 2 h before the animals were sacrificed. The purchased chloroquine (CQ) powder was initially diluted in DMSO (25 mM or 8 mg mL-1 stock) and further diluted in the saline to a concentration of 1 μg mL-1. All the procedures were going under the dark environment.
Lentivirus injection
To knockdown AMPK or LC3β expression in SD rats. We carried out orthotopical injection (OI) of lentivirus (LV)-RNAi to the contusive nerve with a Hamilton microsyringe. We also generated a lentiviral vector that expresses scrambled species as a negative control (NC). Control LV-RNAi, LV-AMPK-RNAi/LV-NCAMPK-RNAi and LV-LC3β-RNAi/LV-NCLC3β-RNAi were all purchased from Shanghai GeneChem Company (Shanghai, China). Following sciatic nerve crush, rats were injected with 2 µL of LV-AMPK-RNAi/LV-NCAMPK-RNAi or LV-LC3β-RNAi/LV-NCLC3β-RNAi containing 2 × 10⁸ TU mL-1. The rats receiving NGF plus LV-NCAMPK-RNAi, LV-AMPK-RNAi, LV-NCLC3β-RNAi or LV-LC3β-RNAi were designated as: NC-AMPK, LV-AMPK, NC-LC3β or LV-LC3β, respectively. Animals were evaluated blindly with respect to experimental conditions.
Tissue preparation
At 5 or 14 days post nerve crush, animals were anesthetized with 10% chloral hydrate (3.5 mL kg-1) and transcardially perfused with 0.1 M phosphate-buffered saline (PBS; pH = 7.35). Degenerated or regenerating nerves were removed and collected in an Eppendorf tube (2 mL) for further experiments. For general staining, a 2-cm length of nerve segment at the lesion site (a schematic diagram of harvested nerve segments is shown in Figure 1I) was fixed in 4% paraformaldehyde overnight. The next day, the tissues were dehydrated with an alcohol gradient, embedded in paraffin. The 2 mm segments within the injuried region was cut into 5-μm-thick transections and mounted on poly-L-lysine-coated slides. For immunofluorescence, the dehydrated sciatic nerve segments of each group soaked in 30% sucrose solution were embedded in optimal cutting temperature compound (OTC) for frozen sections. These longitudinal sections were serially sectioned at 5 μm thickness on a freezing microtome (Leica CM1520, Hesse-Darmstadt, Germany). The capturing images were viewed at the contusion area (2 mm length). For Western blotting and real-time polymerase chain reaction (RT-PCR), the samples (1 cm length) at the contusion area were dissected and immediately stored at -80°C. The diagrammatic sketch of tissue handling and slice observation was shown in Figure S1.
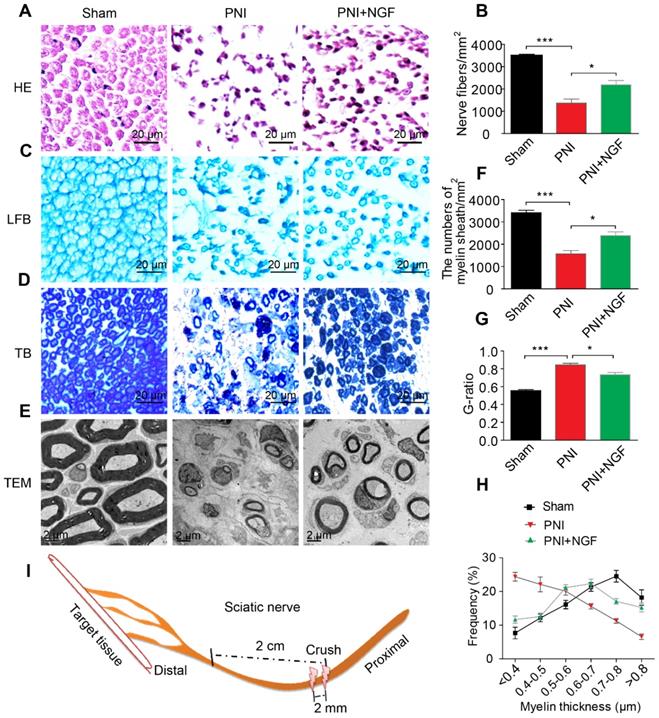
NGF expedites axon regeneration and remyelination after PNI. (A) Representative HE staining images of sciatic nerve lesion cross-sections from the sham, PNI model, and PNI+NGF groups at 14 days following injury. (B) Statistical analysis of the number of nerve fibers in each group. Data are presented as the mean ± SEM; n = 3 rats per group. Nerve fibers: F(2, 6) = 44.74, ***Psham vs PNI < 0.001, *PPNI vs PNI+NGF = 0.042. (C-E) Transverse higher-magnification images of sciatic nerves in the three groups. FBL, TB and electron micrographs were also used to evaluate myelin regeneration at 14 days after surgery. Scale bars represent 20 µm (FBL and TB) and 2 µm (TEM). (F) The number of myelin sheaths per 1 mm2 in the three groups. Data are presented as the mean ± SEM; n = 3 rats per group. F(2, 6) = 41.80, ***Psham vs PNI < 0.001, *PPNI vs PNI+NGF = 0.035. (G) Quantification of the G-ratio in the three groups. Data are presented as the mean ± SEM; n = 3 rats per group. F(2, 6) = 59.26, ***Psham vs PNI < 0.001, *PPNI vs PNI+NGF = 0.037. (H) Quantification of the frequency distribution profile of the thickness of myelin sheaths. (I) A schematic showing the nerve segments collected in each group.
Red Oil O Staining
The longitudinal frozen sections in different groups were fixed in 4% polyoxymethylene for 20 min. The slides were then dehydrated in 100% propylene glycol for 10 min after washing in PBS for 3 times. The sections were stained with 0.5% Red Oil O solution (Solarbio, G1260) at 25°C for 10 min. Nuclei were stained with hematoxylin (Beycotime Biotechnology, C0105) for 5 min. Finally, the coverslips were mounted (Gel Mount, BioMeda, USA) and examined by a light microscope (Nikon Eclipse 80i, Tokyo, Japan).
Histological assessments
Slides containing paraffin embedded nerve sections were first dried in an oven and subsequently dewaxed and rehydrated in xylene and ethanol, respectively. The procedures of HE, Masson, LFB, TB staining were performed according to the manufacturer's instructions. ORO staining was performed on sciatic nerve longitudinal frozen sections. Lastly, all dyed simples were imaged with a light microscope (Nikon Eclipse 80i, Tokyo, Japan). The quantified index of nerve fibers/mm2 and myelin numbers/mm2 were defined as dividing the total nerve fibers (HE) or myelin numbers (TB) by the selected region area. The quantified index of the average collagen area per nerve unit was defined as dividing the integrated option density (IOD) in a visual field by its target area. The images were imported to the Image-Pro Plus software (Media Cybernetics Inc, Silver Spring, MD, USA) to automatically obtain data for the total nerve fibers, myelin number, IOD and corresponding target region areas. We randomly selected three visual fields in each section for recording and analysis. Six sections were selected for each rat. Each group contained 3 animals.
Electron microscopy
For transmission electron microscopy (TEM), the crush sciatic nerve sites (cutting into 1 mm within the 2 mm crushed region) were fixed overnight by immersion in 2.5% glutaraldehyde. The next day, samples were postfixed with 1% osmium and 1% uranyl acetate for 1 h respectively, dehydrated in ethanol, and embedded in resin. The crushed portion of the samples was cut into ultrathin sections (50 nm thick) to receive staining with uranyl acetate/lead citrate. The quantitative indexes including the number of newborn and abnormal myelin sheathes were measured from three randomly selected fields from one section, and a total of six sections from five samples for each group was used for capturing images with a Hitachi H-600 TEM (HITACH, Tokyo, Japan).
Immunofluorescence analysis
Standard immunohistochemistry procedures were described previously [53, 59]. The samples harvested at 5 days were labeled with the following primary antibodies: anti-S-100 (labeling SCs, 1:1000) and anti-LC3 (labeling autophagy, 1:1000), anti-MPZ (labeling myelin, 1:1000) and anti-GFAP (labeling dedifferentiated SCs, 1:500), anti-GFAP and anti-p75NTR (NGF receptor, 1:1000). The samples collected at 14 days were double-stained with anti-NF-200 (labeling axon, 1:100,000) and anti-MBP (myelin marker, 1:1000). The sections were sequentially incubated with FITC-conjugated anti-rabbit IgG (Abcam, ab150073) or TRITC-conjugated anti-mouse IgG (Abcam, ab7065). The statistical indicators of the immunofluorescence staining were measured in three randomly selected fields from one section, and a total of six sections from three animals of each group was used for capturing images with a Nikon confocal laser microscope (Nikon, A1 PLUS, Tokyo, Japan) or a Nikon Eclipse 80i fluorescence microscope. For different antibody immunoreactivity positive areas (%), the calculation formula used was IOD / selected region area*100%. The IOD and selected region area were measured using the Image pro-plus software.
Western blotting analysis
The lesioned sciatic nerve tissues were lysed in a Laemmli sample buffer (2% SDS, 52.5 mM Tris-HCl PH 6.8, and protein inhibitors). The concentration of protein lysates was determined using the Micro BCA Protein Assay Kit (Beycotime Biotechnology, P0010). Eighty micrograms of proteins were separated by SDS-PAGE and transferred onto PVDF membranes (Millipore, Bedford, MA). Afterwards, the membranes were blocked with 5% nonfat milk and were probed with primary antibodies including: ATG-7 (1:1000), ATG-5 (1:1000), P62 (1:1000), Beclin-1 (1:1000), LC3 (1:1000), p-AMPK (1:500), AMPK (1:1000), p-p70s6k (1:500), p70s6k (1:1000), p-mTOR (1:500), mTOR (1:1000), MBP (1:1000), and MPZ (1:1000) overnight at 4°C. The next day, the membranes were incubated with horseradish peroxidase-conjugated secondary antibodies (1:10,000; Bioworld; anti-rabbit, BS13278; anti-mouse, BS50350) for 1 h. Immunoreactive bands were visualized using the ChemiDic TM XRS + Imaging System (Bio-Rad, 1708195). Densitometric quantification of the membranes was obtained using Image J software (National Institutes of Health, USA). Experiments were repeated three times and GAPDH (1:10,000) or β-actin (1:5000) was used as an internal control.
Quantitation of RT-PCR
The total RNA of the thawed nerve tissue samples was extracted using Trizol reagent and reverse-transcribed into complementary DNA (cDNA) using the Prime Script™ RT reagent Kit (TaKaRa, Japan, RR047Q) according to manufacturer's instruction. Quantitative expression of myelination and function-associated genes, including MBP, MPZ, MAG, GAP43 and MAP-2, was run in parallel with each primer set in RT-PCR with bio-radiQ™ SYBR® Green Supermix (Bio-Rad, USA, #170-882AP). β-Actin served as an internal control. The forward and reverse primer sequences are shown in Table 1. Data analyses were performed using the SDS Enterprise Database software according to previous reports [60]. All experiments were performed in triplicate.
Primers used for RT-PCR in this study
| Gene | Prime sequence | Product size (bp) | Serial number |
|---|---|---|---|
| β-actin | F: GCAAGTGCTTCTAGGCGGACTG R: CTGCTGTCACCTTCACCGTTCC | 195 | NM_001101683.1 |
| MBP | F: AGTCCGACGAGCTACAGACCATC R: TACTTGGAGCCGTGCCTCTGG | 106 | XM_017338987.1 |
| MPZ | F: TCATCGAGATGGAGCTACGGAAGG R: GGCGTTCTTGAGGCTGGTTCTG | 89 | XM_008264187.2 |
| MAG | F: TGCCATCTTAATCGCCATCGTCTG R: CGCTTCTCGCTCTCATACTTCTCG | 159 | XM_017338174.1 |
| MAP-2 | F: GATCTGGCAGGCACAAGGTCAAG R: TTCCTCAACTACCGTCTCCGATGG | 96 | XM_017343068.1 |
| GAP-43 | F: GAAGGCGAGGCTGACCAAGAAC R: AGACGTGAGCAGGACAGGAAGG | 141 | XM_008266894.2 |
Schwann cell phagocytosis assay in vitro
Myelin debris were collected from uncut sciatic nerve extracts in adult SD rats by density gradient centrifugation, based on a modified version of the procedure by Larocca and Norton reports [61, 62]. Briefly, sciatic nerves were exposed, then removed to a culture dish filled with calcium/magnesium-free Hank's buffered solution to carefully strip off the connective tissues surrounding the nerves under a stereomicroscope. The sciatic nerves were collected into a 1.5 ml Eppendorf tube and suspended in 0.27 M sucrose solution containing 20 mM Tris-Cl buffer at pH 7.45, followed by homogenization with a homogenizer (PRO 200, USA). The homogenized myelin fractions were supplemented into medium containing RSC 96 cells (a rat Schwann cell line, purchased from ScienCell Research Laboratories), which were seeded into 6-well plates with a density of 5 × 10⁶ cells/well. After culturing for 24 h, myelin debris were added to the medium for culturing another 24 h (recorded as 0 h). Then, the medium was supplemented with/without NGF solution at doses of 50 ng mL-1 [63] and cultured for another 12 h, 24 h or 48 h. The RSC 96 cells harvested at different time points were co-immunolabeling for MBP and S-100. We regarded the cell medium containing only myelin debris as the control group. The cell medium with myelin debris and NGF added was taken as the NGF group.
To quantify MBP immunoreactivity, 6 randomly photomicrographs per group at each timepoint were captured. This experiment was performed in triplicate. Then, these acquired images were imported into Image-Pro Plus software and analyzed to achieve the integrated option density (IOD) and corresponding target distribution area. The IOD value was divided by corresponding target distribution area to obtain mean density (MD). Next, The MBP immunoreactivity (%) at different times in each group was calculated as following equation: The MBP immunoreactivity (%) = (MDdifferent time points-MDbegin) / (MD0h-MDbegin) × 100%.
Myelin phagocytosis assays using primary Schwann cells
An established protocol was followed [64]. Briefly, primary SCs (Cat# EM1010, Boston, MA, USA) were cultured in 6-well plates at the density of 1.00×10⁶ cells/well. The next day, cells in each well were rinsed once with phosphate buffer saline (PBS) and incubated with 1mL complete media supplemented with 10% Fetal Bovine Serum (FBS) and 800 μg mL-1 pHrodo™ Red, succinimidyl ester (pHrodo, Thermo Fisher Scientific, P36600)-labeled myelin debris for 24 h. The procedures of peripheral nerve system (PNS) myelin purification and conjugation with pHrodo were referred to the previous description [65, 66]. The SC media was immediately added the NGF solution at doses of 50 ng mL-1 [63] after mixing with pHrodo-conjugated myelin debris. Then, the SCs were cultured in a humidified incubator (37 °C, 5% CO2). 6 h later, the experimental medium was supplemented with 5 mM 3-MA [67] (Aladdin, M129496). Then, the primary SCs were cultured for another 18 h. The SC media containing with/without NGF was named as control and NGF groups, respectively. If the media also added with 3-MA after culturing for 6 h, we regarded this group as NGF+3-MA.
To reveal engulfed pHrodo-conjugated particles, live SCs in each well were imaged at a 1 h interval for 24 h using a Nikon ECLIPSE Ti microscope (Nikon, Japan). For image processing analysis, we took 5 images/well using 10× objective lens from random areas of the 6 well plates and calculated the integrated fluorescence intensity using the Image J software.
Detection of autophagic flow
RSC 96 Schwann cell lines were seeded on 6-well plates and transfected with tandem fluorescent mRFP-GFP-LC3 adenoviral vectors (HanBio, Shanghai, China) when the confluence reached to 50-70%. After 24 h transfection, the culture medium was changed back to complete medium. Meanwhile, the medium was added in 100 µM H2O2 plus with/without NGF (50 ng/mL). Afterwards, cells were incubated in this condition for 4 h again at 37°C. Cellular autophagosomes and autolysosomes were detected by a Nikon Eclipse 80i fluorescence microscope. GFP degrades in acidic environment while mRFP does not. This is because the pKa value of GFP was relatively higher than mRFP (pKaGFP = 6.0, pKamRFP = 4.5). Therefore, yellow spots (i.e., RFP+GFP+) indicate autophagosomes, while only red puncta indicate autophagolysosomes (i.e., RFP+GFP-). The numbers of yellow and red-only puncta in the merged image were analyzed by Image-Pro Plus software according to the manufacturer's manual. Representative images of confocal microscopy from three independent experiments performed in duplicates. Six different fields were randomly taken for each sample in one experiment.
Data presentation and statistical analysis
To determine statistical significance, the differences between two groups were analyzed by the unpaired Student's t-test with Welch's correction. For three groups or more, one-way ANOVA with a Bonferroni post hoc comparison was used. For one-way ANOVA statistical evaluations, F values were presented in the format F(degree of freedom 1, degree of freedom 2) = X. The degrees of freedom were computed as degree of freedom 1= k - 1, in which k was the number of compared treatments, and degree of freedom 2= n - k in which n was the total number of samples across the treatment groups. For Student's t-test, the values of t and d.f. were showed as the format t = X', d.f. = n' - 2, in which n' was the total number of samples in two compared groups. All parametric data were obtained using GraphPad Prism 5 Software. (GraphPad Software Inc., La Jolla, CA, USA), and P-values < 0.05 were considered statistically significant. Graph bars indicate the mean and standard error of the mean (SEM) in all results.
Results
NGF promotes nerve repair at the early stage of nerve regeneration
NGF plays key roles in neuroprotection and neurogenesis [68-70]. To examine whether NGF had an effect during the early stage of nerve injury, we injected NGF or vehicle control for 5 consecutive days in situ at the right hindlimb of each animal using a rat sciatic nerve crush PNI model. 14 days post-operation, the status of nerve regeneration was measured by hematoxylin and eosin (HE). As shown in Figure 1A- B, we observed an increase in the number of regenerated nerve fibers in the PNI+NGF group relative to the PNI control group.
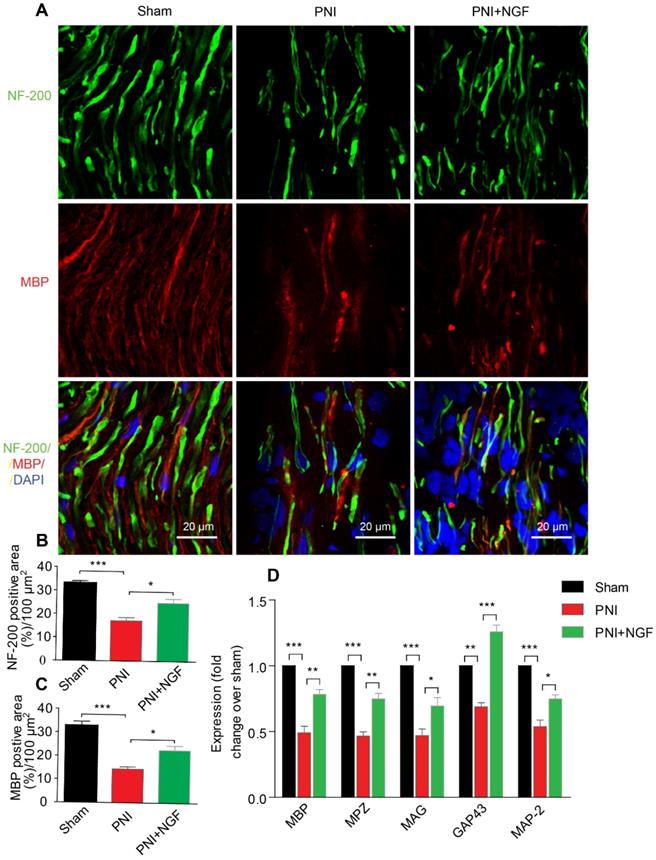
Next, we defined the effect of NGF on remyelination through Luxol fast blue (FBL) staining, toluidine blue (TB) staining and transmission electron microscopy (TEM) (Figure 1C-E). Consistent with the results of morphological analysis, regenerative myelin sheaths in the PNI control group were thinner and smaller than those in the NGF treatment group, which was reflected in the number of regenerated myelin (Figure 1F), the G-ratio measurement (Figure 1G) and the myelin thickness analysis. The ranking order of myelin thickness (from thick to thin) is the sham group-the PNI+NGF group-the PNI control group (Figure 1H). In addition, immunofluorescence double-staining results for MBP (a major constituent of the myelin sheath) and NF-200 (neurofilament, marker for axons) also showed a significant higher immunoreactivity of MBP and NF-200 in the PNI+NGF group, compared to that in the PNI control group (Figure 2A-C). In addition, exogenous NGF administration significantly upregulated the expression of myelination and function-associated genes including MBP, MPZ, MAG, GAP43 and MAP-2 (Figure 2D). These results demonstrated that NGF indeed promoted axon regeneration and remyelination at the early stage of injury.
NGF enhances neuronal regrowth following PNI. (A) A representative micrograph of NF-200 (green) and MBP (red) immunofluorescence in each group. DAPI: nuclear staining (blue). (B, C) Quantification of NF-200 and MBP-positive areas per 100 µm2 in each group. Data are presented as the mean ± SEM; n = 4 rats per group. MBP: F(2, 9) = 29.77, ***Psham vs PNI < 0.001, *PPNI vs PNI+NGF = 0.019; NF-200: F(2, 9) = 31.01, ***Psham vs PNI < 0.001, *PPNI vs PNI+NGF = 0.018. (D) RT-PCR analysis of the expression of myelinated and functional response genes in the lesion nerve treated with/without NGF at 14 days post-injury. Data are presented as the mean ± SEM. n = 3 independent experiments. MBP F(2, 6) = 49.51, ***Psham vs PNI < 0.001, **PPNI vs PNI+NGF = 0.0091; MPZ F(2, 6) = 76.08, ***Psham vs PNI < 0.001, **PPNI vs PNI+NGF = 0.0062; MAG F(2, 6) = 33.03, ***Psham vs PNI < 0.001, *PPNI vs PNI+NGF = 0.048; GAP43 F(2, 6) = 69.15, **Psham vs PNI = 0.0043, ***PPNI vs PNI+NGF < 0.001; MAP-2: F(2, 6) = 46.07, ***Psham vs PNI < 0.001, *PPNI vs PNI+NGF = 0.024.
We next investigated if NGF effect on neurons contributed to axon regeneration and remyelination at the early stage of injury. NGF is known to exert its biological functions through activating two different surface receptors, the 140 kD tyrosine receptor kinase A (TrkA) and the 75 kD neurotrophic factor receptor (p75NTR). While SCs express predominantly p75NTR, peripheral sensory neurons such as dorsal root ganglion (DRG) have both TrkA and p75NTR [71]. We first confirmed that NGF signaled through TrkA to promote axonal growth in DRG. We extracted and cultured DRGs from 2 month-old adult rats in neural medium supplemented with 50 ng/mL NGF [72]. We used GW441756 (final concentration: 2 nM) to inhibit TrkA mediated signaling [73] and TAT-Pep5 (final concentration: 10 µM) to suppress the p75NTR function [74]. After 3 days of treatments, we measured the length and density of axon using immunostaining. Adult rat DRGs cultured in NGF alone exhibited dense axonal growth with extensive elongation. Treatment with GW441756, but not with TAT-Pep5, inhibited NGF-induced axonal growth (Figure S2). These findings have established that NGF acts on TrkA, but not p75NTR, in neurons to promote axonal growth and extension.
To further establish if or not NGF effected on neurons to contribute to myelin removal and nerve fiber regeneration, we tested the in vivo effect of two TrkA inhibitors (K252a, GW441756) to block NGF/TrkA signaling in neurons. Following PNI, rats were treated with either NGF alone or with NGF+K252a (200 nM/1 mL/per animal) [58] once a day for 5 days. 14 days after PNI, we measured the extent of nerve recovery using both H&E and double staining for NF-200/MBP. As illustrated in Figure S3A- B (Left panel) and Figure S3C-E, neither the numbers of nerve fibers nor the immunoreactivity of NF-200/MBP showed a significant difference between the NGF group and the NGF+ K252a group. Similar results were also achieved with the use of another TrkA inhibitor GW441756 (Figure S4K and Figure S4M-P). In contrast, suppressing p75NTR activation with TAT-Pep5 delayed axonal regrowth and remyelination (Figure S3A-B Right panel and Figure S3C-E). Therefore, inhibiting NGF/TrkA in neurons had no appreciable effect in NGF-mediated nerve recovery under our experimental settings. Taken together, our results have suggested that NGF acts on p75NTR to promote nerve regeneration at early stage of PNI.
NGF accelerates SC-mediated myelin debris clearance
Degradation of myelin debris by SCs during the first 5-7 days after injury is a prerequisite for nerve regeneration [75]. We wondered if NGF-mediated neural regeneration was correlated with the speed of myelin clearance following nerve injury. To address this issue, we first prepared distal segments of each right sciatic nerve for morphometric studies using TEM (Figure 3A). In sham rats, the myelin sheaths were compactly arranged and clearly visible. After sciatic nerve injury, the myelin sheets showed severe disorganization and demyelination, with most structures appearing as densely spheroid-like structures (Figure 3A), an indication that the degenerated myelin sheaths had undergone collapse. Interestingly, administration of NGF efficiently reduced the abnormal myelin sheaths (likely attributed to clearance or phagocytosis by SCs), which were replaced by a few small newborn myelin sheaths (Figure 3A). Moreover, quantitative analysis from TEM also revealed that the PNI+NGF group had more newborn myelin, but less abnormal myelin, when compared with the PNI control group (Figure 3B-C).
NGF accelerates SC-dependent myelin degradation. (A) Electron micrographs of sciatic nerve cross sections at day 5 post-injury in the sham, PNI and PNI+NGF groups. The images represent morphological profiles of myelin in each group. The magnified images below show single typical normal myelin (a), demyelinated or degenerative myelin (b), and disintegrating myelin (c). The abnormal myelin includes b and c. (B, C) Quantification of the numbers of newborn and abnormal myelin sheaths per 1000 μm2 in the PNI and PNI+NGF groups. Data are presented as the mean ± SEM; n = 5 rats per group. Newborn myelin: *PPNI vs PNI+NGF = 0.019, t = 3.780, d.f. = 8; Abnormal myelin: *PPNI vs PNI+NGF = 0.015, t = 5.013, d.f. = 8. (D) Staining of myelin debris with ORO was performed on sciatic nerve longitudinal sections from the three groups at 5 days post-injury. (E) Immunofluorescence images showing MPZ (green) and GFAP (red) in sciatic nerve sections taken from each group at 5 days post-injury. Nuclei were labeled with DAPI (blue). (F) Quantitative results showing the ORO-positive area per 100 μm2 from (D). Data are the mean values ± SEM; n = 3 rats per group. F(2, 6) = 50.66, ***Psham vs PNI < 0.001, *PPNI vs PNI+NGF = 0.021. (G) Quantification of MPZ-positive area (%) in each sciatic nerve tissue sample. Data are the mean values ± SEM; n = 3 rats per group. F(2, 6) = 48.35, *Psham versus PNI = 0.020, *PPNI vs PNI+NGF = 0.015. (H) Electron micrograph showing the presence of a fragmented myelin (red arrows)-containing Schwann cell cytoplasmic pocket in the PNI and PNI+NGF groups and a normal myelin in the sham group. (I) Double-immunostaining showing MPZ+ myelin inclusions and S-100 markers for SCs in normal cultured RSC96 cells (begin). 24 h after incubation with myelin debris, 50 ng/mL NGF was added to the culture medium (0 h) and incubated for 12 h, 24 h and 48 h, respectively. (J) Quantitation of MBP immunoreactivity (relative to 0 h) at different time points in group control and NGF. Data are the mean values ± SEM; n = 3 independent experiments with a minimum of 6 picture frames analyzed per time point/group/experiment. T = 48 h *PNGF versus control = 0.036, t = 3.113, d.f. = 4.
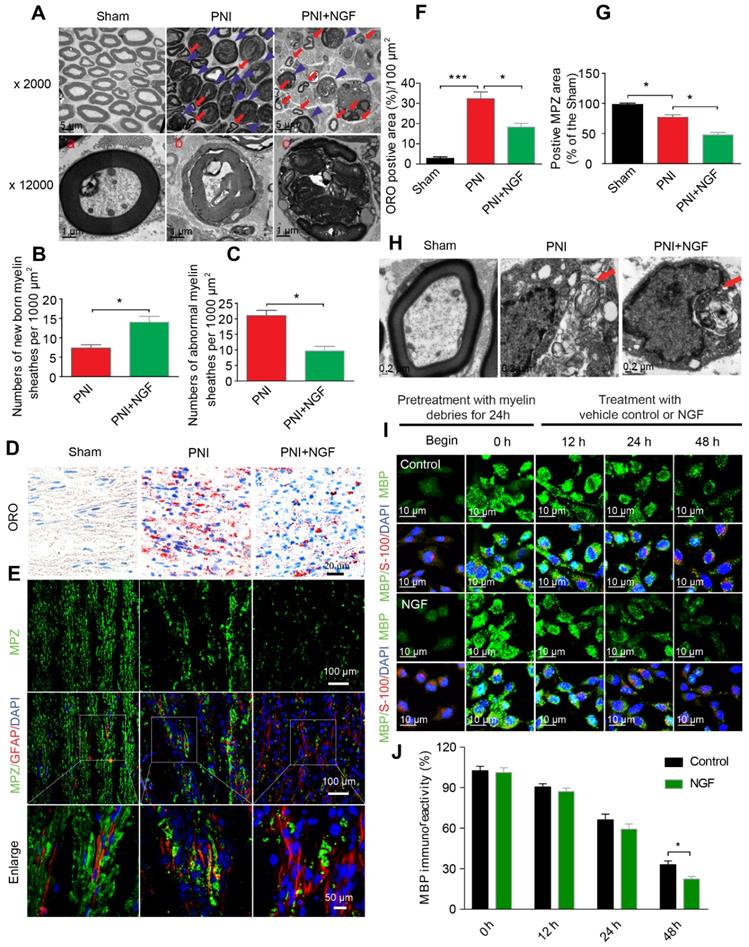
We then measured the accumulation of the myelin lipid degradation products in each group through oil red O (ORO) staining [76]. The myelin lipid degradation products, including myelin debris, are rich in lipids and lipid droplet, which were specifically dyed by ORO staining. Thereby, this method is an optimal staining of the myelin lipid degradation products. Our results revealed that 5 days after injury the sham group showed no signal for ORO staining while the PNI group accumulated myelin degradation products. NGF treatment significantly reduced the cumulative lipid tracers (Figure 3D and F). Similar results were also obtained for the quantity of MBP and MPZ (both are markers of peripheral type myelin), as determined by Western blotting (Figure S5).
Next, we harvested nerve segments from the lesion site in the PNI+NGF group at 1, 3 and 5 days. Nerve segments from the sham group were used as control (0 day). Analysis of EM images of the PNI+NGF samples revealed that the degenerative myelin sheathes underwent progressive disintegration and breakdown (Figure S6A-C). We also cultured sciatic nerve explants for 0, 1, 3 and 5 days in vitro (DIV). Immunohistochemistry of high magnification images showed that the cytoskeleton morphology of the sciatic nerve explants progressively generated ovoid-like or clustered structures over time (Figure S6D-F). Collectively, these results indicate that NGF treatment did not delay demyelination and axonal degeneration, but rather NGF likely accelerated the degeneration and clearance of myelin and axon.
To further explore whether NGF-mediated clearance of myelin debris selectively targeted SCs digestion, we first examined the quantity of SCs and myelin debris in each group via co-staining for GFAP (marker for immature SCs, red) and MPZ (the major structural protein marker for myelin, green). As shown in Figure 3E, MPZ was evenly distributed and co-localized with GFAP in the sham group with accumulation of large number of small puncta. Patches of myelin were also aggregated inside of the dedifferentiated SCs in the PNI group, indicating a significant delay in myelin degradation after nerve injury (Figure 3E). In the NGF-treated group, the disappearance of myelin debris became evident, which was further confirmed by comparing the MPZ positive area in the PNI group and in the PNI+NGF group (Figure 3G). In addition, myelin lipids within the cytoplasmic pocket of Schwann cells were clearly visualized in EM images in both the PNI and PNI+NGF groups (Figure 3H), suggesting that myelin debris digestion occurred in SCs during WD.
To further investigate if SCs degraded myelin debris, we added myelin debris (obtained from shredded nerve tissue) to RSC 96 cells, a cell line derived from SCs [77, 78]. RSC 96 cells were then treated with or without NGF. Cells were stained for MBP, a marker of myelin debris and for S-100, a marker of SCs. The fluorescence intensity for MBP in untreated RSC cells was weak (Figure 3I). Following incubation with myelin debris in the culture medium for 24 h, MBP+ puncta were accumulated then attenuated in RSCs (Figure 3I, 0-48 h). Of note, the speed of attenuation of MBP+ fluorescence in the NGF-treated group was faster than that in the group control, leading to less myelin debris existing in the SCs after 48 h (Figure 3I-J). Taken together, these results point to that NGF treatment promoted myelin clearance by SCs.
NGF activates autophagy to facilitate myelin degradation after nerve crush injury
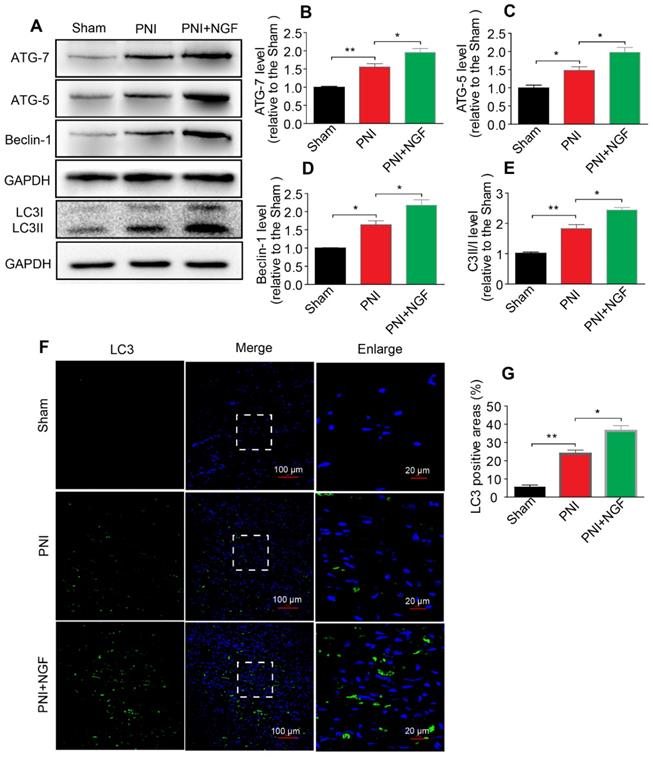
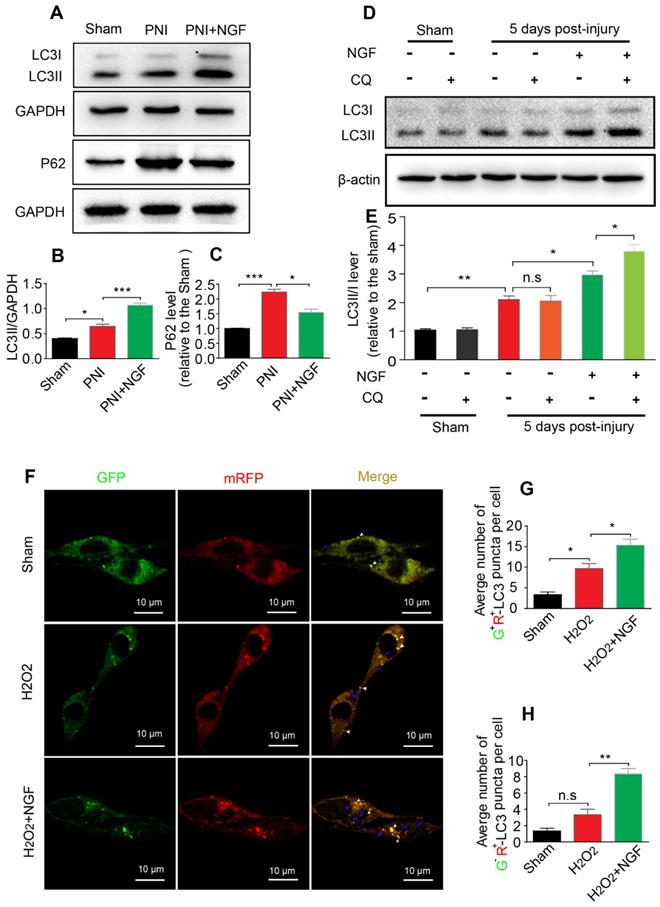
Autophagy participates in the clearance of peripheral myelin debris during WD [23, 26]. To test whether NGF-enhanced myelin debris clearance was closely related to NGF regulation of autophagy activation, protein expressions of ATG-7, ATG-5, Beclin-1 and LC3 in each group were determined using Western blotting. As shown in Figure 4A, these autophagic proteins were increased 5d following injury and their levels were further enhanced after administrating NGF for 5 consecutive days. Statistical results of those autophagy-related proteins further confirmed our analysis (Figure 4B-E). Consistent with these findings, NGF treatment resulted in an increase in the fluorescence intensity of the autophagic marker protein LC3 in in the PNI+NGF group in comparison with the PNI group (Figure 4F-G). Collectively, these results indicated that NGF-mediated myelin clearance was accompanied by an increased activity of autophagy.
NGF increases the level of autophagy in nerve lesions at day 5 after injury. (A) Western blotting analysis of ATG-7, ATG-5, Beclin-1 and LC3 in sham, PNI and PNI+NGF groups at 5 days post crush. (B-E) Quantification of autophagy-related proteins expressed in (A). GAPDH was set as a loading control. Data are presented as the mean ± SEM; n = 3 or 4 independent experiments. ATG-7 F(2, 6) = 32.47, **Psham vs PNI = 0.006, *PPNI vs PNI+NGF = 0.036; ATG-5 F(2, 6) = 20.90, *Psham vs PNI = 0.032, *PPNI vs PNI+NGF = 0.041; Beclin-1 F(2, 6) = 29.82, *Psham vs PNI = 0.027, *PPNI vs PNI+NGF = 0.039; LC3II/I F(2, 9) =55.81, **Psham vs PNI = 0.0084, *P = 0.031. (F, G) Representative images of LC3 (green) immunostaining and quantitative analysis of the average LC3 positive area in each group. n = 3 rats per group, and the results are shown as the mean ± SEM. F(2, 6) = 61.36, **Psham vs PNI = 0.0072, *PPNI vs PNI+NGF = 0.041.
NGF enhances autophagy through maintaining autophagic flux following contusion of the sciatic nerve
The level of autophagic flux determines the autophagic fluency during the process of degrading misfolded proteins and damaged organelles [13]. P62/sequestosome-1 mediates the degradation of cytosolic contents through directly binding to LC3. The changes in P62 and LC3 levels reflect the degree of autophagic flux [13, 79]. P62 reduction and LC3 increase represented enhancement of the autophagic flux, namely unhindered fusion of the autophagosome and lysosome. If both proteins exhibited accumulation, this would indicate impaired degradation of the autolysosome [80]. To demonstrate whether NGF increased the expression of autophagy associated-proteins ascribed to the increased formation of autolysosomes rather than decreasing their degradation, we first measured the levels of the autophagic flux marker protein P62 and its molecular chaperone LC3II by Western blotting. The result showed that the levels of LC3II and P62 became significantly increased after PNI. Interestingly, NGF treatment resulted in an increase in the expression of LC3II with a concomitant decrease in P62 (Figure 5A-C). These results demonstrated that NGF enhances autophagic flux in PNI.
NGF drives autophagic flux following injury in vivo and in vitro. (A-C) Representative Western blotting and densitometric analysis of LC3II and P-62/SQSTM1 in the sham, PNI and PNI+NGF groups at 5 days post injury. Data are presented as the mean ± SEM; n = 3 independent experiments. LC3II F(2, 6) = 81.92, *Psham vs PNI = 0.036, ***PPNI vs PNI+NGF < 0.001; P62 F(2, 6) = 53.43, ***Psham vs PNI < 0.001, *PPNI vs PNI+NGF = 0.018. (D, E) LC3 expression and optical density analysis in normal or injured nerves treated with NGF or CQ. β-actin was used as the loading control and for normalization. Data are the mean values ± SEM, n= 3 independent experiments. F(5, 12) = 75.19, *P PNI+NGF vs PNI+NGF+CQ = 0.036, PPNI vs PNI+CQ = 0.96 (n.s), **Psham vs PNI = 0.0051, *PPNI vs PNI+NGF = 0.042. (F) After stably transfected with tandem-labeled mRFP-GFP-LC3 for 24 h, RSC 96 cell lines were incubated with H2O2 (100 μM) with or without NGF for another 4 h. Representative images of mRFP-GFP-LC3 vector were shown by fluorescent detection. (G, H) Quantitative analysis of the number of yellow (G+R+) autophagosomes and red (G-R+) autolysosomes. Data are the mean values ± SEM; Autophagosme F(2, 6) = 27.03, *Psham versus PNI = 0.014, *PPNI versus PNI+NGF = 0.020; Autophagolysome F(2, 6) = 39.00, Psham versus PNI = 0.085 (n. s), **PPNI versus PNI+NGF = 0.0023.
To further confirm our observation, we intraperitoneally injected the lysosomal inhibitor CQ into the sciatic nerve with or without NGF treatment at day 5. 2 hours post injection, the cleavage of LC3 in the normal and injured sciatic nerves was evaluated by Western blotting. Under the condition of lysosomal inhibition with CQ, NGF treatment led to an increase in the transition of LC3I to LC3II in comparison to vehicle treatment (Figure 5D). In contrast, no significant difference exited between the PNI group and the sham group with/without CQ administration (Figure 5D-E). Taken together, these results suggest that acute PNI disrupted autophagy flux and NGF treatment promoted autophagic flux through enhancing autophagosome fusion with lysosome.
To mimic pathological changes of PNI in vitro, we treated RSC 96 cells with 100 μM H2O2 in the medium [81, 82]. We used mRFP-GFP-LC3 to monitor autophagic flux. Since the GFP fluorescent intensity is more sensitive to low pH environment in autolysosomes and RFP is relatively more resistant to low pH, a decrease in the ratio of GFP+/mRFP+ signal intensity frequently indicates autophagic activity [83, 84]. Control group transfected with mRFP-GFP-LC3 showed some basal level of autophagy (Figure 5F). As expected, addition of H2O2 increased the number of RFP+/GFP+ dots (white arrowheads) and these effects were further enhanced in cells treated with 50 ng/ml NGF (Figure 5F-G). NGF treatment also significantly increased the number of RFP+/GFP- dots (blue arrows) compared with only H2O2 stimulated group (Figure 5F and H). These results demonstrated that NGF treatment increased the conversion from autophagosomes to autolysosomes to rescue the impaired autophagy flux after cell injury.
NGF-induced autophagy activation in dedifferentiated SCs contributes significantly to myelin clearance and nerve regeneration
SCs are responsible for myelin encapsulation to promote axonal survival and growth [85]. To determine whether NGF-medicated autophagy activation and an increase in the autophagic flux following PNI was originated from SCs in vivo, we first analyzed the morphological signatures of autophagy in SCs by TEM. Autophagosomes (APs) are distinctly visible under TEM as 2 parallel membrane layers (bilayers) wrapping the substrate, which easily distinguish with the myelin membrane [86]. We used this criterion to quantitate the number of APs in our experiments. As shown in the EM micrographs of transverse ultra-thin sections, APs were observed within the SCs in both the PNI group and the PNI+NGF group (arrowheads, Figure 6A). Interestingly, the average number of APs in the PNI+NGF group was nearly two-folds of that in the PNI group (Figure 6C).
NGF mediates the enhancement of autophagy in SCs. (A) Transmission electronic microscopy images show numerous autophagosomes in the sham, PNI and PNI+NGF groups on postoperative day 5. APs: autophagosome (arrowheads); M: mitochondria (arrow); N: nucleus. The autophagosome is shown at high magnification in the inset. (B) Double immunofluorescence staining of LC3 protein (green) with S-100 positive dots (red) was detected in all groups at P5. Nuclei are counterstained with DAPI (blue). (C) Qualitative analysis of the average number of autophagosomes per Schwann cell from (A). Data are presented as the mean ± SEM; n = 5 rats per group. F(2, 12) = 43.80, *Psham vs PNI = 0.015, **PPNI vs PNI+NGF = 0.0082. (D) Quantification of the percent of S-100 colocalization with LC3 in the lesion area of sciatic nerves from (B). Data are presented as the mean ± SEM; n = 3 rats per group. F(2, 6) = 40.08, **Psham vs PNI = 0.0074, *PPNI vs PNI+NGF = 0.038.
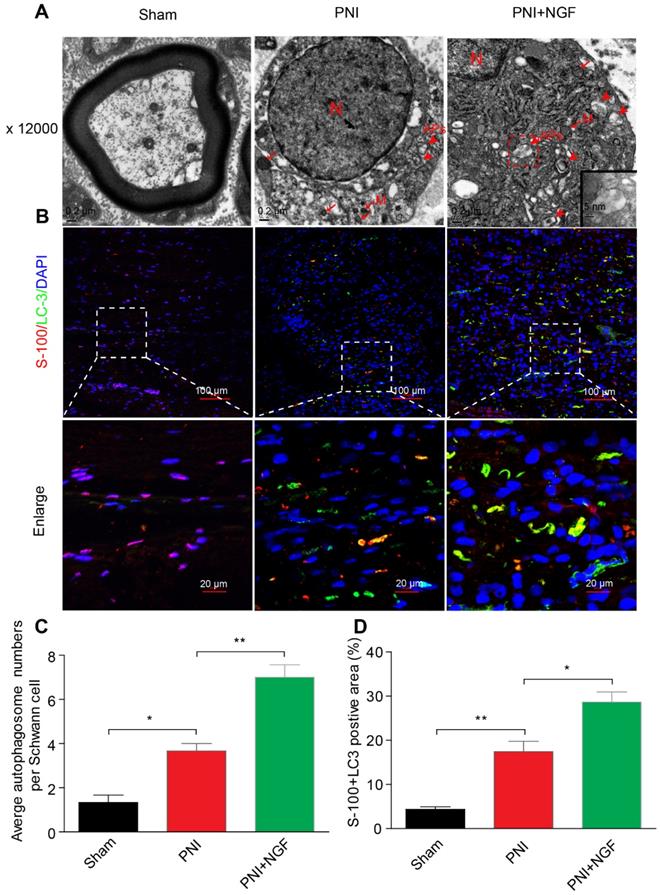
In a parallel set of experiments, double immunofluorescence staining for S-100 (a marker for SCs) and LC-3 (a marker for autophagy) showed that a large number of LC-3 puncta were colocalized with S-100 in the PNI+NGF group, which were seldom seen in the PNI group. This phenomenon became more pronounced at higher magnification (Figure 6B). Quantitative results indicated that NGF treatment nearly doubled the positive area of LC3+S-100 compared to PNI (Figure 6D). These results indicate that NGF enhanced activation of autophagy and autophagic flux in SCs during WD.
Macrophages also plays an important role in remyelination and nerve regeneration
To investigate if macrophages participated in myelin removal during peripheral nerve regeneration, we used SiO2 [87] or Cyclosprin A [88] to suppress macrophage activity. Following PNI, we injected SiO2 or Cyclosprin A at the injury sites, with or without co-administration of NGF, for 5 days. The animals were then sacrificed and sciatic nerve samples were extracted to examine the presence of macrophages and myelin clearance at the injury site (Figure S7). The presence of macrophages was detected by staining with a specific antibody against CD68, a marker for macrophages, and myelin debris was visualized with oil red O (ORO) and MPZ staining as in Figure 3D-E. Our results showed that SiO2 or Cyclosprin A, with or without administration of NGF, reduced the presence of macrophages at the injury site (Figure S7A and D). However, the macrophage inhibitors did not affect the amount of myelin debris as detected by either ORO (Figure S7B and E) or MPZ (Figure S7C and F) or MPZ-positive area without NGF co-injection. Yet, interestingly, even in the presence of these inhibitors, NGF treatment resulted in significant decrease in myelin debris (Figure S7B-F). These data suggest that macrophages unlikely contribute to the early phase of myelin destruction and clearance following PNI.
To investigate if macrophages played a role in remyelination and nerve rehabilitation, we prepared PNI animals that were injected SiO2 or Cyclosprin A at the injury sites, with or without co-administration of NGF. 14 days following PNI, we measured the number of macrophages (CD68), nerve rehabilitation (NF-200), myelin status (both MBP signals and #s of myelin sheathes) (Figure S8). At this stage, as compared with control, we did not see a difference in the numbers of macrophages in animals treated with SiO2 or Cyclosprin A, with or without co-administration of NGF (Figure S8A and D). However, macrophage inhibitors resulted in a significant reduction in nerve rehabilitation as measured by NF-200 signal intensity without NGF co-injection (Figure S8B and E). Interestingly, NGF treatment increased the NF-200 signals in the two samples treated with macrophage inhibitors to a level similar to the control sample that was treated with NGF (Figure S8B and E). The effect of SiO2 or Cyclosprin A on myelin status (MBP signals and #s of myelin sheathes) showed a trend parallel to NF-200 signal. i.e. without NGF treatment the macrophage inhibitors alone reduced both MBP signals (Figure S8B and F) and #s of myelin sheathes (Figure S8C and G). Again, the deficits induced by the inhibitors dissipated when co-treated with NGF (Figure S8B, F and C, G).
Taken together, our data point to that macrophages may not contribute significant to the early phase of myelin destruction and clearance following PNI. However, they do play an important role in remyelination and axonal regeneration in the absence of exogenous NGF treatment.
The p75NTR/AMPK/mTOR signaling pathway is responsible for NGF-induced autophagy enhancement in SCs
p75NTR is highly expressed in SCs [89] and NGF activates p75NTR to stimulate downstream signaling pathways[90]. AMPK/mTOR signaling has also been demonstrated to enhance autophagy to confer a neuroprotective effect against focal cerebral ischemia [91]. AMPK upregulates autophagy through inhibiting mTOR activation [92]. To determine whether NGF-mediated autophagy in SCs during WD was modulated by the p75NTR/AMPK/mTOR signaling, we examined the level of p-AMPK, p-p70s6k and p-mTOR after 5 days in sciatic nerves of injured rats by Western blotting. In comparison with the sham group, the ratio of p-AMPK/AMPK increased while the ratios for both p-mTOR/mTOR and p-p70s6k/p70s6k decreased after PNI. The effect was further enhanced by NGF treatment in the PNI+NGF group (Figure 7A-D).
NGF activates autophagy in SCs via the p75NTR/AMPK/mTOR pathway. (A) Protein expression of p-AMPK (T172), AMPK, p-mTOR (S2448), mTOR, p-p70s6k (T421/S424), p70s6k in the sham, PNI model and PNI+NGF groups at 5 days post-injury; (B-D) Quantitative analysis of the p-AMPK/AMPK, p-p70s6k/p70s6k and p-mTOR/mTOR protein in each group. Data are presented as the mean ± SEM; n = 3 independent experiments. p-mTOR/mTOR F(2, 6) = 134.50, **Psham vs PNI = 0.0051, **PPNI vs PNI+NGF = 0.0079; p-p70s6k/p70s6k F(2, 6) = 34.06, **Psham vs PNI = 0.0054, *PPNI vs PNI+NGF = 0.042; p-AMPK/AMPK F(2, 6) = 57.27, **Psham vs PNI = 0.0073, *PPNI vs PNI+NGF = 0.025. (E, F) Immunoblots and quantification of p75NTR. Data are presented as the mean ± SEM; n = 5 independent experiments. P75NTR F(2, 12) = 62.17, *Psham vs PNI = 0.035, ***PPNI vs PNI+NGF < 0.001. (G) Immunostaining of frozen sciatic nerve sections of the PNI and PNI+NGF groups with anti-GFAP (red) and anti-p75NTR (green) antibodies. Nuclei were counter-stained with DAPI (blue).
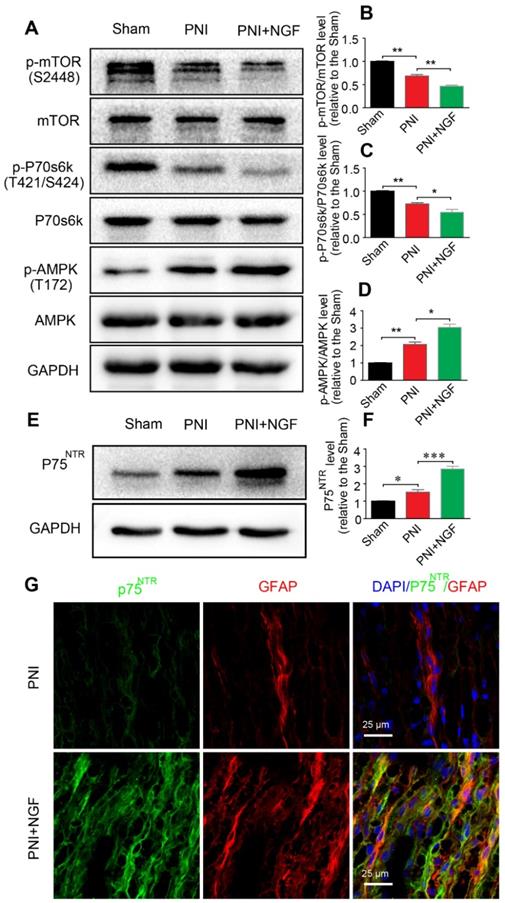
To evaluate whether NGF regulated AMPK signaling through binding to p75NTR, we measured the protein levels of p75NTR in each group by Western blotting. The results showed that, compared with the sham group, the p75NTR protein level was significantly increased after PNI. The level of p75NTR was further increased by NGF treatment in the PNI+NGF group (Figure 7E-F). Immunostaining showed that p75NTR immunoreactivity was predominantly co-localized with the GFAP- positive area (Figure 7G), indicating that there was an increase in the p75NTR expression in SCs in the injured nerve section receiving NGF treatment. Together, these results support that NGF increases autophagy likely through activation of the p75NTR/AMPK/mTOR pathway.
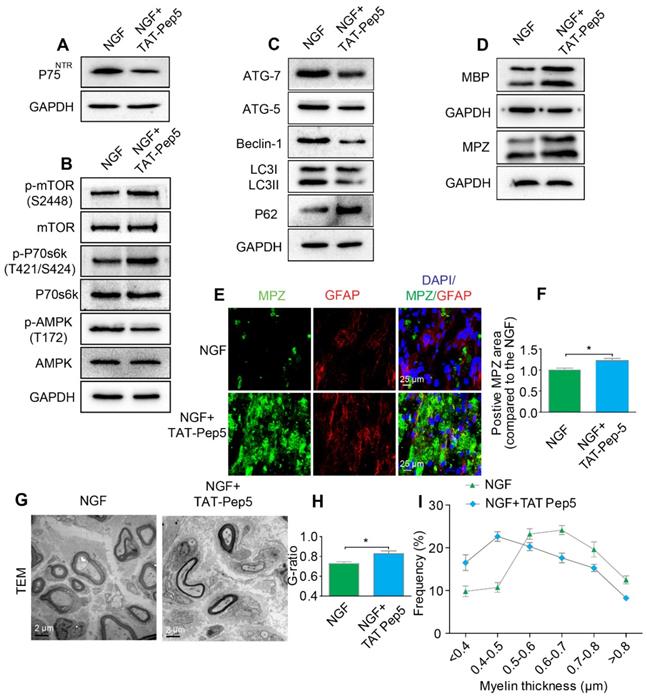
Inhibition of p75NTR but not Trk A specifically attenuates SC-mediated myelin degradation and impedes axonal remyelination
NGF exerts its cellular effects through two known receptors, p75NTR and TrkA. If NGF activated AMPK signaling through p75NTR rather than Trk A, we predicted that inhibition of p75NTR by pharmacological methods would prevent SCs from effectively digesting myelin lipids and further lead to impairment of the remyelinating processes following PNI. To test our hypothesis, PNI rats were co-administered with NGF plus TAT-Pep5 [93] (a p75NTR inhibitor, 40 μg/0.2 mL/per animal) or NGF plus GW441756 (a TrkA inhibitor, 10 mg/kg) [94]. As expected, TAT-Pep5 treatment significantly attenuated p75NTR expression as compared to that of the only NGF treatment group (Figure 8A). Consistently, the effects of NGF on the downstream pathway of AMPK activation was abrogated by TAT-Pep5, as evident by the decreasing ratio of p-AMPK/AMPK and increasing expression of p-p70s6k/p70s6k and p-mTOR/mTOR (Figure 8B, Table 2). However, in PNI rats treated with NGF+GW441756, the ratios for p-AMPK/AMPK, p-p70s6k/p70s6k and p-mTOR/mTOR showed no significant difference with those of NGF treatment only (Figure S3A-D).
Inhibition of p75NTR reduces NGF-medicated autophagy and delays myelin clearance and axonal remyelination after sciatic nerve crush injury. (A) Western blots of p75NGF in the NGF and NGF+TAT-Pep 5 groups 5 days after injury. (B) Changes in the p-AMPK/AMPK, p-p70s6k/p70s6k and p-mTOR/mTOR ratios in each injured nerve. (C) Immunoblotting and quantitative analysis of ATG-7, ATG-5, Beclin-1 P62 and LC3 in the two groups. (D) The protein expression of MBP and MPZ in each group at 5 days post-injury. Quantitative analysis and statistical difference of western blotting results in these two groups were listed in table 2. Data are the mean values ± SEM; n = 3 or 4 independent experiments. (E, F) Immunofluorescence images and quantification of MPZ and GFAP signals in ipsilateral nerves 5 days after injury in NGF or NGF+TAT-Pep treatment rats. Data are the mean values ± SEM; n = 3 rats per group. MPZ *PNGF vs NGF+TAT-Pep5 = 0.043, t = 3.205, d.f. = 4. (G) Representative TEM images of 14 day sections in each experimental group. Scale bar: 20 μm (HE), 2 μm (TEM) and 25 μm (Immunofluorescence). (H-I) Quantification of the distribution of myelin thickness, G-ratio. Data are represented as the means ± SEM; n = 3 rats per group. G-ratio *PNGF vs NGF+TAT-Pep5 = 0.043, t = 2.938, d.f. = 4.
Quantitative analysis of related proteins expression from immunoblotting in figure 8
| Mean ± SEM | Statistical analysis | |||||
|---|---|---|---|---|---|---|
| Protein | NGF | NGF+TAT-Pep 5 | d.f. | t value | P value | Significant |
| p75NGF | 1.00 ± 0.11 | 0.63 ± 0.07 | 4 | 4.657 | 0.019 | * |
| p-AMPK/AMPK, | 1.00 ± 0.10 | 0.66 ± 0.07 | 4 | 3.403 | 0.042 | * |
| p-p70s6k/p70s6k | 1.00 ± 0.08 | 1.57 ± 0.07 | 4 | 6.289 | 0.0081 | ** |
| p-mTOR/mTOR | 1.00 ± 0.04 | 1.35 ± 0.08 | 4 | 4.992 | 0.038 | * |
| ATG-7 | 1.00 ± 0.45 | 0.45 ± 0.20 | 4 | 4.657 | 0.043 | * |
| ATG-5 | 1.00 ± 0.35 | 0.68 ± 0.31 | 4 | 3.595 | 0.036 | * |
| Beclin-1 | 1.00 ± 0.28 | 0.60 ± 0.32 | 4 | 5.307 | 0.013 | * |
| P62 | 1.00 ± 0.38 | 1.52 ± 0.40 | 4 | 4.159 | 0.025 | * |
| LC3II/I | 1.00 ± 0.26 | 0.78 ± 0.26 | 4 | 3.965 | 0.029 | * |
| MBP | 1.00 ± 0.33 | 1.30 ± 0.41 | 6 | 3.404 | 0.027 | * |
| MPZ | 1.00 ± 0.28 | 1.22 ± 0.30 | 4 | 4.385 | 0.022 | * |
The value of each protein expression was relative to the NGF group. *P < 0.05, **P < 0.01, compared with the NGF group.
Furthermore, administration of TAT-Pep5 markedly promoted P62 expression and inhibited increased in the levels of ATG-7, ATG-5, and Beclin-1 proteins and the LC3-II/LC3-I ratio (Figure 8C, Table 2), while injection of GW441756 had no significant effect on the expression of these proteins (Figure S3E-I). Importantly, compared to the NGF only treatment group after sciatic nerve contusion, TAT-Pep5 significantly impeded the ability of SCs to perform myelin debris clearance (Figure 8D-F, Table 2) and axonal regeneration and remyelination (Figure S2, Figure 8G-I). But this effect was not seen in the NGF + GW441756 treated rats (Figure S3J-P). Together, these data suggest that NGF signaled through p75NTR, but not TrkA, to activate autophagy in SCs and facilitate myelin debris clearance and remyelination after PNI.
Inhibition of the AMPK activation partially abolishes NGF-mediated autophagic myelin degradation in SCs during nerve regeneration
To define a role of AMPK signaling in NGF-mediated autophagy and its legacy effect, NGF and Cpd C - a specific AMPK inhibitor [95], were co-administered to PNI rats. Changes in the levels of p-mTOR, mTOR, p-AMPK, AMPK, p-p70s6k, and p70s6k were detected by Western blotting. The results showed that NGF-induced AMPK activation was significantly suppressed by Cpd C treatment (Figure 9A, Table 3). In addition, inactivating the AMPK pathway with Cpd C further blocked the elevated level of autophagy in nerve contused rats receiving NGF treatment, as evident by a decrease of the ATG-7, ATG-5, and Beclin-1 levels and the LC3-II/I ratio with a concomitant elevation of P62 (Figure 9B, Table 3).
Inhibition of AMPK significantly attenuates NGF-induced autophagic activities, myelin clearance and neural regeneration. (A) The ratios of p-AMPK/AMPK, p-p70s6k/p70s6k and p-mTOR/mTOR were evaluated by western blotting in PNI, NGF and NGF+Cpd C rat sciatic nerve tissue lysates at 5 days post-injury. (B) Autophagy related proteins expression (including ATG-7, ATG-5, Beclin-1 P62 and LC3) were detected through western blotting. (C) Representative immunoblots for MBP and MPZ in each group of rats. Quantitative data and statistical analysis of western blotting results in these three groups were showed in table 3. Data are presented as the mean ± SEM; n = 3 or 4 independent experiments. (D, E) Co-immunofluorescence images and quantification showing MPZ (green) and GFAP (red) in injured sciatic nerve at day 5. Nuclei are blue (DAPI). Original scale bar = 100 µm and close-up scale bar = 25 µm. Data are presented as the mean ± SEM; n = 3 rats per group. MPZ F(2, 6) = 18.89, **PPNI vs NGF = 0.0053, *PNGF vs NGF+Cpd C = 0.015. (F) TEM images and double staining for MBP (red)/NF-200 (green) of sections from the injured sciatic nerve in each rat group at 14 days post-injury. Nuclei are blue (DAPI). (G-J) Analysis of G-ratio, myelin thickness distribution, and NF-200- and MBP- positive staining in each group. Data are presented as the mean ± SEM; n = 3 rats per group. G-ratio F(2, 6) = 8.64, *PPNI vs NGF = 0.043, *PNGF vs NGF+Cpd C = 0.045; NF-200 F(2, 6) = 11.89, **PPNI vs NGF = 0.0078, *PNGF vs NGF+Cpd C = 0.034; MBP F(2, 6) = 10.08, *PPNI vs NGF = 0.041, *PNGF vs NGF+Cpd C = 0.043.
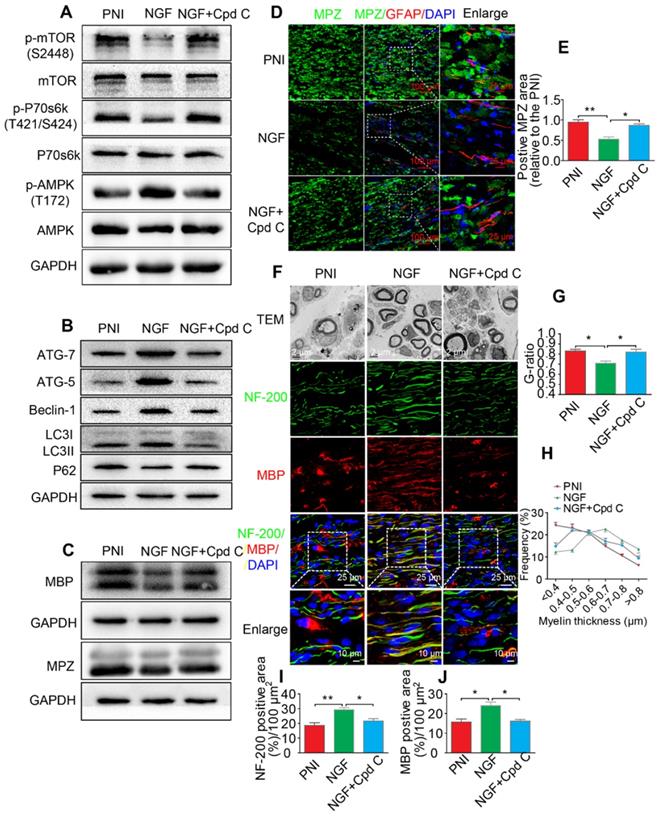
Quantitative analysis of related proteins expression from immunoblotting in figure 9
| Mean ± SEM | Statistical analysis | |||||
|---|---|---|---|---|---|---|
| Protein | PNI | NGF | NGF+Cpd C | F value | PNI vs. NGF | NGF vs. NGF+Cpd C |
| p-AMPK/AMPK, | 1.00 ± 0.09 | 2.06 ± 0.23 | 1.10 ± 0.12 | F(2, 6) = 21.32 | **P = 0.0052 | *P = 0.019 |
| p-p70s6k/p70s6k | 1.00 ± 0.09 | 0.55 ± 0.03 | 0.92 ± 0.10 | F(2, 6) = 13.87 | **P = 0.0041 | *P = 0.047 |
| p-mTOR/mTOR | 1.00 ± 0.06 | 0.61 ± 0.04 | 0.99 ± 0.09 | F(2, 6) = 16.17 | **P = 0.0063 | *P = 0.045 |
| ATG-7 | 1.00 ± 0.05 | 2.16 ± 0.26 | 1.40 ± 0.15 | F(2, 6) = 16.44 | **P = 0.0051 | *P = 0.042 |
| ATG-5 | 1.00 ± 0.11 | 1.82 ± 0.18 | 1.27 ± 0.09 | F(2, 6) = 15.41 | **P = 0.0073 | *P = 0.038 |
| Beclin-1 | 1.00 ± 0.13 | 1.66 ± 0.11 | 0.85 ± 0.12 | F(2, 6) = 19.51 | **P = 0.0087 | **P = 0.0084 |
| P62 | 1.00 ± 0.08 | 0.51 ± 0.04 | 0.77 ± 0.09 | F(2, 6) = 17.29 | **P = 0.0045 | *P = 0.035 |
| LC3II/I | 1.00 ± 0.07 | 1.53 ± 0.11 | 0.96 ± 0.08 | F(2, 6) = 20.05 | **P = 0.0076 | *P = 0.014 |
| MBP | 1.00 ± 0.06 | 0.44 ± 0.05 | 0.82 ± 0.08 | F(2, 9) = 24.80 | **P = 0.0012 | *P = 0.010 |
| MPZ | 1.00 ± 0.09 | 0.61 ± 0.06 | 0.94 ± 0.07 | F(2, 6) = 11.20 | *P = 0.038 | *P = 0.026 |
The value of each protein expression was relative to the PNI group. *P < 0.05, **P < 0.01.
Next, we focused on the efficiency of Cpd C in NGF-regulated myelin breakdown and clearance. Immunofluorescence and Western blotting analysis revealed that Cpd C delayed the effects of NGF in promoting myelin fragment clearance (Figure 9C-E, Table 3). We then tested whether Cpd C inhibited the effect of NGF on axonal growth and myelin regeneration. As indicated in Figure 9F, the regenerated myelin and nerve fibers were more loose, sparse and irregular in NGF+Cpd C rats compared to those of rats treated with NGF alone. Statistical analysis of the ranking of myelin thickness, the G-ratio and the signals for NF-200 and MBP areas also showed a similar effect (Figure 9G-J).
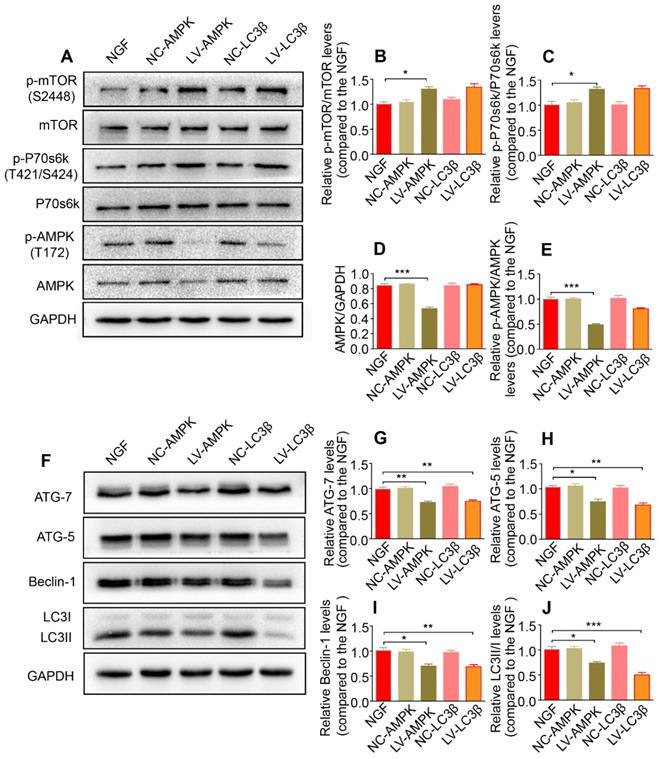
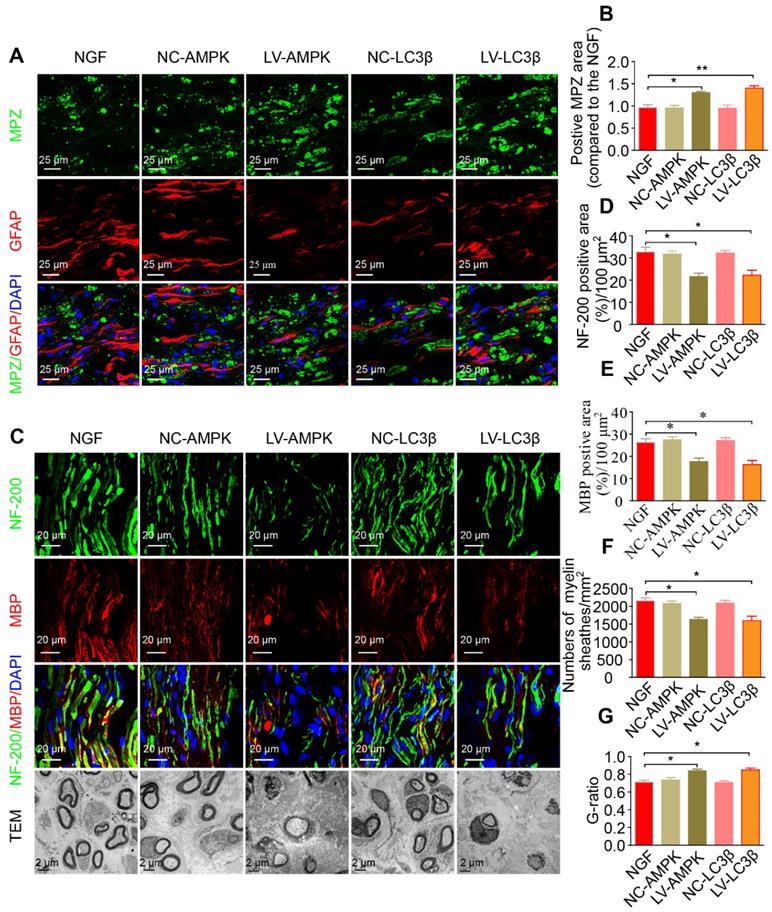
Additionally, silencing AMPK gene expression through orthotopic injection (OI) of Lenti-AMPK-RNAi significantly blocked the AMPK expression and decreased the ratio of p-AMPK/AMPK and p-p70s6k/p70s6k, but also increased the expression of p-mTOR/mTOR (Figure 10A-E). Moreover, the downstream biological effects, including autophagic activation, myelin clearance and nerve reestablishment, were all delayed after knock-down of AMPK activation (Figure 10F-J and Figure 11). Therefore, these results provide compelling evidence that NGF activated AMPK to upregulate autophagy-mediated clearance of myelin fragments to expedite remyelination.
Reducing AMPK or LC3 expression significantly inhibits the autophagy and its upstream signaling activation. (A-E) Representative immunoblots of p-AMPK, AMPK, p-p70s6k, p70s6k, p-mTOR and mTOR in NGF therapeutic rats infected with/without LV-AMPK-RNAi/LV-NCAMPK-RNAi or LV-LC3β-RNAi/LV-NCLC3β-RNAi and quantification of these data. Data are the mean values ± SEM; n = 3 independent experiments. p-mTOR/mTOR F(4, 10) = 7.99, *PNGF vs LV-AMPK = 0.011; p-p70s6k/p70s6k F(4, 10) = 8.30, *PNGF vs LV-AMPK = 0.019; AMPK/GAPDH F(4, 10) = 44.48, ***PNGF vs LV-AMPK < 0.001; p-AMPK/AMPK F(4, 10) = 41.67, ***PNGF vs LV-AMPK < 0.001. (F-J) Autophagy related proteins (including ATG-7, ATG-5, Beclin-1 and LC3) were detected by western blotting and quantified their expression in those five groups. Data are presented as mean ± SEM; n = 3 independent experiments. ATG-7 F(4, 10) = 17.48, **PNGF vs LV-AMPK = 0.0054, **PNGF vs LV-LC3β = 0.0070; ATG-5 F(4, 10) = 16.48, *PNGF vs LV-AMPK = 0.017, **PNGF vs LV-LC3β = 0.0028; Beclin-1 F(4, 10) = 11.56, *PNGF vs LV-AMPK = 0.011, **PNGF vs LV-LC3β = 0.0092; LC3II/I F(4, 10) = 24.59, *PNGF vs LV-AMPK = 0.016, ***PNGF vs LV-LC3β < 0.0001.
RNAi-mediated knocking-down of AMPK impairs myelin degradation, axonal regeneration and remyelination. (A) Co-immunostaining with anti-MPZ (green) and anti-GFAP (red) antibodies in injured sciatic nerve at day 5. Nuclei were blue (DAPI). (B) The positive MPZ areas in each group were calculated. Data are presented as mean ± SEM; n = 3 rats per group. MPZ F(4, 10) = 12.23, *PNGF vs LV-AMPK = 0.020, **PNGF vs LV-LC3β = 0.0087. (C) Double-immunostaining for MBP (red)/NF-200 (green) and TEM images of sections from the injured sciatic nerve in each group rats at 14 days. Nuclei were blue (DAPI). (D-G) Analysis of NF-200 and MBP positive staining, numbers of myelin sheaths and G-ratio in each group. Data are presented as mean ± SEM; n = 3 rats per group. NF-200 F(4, 10) = 9.77, *PNGF vs LV-AMPK = 0.015, *PNGF vs LV-LC3β = 0.030; MBP F(4, 10) = 12.23, *PNGF vs LV-AMPK = 0.020, *PNGF vs LV-LC3β = 0.017; myelin numbers F(4, 10) = 9.48, *PNGF vs LV-AMPK = 0.014, *PNGF vs LV-LC3β = 0.022; G-ratio F(4, 10) = 10.45, *PNGF vs LV-AMPK = 0.013, *PNGF vs LV-LC3β = 0.017. Significance was determined with the unpaired t-test with Welch's correction.
Inhibition of autophagic activation significantly inhibits NGF effects on myelin phagocytosis and nerve regeneration
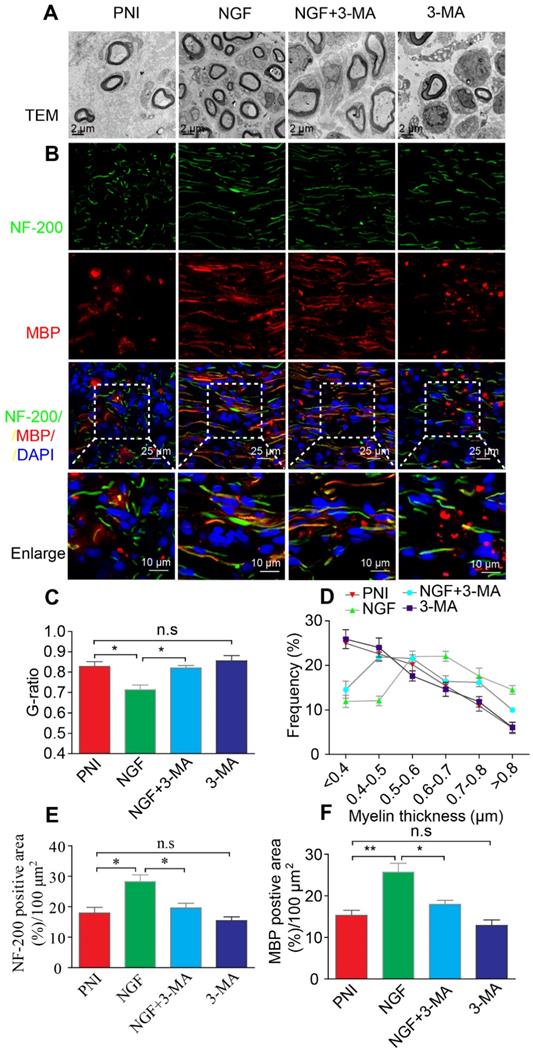
To further confirm that NGF acts through autophagy in SCs to enhance myelin breakdown and remyelination, we used a classical autophagy inhibitor, 3-MA to block NGF-induced autophagy [67]. Western blotting analysis confirmed that the pharmacologic inhibitor reduced the levels of ATG-7, ATG-5, and Beclin-1 and the LC3-II/I ratio dramatically, compared to animals treated with NGF alone (Figure 12A-E). Immunoblotting and immunostaining analyses of longitudinal sections of contusive sciatic nerves showed that administration of 3-MA to the NGF group, but not the PNI group, significantly delayed the myelin breakdown and suppressed residual myelin- related protein clearance (including MBP and MPZ, Figure 12F-G). Next, we tested the effects of 3-MA on the therapeutic response. Using TEM and immunofluorescence double staining, we found that inhibition of autophagy with 3-MA in the NGF group led to a notable reduction in the myelin sheath thickness and the number of regenerated axons. Nevertheless, no significant difference existed between the PNI and PNI+3-MA groups (Figure 13).
Autophagy inhibition delays myelin degradation. (A-E) Representative immunoblots and quantification of ATG-7, ATG-5, Beclin-1 and LC3 from sciatic nerves of the PNI, NGF, NGF+3-MA and 3-MA groups at 5 days post crush. Data are presented as the mean ± SEM; n = 3 independent experiments. ATG-7 F(3, 8) = 22.16, **PPNI vs NGF = 0.0076, *PNGF vs NGF+3-MA = 0.019; ATG-5 F(3, 8) = 46.66, **PPNI vs NGF = 0.0036, *PNGF vs NGF+3-MA = 0.027; Beclin-1 F(3, 8) = 18.80, **PPNI vs NGF = 0.0075, *PNGF vs NGF+3-MA = 0.038; LC3II/I F(3, 8) = 16.85, *PPNI vs NGF = 0.039, *PNGF vs NGF+3-MA = 0.012. (F, G) Representative micrographs showing double immunofluorescence with MPZ (green) and GFAP (red). Nuclei are stained with DAPI (blue) in each group. Quantitation of the MPZ positive area is also shown. Data are presented as the mean ± SEM; n = 3 rats per group. F(3, 8) = 13.37, **PPNI vs NGF = 0.0057, **PNGF vs NGF+3-MA = 0.0054, PPNI vs 3-MA = 0.39 (n.s). (H-J) MBP and MPZ protein levels and quantitative analysis. Data are presented as the mean ± SEM; n = 3 independent experiments. MBP F(3, 8) = 44.72, **PPNI vs NGF = 0.0074, **PNGF vs NGF+3-MA = 0.0056, PPNI vs 3-MA = 0.11 (n.s); MPZ F(3, 8) = 31.98, *PPNI vs NGF = 0.036, *PNGF vs NGF+3-MA = 0.012, PPNI vs 3-MA = 0.090 (n.s).
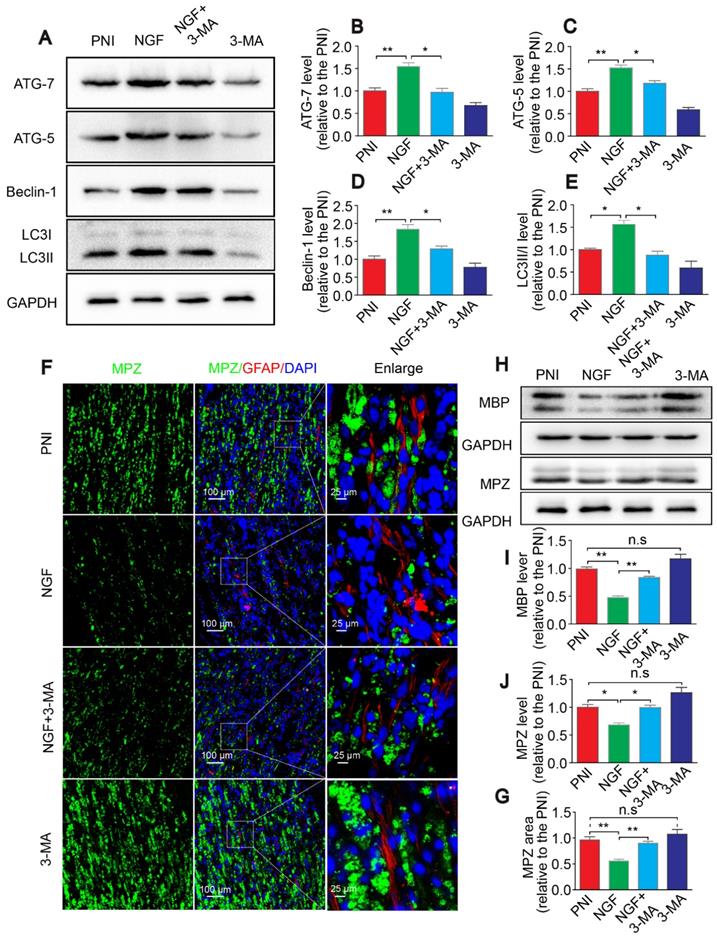
Autophagy inhibition suppresses nerve regeneration. (A, B) Electron micrographs and co-immunofluorescence of NF-200 (green) and MBP (red) analysis were performed in the four groups at 14 days after PNI. Nuclei are stained with DAPI (blue). (C-F) Statistical analysis of the G-ratio, distribution of myelin thickness, and NF-200 and MBP positive staining areas on the proximal nerve lesions in each group. Data are presented as the mean ± SEM; n = 3 rats per group. G-ratio F(3, 8) = 8.23, *PPNI vs NGF = 0.039, *PNGF vs NGF+3-MA = 0.040, PPNI vs 3-MA = 0.49 (n.s); NF-200 F(3, 8) = 10.17, *PPNI vs NGF = 0.042, *PNGF vs NGF+3-MA = 0.048, PPNI vs 3-MA = 0.35 (n.s); MBP F(3, 8) = 13.91, **PPNI vs NGF = 0.005, *PNGF vs NGF+3-MA = 0.039, PPNI vs 3-MA = 0.058 (n.s).
Additionally, we employed a lentiviral system to deliver shRNA-LC3β in vivo. As illustrated in Figure 10 and Figure 11, after injection with Lenti-LC3β-RNAi, the NGF-treated rats exhibited significant downregulation of autophagy levels and reduction of myelin clearance and nerve regrowth. Together, we thus conclude that NGF-induced autophagic activation served as a protective mechanism in myelin clearance and nerve regeneration.
NGF promotes myelin phagocytosis and clearance in primary Schwann cells
To confirm if NGF had a similar effect in phagocytosis myelin debris in primary SCs, we purchased highly pure (>98%) rat primary Schwann cells (SCs, Cat# EM1010) from Kerafast, Inc. (Boston, MA, USA). Per the supplier, these cells express S100, p75NTR (see https://www.kerafast.com/product/3171/rat-primary-schwann-cells), both are markers for Schwann cells. We also followed published protocols [65, 66] and purified peripheral nerve system (PNS) myelin debris. We conjugated the myelin preparations with pHrodo™ Red, succinimidyl ester (pHrodo, Thermo Fisher Scientific, P36600). The advantage of using pHrodo™ Red to label myelin debris is that pHrodo™ Red will only emit red fluorescent signals in acidic pH environments such as the cellular interior [65, 66]. Therefore, the pHrodo™ Red signals can be only detected by fluorescent microscopy following internalization of pHrodo™ Red-myelin debris into SCs. On the other hand, un-internalized pHrodo™ Red-myelin debris will not be seen under the microscope. This is the basis for our new experiments.
We performed the myelin phagocytosis assay according to the well-established methods by Ben Barres group [64]. Briefly, primary SCs were cultured in 6-well plates at the density of 1.00×10⁶ cells/well. The next day, cells in each well were rinsed once with phosphate buffer saline (PBS). For the control experiment, SCs were incubated with 1mL complete media supplemented with 10% Fetal Bovine Serum (FBS) and 800 μg mL-1 of pHrodo™ Red-myelin debris. For the NGF treatment group, NGF (final concentration: 50 ng mL-1) [63] was also added to the complete media containing pHrodo-conjugated myelin debris.
To define the effect of 3-MA in the decrease of myelin staining after feeding the myelin in SCs, we first used NGF (50 ng mL-1) to stimulate the uptake of pHrodo™ Red-myelin debris by SCs for 6 hrs. We then added 5 mM (final concentration) of 3-MA [67] (Aladdin, M129496) into the media to block autophagic activities.
The signals of internalized pHrodo™ Red-myelin debris i.e. red fluorescence in these primary SCs, were detected and captured by live cell imaging at an 1 hr interval for 24 hrs using a Nikon ECLIPSE Ti microscope (10× objective lens) (Nikon, Japan). For each sample, we took 5 images of ~from random areas of the 6 well plates and calculated the integrated fluorescence intensity using the ImageJ software. Representative live-cell images of SCs at 0 and 24 h were shown for the control (Figure 14A), NGF (Figure 14B) and NGF+3-MA groups (Figure 14C). An enlarged inset for each group was also show to demonstrated that the red fluorescent pHrodo™ Red-myelin debris were indeed inside of the primary SCs.
NGF enhances myelin phagocytosis in primary Schwann cells. (A-C) Cells were purchased and cultured as described in Materials and Methods. Cells were treated with either vehicle control (A), or 50 ng mL-1 NGF (B) or 50 ng mL-1 NGF for 6 hrs followed by the addition of 3-MA (C). Representative phase and fluorescent images of primary SCs at 0 h and 24 h for each condition are shown. An magnified inset for each treatment group is also presented to show the pHrodo-labeled myelin debris were inside of primary SCs. (D) The signals of integrated fluorescence intensity of internalized pHrodo-labeled myelin debris were measured and shown. n = 5 picture frames for each group per time point. Data are presented as mean ± SEM. T = 24 h F(2, 12) = 118.84, ***Pcontrol vs NGF < 0.001, ***PNGF vs NGF+3-MA < 0.001.
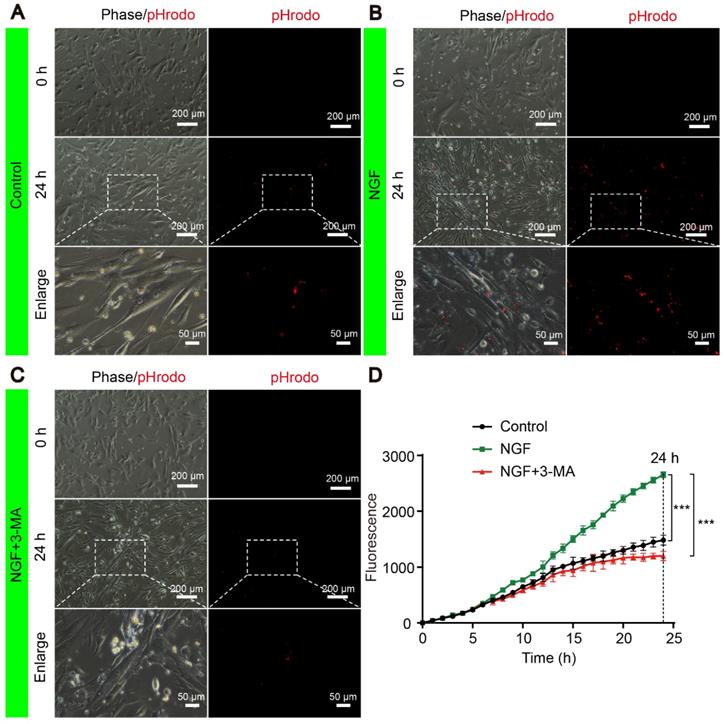
Quantification of integrated fluorescence intensity of internalized pHrodo™ Red-myelin debris from 0 to 24 hr in each group (Figure 14D) showed that: 1) the integrated fluorescence intensity in the control group showed a progressive increase; 2) NGF treatment significantly enhanced the uptake of pHrodo™ Red-myelin debris with their fluorescent intensity nearly doubling of that in the control group at 24 hr; 3) 3-MA treatment significantly suppressed the effect of NGF on enhancing uptake of pHrodo™ Red-myelin debris. Together with results obtained with RSC 96 cells, we conclude that NGF likely acts to increase the autophagic activities to facilitate the update of myelin debris in primary SCs, which in turn contributes to nerve regeneration.
Discussion
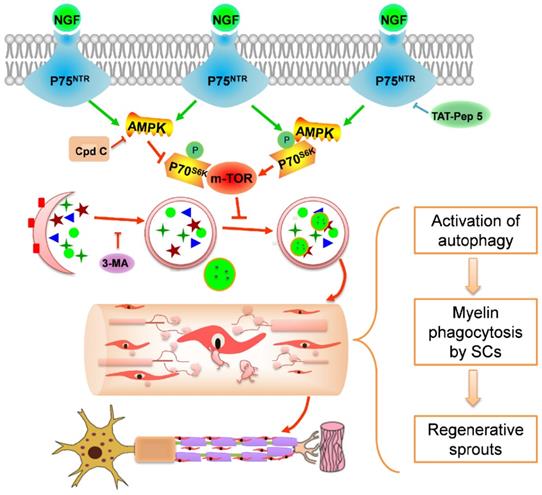
Using a rat PNI model, we investigated the effect of exogenous NGF in modulating myelin debris clearance during WD and examined its cellular and molecular mechanisms. As illustrated in schematic 1, the major findings of our study are: (1) administration of exogenous NGF accelerated the collapse of degenerative nerves and promoted myelin debris clearance during WD; (2) this effect was resulted from NGF-mediated autophagic enhancement and autophagic flux flows in SCs; and (3) NGF- activated autophagy in SCs at the early period of PNI was likely regulated by the p75NTR/AMPK/mTOR signaling pathways. Our study has thus provided a novel mechanistic insight into the robust effect of NGF in enhancing axonal regrowth and remyelination to facilitate the recovery of injured nerves.
Peripheral nerve regeneration is a physiological repair process that triggers a series of highly regulated cellular and molecular responses that govern axon elongation, remyelination and synaptic formation [96]. Myelin debris originates from damaged myelin breakdown. A bulk of myelin accumulation deteriorates the nerve regenerative microenvironment and impedes remyelination [97]. Thus, myelin removal is essential for nerve regeneration.
Potential molecular mechanism by which NGF regulates myelin clearance and axon regeneration following PNI. Exogenous NGF binds to the p75NTR in SC to activate the AMPK/mTOR signing pathway to enhance autophagy and drive autophagic flux. This dynamic regulation process in SCs promotes engulfing and degradation of myelin fragments, thus shortening the time of myelin remodeling and axon growth for injured peripheral nerve.
SCs, as a classical type of glial cells in the PNS, are capable of forming consecutive and multi-layered plasma membranes enwrapping large-caliber axons to reestablish the structure and function linkage between the distal nerve stump and its target organs [98]. Moreover, they also create a regenerative microenvironment suitable for nerve regeneration by secreting neurotrophic factors and removing myelin debris during WD [99]. Studies have pointed to that SCs-mediated myelin clearance through the entire process of WD provides an important pathway, guiding axon growth along the basal lamina tubes [100, 101]. Accordingly, improving the phagocytosis capability in SCs will be a key factor in facilitating the remyelination process.
NGF has been demonstrated to exert neuroprotective and neurotrophic effects in neural survival, development, function and peripheral nerve repair [69, 70]. However, it is unclear if the effect can be attributed to either NGF action on neurons or on SCs or on macrophage. To clarify this issue, we injected TrkA inhibitors (K252a, GW441756) or p75NTR inhibitor (TAT-Pep 5) in vivo. We found that inhibiting NGF/TrkA in neurons had no appreciable effect in NGF-mediated nerve recovery under our experimental settings (Figure S3 and Figure S4). In contrast, suppressing p75NTR activation in SCs delays axonal regrowth and remyelination (Figure 8 and Figure S3). Taken together, our results have suggested that NGF acts on p75NTR to promote nerve regeneration.
Even though our present study supports that NGF effects on SCs to expedite myelin clearance and nerve regeneration following PNI, Macrophages also play an important role in modulating their phagocytic ability in the lesion area by secreting neurotrophic factors, inflammatory cytokines and chemokines [97, 102, 103]. For example, macrophages secrets NGF, and NGF production by macrophages is enhanced by injury and inflammation [104, 105]. However, it is relatively less studied if macrophages express NGF receptors (p75NTR, TrkA). In a recent paper, Williams et al have demonstrated that human macrophages appeared to express both TrkA and p75NTR and NGF treatment increased membrane ruffling, calcium spiking, phagocytosis and growth factor secretion [106]. Our current study has suggested that macrophages play an important role in the early phase of myelin clearance that contributes importantly to axonal regeneration. However, it is unknown at present if and how NGF acts on macrophages to impact myelin clearance and nerve regeneration.
Based on our current study, we speculate that SCs-mediated removal of the myelin debris occurs during both the first phase (0-5 days) and second phase (5-14 days) of nerve injury, myelin clearance and regeneration. On the other hand, macrophages modulate their phagocytic ability and aggregate at the site of an injured region in the first phase of injury (0-5 days) and contribute to myelin debris clearance largely in the second phase (5-14 days post-injury). Therefore, blocking macrophages with inhibitors would not impact the early phase of myelin clearance as we have demonstrated herein. These notions are consistent with our macrophage inhibitor results that activity during the first phage would not affect myelin clearance since SCs are still able to perform these tasks. It is in the second phase that macrophages together with SCs contribute significantly to the clearance of myelin debris. This is consistent with a study showing that depletion of macrophages delayed myelin destruction and clearance following nerve injury [107]. We argue that exogenously administered NGF enhances the autophagic activity to increase the digestive capacity in SCs for speedy removal of myelin debris, as such, to facilitate nerve regeneration. Future studies will be needed to define the role SCs and macrophages each or combined in these processes.
Autophagy is a conserved lysosomal degradation pathway that eliminates damaged organelles and pathological proteins to maintain intracellular homeostasis [17]. Accumulating evidence suggests that myelin debris clearance is associated with autophagy [108, 109]. Inhibition of autophagy by genetic knockout or a pharmacological approach resulted in delayed myelin fragmentation clearance in injured peripheral nerves [26, 110]. Furthermore, enhancing autophagy may maintain microtubule stabilization, and promote peripheral nerve regeneration and functional recovery in the adult nervous system [24, 111]. Autophagy is also regarded as a regulatory mechanism for structural plasticity of SCs during postnatal life [25]. As such, we speculated that NGF promotion of myelin debris clearance is probably related to SC-medicated autophagic activation. This notion is supported by our results showing that NGF treatment enhanced the expression of autophagy-related proteins (including LC3, ATG-7, ATG-5 and Beclin-1) levels. Significantly, when autophagic inhibitor 3-MA blocked NGF-induced autophagic increase, myelin debris removal was retarded but never regeneration.
We further investigated the potential molecular mechanisms responsible for NGF regulation of SC autophagy during WD. AMPK and mTOR are two antagonistic regulators governing cellular autophagic dynamic homeostasis [51]. Autophagy is promoted by AMPK signaling activation [112]. Of particular note, AMPK coordinates with mTOR to regulate the homeostasis of autophagic-related neurodegenerative disorders [51, 113, 114]. For example, metformin activates autophagy to exert a neuroprotective effect in spinal cord injury and focal cerebral ischemia via regulation of the AMPK/mTOR signaling pathway [91, 115]. Our study has established that NGF acts on p75NTR to regulate AMPK/mTOR to enhance SC autophagy. We found that NGF increased p75NTR expression and AMPK phosphorylation. Moreover, suppressing p75NTR or AMPK activation by pharmacological or genetic methods attenuated the NGF-induced increase in autophagy in SCs, which further resulted in a delay of myelin clearance and nerve regeneration.
Ideally, our findings and conclusions herein will be further validated using the SC-specific atg7 KO mice. A recent study using the SC conditional knockout atg7 mice has demonstrated that nerve injury induced a transient but robust activation of the mTOR pathway, that was necessary for proper myelin clearance [116]. Interestingly, the authors have demonstrated that c-Jun activation in SCs is necessary for nerve injury and repair under their experimental settings [116]. Our results that NGF suppressed mTOR activation after nerve injury appear to be inconsistent with these findings and conclusions. There are a number of possible explanations: we found that NGF increased the expression of autophagic proteins including LC3, ATG-7, ATG-5 and Beclin-1, it is not clear if loss of atg7 alone can be compensated by the increase of other proteins such LC3, ATG-5 and Beclin-1; 2) NGF binds to p75NTR and activates small GTPases such as Rac [117] and CDC42 [118] to increase c-Jun as well. The Rac/CDC42 pathways to increase c-Jun are independent from mTOR. Therefore, it is likely that administration of NGF following nerve injury, as in our current study, suppressed mTOR while boosting c-Jun level in SCs. Together, these molecular events regulate myelination and plasticity to facilitate myelin clearance and nerve regeneration.
In summary, our study has provided evidence supporting that NGF acts through the p75NTR/AMPK/mTOR signaling pathways to increase autophagy in SCs to facilitate myelin clearance and nerve repair. Importantly, this signaling cascade-induced autophagy activation is closely associated with clearing myelin fragments during WD, which ultimately contribute to the recovery process of injured peripheral nerves (Schematic 1). Therefore, the connection between NGF and autophagy in SCs will serve as a novel therapeutic strategy for nerve repair and regeneration.
Abbreviations
WD, Wallerian degeneration; PNS, peripheral nervous system; SCs, Schwann cells; SC, Schwann cell; PNI, peripheral nerve injury; NGF, Nerve growth factor; TrkA, tyrosine kinase receptor A; p75NTR, the 75kD p75 neurotrophin receptor; AMPK, AMP-activated protein kinase; mTOR, mammalian target of rapamycin; p70s6k, p70 ribosomal S6 kinase; Cpd C, Compound C; 3-MA, 3-methyladenine; CQ, chloroquine; HE, Hematoxylin and eosin; DAPI, 4' 6-Diamidino-2-phenylindole-dihydrochlorid; OTC, cutting temperature compound; TEM, transmission electron microscopy; SEM, standard error of mean; LAMP1, lysosomal associated membrane protein 1; APs, autophagosomes; Masson, Masson's trichrome staining; LFB, Luxol fast blue; TB, toluidine blue; ORO, oil red O; IOD, the integrated option density; DRG, dorsal root ganglion.
Supplementary Material
Supplementary figures.
Acknowledgements
This study was partially supported by a research grant from the National Natural Science Funding of China (81722028, 81802238, 81870842, 81801245), Zhejiang Provincial Natural Science Foundation of China (WQ20H170001, LR18H50001, LQ18H090008).
Author Contributions
J.X., C.B.W. and R.L. conceived and designed the research work. R.L., D.H.L and S.N.Y. performed the experiments. R.L., J.X., C.B.W. and Y.Q.W. performed statistical analysis and wrote the paper. J.T., L.B.Y, L.X, Y.Y.L. and Y.Y. contributed to the discussion of the experimental design and interpretation of results. T. J., Y.Q.M, X.K.L, H.Y.Z, Y.Y.L. and J. W. provided reagents with experiments.
Competing Interests
The authors have declared that no competing interest exists.
References
1. Griffin JW, Hogan MV, Chhabra AB, Deal DN. Peripheral nerve repair and reconstruction. J Bone Joint Surg Am. 2013;95:2144-51
2. Forbes SJ, Rosenthal N. Preparing the ground for tissue regeneration: from mechanism to therapy. Nat Med. 2014;20:857-69
3. Zhao Y, Wang Y, Gong J, Yang L, Niu C, Ni X. et al. Chitosan degradation products facilitate peripheral nerve regeneration by improving macrophage-constructed microenvironments. Biomaterials. 2017;134:64-77
4. Simons M, Misgeld T, Kerschensteiner M. A unified cell biological perspective on axon-myelin injury. J Cell Biol. 2014;206:335-45
5. Beirowski B, Adalbert R, Wagner D, Grumme DS, Addicks K, Ribchester RR. et al. The progressive nature of Wallerian degeneration in wild-type and slow Wallerian degeneration (WldS) nerves. BMC Neurosci. 2005;6:1-27
6. Allodi I, Udina E, Navarro X. Specificity of peripheral nerve regeneration: interactions at the axon level. Prog Neurobiol. 2012;98:16-37
7. Jessen KR, Mirsky R, Lloyd AC. Schwann Cells: Development and Role in Nerve Repair. Cold Spring Harb Perspect Biol. 2015;7:1-15
8. Jung J, Cai W, Lee HK, Pellegatta M, Shin YK, Jang SY. et al. Actin polymerization is essential for myelin sheath fragmentation during Wallerian degeneration. J Neurosci. 2011;31:2009-15
9. Stoll G, Griffin JW, Li CY, Trapp BD. Wallerian degeneration in the peripheral nervous system: participation of both Schwann cells and macrophages in myelin degradation. J Neurocytol. 1989;18:671-83
10. Niemi JP, DeFrancesco-Lisowitz A, Roldan-Hernandez L, Lindborg JA, Mandell D, Zigmond RE. A critical role for macrophages near axotomized neuronal cell bodies in stimulating nerve regeneration. J Neurosci. 2013;33:16236-48
11. Perry VH, Tsao JW, Fearn S, Brown MC. Radiation-induced reductions in macrophage recruitment have only slight effects on myelin degeneration in sectioned peripheral nerves of mice. Eur J Neurosci. 1995;7:271-80
12. Wood MD, Mackinnon SE. Pathways regulating modality-specific axonal regeneration in peripheral nerve. Exp Neurol. 2015;265:171-75
13. Mizushima N, Komatsu M. Autophagy: renovation of cells and tissues. Cell. 2011;147:728-41
14. Nixon RA, Wegiel J, Kumar A, Yu WH, Peterhoff C, Cataldo A. et al. Extensive involvement of autophagy in Alzheimer disease: an immuno-electron microscopy study. J Neuropathol Exp Neurol. 2005;64:113-22
15. Lyndsay Murrow JD. Autophagy As A Stress Response And Quality Control Mechanism—Implications for Cell Injury and Human Disease. Annual Review of Pathology Mechanisms of Disease. 2013;8:105-37
16. Dodson M, Wani WY, Redmann M, Benavides GA, Johnson MS, Ouyang X. et al. Regulation of autophagy, mitochondrial dynamics, and cellular bioenergetics by 4-hydroxynonenal in primary neurons. Autophagy. 2017:1-13
17. Ravikumar B, Sarkar S, Davies JE, Futter M, Garcia-Arencibia M, Green-Thompson ZW. et al. Regulation of mammalian autophagy in physiology and pathophysiology. Physiol Rev. 2010;90:1383-435
18. Mizushima N, Levine B, Cuervo AM, Klionsky DJ. Autophagy fights disease through cellular self-digestion. Nature. 2008;451:1069-75
19. Ko PY, Yang CC, Kuo YL, Su FC, Hsu TI, Tu YK. et al. Schwann-cell autophagy, functional recovery, and scar reduction after peripheral nerve repair. J Mol Neurosci. 2018;64:601-10
20. Marinelli S, Nazio F, Tinari A, Ciarlo L, D'Amelio M, Pieroni L. et al. Schwann cell autophagy counteracts the onset and chronification of neuropathic pain. Pain. 2014;155:93-107
21. Kosacka J, Nowicki M, Bluher M, Baum P, Stockinger M, Toyka KV. et al. Increased autophagy in peripheral nerves may protect Wistar Ottawa Karlsburg W rats against neuropathy. Exp Neurol. 2013;250:125-35
22. Thumm M, Simons M. Myelinophagy: schwann cells dine in. J Cell Biol. 2015;210:9-10
23. Gomez-Sanchez JA, Carty L, Iruarrizaga-Lejarreta M, Palomo-Irigoyen M, Varela-Rey M, Griffith M. et al. Schwann cell autophagy, myelinophagy, initiates myelin clearance from injured nerves. J Cell Biol. 2015;210:153-68
24. Huang HC, Chen L, Zhang HX, Li SF, Liu P, Zhao TY. et al. Autophagy promotes peripheral nerve regeneration and motor recovery following sciatic nerve crush injury in rats. J Mol Neurosci. 2016;58:416-23
25. Jang SY, Shin YK, Park SY, Park JY, Rha SH, Kim JK. et al. Autophagy is involved in the reduction of myelinating Schwann cell cytoplasm during myelin maturation of the peripheral nerve. PLoS One. 2015;10:1-14
26. Jang SY, Shin YK, Park SY, Park JY, Lee HJ, Yoo YH. et al. Autophagic myelin destruction by Schwann cells during Wallerian degeneration and segmental demyelination. Glia. 2016;64:730-42
27. Lombardi L, Persiconi I, Gallo A, Hoogenraad CC, De Stefano ME. NGF-dependent axon growth and regeneration are altered in sympathetic neurons of dystrophic mdx mice. Mol Cell Neurosci. 2017;80:1-17
28. Chao MV. The p75 neurotrophin receptor. J Neurobiol. 1994;25:1373-85
29. Gage FH, Batchelor P, Chen KS, Chin D, Higgins GA, Koh S. et al. NGF receptor reexpression and NGF-mediated cholinergic neuronal hypertrophy in the damaged adult neostriatum. Neuron. 1989;2:1177-84
30. Hempstead BL, Martin-Zanca D, Kaplan DR, Parada LF, Chao MV. High-affinity NGF binding requires coexpression of the trk proto-oncogene and the low-affinity NGF receptor. Nature. 1991;350:678-83
31. Chao MV. Neurotrophins and their receptors: a convergence point for many signalling pathways. Nat Rev Neurosci. 2003;4:299-309
32. Levi-Montalcini R. The nerve growth factor: its mode of action on sensory and sympathetic nerve cells. Harvey Lect. 1966;60:217-59
33. Levi-Montalcini R. The nerve growth factor: its widening role and place in neurobiology. Adv Biochem Psychopharmacol. 1976;15:237-50
34. Levi-Montalcini R. The nerve growth factor 35 years later. Science. 1987;237:1154-62
35. Kemp SW, Webb AA, Dhaliwal S, Syed S, Walsh SK, Midha R. Dose and duration of nerve growth factor (NGF) administration determine the extent of behavioral recovery following peripheral nerve injury in the rat. Exp Neurol. 2011;229:460-70
36. Kemp SW, Walsh SK, Zochodne DW, Midha R. A novel method for establishing daily in vivo concentration gradients of soluble nerve growth factor (NGF). J Neurosci Methods. 2007;165:83-8
37. Plotkin JL, Wu C. Neurotrophin biology at NGF 2016: from fundamental science to clinical applications. Int J Dev Neurosci. 2017;56:27-34
38. Sofroniew MV, Howe CL, Mobley WC. Nerve growth factor signaling, neuroprotection, and neural repair. Annu Rev Neurosci. 2001;24:1217-81
39. Huang EJ, Reichardt LF. Neurotrophins: roles in neuronal development and function. Annu Rev Neurosci. 2001;24:677-736
40. Kaplan DR, Hempstead BL, Martin-Zanca D, Chao MV, Parada LF. The trk proto-oncogene product: a signal transducing receptor for nerve growth factor. Science. 1991;252:554-8
41. Levi-Montalcini R, Skaper SD, Dal Toso R, Petrelli L, Leon A. Nerve growth factor: from neurotrophin to neurokine. Trends Neurosci. 1996;19:514-20
42. Roux PP, Barker PA. Neurotrophin signaling through the p75 neurotrophin receptor. Prog Neurobiol. 2002;67:203-33
43. Tomita K, Kubo T, Matsuda K, Fujiwara T, Yano K, Winograd JM. et al. The neurotrophin receptor p75NTR in Schwann cells is implicated in remyelination and motor recovery after peripheral nerve injury. Glia. 2007;55:1199-208
44. Jia YX, Li JR, Mao CY, Yin WT, Jiang RH. Glycyrrhizin improves p75NTR-associated sciatic nerve regeneration in a BALB/c mouse model. Exp Ther Med. 2014;7:1141-6
45. Provenzano MJ, Xu N, Ver Meer MR, Clark JJ, Hansen MR. p75NTR and sortilin increase after facial nerve injury. Laryngoscope. 2010;118:87-93
46. Zhou XF, Li HY. Roles of glial p75NTR in axonal regeneration. J Neurosci Res. 2007;85:1601-5
47. Ebadi M, Bashir RM, Heidrick ML, Hamada FM, Refaey HE, Hamed A. et al. Neurotrophins and their receptors in nerve injury and repair. Neurochem Int. 1997;30:347-74
48. Ahmad I, Yue WY, Fernando A, Clark JJ, Woodson EA, Hansen MR. p75NTR is highly expressed in vestibular schwannomas and promotes cell survival by activating nuclear transcription factor κB. Glia. 2015;62:1699-712
49. Provenzano MJ, Minner SA, Zander K, Clark JJ, Kane CJ, Green SH. et al. p75(NTR) expression and nuclear localization of p75(NTR) intracellular domain in spiral ganglion Schwann cells following deafness correlate with cell proliferation. Mol Cell Neurosci. 2011;47:306-15
50. Nadeau JR, Wilson-Gerwing TD, Verge VM. Induction of a reactive state in perineuronal satellite glial cells akin to that produced by nerve injury is linked to the level of p75NTR expression in adult sensory neurons. Glia. 2014;62:763-77
51. Kim J, Kundu M, Viollet B, Guan KL. AMPK and mTOR regulate autophagy through direct phosphorylation of Ulk1. Nat Cell Biol. 2011;13:132-41
52. Shaw RJ. LKB1 and AMP-activated protein kinase control of mTOR signalling and growth. Acta Physiol. 2009;196:65-80
53. Tian ZK, Liu L, Chen DL, Wang P, Zhang JM, Tang Y. et al. Effect of miR-21 in promoting angiogenesis differentiation of umbilical cord blood mesenchymal stem cells in vitro. Shanghai Kou Qiang Yi Xue. 2017;26:471-5
54. Zhang H, Wu F, Kong X, Yang J, Chen H, Deng L. et al. Nerve growth factor improves functional recovery by inhibiting endoplasmic reticulum stress-induced neuronal apoptosis in rats with spinal cord injury. J Transl Med. 2014;12:130-45
55. McCullough LD, Zeng Z, Li H, Landree LE, McFadden J, Ronnett GV. Pharmacological inhibition of AMP-activated protein kinase provides neuroprotection in stroke. J Biol Chem. 2005;280:20493-502
56. Schwarze SR, Ho A, Vocero-Akbani A, Dowdy SF. In vivo protein transduction: delivery of a biologically active protein into the mouse. Science. 1999;285:1569-72
57. Zhang Q, Descamps O, Hart MJ, Poksay KS, Spilman P, Kane DJ. et al. Paradoxical effect of TrkA inhibition in Alzheimer's disease models. J Alzheimers Dis. 2014;40:605-17
58. Clark CG, Hasser EM, Kunze DL, Katz DM, Kline DD. Endogenous brain-derived neurotrophic factor in the nucleus tractus solitarius tonically regulates synaptic and autonomic function. J Neurosci. 2011;31:12318-29
59. Hsu MN, Liao HT, Truong VA, Huang KL, Yu FJ, Chen HH. et al. Crispr-based activation of endogenous neurotrophic genes in adipose stem cell sheets to stimulate peripheral nerve regeneration. Theranostics. 2019;9:6099-111
60. Ye LB, Yu XC, Xia QH, Yang Y, Chen DQ, Wu F. et al. Regulation of caveolin-1 and junction proteins by bFGF contributes to the integrity of blood-spinal cord barrier and functional recovery. Neurotherapeutics. 2016;13:844-58
61. Larocca JN, Norton WT. Isolation of myelin. Curr Protoc Cell Biol. 2007 Chapter 3: Unit3.25
62. Niu S, Zhang LK, Zhang L, Zhuang S, Zhan X, Chen WY. et al. Inhibition by multifunctional magnetic nanoparticles loaded with alpha-synuclein RNAi plasmid in a parkinson's disease model. Theranostics. 2017;7:344-56
63. Li R, Wu Y, Zou S, Wang X, Li Y, Xu K. et al. NGF attenuates high glucose-induced ER stress, preventing schwann cell apoptosis by activating the PI3K/Akt/GSK3beta and ERK1/2 pathways. Neurochem Res. 2017;42:3005-18
64. Brosius Lutz A, Chung WS, Sloan SA, Carson GA, Zhou L, Lovelett E. et al. Schwann cells use TAM receptor-mediated phagocytosis in addition to autophagy to clear myelin in a mouse model of nerve injury. Proc Natl Acad Sci U S A. 2017;114:E8072-E80
65. Liddelow SA, Guttenplan KA, Clarke LE, Bennett FC, Bohlen CJ, Schirmer L. et al. Neurotoxic reactive astrocytes are induced by activated microglia. Nature. 2017;541:481-7
66. Larocca JN, Norton WT. Isolation of myelin. Curr Protoc Cell Biol. 2007 Chapter 3: Unit3.25
67. Wu Y, Wang X, Guo H, Zhang B, Zhang XB, Shi ZJ. et al. Synthesis and screening of 3-MA derivatives for autophagy inhibitors. Autophagy. 2013;9:595-603
68. Rizzi C, Tiberi A, Giustizieri M, Marrone MC, Gobbo F, Carucci NM. et al. NGF steers microglia toward a neuroprotective phenotype. Glia. 2018;66:1395-416
69. Quarta S, Baeumer BE, Scherbakov N, Andratsch M, Rose-John S, Dechant G. et al. Peripheral nerve regeneration and NGF-dependent neurite outgrowth of adult sensory neurons converge on STAT3 phosphorylation downstream of neuropoietic cytokine receptor gp130. J Neurosci. 2014;34:13222-33
70. Thoenen H, Barde YA, Edgar D. The role of nerve growth factor (NGF) and related factors for the survival of peripheral neurons. Adv Biochem Psychopharmacol. 1981;28:263-73
71. Lane JT. The role of retinoids in the induction of nerve growth factor: a potential treatment for diabetic neuropathy. Transl Res. 2014;164:193-5
72. Tanaka Y, Niwa S, Dong M, Farkhondeh A, Wang L, Zhou R. et al. The molecular motor KIF1A transports the TrkA neurotrophin receptor and is essential for sensory neuron survival and function. Neuron. 2016;90:1215-29
73. Ohta M, Chosa N, Kyakumoto S, Yokota S, Okubo N, Nemoto A. et al. IL1beta and TNFalpha suppress TGFbeta promoted NGF expression in periodontal ligament derived fibroblasts through inactivation of TGFbeta induced Smad2/3 and p38 MAPK mediated signals. Int J Mol Med. 2018;42:1484-94
74. Yamashita T, Tohyama M. The p75 receptor acts as a displacement factor that releases Rho from Rho-GDI. Nat Neurosci. 2003;6:461-7
75. Perry VH, Tsao JW, Feam S, Brown MC. Radiation-induced reductions in macrophage recruitment have only slight effects on myelin degeneration in sectioned peripheral nerves of mice. Eur J Neurosci. 1995;7:271-80
76. Mehlem A, Hagberg CE, Muhl L, Eriksson U, Falkevall A. Imaging of neutral lipids by oil red O for analyzing the metabolic status in health and disease. Nat Protoc. 2013;8:1149-54
77. Ji Y, Shen M, Wang X, Zhang S, Yu S, Chen G. et al. Comparative proteomic analysis of primary schwann cells and a spontaneously immortalized schwann cell line RSC 96: a comprehensive overview with a focus on cell adhesion and migration related proteins. J Proteome Res. 2012;11:3186-98
78. Jesuraj NJ, Marquardt LM, Kwasa JA, Sakiyama-Elbert SE. Glial cell line-derived neurotrophic factor promotes increased phenotypic marker expression in femoral sensory and motor-derived Schwann cell cultures. Exp Neurol. 2014;257:10-8
79. Kraft C, Boya P, Codogno P, Elazar Z, Eskelinen EL, Farres J. et al. Driving next-generation autophagy researchers towards translation (DRIVE), an international PhD training program on autophagy. Autophagy. 2019;15:347-51
80. Jiang P, Mizushima N. LC3- and p62-based biochemical methods for the analysis of autophagy progression in mammalian cells. Methods. 2015;75:13-8
81. Yaka C, Bjork P, Schonberg T, Erlandsson A. A novel in vitro injury model based on microcontact printing demonstrates negative effects of hydrogen peroxide on axonal regeneration both in absence and presence of glia. J Neurotrauma. 2013;30:392-402
82. Valek L, Kanngiesser M, Haussler A, Agarwal N, Lillig CH, Tegeder I. Redoxins in peripheral neurons after sciatic nerve injury. Free Radic Biol Med. 2015;89:581-92
83. Tai H, Wang Z, Gong H, Han X, Zhou J, Wang X. et al. Autophagy impairment with lysosomal and mitochondrial dysfunction is an important characteristic of oxidative stress-induced senescence. Autophagy. 2017;13:99-113
84. Maulucci G, Chiarpotto M, Papi M, Samengo D, Pani G, De Spirito M. Quantitative analysis of autophagic flux by confocal pH-imaging of autophagic intermediates. Autophagy. 2015;11:1905-16
85. Jessen KR, Mirsky R. The origin and development of glial cells in peripheral nerves. Nat Rev Neurosci. 2005;6:671-82
86. Klionsky DJ, Abdelmohsen K, Abe A, Abedin MJ, Abeliovich H, Acevedo Arozena A. et al. Guidelines for the use and interpretation of assays for monitoring autophagy (3rd edition). Autophagy. 2016;12:1-222
87. Tanaka K, Zhang QL, Webster HD. Myelinated fiber regeneration after sciatic nerve crush: morphometric observations in young adult and aging mice and the effects of macrophage suppression and conditioning lesions. Exp Neurol. 1992;118:53-61
88. Taskinen HS, Roytta M. Cyclosporin A affects axons and macrophages during Wallerian degeneration. J Neurotrauma. 2000;17:431-40
89. Bothwell M. Functional interactions of neurotrophins and neurotrophin receptors. Annu Rev Neurosci. 1995;18:223-53
90. Zampieri N, Chao M. Structural biology. The p75 NGF receptor exposed. Science. 2004;304:833-4
91. Jiang T, Yu JT, Zhu XC, Wang HF, Tan MS, Cao L. et al. Acute metformin preconditioning confers neuroprotection against focal cerebral ischaemia by pre-activation of AMPK-dependent autophagy. Br J Pharmacol. 2014;171:3146-57
92. Matsui Y, Takagi H, Qu X, Abdellatif M, Sakoda H, Asano T. et al. Distinct roles of autophagy in the heart during ischemia and reperfusion: roles of AMP-activated protein kinase and Beclin 1 in mediating autophagy. Circ Res. 2007;100:914-22
93. Head BP, Patel HH, Niesman IR, Drummond JC, Roth DM, Patel PM. Inhibition of p75 neurotrophin receptor attenuates isoflurane-mediated neuronal apoptosis in the neonatal central nervous system. Anesthesiology. 2009;110:813-25
94. Shukla S, Shariat-Madar Z, Walker LA, Tekwani BL. Mechanism for neurotropic action of vorinostat, a pan histone deacetylase inhibitor. Mol Cell Neurosci. 2016;77:11-20
95. Xi G, Rosen CJ, Clemmons DR. IGF-I and IGFBP-2 stimulate AMPK activation and autophagy, which are required for osteoblast differentiation. Endocrinology. 2016;157:268-81
96. Namgung U. The role of Schwann cell-axon interaction in peripheral nerve regeneration. Cells Tissues Organs. 2014;200:6-12
97. Brosius LA, Chung WS, Sloan SA, Carson GA, Zhou L, Lovelett E. et al. Schwann cells use TAM receptor-mediated phagocytosis in addition to autophagy to clear myelin in a mouse model of nerve injury. Proc Natl Acad Sci U S A. 2017:114
98. Gumy LF, Tan CL, Fawcett JW. The role of local protein synthesis and degradation in axon regeneration. Exp Neurol. 2010;223:28-37
99. Gomezsanchez JA, Carty L, Iruarrizagalejarreta M, Palomoirigoyen M, Varelarey M, Griffith M. et al. Schwann cell autophagy, myelinophagy, initiates myelin clearance from injured nerves. Journal of Cell Biology. 2015;210:153-68
100. Perry VH, Tsao JW, Feam S, Brown MC. Radiation-induced Reductions in Macrophage Recruitment Have Only Slight Effects on Myelin Degeneration in Sectioned Peripheral Nerves of Mice. Eur J Neurosci. 1995;7:271-80
101. Jang SY, Yoon BA, Shin YK, Yun SH, Jo YR, Choi YY. et al. Schwann cell dedifferentiation-associated demyelination leads to exocytotic myelin clearance in inflammatory segmental demyelination. Glia. 2017;65:1848-62
102. Martini R, Fischer S, López-Vales R, David S. Interactions between schwann cells and macrophages in injury and inherited demyelinating disease. Glia. 2008;56:1566-77
103. Hirata K, Kawabuchi M. Myelin phagocytosis by macrophages and nonmacrophages during Wallerian degeneration. Microsc Res Tech. 2002;57:541-7
104. Takano S, Uchida K, Miyagi M, Inoue G, Fujimaki H, Aikawa J. et al. Nerve growth factor regulation by TNF-α and IL-1β in synovial macrophages and fibroblasts in osteoarthritic mice. J Immunol Res. 2016;2016:1-9
105. Takano S, Uchida K, Inoue G, Miyagi M, Aikawa J, Iwase D. et al. Nerve growth factor regulation and production by macrophages in osteoarthritic synovium. Clin Exp Immunol. 2017;190:235-43
106. Williams KS, Killebrew DA, Clary GP, Seawell JA, Meeker RB. Differential regulation of macrophage phenotype by mature and pro-nerve growth factor. J Neuroimmunol. 2015;285:76-93
107. Kubota A, Suzuki K. Effect of liposome-mediated macrophage depletion on Schwann cell proliferation during Wallerian degeneration. J Neurotrauma. 2000;17:789-98
108. Koch JC, Lingor P. The role of autophagy in axonal degeneration of the optic nerve. Exp Eye Res. 2016;144:81-9
109. Yue Z. Regulation of neuronal autophagy in axon: implication of autophagy in axonal function and dysfunction/degeneration. Autophagy. 2007;3:139-41
110. Komatsu M, Wang QJ, Holstein GR, Friedrich VL Jr, Iwata J, Kominami E. et al. Essential role for autophagy protein Atg7 in the maintenance of axonal homeostasis and the prevention of axonal degeneration. Proc Natl Acad Sci U S A. 2007;104:14489-94
111. He M, Ding Y, Chu C, Tang J, Xiao Q, Luo ZG. Autophagy induction stabilizes microtubules and promotes axon regeneration after spinal cord injury. Proc Natl Acad Sci U S A. 2016;113:11324-9
112. Mounier R, Lantier L, Leclerc J, Sotiropoulos A, Foretz M, Viollet B. Antagonistic control of muscle cell size by AMPK and mTORC1. Cell Cycle. 2011;10:2640-6
113. Shang L, Wang X. AMPK and mTOR coordinate the regulation of Ulk1 and mammalian autophagy initiation. Autophagy. 2011;7:924-6
114. Liang P, Le W. Role of autophagy in the pathogenesis of multiple sclerosis. Neurosci Bull. 2015;31:435-44
115. Zhang D, Xuan J, Zheng BB, Zhou YL, Lin Y, Wu YS. et al. Metformin Improves Functional Recovery After Spinal Cord Injury via Autophagy Flux Stimulation. Mol Neurobiol. 2017;54:3327-41
116. Norrmen C, Figlia G, Pfistner P, Pereira JA, Bachofner S, Suter U. mTORC1 Is Transiently Reactivated in Injured Nerves to Promote c-Jun Elevation and Schwann Cell Dedifferentiation. J Neurosci. 2018;38:4811-28
117. Harrington AW, Kim JY, Yoon SO. Activation of Rac GTPase by p75 is necessary for c-jun N-terminal kinase-mediated apoptosis. J Neurosci. 2002;22:156-66
118. Bazenet CE, Mota MA, Rubin LL. The small GTP-binding protein Cdc42 is required for nerve growth factor withdrawal-induced neuronal death. Proc Natl Acad Sci U S A. 1998;95:3984-9
Author contact
![]() Corresponding author: Jian Xiao, PhD, xfxj2000com
Corresponding author: Jian Xiao, PhD, xfxj2000com