Impact Factor
- Issue 14; 2026
- Issue 13; 2026
- Issue 12; 2026
- Issue 11; 2026
- Issue 10; 2026
- Volume 16; 2026
- Advance Articles
- Past Issues
- Cover Images
- Cover Suggestion
- Index & Coverage
- Special Issues
Introduction
Search strategy
Response evaluation of ICIs
18F-FDG-PET imaging
Imaging of immune checkpoints
PD-1:PD-L1 imaging with full...
PD-1:PD-L1 imaging with small...
Imaging of CTLA-4
Upcoming targets in checkpoint...
Imaging of T cells
Imaging of other immune...
Discussion
Abbreviations
Acknowledgements
References
International Journal of Biological Sciences
International Journal of Medical Sciences
 Global reach, higher impact

Theranostics 2020; 10(4):1708-1718. doi:10.7150/thno.38339 This issue Cite
Review
Molecular imaging biomarkers for immune checkpoint inhibitor therapy
Pim P van de Donk1, Laura Kist de Ruijter1, Marjolijn N Lub-de Hooge2,3, Adrienne H Brouwers3, Anthonie J van der Wekken4, Sjoukje F Oosting1, Rudolf SN Fehrmann1, Derk Jan A de Groot1, Elisabeth GE de Vries1 ![]()
1. Department of Medical Oncology, University Medical Center Groningen, University of Groningen, Groningen, Netherlands.
2. Department of Clinical Pharmacy and Pharmacology, University Medical Center Groningen, University of Groningen, Groningen, Netherlands.
3. Department of Nuclear Medicine and Molecular Imaging, University Medical Center Groningen, University of Groningen, Groningen, Netherlands.
4. Department of Pulmonary Medicine, University Medical Center Groningen, University of Groningen, Groningen, the Netherlands.
Received 2019-7-11; Accepted 2019-8-28; Published 2020-1-1
Abstract

Immune checkpoint inhibitors (ICIs) have substantially changed the field of oncology over the past few years. ICIs offer an alternative treatment strategy by exploiting the patients' immune system, resulting in a T cell mediated anti-tumor response. These therapies are effective in multiple different tumor types. Unfortunately, a substantial group of patients do not respond to ICIs. Molecular imaging, using single-photon emission computed tomography (SPECT) and positron emission tomography (PET), can provide non-invasive whole-body visualization of tumor and immune cell characteristics and might support patient selection or response evaluations for ICI therapies. In this review, recent studies with 18F-fluorodeoxyglucose-PET imaging, imaging of immune checkpoints and imaging of immune cells will be discussed. These studies are until now mainly exploratory, but the first results suggest that molecular imaging biomarkers could have a role in the evaluation of ICI therapy.
Keywords: molecular imaging, biomarkers, positron emitting tomography, immune checkpoint inhibitor, immunotherapy.
Introduction
Since the approval of ipilimumab by the Food and Drug Administration (FDA) and European Medicines Agency (EMA) in 2011, immune checkpoint inhibitors (ICIs) have substantially changed the field of oncology. Monoclonal antibody (mAb) based therapies targeting cytotoxic T-lymphocyte antigen 4 (CTLA-4), programmed cell death 1 (PD-1) or programmed cell death ligand 1 (PD-L1) have improved patient survival across various tumor types (1-8). ICI therapies target the ability of cancer cells to evade the patient's immune system through disruption of inhibitory ligand-receptor interactions. This allows effector T cells to recognize and eradicate tumor cells. Currently, seven ICIs have been approved for clinical use by the FDA and EMA. These are the anti-CTLA-4 antibody ipilimumab, the anti-PD1 antibodies nivolumab, pembrolizumab and cemiplimab, and the anti-PD-L1 antibodies atezolizumab, avelumab and durvalumab. These antibodies are currently used to treat multiple tumor types including: melanoma, hepatocellular carcinoma, small-cell lung cancer, non-small-cell lung carcinoma (NSCLC), renal cell carcinoma, urothelial carcinoma, Hodgkin lymphoma, head and neck squamous cell carcinoma (HNSCC), Merkel cell carcinoma, gastric cancer, primary mediastinal large B-cell lymphoma and cervical cancer. Moreover, the FDA approved pembrolizumab and nivolumab as tumor agnostic therapy for patients with microsatellite instability-high (MSI-H) or deficient DNA mismatch repair (dMMR) tumors. This list of indications has been steadily growing as research progresses.
Despite this progress, a substantial group of patients does not respond to ICI therapy. A cross-sectional analysis of US patients with cancer eligible for ICI therapy for registered indications estimated a response rate of 12.46% in 2018 (9). This unfortunately means that even for registered indications, only a minority of patients gain long term survival benefit from ICI therapy. Even though ICIs are generally well tolerated, they can cause immune-related adverse events (irAE). Higher response rates have been reported when ICIs are combined, but this coincides with an increase and different kinetics of irAEs (10, 11). Therefore, there is a need for reliable predictive biomarkers to either select patients at baseline for ICI therapy or to evaluate treatment efficacy early during therapy. Identifying which patients will benefit from these therapies would greatly improve patient care. Several biomarkers have been studied for ICI therapy. Currently, PD-L1 expression measured using immunohistochemistry (IHC) and MSI-H and dMMR status measurement by IHC and polymerase-chain-reaction based assays are the only approved biomarkers for ICI therapy. However, the assay for PD-L1 expression is hampered by multiple variables involved in tumor tissue analyses, such as: sampling errors, spatial heterogeneity or temporal heterogeneity of tumor characteristics (12-14).
Molecular imaging with single-photon emission computed tomography (SPECT) and positron emission tomography (PET), using specific radiopharmaceuticals, might potentially circumvent some of these issues. These techniques allow for non-invasive whole-body visualization of tumor and immune cell characteristics. Uptake of molecular imaging tracers can be quantified, and these measurements permit the technique to generate biomarkers. Since tumor characteristics, such as PD-L1 expression or tumor infiltrating lymphocyte numbers, can change over time, serial scans might provide information about dynamics of these aspects (13, 15).
Extensive research is being conducted to study the feasibility of molecular imaging biomarkers for ICI therapy. Regarding biomarkers, we adhere in this review to the terminology and definitions as posed by the FDA-NIH Biomarker Working Group and O'Connor et al. (16, 17). An imaging biomarker is defined as “a spatially delineated biomarker derived from measurements made on an image” (16). Quantification of tracer uptake, expressed as standardized uptake values (SUV), and anatomical imaging measurements can both serve as a biomarker. In this review, recent advances in the development of molecular imaging biomarkers for ICI therapies with the focus on molecular imaging approaches in clinical development will be discussed.
Search strategy
PubMed was searched for relevant publications. Articles were selected when they were: published in peer reviewed journals, written in English and were available in full text. ClinicalTrials.gov was queried for relevant clinical trials investigating molecular imaging approaches for ICI therapies. The 2019 conference abstracts of the American Society of Clinical Oncology (ASCO) and the American Association of Cancer Research (AACR) were searched for relevant new developments. These databases were searched up to May 2019. The following key words were used in the literature search: molecular, imaging, immunotherapy, checkpoint, inhibitor, immune, positron emitting tomography OR PET, single-photon emission computed tomography OR SPECT, programmed cell death protein 1 OR PD-1, programmed death-ligand 1 OR PD-L1, cytotoxic T-lymphocyte-associated protein 4 OR CTLA-4, lymphocyte, tumor, cancer, CD8, CD4, CD3. Specific search terms for isotopes included (zirconium OR Zr-89 OR 89Zr), (copper OR cu-64 OR 64Cu), (fluorine OR F-18 OR 18F), (gallium OR Ga-68 OR 68Ga), (iodine OR I-124 OR 124I), (yttrium OR y-86 OR 86y), (carbon OR c-11 OR 11C), (technetium OR Tc-99m OR 99mTc).
Response evaluation of ICIs
Currently, the Response Evaluation Criteria in Solid Tumors (RECIST) version 1.1, for which the criteria were validated on a data warehouse, are used to determine response to chemotherapeutic drugs. These criteria are based on anatomical imaging measures (18). However, ICI therapy can result in temporary pseudo-progression. Therefore, the RECIST working group developed a guideline for data collection with a modified version of RECIST v1.1 for immune based therapeutics termed iRECIST (19). The major change being that in case of progression, while the patient's condition is not deteriorating, the progression has to be confirmed a few weeks later to prove progressive disease during ICI. The data, collected using these guidelines, will be used to define the iRECIST criteria, once sufficient studies have been analyzed.
18F-FDG-PET imaging
The 18F-fluorodeoxyglucose (18F-FDG)-PET scan, which visualizes increased cell metabolism with 18F-radiolabeled glucose-like FDG in tumors and sites of inflammation, is the most frequently used type of PET scan in oncology. It is mainly used for staging of patients with cancer. 18F-FDG-PET is included in RECIST v1.1, but only to confirm progressive disease when indicated. Right now, not enough data is available to validate 18F-FDG-PET response criteria by the RECIST committee on a data warehouse. Several groups are exploring the use of 18F-FDG-PET scans for predicting response to ICI therapy (Table 1). Twelve studies, totaling 468 patients, evaluated the 18F-FDG-PET in patients with melanoma, NSCLC and Hodgkin's lymphoma (20-31). In these studies, metabolic responses are defined as a decrease in SUV in the tumor. The results do suggest an association between metabolic responses and clinical outcomes. However, multiple criteria were applied for 18F-FDG-PET response evaluations, such as the EORTC criteria, PERCIST, PERCIMT, PECRIT and iPERCIST (24, 26, 29, 32, 33). Moreover, 18F-FDG-PET imaging was performed at different time points after starting ICI therapy, making comparisons difficult. For 18F-FDG-PET, to obtain a potential role for tumor response measurement during ICI therapy, standardized and harmonized procedures and analyses should be applied. Generating comparable data would allow for further analyses to define the role of 18F-FDG-PET in ICI therapies. Such a thorough analysis will be critical as changes in glucose metabolism can be caused by various cell types in the tumor microenvironment, including tumor cells, immune cells or stromal cells.
Studies with 18FDG-PET for tumor response evaluation of checkpoint inhibitor therapy
| Treatment | Tumor type | Number of patients | Response criteria | Imaging time points | Summary of findings | Reference |
|---|---|---|---|---|---|---|
| Ipilimumab | Melanoma | 22 | EORTC | 18F-FDG-PET scan at baseline, after 2 cycles and after 4 cycles ipilimumab | 18F-FDG-PET/CT after 2 treatment cycles is predictive of final treatment outcome in patients with progressive and stable disease | (20) |
| Pembrolizumab or nivolumab | Melanoma | 27 | Qualitative visual analysis | 18F-FDG-PET scan on treatment (median after 15.2 months) | Negative 18F-FDG-PET scans may hold negative predictive value for disease progression | (21) |
| Ipilimumab | Melanoma | 31 | Fractal and multifractal analysis | 18F-FDG-PET scan at baseline, and after 2 and 4 cycles ipilimumab | In 20 out of 24 cases (83.3 %), results of the fractal and multifractal analysis were consistent with treatment outcome data | (22) |
| Ipilimumab, nivolumab or BMS-936559 (anti-PD-L1 antibody) | Melanoma | 20 | RECIST 1.1 and PERCIST | 18F-FDG-PET/CT at 4 weeks and at 4 months | 18F-FDG-PET/CT scans predict response with 100% sensitivity, 93% specificity and 95% accuracy | (23) |
| Nivolumab | NSCLC | 24 | RECIST 1.1 versus PERCIST | 18F-FDG-PET scan at baseline and at 1 month | Metabolic response (especially total lesion glycolysis) at 1 month is associated with response to nivolumab and survival | (24) |
| Checkpoint inhibitor | NSCLC | 27 | Semi-quantitative analysis (SUVmax and SUVmean) | 18F-FDG-PET scan at baseline | SUVmax ≤17.1 (sensitivity 88.9%) or a SUVmean ≤8.3 (sensitivity 100%) identifies fast progression after 8 weeks therapy | (25) |
| Ipilimumab | Melanoma | 41 | PERCIMT | Baseline and after 4 cycles ipilimumab | Four new 18F-FDG-avid lesions after 4 cycles ipilimumab is an indication of nonresponse | (26) |
| Ipilimumab | Melanoma | 41 | PERCIMT versus EORTC | Baseline and after 2 cycles ipilimumab | PERCIMT more sensitive predictor of clinical response to ipilimumab than EORTC criteria | (27) |
| Nivolumab or pembrolizumab as monotherapy or plus ipilimumab | Melanoma | 104 | RECIST and EORTC | Baseline and after 1 year | After 1 year of therapy, 68% patients with a partial response on CT scan had a complete metabolic response on 18F-FDG PET scan | (28) |
| Nivolumab | NSCLC | 28 | iPERCIST versus iRECIST | Baseline, after 2 months, and when warranted after 3 months | Comparison of iPERCIST to iRECIST showed reclassification of 39% of patients with relevant additional prognostic information | (29) |
| Nivolumab or pembrolizumab | Hodgkin lymphoma | 43 | Visual evaluation according to Deauville score and Lugano criteria | Baseline, after 8 weeks and after 17 weeks | No differences compared to the LYRIC criteria. Metabolic activity could be related to immune response as early as 8 weeks after start of treatment | (30) |
| Ipilimumab | Melanoma | 60 | PERCIST | Baseline and after completing ipilimumab treatment | Tumor response according to PERCIST associated with OS. This association improved when using modified response criteria (imPERCIST) | (31) |
Abbreviations: EORTC: European Organization for Research and Treatment of Cancer; iPERCIST: immune PET Response Criteria in Solid Tumors; iRECIST: immune Response Evaluation Criteria in Solid Tumors; OS: overall survival; PERCIMT: PET Response Evaluation Criteria for Immunotherapy; PERCIST: PET Response Criteria in Solid Tumors; RECIST: Response Evaluation Criteria in Solid Tumors; SUV: standardized uptake value.
Imaging of immune checkpoints
PD-1:PD-L1 axis
The PD-1 receptor is expressed by immune cells, mainly by activated T cells (34). It functions as an immune checkpoint. Binding to its ligand, PD-L1, results in inhibition of T cell activation. PD-L1 is expressed by various other immune cells, including dendritic cells, T cells and non-lymphoid parenchymal tissue cells (35). PD-L1 expression is upregulated upon cytokine release induced by T cell activation and an inflammatory environment. The PD-1:PD-L1 immune checkpoint is involved in maintaining immunological tolerance, and thus reducing auto-immunity and healthy tissue damage. Tumor cells expressing PD-L1, escape destruction by the immune system. Patients with high PD-L1 expressing tumors, determined by IHC, tend to show better overall survival (OS) when treated with ICI compared to those with PD-L1 negative lesions. However, patients without PD-L1 tumor expression can respond to therapy (36-38). PD-L1 expression by tumor cells is dynamic and can be upregulated by ICI therapy and by inflammatory cytokines, such as interferon gamma (34, 39). Furthermore, tumor biopsies do not take into account the spatial heterogeneity of PD-L1 target expression, which can highly differ within and across metastases within one patient (15, 40-47).
PD-1:PD-L1 imaging with full antibodies
Full mAbs are large proteins, generally around 150 kDa. Their weight and structure causes slow tissue distribution after intravenous administration and prevents filtration by the kidneys, resulting in an elimination half-life around 18-21 days (48). For imaging purposes, optimal PET imaging with full mAb tracers requires several days to allow the antibody to accumulate at the target location. Acquisition of the optimal PET images generally takes place 4-7 days after tracer injection.
Two clinical studies have been published in which therapeutic anti-PD1 or anti-PD-L1 mAbs have been radiolabeled for PET imaging of the PD-1:PD-L1 checkpoint. This approach can provide information about their tumor penetration and target engagement. One trial was performed with 10 mg of the PD-L1 antibody atezolizumab radiolabeled with zirconium-89 (89Zr) and PET imaging on days 4 and 7 in patients with NSCLC, cancer of the urinary tract, and triple negative breast cancer prior to atezolizumab treatment (figure 1) (49). 89Zr-atezolizumab tumor uptake was positively associated with a response rate to atezolizumab treatment. Moreover, the geometric mean uptake of 89Zr-atezolizumab above or below median correlated to progression free survival (PFS) and OS. For individual lesions, higher 89Zr-atezolizumab tracer uptake is associated with tumor size reduction over time. In contrast, PD-L1 expression in tumor biopsies, obtained 7 days after tracer injection and immediately after the last PET scan, did not correlate with response to therapy. Tracer uptake was also seen in lymphoid tissues such as normal lymph nodes, tonsils and the spleen. Since PD-1:PD-L1 inhibitors induce a systemic immune response with effects throughout the body, tracer uptake measured with PET in normal tissues might also serve as a proxy for evaluation of activation of the immune system. Uptake of the tracer was also seen in sites of inflammation, including a sinusitis and a knee bursitis. Another study reported high 89Zr-atezolizumab uptake in a mouse bearing a tumor graft model of a patient with metastatic clear cell renal cell carcinoma. This patient later appeared to have a durable response to nivolumab treatment (50).
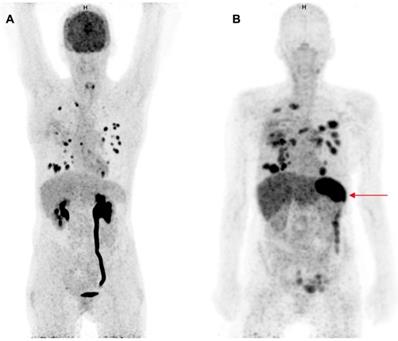
Comparison of 18F-FDG-PET and 89Zr-atezolizumab-PET imaging. Maximum intensity projections of 18F-FDG-PET, 1 h after tracer injection (A) and 89Zr-atezolizumab-PET, 7 days after tracer injection (B) of a 53 year old woman diagnosed with NSCLC. Both imaging modalities show uptake in multiple intra-pulmonary metastases. The 18F-FDG-PET scan shows physiological high uptake in the brain and excretion via the kidneys. At the moment of this scan the patient had a post-renal obstruction due to a kidney stone. The 89Zr-atezolizumab-PET scan shows high uptake in the spleen (red arrow). The 18F-FDG-PET scan was performed 46 days prior to the 89Zr-atezolizumab-PET scan. Both scans were scaled equally (0-8).
In another study a PD-1 antibody, namely 2 mg nivolumab was radiolabeled with 89Zr and PET imaging was performed 7 days after tracer injection in 13 patients with NSCLC prior to nivolumab treatment (51). Uptake of 89Zr-nivolumab was analyzed for 21 tumor lesions: uptake was higher in the 7 lesions that showed a reduction in size of ≥30% at 12 weeks after start with nivolumab treatment. 89Zr-nivolumab uptake correlated with PD-1 expression by tumor-infiltrating immune cells assessed by IHC, in fresh baseline tumor biopsies or archival tissue. Also, spleen tracer uptake was seen with a SUV of 5.8, which is much lower than the spleen uptake seen with 89Zr-atezolizumab (49). In the 89Zr-nivolumab study, five out of 13 patients responded to the therapy: the study provides a rationale for evaluation of 89Zr-nivolumab in a larger cohort to evaluate its potential as a tool for response prediction.
All currently approved PD-1:PD-L1 targeting antibodies have been radiolabeled with 89Zr (49, 51-54). This radionuclide with radioactive half-life (78.4 hours) suits the long half-life of the antibodies and their tendency to slowly distribute in the body. Radiolabeled tracers of registered anti-PD-L1 mAbs, such as 89Zr-avelumab (NCT03514719), 89Zr-durvalumab (NCT03610061, NCT03829007) and 89Zr-atezolizumab (NCT02453984, NCT03850028) are currently investigated in clinical trials. Most of these studies perform PET imaging prior to ICI therapy to evaluate tracer uptake in the tumor lesions as a predictive biomarker. Another multicenter trial in patients with thoracic malignancies recently started with 89Zr-labeled REGN3504, a non-registered anti-PD-L1 antibody (NCT03746704). 89Zr-atezolizumab PET imaging is also performed serially during atezolizumab therapy to evaluate tumor saturation by atezolizumab (NCT02453984).
Two trials with the PD-1 antibody 89Zr-pembrolizumab are ongoing (NCT02760225, NCT03065764), both performing PET imaging before starting ICI therapy.
PD-1:PD-L1 imaging with small molecules and antibody fragments
Smaller molecules have been engineered for imaging of PD-1 and PD-L1 (55-57). These agents are in general not designed to induce a therapeutic effect, but to enable early imaging. An exception is the PET tracer 89Zr-KN035 (55). KN035, a 79.6 kDa domain antibody targeting PD-L1, is evaluated in several clinical trials for its therapeutic potential. The 89Zr-labeled domain antibody is studied to evaluate the biodistribution and lesion uptake of the tracer in patients with PD-L1 positive advanced solid tumors (NCT03638804).
In the above-mentioned clinical trial with 89Zr-nivolumab (51), they also studied a radiolabeled anti-PD-L1 adnectin (18F-BMS-986192) with a molecular weight around 10 kDa (58, 59). Fluorine-18 (18F) with a radioactive half-life of 110 minutes resembles the elimination half-life of small molecules like adnectins. PET acquisition was performed 60 minutes after 18F-BMS-986192 injection. 18F-BMS-986192 uptake was higher in the three patients with PD-L1 expression of ≥50% determined by IHC. However, higher tracer uptake did not correlate with response to nivolumab treatment in this small cohort.
A single domain antibody (sdAb) NM-01 with a molecular weight of ~15 kDa, which binds human PD-L1 was labeled with technetium-99m (99mTc) for SPECT imaging in patients with NSCLC prior to anti-PD-L1 antibody treatment (59). In an early analysis of the first 16 patients, the tracer showed heterogeneous tumor uptake between patients, between metastases and within tumors. No data is reported on correlation with uptake of the tracer and outcome of therapy. Besides uptake in the spleen and bone marrow, the authors do not report on specific uptake of this PD-L1 tracer in other normal lymphoid tissues. The trial is ongoing and aims to recruit 50 patients (NCT02978196).
Compared to the full antibodies agents 89Zr-atezolizumab (49) and 89Zr-nivolumab (51), clearance of 99mTc-NM-01 is faster, resulting in mean tumor:bloodpool ratios of 1.79 (1.24-2.3) at 1 hour after injection and 2.33 (1.24-3.53) at 2 hours after injection. 89Zr-atezoluzimab PET showed the highest tumor:bloodpool ratio around 5.0 on day 7. Overall, 89Zr-atezolizumab uptake in tumors had geometric mean SUVmax 10.4. Imaging of 89Zr-nivolumab at 7 days after tracer injection yielded a mean SUVpeak of 6.4 in responding lesions versus 3.9 in non-responding lesions; uptake of 18F-BMS986192 1 hour after injection showed similar uptake values. However, no information about contrast to background tissue and bloodpool are provided, making it difficult to interpret the imaging results and uptake values of the tracers.
The peptide WL12 (14-amino acid circular peptide), engineered to bind PD-L1 with high affinity, was radiolabeled with copper-64 (64Cu) to allow for PET imaging (60). Although only tested in mouse models, WL12 shows the potential for imaging with small molecules. The binding interface of WL12 to PD-L1 overlaps with that of its natural receptor PD-1 and all registered PD-L1 antibodies. Therefore, the authors suggest that it may be used to evaluate unoccupied PD-L1, providing information on drug-target engagement for prediction of ICI therapy efficacy. Performance of the tracer in mouse models did indeed demonstrate reduction of 64Cu-WL12 uptake in tumors after atezolizumab treatment. This outcome was consistent in tumors with different expression levels of PD-L1, and dose and time dependent changes could be quantified. Analyses of tissue penetration of a mAb may be of interest. In a study with 89Zr-trastuzumab, a mAb against human epithelial growth factor 2 (HER2), 29% of the patients with tumors expressing HER2 expression by IHC showed no uptake of 89Zr-trastuzumab in their tumors (61). Apparently, penetration of a drug into tumor tissue does not solely rely on target presence. An ongoing 89Zr-atezolizumab study (NCT02453984) addresses this issue by repeating imaging during atezolizumab treatment. Head-to-head comparisons of the imaging performance of mAbs versus smaller PD-L1 binding moieties are still lacking.
Reported results on quantification of tracer uptake differ between all reported tracers targeting the PD-1:PD-L1 axis. Overall, 89Zr-atezolizumab showed the highest SUV in tumor tissue compared to the other clinically evaluated tracers 89Zr-nivolumab, 18F-BMS986192 and 99mTc-NM-01.
Imaging of CTLA-4
Ipilimumab, which blocks checkpoint molecule CTLA-4, was the first ICI in the clinic in 2011. CTLA-4 is expressed by activated T cells and regulatory T cells (Tregs); expression levels are upregulated after binding of the T cell receptor with antigen on antigen presenting cells (34). Ligands for CTLA-4 are B7-1 and B7-2 on antigen presenting cells, for which CTLA-4 competes with the stimulatory molecule CD28 on T cells. Engagement of the ligands with CTLA-4 causes an inhibitory signal for T cell activation, due to its competition with CD28 and prevention of ligand binding to CD28.
Currently one clinical trial (NCT03313323) is investigating CTLA-4 imaging with 89Zr-ipilimumab as a predictive biomarker for ipilimumab therapy. 89Zr-ipilimumab uptake is quantified upfront and early during treatment with ipilimumab, with the idea that patients who do not benefit from ipilimumab treatment may have lower levels of the drug in tumor tissues.
In immunocompetent mice, an anti-mouse 64Cu-DOTA-anti-CTLA-4 mAb was used to visualize CTLA-4 levels in tissues (62). The mouse tumor cell line expressed little CTLA-4, but when growth was induced, these tumors showed high tracer uptake on the 64Cu-DOTA-anti-CTLA-4 PET scan, which correlated with higher influx of tumor infiltrating lymphocytes. In contrast, little uptake of the tracer was seen in tumors in immunodeficient mice.
In another study CTLA-4 PET imaging was performed in a humanized mouse model (63). 64Cu-NOTA-ipilimumab and 64Cu-NOTA-ipilimumab-F(ab')2, a full antibody and an antibody fragment, localized CTLA-4+ engrafted human peripheral blood lymphocytes. These preclinical results suggest that it is feasible to perform PET imaging with anti-CTLA-4 tracers to visualize CTLA-4.
Upcoming targets in checkpoint inhibition
As developments proceed, more checkpoint molecules are becoming subject of research, including lymphocyte activation gene 3 (LAG-3), T-cell immunoglobulin and mucin-domain containing-3 (TIM3), T cell immunoreceptor with Ig and ITIM domains (TIGIT) and V-domain Ig suppressor of T cell activation (VISTA) (34, 64, 65). Currently, anti-LAG-3 antibodies are most extensively studied, with 50 ongoing trials registered at ClinicalTrials.gov. LAG-3, a checkpoint molecule that is upregulated on activated T cells, is considered to be a marker for T cell exhaustion. LAG-3 binds to major histocompatibility complex-II (MHC-II), thus preventing binding of the T cell receptor to MHC-II (66). LAG-3 PET imaging has been performed in mice. 89Zr-REGN3767 visualized LAG-3 expressing intratumoral T cells after co-implantation with human lymphoma cells and human peripheral blood mononuclear cells (67). 89Zr-LAG-3 PET is currently studied in patients with NSCLC and HNSCC prior to anti-LAG-3 therapy (NCT03780725).
Not only inhibitory immune checkpoints are being investigated. Costimulatory checkpoint molecules, such as OX40 (CD134), inducible T cell costimulator (ICOS, CD278), glucocorticoid-induced TNFR-related protein (GITR), 4-1BB (CD137), CD40 and CD27 have been identified as potential therapeutic targets. For OX40 (68) and CD40 (69), radiotracers targeting these cell surface proteins have been developed.
Imaging of T cells
Immunotherapy can potentiate the T cell mediated immune response against tumor cells. Therefore, molecular imaging of T cells has great potential for the evaluation of new and current therapies. Visualizing T cells might allow us to evaluate the anti-tumor immune response early and could potentially support adaptations of the treatment regimen.
As the immune checkpoint molecules CTLA-4, PD-1 and PD-L1 are present on T cells, imaging with tracers targeting the checkpoint interactions generates information on presence, activation and migration of T cells. Moreover, imaging of T cells can also be performed with tracers against T cell specific targets, independent of checkpoint molecules. Cluster of differentiation 8 positive (CD8+) T cells are generally considered to be the main effector cells involved in the immune response against tumor cells. Several tracers have been developed to visualize CD8+ T cells. Radiolabeled antibody constructs can detect changes in tumor infiltrating lymphocytes following ICI therapy in mice (70-73). Two CD8 PET tracers are studied clinically: a phase I trial using a zirconium labeled mini-body construct (⁸⁹Zr-Df-IAB22M2C) has been completed (NCT03107663) and is now evaluated in a phase II trial (NCT03802123). The preliminary results of the phase I trial showed no tracer related adverse effects, cytokine release syndrome or blood test abnormalities. The anti-CD8 tracer accumulated in CD8-rich tissues, such as the spleen, bone marrow and lymph nodes. Tracer uptake by the tumor was variable and seen in 10 of the 15 patients (74). Another zirconium labeled anti-CD8 imaging agent ZED88082A is currently studied in patients that receive ICIs (NCT04029181).
Another approach is the use of radiolabeled interleukin-2 (IL2) for lymphocyte imaging. The high affinity IL2 receptor, which consists of three subdomains (CD25, CD122 and CD132) is highly expressed by several lymphocyte subtypes, such as Tregs and activated T cells. The low affinity IL2 receptor, which consists of two subdomains (CD122 and CD132) is found on naive T cells, memory T cells and natural killer cells (75). A first proof of concept study was performed in five patients with metastatic melanoma using 99mTc labeled interleukin-2 (99mTc-IL2) (76). Patients were scanned at baseline and 12 weeks after starting treatment. In two out of three patients that underwent an on-treatment 99mTc-IL2 PET scan, a lower total SUVmax was seen in the tumor lesions after treatment, while one patient had an increase in total SUVmax. A 18F labeled IL2 tracer is being evaluated in melanoma patients (NCT02922283). Patients are scanned at baseline and during ICI therapy to determine whether changes in tumor tracer uptake correlate with response to ICI therapy.
18F labeled 9-β-d-arabinofuranosylguanine ([18F]F-AraG) is also investigated as a PET tracer for T cell imaging in cancer patients. [18F]F-AraG is a positron-emitting guanosine analog that selectively accumulates in T cells. [18F]F-AraG can be phosphorylated by cytoplasmic deoxycytidine kinase and deoxyguanosine kinase and is subsequently trapped intracellularly (77, 78). This tracer is evaluated in stage I-IIIa NSCLC patients receiving neoadjuvant pembrolizumab with or without radiotherapy (NCT03311672). A single [18F]F-AraG PET scan is performed after 2 cycles pembrolizumab. Results will be compared to CD3+ T cell numbers present in the resection specimens.
It is a challenge for T cell imaging to determine the optimal imaging time point to capture the T cell influx, as the time it takes to detect major T cell accumulation in the tumor microenvironment following ICI therapy is not yet precisely known. Lymphocyte activation, proliferation and functional differentiation can occur in a matter of days following viral infection (79). Whether this also applies for ICI therapy in cancer is unknown. T cell influx early during treatment has been investigated by obtaining early on-treatment biopsy samples and by studying resection specimen in neoadjuvant ICI therapy studies after treatment (Table 2). This data suggests that an increase in T cell numbers already occurs within a few weeks after the start of treatment (80-86). T cell imaging in this timeframe could provide a non-invasive way to visualize T cell dynamics after only one or two doses of ICI therapy.
Changes in tumor infiltrating lymphocytes following ICI therapy in serial tumor tissues measured immunohistochemically
| Setting | Treatment | Tumor type | Number of patients | Sampling time points | Summary of findings | Reference |
|---|---|---|---|---|---|---|
| Neoadjuvant | 2 cycles nivolumab 3 mg/kg body weight | NSCLC | 21 | Baseline and tumor resection after 4 weeks | Major pathological response in 45% of resected tumors | (80) |
| Neoadjuvant | 2 cycles ipilimumab + nivolumab | Melanoma | 10 | Baseline and tumor resection after 6 weeks | Pathological response in 70% of biopsies | (81) |
| Neoadjuvant | 1 cycle pembrolizumab | Melanoma | 27 | Baseline and tumor resection after 3 weeks | Complete or major pathologic response in 30% of patients. Increase in CD8 positive T cell numbers compared to pre-treatment biopsy | (82) |
| On-treatment biopsy | CTLA-4 blockade and/or PD-1 blockade | Melanoma | 53 | Baseline and early on treatment (after 2-3 doses) | Increase in CD8+ T cells | (83) |
| On-treatment biopsy | Pembrolizumab | Melanoma | 46 | - Baseline - 20-60 days - 80-120 days - 120 days | Increase in CD8 T cell density (cells/mm2) in responders. Stable CD8 numbers in non-responders | (84) |
| On-treatment biopsy | Pembrolizumab | Melanoma | 53 | Baseline and on treatment (median 74 days) | Increase in T cell frequency. Increase in CD8+ effector memory T cells in responders. No changes in Treg frequencies | (85) |
| On-treatment biopsy | Anti-PD1 therapy | Melanoma | 13 | Baseline and early on treatment (14 days) | Significant expansion of CD8+ cells early during treatment. Higher CD8 T cell numbers were seen in responders | (86) |
Abbreviations: CD8: cluster of differentiation 8; CTLA-4: cytotoxic T lymphocyte antigen 4; NSCLC: non-small-cell lung carcinoma; PD-1, programmed cell death 1; Treg: regulatory T cell.
Another challenge for T cell imaging is the complexity of the human immune system, which consists, among others, of many lymphocyte subgroups which play different roles in the immune response. Some of these subgroups are pro-inflammatory or effector cells. Other subgroups, such as Tregs are anti-inflammatory and have been associated with worse OS and resistance to therapy (87, 88). Unfortunately, the abovementioned PET-tracers do not specifically target one uniform subgroup of T cells. The targets of these tracers can be expressed by both effector T cells as well as anti-inflammatory T cell subsets. At the same time, these tracers do not visualize all effector- or anti-inflammatory T cell subsets. For example, a tracer directed against CD8 only shows the CD8-mediated immune response. However, multiple different effector T cells have been implicated to play a role in the anti-tumor immune response. Some natural killer cells and γδ T cells do not express CD8 and therefore this part of the anti-tumor immune response might be overlooked during CD8 imaging (89, 90).
Imaging of other immune components of the tumor microenvironment
Understandably, most effort is focused on imaging of effector T cells to monitor the efficacy of immunotherapies. However, imaging of other immune cells might also offer valuable information regarding the dynamic tumor microenvironment. Besides effector immune cells, there are several immune cell types present in the tumor microenvironment, such as Tregs, tumor associated macrophages (TAMs) and myeloid-derived suppressor cells (MDSCs) (91). These cells play a key role in preserving the immunosuppressive state of the tumor microenvironment. To better understand the underlying mechanisms of resistance to ICI therapies, these cells types are of interest. Furthermore, a small subset of patients experiences early tumor progression after starting ICI therapy (92, 93). It is hypothesized that mechanisms associated with resistance to ICI therapy could be involved in hyperprogressive disease (93). This might be due to a shift towards a more immunosuppressive tumor microenvironment by proliferation or modulation of immunosuppressive cells, such as Tregs, M2 TAMs or MDSCs (94-96). Visualizing these immunosuppressive cells might be useful to distinguish pseudo-progression from hyperprogressive disease.
At this moment, no Treg specific molecular imaging tracers are available. However, there are tracers that target both Tregs as well as other immune cell subgroups. Tregs are generally characterized as CD4+ CD25+ FoxP3+ T cells. Radiolabeled anti-CD4 antibody constructs have been developed and are currently investigated for future application in the clinic (97, 98). Furthermore, Tregs constitutively express high levels of the IL2 receptor (75). Therefore, IL2 imaging might have a potential role in Treg imaging. Future studies will have to determine whether these tracers are effective at imaging Tregs and whether this holds any diagnostic value for visualizing resistance to therapy or the evaluation of tumor progression. Multiple PET and SPECT tracers have been developed for imaging of macrophages (99, 100). These tracers are already being studied in diseases such as auto-immune diseases, atherosclerosis and cancer. However, imaging of macrophages has not yet been investigated for ICI therapies. MDSC imaging has been performed using 99mTc‐anti‐CD11b SPECT imaging in a murine colon tumor model. Tracer uptake was seen in the tumor, spleen and bone marrow (101).
Not only immune cells can be visualized using molecular imaging. Cytokines also play an important role in the dynamics of the tumor microenvironment. Transforming growth factor beta (TGF-β) causes exclusion of T cells from the tumor microenvironment. This is associated with poor prognosis in cancer, and resistance to PD-L1 and PD-1 inhibitors. (102, 103). Currently, several trials are conducted with TGF-β inhibitors, some in combination with ICI, as preclinical findings have shown an increase in effector T cells in the tumor (103). PET imaging of TGF-β with the 89Zr-labeled antibody fresolimumab in patients with recurrent glioblastoma showed high tracer uptake in the tumor. This tumor type is known for high expression of TGF-β and its receptors (104). 89Zr-fresolimumab or other tracers visualizing TGF-β may enlighten resistance mechanisms to ICI therapy.
Discussion
The developments in ICI therapies have resulted in remarkable tumor responses and improvements in patient survival. An effective immune response induced by ICI therapy is the result of an interplay between the antibody targeting checkpoint molecules, the tumor cells, and the patient's immune system. Molecular imaging has the potential to provide measurable imaging biomarkers that may predict effects of these therapies. Furthermore, radiolabeling of therapeutic mAbs informs researchers about the pharmacokinetic properties of these drugs.
Translating preclinical findings from animal tumor models to clinical results is challenging. A realistic representation of a human immunological response requires not only a human(-ized) tumor model with a human target, i.e. with expression of human PD-L1, but also human variants of all the co-players attributing to an effective cancer immune response (105). Moreover, most preclinical mouse studies are done in mice aged 6-8 weeks, whereas patients usually develop cancer at an older age. This could be relevant as the immune system and lymphoid system are subject to change as people get older (106).
The clinical studies discussed in this review are exploratory studies and provide only a glimpse of the tracer's potential value. The major challenge lying ahead is implementing these imaging approaches in patient care. This requires harmonization of procedures and proper validation in larger cohorts. Data sharing and collaboration will truly benefit this process and reduce costs (107). However, it is a challenge worth facing as the approaches discussed in this review show great potential to provide insight in the ICI mediated anti-tumor immune response.
Abbreviations
[18F]F-AraG: 18F labeled 9-β-d-arabinofuranosylguanine; 18F: Fluorine-18; 18F-FDG: 18F-fluorodeoxyglucose; 64Cu: copper-64; 89Zr: zirconium-89; 99mTc: technetium-99m; CD: Cluster of differentiation; CTLA-4: cytotoxic T-lymphocyte antigen 4; dMMR: deficient DNA mismatch repair; EMA: European Medicines Agency; FDA: Food and Drug Administration; HER2: human epithelial growth factor 2; HNSCC: head and neck squamous cell carcinoma; ICI: immune checkpoint inhibitor; IHC: immunohistochemistry; IL2: interleukin-2; irAE: immune-related adverse event; LAG-3: lymphocyte activation gene 3; mAb: monoclonal antibody; MDSC: myeloid-derived suppressor cell; MHC-II: major histocompatibility complex-II; MSI-H: microsatellite instability-high; NSCLC: non-small-cell lung carcinoma; OS: Overall survival; PD-1: programmed cell death 1; PD-L1: programmed cell death ligand 1; PD-L2: programmed cell death ligand 2; PET: positron emission tomography; PFS: progression free survival; RECIST: Response evaluation criteria in solid tumors; SPECT: single-photon emission computed tomography; SUV: standardized uptake value; TAM: tumor associated macrophage; TGF-β: transforming growth factor beta; TIGIT: T-cell immunoreceptor with Ig and ITIM domains; TIM3: T-cell immunoglobulin and mucin-domain containing-3; Tregs: regulatory T cells; VISTA: V-domain Ig suppressor of T cell activation.
Acknowledgements
Supported by the Dutch Cancer Society grant POINTING (number 10034).
Competing Interests
E.G.E. de Vries reports institutional financial support for her advisory role from Daiichi Sankyo, Merck, NSABP, Pfizer, Sanofi, Synthon and for clinical trials or contracted research from Amgen, AstraZeneca, Bayer, Chugai Pharma, CytomX Therapeutics, G1 Therapeutics, Genentech, Nordic Nanovector, Radius Health, Roche, Synthon. S.F. Oosting reports institutional financial support for clinical trials or contracted research from Celldex, Pfizer, Novartis, Bristol Myers Squibb, Kura Oncology, MedImmune, Roche, Merck Sharp & Dohme. A.J. van der Wekken reports institutional financial support for his advisory role from Pfizer, Boehringer-Ingelheim, Roche (diagnostics), Astra Zeneca and institutional financial support for clinical trials from AstraZeneca. All remaining authors have declared no conflicts of interest.
References
1. Overman MJ, McDermott R, Leach JL, Lonardi S, Lenz HJ, Morse MA. et al. Nivolumab in patients with metastatic DNA mismatch repair-deficient or microsatellite instability-high colorectal cancer (CheckMate 142): an open-label, multicentre, phase 2 study. Lancet Oncol. 2017;18:1182-91
2. Ferris RL, Blumenschein G Jr, Fayette J, Guigay J, Colevas AD, Licitra L. et al. Nivolumab for recurrent squamous-cell carcinoma of the head and neck. N Engl J Med. 2016;375:1856-67
3. Motzer RJ, Escudier B, McDermott DF, George S, Hammers HJ, Srinivas S. et al. Nivolumab versus everolimus in advanced renal-cell carcinoma. N Engl J Med. 2015;373:1803-13
4. Ansell SM, Lesokhin AM, Borrello I, Halwani A, Scott EC, Gutierrez M. et al. PD-1 blockade with nivolumab in relapsed or refractory Hodgkin's lymphoma. N Engl J Med. 2015;372:311-9
5. Polk A, Svane IM, Andersson M, Nielsen D. Checkpoint inhibitors in breast cancer - Current status. Cancer Treat Rev. 2018;63:122-34
6. Larkin J, Chiarion-Sileni V, Gonzalez R, Grob JJ, Cowey CL, Lao CD. et al. Combined nivolumab and ipilimumab or monotherapy in untreated melanoma. N Engl J Med. 2015;373:23-34
7. Garon EB, Rizvi NA, Hui R, Leighl N, Balmanoukian AS, Eder JP. et al. Pembrolizumab for the treatment of non-small-cell lung cancer. N Engl J Med. 2015;372:2018-28
8. Borghaei H, Paz-Ares L, Horn L, Spigel DR, Steins M, Ready NE. et al. Nivolumab versus docetaxel in advanced nonsquamous non-small-cell lung cancer. N Engl J Med. 2015;373:1627-39
9. Haslam A, Prasad V. Estimation of the percentage of US patients with cancer who are eligible for and respond to checkpoint inhibitor immunotherapy drugs. JAMA Netw Open. 2019;2:e192535
10. Martins F, Sofiya L, Sykiotis GP, Lamine F, Maillard M, Fraga M. et al. Adverse effects of immune-checkpoint inhibitors: epidemiology, management and surveillance. Nat Rev Clin Oncol. 2019 May 15. doi: 10.1038/s41571-019-0218-0
11. Zhang B, Wu Q, Zhou YL, Guo X, Ge J, Fu J. Immune-related adverse events from combination immunotherapy in cancer patients: A comprehensive meta-analysis of randomized controlled trials. Int Immunopharmacol. 2018;63:292-8
12. Rehman JA, Han G, Carvajal-Hausdorf DE, Wasserman BE, Pelekanou V, Mani NL. et al. Quantitative and pathologist-read comparison of the heterogeneity of programmed death-ligand 1 (PD-L1) expression in non-small cell lung cancer. Mod Pathol. 2017;30:340-9
13. McLaughlin J, Han G, Schalper KA, Carvajal-Hausdorf D, Pelekanou V, Rehman J. et al. Quantitative assessment of the heterogeneity of PD-L1 expression in non-small-cell lung cancer. JAMA Oncol. 2016;2:46-54
14. Mansfield AS, Murphy SJ, Peikert T, Yi ES, Vasmatzis G, Wigle DA. et al. Heterogeneity of programmed cell death ligand 1 expression in multifocal lung cancer. Clin Cancer Res. 2016;22:2177-82
15. Mansfield AS, Aubry MC, Moser JC, Harrington SM, Dronca RS, Park SS. et al. Temporal and spatial discordance of programmed cell death-ligand 1 expression and lymphocyte tumor infiltration between paired primary lesions and brain metastases in lung cancer. Ann Oncol. 2016;27:1953-8
16. O'Connor JP, Aboagye EO, Adams JE, Aerts HJ, Barrington SF, Beer AJ. et al. Imaging biomarker roadmap for cancer studies. Nat Rev Clin Oncol. 2017;14:169-86
17. BEST (Biomarkers, EndpointS, other Tools) Resource [Internet]. FDA-NIH Biomarker Working Group. Silver Spring (MD): Food and Drug Administration (US). 2016 https://www.ncbi.nlm.nih.gov/books/NBK326791/
18. Eisenhauer EA, Therasse P, Bogaerts J, Schwartz LH, Sargent D, Ford R. et al. New response evaluation criteria in solid tumours: revised RECIST guideline (version 1.1). Eur J Cancer. 2009;45:228-47
19. Seymour L, Bogaerts J, Perrone A, Ford R, Schwartz LH, Mandrekar S. et al. iRECIST: guidelines for response criteria for use in trials testing immunotherapeutics. Lancet Oncol. 2017;18(3):e143-e52
20. Sachpekidis C, Larribere L, Pan L, Haberkorn U, Dimitrakopoulou-Strauss A, Hassel JC. Predictive value of early 18F-FDG PET/CT studies for treatment response evaluation to ipilimumab in metastatic melanoma: preliminary results of an ongoing study. Eur J Nucl Med Mol Imaging. 2015;42(3):386-96
21. Kong BY, Menzies AM, Saunders CA, Liniker E, Ramanujam S, Guminski A. et al. Residual FDG-PET metabolic activity in metastatic melanoma patients with prolonged response to anti-PD-1 therapy. Pigment Cell Melanoma Res. 2016;29(5):572-7
22. Breki CM, Dimitrakopoulou-Strauss A, Hassel J, Theoharis T, Sachpekidis C, Pan L. et al. Fractal and multifractal analysis of PET/CT images of metastatic melanoma before and after treatment with ipilimumab. EJNMMI Res. 2016;6(1):61
23. Cho SY, Lipson EJ, Im HJ, Rowe SP, Gonzalez EM, Blackford A. et al. Prediction of response to immune checkpoint inhibitor therapy using early-time-point 18F-FDG PET/CT imaging in patients with advanced melanoma. J Nucl Med. 2017;58(9):1421-8
24. Kaira K, Higuchi T, Naruse I, Arisaka Y, Tokue A, Altan B. et al. Metabolic activity by 18F-FDG-PET/CT is predictive of early response after nivolumab in previously treated NSCLC. Eur J Nucl Med Mol Imaging. 2018;45(1):56-66
25. Grizzi F, Castello A, Lopci E. Is it time to change our vision of tumor metabolism prior to immunotherapy? Eur J Nucl Med Mol Imaging. 2018;45(6):1072-5
26. Anwar H, Sachpekidis C, Winkler J, Kopp-Schneider A, Haberkorn U, Hassel JC. et al. Absolute number of new lesions on 18F-FDG PET/CT is more predictive of clinical response than SUV changes in metastatic melanoma patients receiving ipilimumab. Eur J Nucl Med Mol Imaging. 2018;45(3):376-83
27. Sachpekidis C, Anwar H, Winkler J, Kopp-Schneider A, Larribere L, Haberkorn U. et al. The role of interim 18F-FDG PET/CT in prediction of response to ipilimumab treatment in metastatic melanoma. Eur J Nucl Med Mol Imaging. 2018;45(8):1289-96
28. Tan AC, Emmett L, Lo S, Liu V, Kapoor R, Carlino MS. et al. FDG-PET response and outcome from anti-PD-1 therapy in metastatic melanoma. Ann Oncol. 2018;29(10):2115-20
29. Goldfarb L, Duchemann B, Chouahnia K, Zelek L, Soussan M. Monitoring anti-PD-1-based immunotherapy in non-small cell lung cancer with FDG PET: introduction of iPERCIST. EJNMMI Res. 2019;9(1):8
30. Castello A, Grizzi F, Qehajaj D, Rahal D, Lutman F, Lopci E. 18F-FDG PET/CT for response assessment in Hodgkin lymphoma undergoing immunotherapy with checkpoint inhibitors. Leuk Lymphoma. 2019;60(2):367-75
31. Ito K, Teng R, Schoder H, Humm JL, Ni A, Michaud L. et al. 18F-FDG PET/CT for monitoring of ipilimumab therapy in patients with metastatic melanoma. J Nucl Med. 2019;60(3):335-41
32. Wahl RL, Jacene H, Kasamon Y, Lodge MA. From RECIST to PERCIST: Evolving considerations for PET response criteria in solid tumors. J Nucl Med. 2009;50(Suppl 1):122S-50S
33. Young H, Baum R, Cremerius U, Herholz K, Hoekstra O, Lammertsma AA. et al. Measurement of clinical and subclinical tumour response using [18F]-fluorodeoxyglucose and positron emission tomography: review and 1999 EORTC recommendations. European Organization for Research and Treatment of Cancer (EORTC) PET Study Group. Eur J Cancer. 1999;35(13):1773-82
34. Wei SC, Duffy CR, Allison JP. Fundamental mechanisms of immune checkpoint blockade therapy. Cancer Discov. 2018;8:1069-86
35. Keir ME, Liang SC, Guleria I, Latchman YE, Qipo A, Albacker LA. et al. Tissue expression of PD-L1 mediates peripheral T cell tolerance. J Exp Med. 2006;203:883-95
36. Khunger M, Hernandez AV, Pasupuleti V, Rakshit S, Pennell NA, Stevenson J. et al. Programmed cell death 1 (PD-1) ligand (PD-L1) expression in solid tumors as a predictive biomarker of benefit from PD-1/PD-L1 axis inhibitors: A systematic review and meta-analysis. JCO Precis Oncol. Published online May 18. 2017
37. Weng YM, Peng M, Hu MX, Yao Y, Song QB. Clinical and molecular characteristics associated with the efficacy of PD-1/PD-L1 inhibitors for solid tumors: a meta-analysis. Onco Targets Ther. 2018;11:7529-42
38. Havel JJ, Chowell D, Chan TA. The evolving landscape of biomarkers for checkpoint inhibitor immunotherapy. Nat Rev Cancer. 2019;19:133-50
39. Vilain RE, Menzies AM, Wilmott JS, Kakavand H, Madore J, Guminski A. et al. Dynamic changes in PD-L1 expression and immune infiltrates early during treatment predict response to PD-1 blockade in melanoma. Clin Cancer Res. 2017;23:5024-33
40. Terra S, Mansfield AS, Dong H, Peikert T, Roden AC. Temporal and spatial heterogeneity of programmed cell death 1-ligand 1 expression in malignant mesothelioma. Oncoimmunology. 2017;6:e1356146
41. Wang HB, Yao H, Li CS, Liang LX, Zhang Y, Chen YX. et al. Rise of PD-L1 expression during metastasis of colorectal cancer: Implications for immunotherapy. J Dig Dis. 2017;18:574-81
42. Uruga H, Bozkurtlar E, Huynh TG, Muzikansky A, Goto Y, Gomez-Caraballo M. et al. Programmed cell death ligand (PD-L1) expression in stage II and III lung adenocarcinomas and nodal metastases. J Thorac Oncol. 2017;12:458-66
43. Gandini S, Massi D, Mandala M. PD-L1 expression in cancer patients receiving anti PD-1/PD-L1 antibodies: A systematic review and meta-analysis. Crit Rev Oncol Hematol. 2016;100:88-98
44. Callea M, Albiges L, Gupta M, Cheng SC, Genega EM, Fay AP. et al. Differential expression of PD-L1 between primary and metastatic sites in clear-cell renal cell carcinoma. Cancer Immunol Res. 2015;3:1158-64
45. Madore J, Vilain RE, Menzies AM, Kakavand H, Wilmott JS, Hyman J. et al. PD-L1 expression in melanoma shows marked heterogeneity within and between patients: implications for anti-PD-1/PD-L1 clinical trials. Pigment Cell Melanoma Res. 2015;28:245-53
46. Jimenez-Sanchez A, Memon D, Pourpe S, Veeraraghavan H, Li Y, Vargas HA. et al. Heterogeneous tumor-immune microenvironments among differentially growing metastases in an ovarian cancer patient. Cell. 2017;170:927-38 e20
47. Munari E, Zamboni G, Lunardi G, Marconi M, Sommaggio M, Brunelli M. et al. PD-L1 expression comparison between primary and relapsed non-small cell lung carcinoma using whole sections and clone SP263. Oncotarget. 2018;9:30465-71
48. Ryman JT, Meibohm B. Pharmacokinetics of monoclonal antibodies. CPT Pharmacometrics Syst Pharmacol. 2017;6:576-88
49. Bensch F, van der Veen EL, Lub-de Hooge MN, Jorritsma-Smit A, Boellaard R, Kok IC. et al. 89Zr-atezolizumab imaging as a non-invasive approach to assess clinical response to PD-L1 blockade in cancer. Nat Med. 2018;24:1852-8
50. Vento J, Mulgaonkar A, Woolford L, Nham K, Christie A, Bagrodia A. et al. PD-L1 detection using 89Zr-atezolizumab immuno-PET in renal cell carcinoma tumorgrafts from a patient with favorable nivolumab response. J Immunother Cancer. 2019;7:144
51. Niemeijer AN, Leung D, Huisman MC, Bahce I, Hoekstra OS, van Dongen G. et al. Whole body PD-1 and PD-L1 positron emission tomography in patients with non-small-cell lung cancer. Nat Commun. 2018;9:4664
52. England CG, Ehlerding EB, Hernandez R, Rekoske BT, Graves SA, Sun H. et al. Preclinical pharmacokinetics and biodistribution studies of 89Zr-labeled pembrolizumab. J Nucl Med. 2017;58(1):162-8
53. Ehlerding EB, Lee HJ, Barnhart TE, Jiang D, Kang L, McNeel DG. et al. Noninvasive imaging and quantification of radiotherapy-induced PD-L1 upregulation with 89Zr-Df-atezolizumab. Bioconjug Chem. 2019;30(5):1434-41
54. Jagoda EM, Vasalatiy O, Basuli F, Opina ACL, Williams MR, Wong K. et al. Immuno-PET imaging of the programmed cell death-1 ligand (PD-L1) using a zirconium-89 labeled therapeutic antibody, avelumab. Mol Imaging. 2019;18:1536012119829986
55. Li D, Cheng S, Zou S, Zhu D, Zhu T, Wang P. et al. Immuno-PET imaging of 89Zr labeled anti-PD-L1 domain antibody. Mol Pharm. 2018;15(4):1674-81
56. van der Veen EL, Bensch F, Glaudemans A, Lub-de Hooge MN, de Vries EGE. Molecular imaging to enlighten cancer immunotherapies and underlying involved processes. Cancer Treat Rev. 2018;70:232-44
57. Broos K, Lecocq Q, Raes G, Devoogdt N, Keyaerts M, Breckpot K. Noninvasive imaging of the PD-1:PD-L1 immune checkpoint: Embracing nuclear medicine for the benefit of personalized immunotherapy. Theranostics. 2018;8:3559-70
58. Donnelly DJ, Smith RA, Morin P, Lipovsek D, Gokemeijer J, Cohen D. et al. Synthesis and biologic evaluation of a novel F-18-labeled adnectin as a PET radioligand for imaging PD-L1 expression. J Nucl Med. 2018;59:529-35
59. Xing Y, Chand G, Liu C, Cook GJR, J OD, Zhao L. et al. Early phase I study of a 99mTc labeled anti-PD-L1 single domain antibody in SPECT/CT assessment of programmed death ligand-1 expression in non-small cell lung cancer. J Nucl Med. 2019 pii: jnumed.118.224170
60. Kumar D, Lisok A, Dahmane E, McCoy M, Shelake S, Chatterjee S. et al. Peptide-based PET quantifies target engagement of PD-L1 therapeutics. J Clin Invest. 2019;129:616-30
61. Gebhart G, Lamberts LE, Wimana Z, Garcia C, Emonts P, Ameye L. et al. Molecular imaging as a tool to investigate heterogeneity of advanced HER2-positive breast cancer and to predict patient outcome under trastuzumab emtansine (T-DM1): the ZEPHIR trial. Ann Oncol. 2016;27:619-24
62. Higashikawa K, Yagi K, Watanabe K, Kamino S, Ueda M, Hiromura M. et al. 64Cu-DOTA-anti-CTLA-4 mAb enabled PET visualization of CTLA-4 on the T-cell infiltrating tumor tissues. PLoS One. 2014;9:e109866
63. Ehlerding EB, Lee HJ, Jiang D, Ferreira CA, Zahm CD, Huang P. et al. Antibody and fragment-based PET imaging of CTLA-4+ T-cells in humanized mouse models. Am J Cancer Res. 2019;9:53-63
64. Marshall HT, Djamgoz MBA. Immuno-oncology: Emerging targets and combination therapies. Front Oncol. 2018;8:315
65. Marin-Acevedo JA, Dholaria B, Soyano AE, Knutson KL, Chumsri S, Lou Y. Next generation of immune checkpoint therapy in cancer: new developments and challenges. J Hematol Oncol. 2018;11:39
66. Goldberg MV, Drake CG. LAG-3 in cancer immunotherapy. Curr Top Microbiol Immunol. 2011;344:269-78
67. Kelly MP, Tavare R, Giurleo JT, Makonnen S, Hickey C, Danton MA. et al. Immuno-PET detection of LAG-3 expressing intratumoral lymphocytes using the zirconium-89 radiolabeled fully human anti-LAG-3 antibody REGN3767. Cancer Res. 2018 (78) (13 Suppl) 3033
68. Alam IS, Mayer AT, Sagiv-Barfi I, Wang K, Vermesh O, Czerwinski DK. et al. Imaging activated T cells predicts response to cancer vaccines. J Clin Invest. 2018;128(6):2569-80
69. Lameijer M, Binderup T, van Leent MMT, Senders ML, Fay F, Malkus J. et al. Efficacy and safety assessment of a TRAF6-targeted nanoimmunotherapy in atherosclerotic mice and non-human primates. Nat Biomed Eng. 2018;2:279-92
70. Seo JW, Tavare R, Mahakian LM, Silvestrini MT, Tam S, Ingham ES. et al. CD8(+) T-cell density imaging with 64Cu-labeled cys-diabody informs immunotherapy protocols. Clin Cancer Res. 2018;24:4976-87
71. Tavare R, Escuin-Ordinas H, Mok S, McCracken MN, Zettlitz KA, Salazar FB. et al. An effective immuno-PET imaging method to monitor CD8-dependent responses to immunotherapy. Cancer Res. 2016;76:73-82
72. Tavare R, McCracken MN, Zettlitz KA, Knowles SM, Salazar FB, Olafsen T. et al. Engineered antibody fragments for immuno-PET imaging of endogenous CD8+ T cells in vivo. Proc Natl Acad Sci U S A. 2014;111:1108-13
73. Rashidian M, Ingram JR, Dougan M, Dongre A, Whang KA, LeGall C. et al. Predicting the response to CTLA-4 blockade by longitudinal noninvasive monitoring of CD8 T cells. J Exp Med. 2017;214(8):2243-55
74. Postow MA, Harding JJ, Hellmann MD, Gordon MS, Tsai F, Donoghue JAO. Imaging of tumor infiltrating T cells with an anti-CD8 minibody (Mb) 89Zr-IAB22M2C, in advanced solid tumors. J Clin Oncol. 2018:36 (15 suppl)
75. Boyman O, Sprent J. The role of interleukin-2 during homeostasis and activation of the immune system. Nat Rev Immunol. 2012;12:180-90
76. Markovic SN, Galli F, Suman VJ, Nevala WK, Paulsen AM, Hung JC. et al. Non-invasive visualization of tumor infiltrating lymphocytes in patients with metastatic melanoma undergoing immune checkpoint inhibitor therapy: a pilot study. Oncotarget. 2018;9:30268-78
77. Levi J, Lam T, Goth SR, Yaghoubi S, Bates J, Ren G. et al. Imaging of activated T cells as an early predictor of immune response to anti-PD-1 therapy. Cancer Res. 2019;79(13):3455-65
78. Namavari M, Chang YF, Kusler B, Yaghoubi S, Mitchell BS, Gambhir SS. Synthesis of 2'-deoxy-2'-[18F]fluoro-9-β-D-arabinofuranosylguanine: a novel agent for imaging T-cell activation with PET. Mol Imaging Biol. 2011;13:812-8
79. Russ BE, Prier JE, Rao S, Turner SJ. T cell immunity as a tool for studying epigenetic regulation of cellular differentiation. Front Genet. 2013;4:218
80. Forde PM, Chaft JE, Smith KN, Anagnostou V, Cottrell TR, Hellmann MD. et al. Neoadjuvant PD-1 blockade in resectable lung cancer. N Engl J Med. 2018;378(21):1976-86
81. Blank CU, Rozeman EA, Fanchi LF, Sikorska K, van de Wiel B, Kvistborg P. et al. Neoadjuvant versus adjuvant ipilimumab plus nivolumab in macroscopic stage III melanoma. Nat Med. 2018;24(11):1655-61
82. Huang AC, Orlowski RJ, Xu X, Mick R, George SM, Yan PK. et al. A single dose of neoadjuvant PD-1 blockade predicts clinical outcomes in resectable melanoma. Nat Med. 2019;25(3):454-61
83. Chen PL, Roh W, Reuben A, Cooper ZA, Spencer CN, Prieto PA. et al. Analysis of immune signatures in longitudinal tumor samples yields insight into biomarkers of response and mechanisms of resistance to immune checkpoint blockade. Cancer Discov. 2016;6(8):827-37
84. Tumeh PC, Harview CL, Yearley JH, Shintaku IP, Taylor EJ, Robert L. et al. PD-1 blockade induces responses by inhibiting adaptive immune resistance. Nature. 2014;515(7528):568-71
85. Ribas A, Shin DS, Zaretsky J, Frederiksen J, Cornish A, Avramis E. et al. PD-1 blockade expands intratumoral memory T cells. Cancer Immunol Res. 2016;4(3):194-203
86. Edwards J, Wilmott JS, Madore J, Gide TN, Quek C, Tasker A. et al. CD103(+) tumor-resident CD8(+) T cells are associated with improved survival in immunotherapy-naive melanoma patients and expand significantly during anti-PD-1 treatment. Clin Cancer Res. 2018;24(13):3036-45
87. Shang B, Liu Y, Jiang SJ, Liu Y. Prognostic value of tumor-infiltrating FoxP3+ regulatory T cells in cancers: a systematic review and meta-analysis. Sci Rep. 2015;5:15179
88. Takeuchi Y, Nishikawa H. Roles of regulatory T cells in cancer immunity. Int Immunol. 2016;28:401-9
89. Campbell KS, Hasegawa J. Natural killer cell biology: an update and future directions. J Allergy Clin Immunol. 2013;132(3):536-44
90. Silva-Santos B, Mensurado S, Coffelt SB. Gammadelta T cells: pleiotropic immune effectors with therapeutic potential in cancer. Nat Rev Cancer. 2019;19(7):392-404
91. Pitt JM, Marabelle A, Eggermont A, Soria JC, Kroemer G, Zitvogel L. Targeting the tumor microenvironment: removing obstruction to anticancer immune responses and immunotherapy. Ann Oncol. 2016;27:1482-92
92. Champiat S, Dercle L, Ammari S, Massard C, Hollebecque A, Postel-Vinay S. et al. Hyperprogressive disease is a new pattern of progression in cancer patients treated by anti-PD-1/PD-L1. Clin Cancer Res. 2017;23:1920-8
93. Champiat S, Ferrara R, Massard C, Besse B, Marabelle A, Soria JC. et al. Hyperprogressive disease: recognizing a novel pattern to improve patient management. Nat Rev Clin Oncol. 2018;15:748-62
94. Faure M, Rochigneux P, Olive D, Taix S, Brenot-Rossi I, Gilabert M. Hyperprogressive disease in anorectal melanoma treated by PD-1 inhibitors. Front Immunol. 2018;9:797
95. Lo Russo G, Moro M, Sommariva M, Cancila V, Boeri M, Centonze G. et al. Antibody-Fc/FcR interaction on macrophages as a mechanism for hyperprogressive disease in non-small cell lung cancer subsequent to PD-1/PD-L1 blockade. Clin Cancer Res. 2019;25:989-99
96. Kamada T, Togashi Y, Tay C, Ha D, Sasaki A, Nakamura Y. et al. PD-1(+) regulatory T cells amplified by PD-1 blockade promote hyperprogression of cancer. Proc Natl Acad Sci U S A. 2019;116:9999-10008
97. Freise AC, Zettlitz KA, Salazar FB, Lu X, Tavare R, Wu AM. ImmunoPET imaging of murine CD4(+) T cells using anti-CD4 cys-diabody: Effects of protein dose on T cell function and imaging. Mol Imaging Biol. 2017;19:599-609
98. Steinhoff K, Pierer M, Siegert J, Pigla U, Laub R, Hesse S. et al. Visualizing inflammation activity in rheumatoid arthritis with Tc-99 m anti-CD4-mAb fragment scintigraphy. Nucl Med Biol. 2014;41:350-4
99. Xavier C, Blykers A, Laoui D, Bolli E, Vaneyken I, Bridoux J. et al. Clinical translation of [68Ga]Ga-NOTA-anti-MMR-sdAb for PET/CT imaging of protumorigenic macrophages. Mol Imaging Biol. 2019
100. Jiemy WF, Heeringa P, Kamps J, van der Laken CJ, Slart R, Brouwer E. Positron emission tomography (PET) and single photon emission computed tomography (SPECT) imaging of macrophages in large vessel vasculitis: Current status and future prospects. Autoimmun Rev. 2018;17:715-26
101. Cheng D, Zou W, Li X, Xiu Y, Tan H, Shi H. et al. Preparation and evaluation of 99mTc-labeled anti-CD11b antibody targeting inflammatory microenvironment for colon cancer imaging. Chem Biol Drug Des. 2015;85:696-701
102. Mariathasan S, Turley SJ, Nickles D, Castiglioni A, Yuen K, Wang Y. et al. TGFβ attenuates tumour response to PD-L1 blockade by contributing to exclusion of T cells. Nature. 2018;554:544-8
103. Tauriello DVF, Palomo-Ponce S, Stork D, Berenguer-Llergo A, Badia-Ramentol J, Iglesias M. et al. TGFβ drives immune evasion in genetically reconstituted colon cancer metastasis. Nature. 2018;554:538-43
104. den Hollander MW, Bensch F, Glaudemans AW, Oude Munnink TH, Enting RH, den Dunnen WF. et al. TGF-β antibody uptake in recurrent high-grade glioma imaged with 89Zr-fresolimumab PET. J Nucl Med. 2015;56:1310-4
105. Olson B, Li Y, Lin Y, Liu ET, Patnaik A. Mouse models for cancer immunotherapy research. Cancer Discov. 2018;8:1358-65
106. Nikolich-Zugich J. The twilight of immunity: emerging concepts in aging of the immune system. Nat Immunol. 2018;19:10-9
107. de Vries EGE, Kist de Ruijter L, Lub-de Hooge MN, Dierckx RA, Elias SG, Oosting SF. Integrating molecular nuclear imaging in clinical research to improve anticancer therapy. Nat Rev Clin Oncol. 2019;16(4):241-55
Author contact
![]() Corresponding author: E.G.E. de Vries, MD, PhD. Department of Medical Oncology - University Medical Center Groningen - University of Groningen, PO Box 30.001 - 9700 RB Groningen - The Netherlands. E mail: e.g.e.de.vriesnl
Corresponding author: E.G.E. de Vries, MD, PhD. Department of Medical Oncology - University Medical Center Groningen - University of Groningen, PO Box 30.001 - 9700 RB Groningen - The Netherlands. E mail: e.g.e.de.vriesnl