Impact Factor
- Issue 14; 2026
- Issue 13; 2026
- Issue 12; 2026
- Issue 11; 2026
- Issue 10; 2026
- Volume 16; 2026
- Advance Articles
- Past Issues
- Cover Images
- Cover Suggestion
- Index & Coverage
- Special Issues
Introduction
Methods
Results
Discussion
Conclusions
Abbreviations
Supplementary Material
Acknowledgements
References
International Journal of Biological Sciences
International Journal of Medical Sciences
 Global reach, higher impact

Theranostics 2020; 10(6):2659-2674. doi:10.7150/thno.42665 This issue Cite
Research Paper
Neuron labeling with rhodamine-conjugated Gd-based MRI contrast agents delivered to the brain via focused ultrasound
Sophie V. Morse1, Tamara Boltersdorf2, Bethany I. Harriss2, Tiffany G. Chan2, Nicoleta Baxan3, Hee Seok Jung1, Antonios N. Pouliopoulos1, James J. Choi1, Nicholas J. Long2 ![]()
1. Department of Bioengineering, Imperial College London, South Kensington, London, SW7 2BP, UK.
2. Department of Chemistry, Imperial College London, Molecular Sciences Research Hub, White City, London, W12 0BZ, UK.
3. Biological Imaging Centre, Faculty of Medicine, Hammersmith Hospital, Du Cane Road, London, W12 0NN, UK.
Received 2019-12-2; Accepted 2020-1-1; Published 2020-2-3
Abstract

Gadolinium-based magnetic resonance imaging contrast agents can provide information regarding neuronal function, provided that these agents can cross the neuronal cell membrane. Such contrast agents are normally restricted to extracellular domains, however, by attaching cationic fluorescent dyes, they can be made cell-permeable and allow for both optical and magnetic resonance detection. To reach neurons, these agents also need to cross the blood-brain barrier. Focused ultrasound combined with microbubbles has been shown to enhance the permeability of this barrier, allowing molecules into the brain non-invasively, locally and transiently. The goal of this study was to investigate whether combining fluorescent rhodamine with a gadolinium complex would form a dual-modal contrast agent that could label neurons in vivo when delivered to the mouse brain with focused ultrasound and microbubbles.
Methods: Gadolinium complexes were combined with a fluorescent, cationic rhodamine unit to form probes with fluorescence and relaxivity properties suitable for in vivo applications. The left hemisphere of female C57bl/6 mice (8-10 weeks old; 19.07 ± 1.56 g; n = 16) was treated with ultrasound (centre frequency: 1 MHz, peak-negative pressure: 0.35 MPa, pulse length: 10 ms, repetition frequency: 0.5 Hz) while intravenously injecting SonoVue microbubbles and either the 1 kDa Gd(rhodamine-pip-DO3A) complex or a conventionally-used lysine-fixable Texas Red® 3 kDa dextran. The opposite right hemisphere was used as a non-treated control region. Brains were then extracted and either sectioned and imaged via fluorescence or confocal microscopy or imaged using a 9.4 T magnetic resonance imaging scanner. Brain slices were stained for neurons (NeuN), microglia (Iba1) and astrocytes (GFAP) to investigate the cellular localization of the probes.
Results: Rhodamine fluorescence was detected in the left hemisphere of all ultrasound treated mice, while none was detected in the right control hemisphere. Cellular uptake of Gd(rhodamine-pip-DO3A) was observed in all the treated regions with a uniform distribution (coefficient of variation = 0.4 ± 0.05). Uptake was confirmed within neurons, whereas the probe did not co-localize with microglia and astrocytes. Compared to the dextran molecule, Gd(rhodamine-pip-DO3A) distributed more homogeneously and was less concentrated around blood vessels. Furthermore, the dextran molecule was found to accumulate unselectively in microglia as well as neurons, whereas our probe was only taken up by neurons. Gd(rhodamine-pip-DO3A) was detected via magnetic resonance imaging ex vivo in similar regions to where fluorescence was detected.
Conclusion: We have introduced a method to image neurons with a dual-modal imaging agent delivered non-invasively and locally to the brain using focused ultrasound and microbubbles. When delivered to the mouse brain, the agent distributed homogeneously and was only uptaken by neurons; in contrast, conventionally used dextran distributed heterogeneously and was uptaken by microglia as well as neurons. This result indicates that our probe labels neurons without microglial involvement and in addition the probe was found to be detectable via both ex vivo MRI and fluorescence. Labeling neurons with such dual-modal agents could facilitate the study of neuronal morphology and physiology using the advantages of both imaging modalities.
Keywords: neurons, rhodamine, MRI contrast agents, focused ultrasound, blood-brain barrier
Introduction
Magnetic resonance imaging (MRI) can be used to acquire in vivo images of entire organisms noninvasively. In MRI images, tissues are generally distinguished based on differences in the concentration of water molecules and on the time taken for the protons in these water molecules to relax in a magnetic field. The contrast of magnetic resonance (MR) images can be enhanced by using intravenously-injected, paramagnetic contrast agents which are able to interact with nuclei adjacent or close to the paramagnetic centre [1]. Relaxation enhancement of nuclei proximal to the paramagnetic centre depends on the electronic relaxation time of the metal [2]. Gadolinium (Gd3+) complexes are the most commonly used for this purpose due to their uniquely long relaxation times (~10-9 s, several orders of magnitude slower than other lanthanide ions), their high magnetic moment (7.94 Bohr magnetons) and a free coordination site to directly bind to solvent water molecules. The interaction of gadolinium complexes with surrounding water molecules leads to a shortening of the longitudinal relaxation time (T1) of the water protons, resulting in a brightening of the image [1,3]. Gd-based contrast agents can be used to investigate biological processes inside the body, such as developmental events, enzymatic activity and gene expression [4-7]. However, most Gd-based contrast agents are restricted to extracellular domains as the cell membrane prevents the internalization of these highly hydrophilic agents [1]. To tackle this issue, MRI contrast agents have been made membrane-permeable through the attachment of molecules such as cell-penetrating peptides (CPPs) [8-13]. CPP-conjugated complexes, however, leak easily from cells [14] and lead to quenched MRI signals due to endosomal or lysosomal entrapment [15]. Another approach is to attach fluorescent dyes to Gd3+ complexes (such as rhodamine, fluorescein isothiocyanate (FITC), cyanine 7 (Cy7) and boron dipyrromethene (BODIPY)) [5,16,17]. These dyes cross the cell membrane easily by themselves but can also make other complexes more cell permeable by being conjugated to them. Fluorescent dyes are advantageous for this purpose as they are cheaper than CPPs, easier to conjugate and provide an additional means of imaging the probes using fluorescence microscopy as well as MRI.
In the field of neuroscience there is a growing need for methods to understand the neural system in vivo. One area of interest is the labeling of neurons to facilitate the study of neuronal morphology and their function. Unique information regarding neuronal physiology, such as metabolic activity and protein expression, can be provided by MRI contrast agents that are capable of crossing the cell membrane [18,19]. Rhodamine B is a commonly used fluorophore that is biocompatible, possesses a high quantum yield and has been used to label neurons in vivo [20-22]. This dye has been reported to be non-toxic to neurons, resistant to histological fixation procedures and does not leak from labeled cells [20]. Rhodamine constructs have been previously conjugated with Gd-based MRI contrast agents to permeate cells [5,16]. Amongst these, Gd3+-rhodamine complexes based on a macrocyclic, DOTA (tetraazacyclododecane-1,4,7,10-tetraacetic acid) scaffold (Gd(Rhoda-DOTA)) have been reported to enter HeLa cells in vitro [16], Xenopus embryos in vivo [5], and have also been used as dual-modal probes (Gd(rhodamine-DO3A)) to image tumours in mice [23]. Rhodamine B and similar motifs can interconvert between a spirocyclic non-fluorescent form and a fully conjugated ring-opened form upon activation of the carbonyl group, a property that has been extensively investigated in the context of pH and heavy metal ion sensing [24,25]. Here, we have modified the structure of rhodamine B to give an “always on” fluorescent probe by adding a piperazine unit to the amide to lock it in its ring-opened form, while creating a positive charge on the dye to facilitate cell permeability. Next, the rhodamine derivative is combined with a macrocyclic gadolinium complex to form a compound that can enable both the accumulation of a Gd-based contrast agent in neurons and simultaneous fluorescence imaging. To the best of our knowledge, a similar probe has not yet been used to image neurons and such a compound could allow for simultaneous imaging of neurons at different resolutions and depths in preclinical models, combining the advantages of fluorescence imaging with those of MRI.
In order to effectively image neurons, the probe must also cross the blood-brain barrier (BBB). The BBB prevents most molecules above 400 Da from entering the brain to maintain homeostasis and protect the brain from toxic substances [26,27]. Therefore, under normal conditions where the BBB is intact, our complex cannot enter the brain [28]. Direct injection through the skull can be used to deliver these complexes, however, this is an invasive procedure which can lead to complications such as haemorrhage and infection [29,30]. A non-invasive alternative to deliver these compounds across the BBB is to use focused ultrasound and microbubbles [31]. With this method, ultrasound is focused onto a specific region of interest where the compound is to be delivered. Clinically approved microbubbles are then injected intravenously, and when they reach the region where the ultrasound is focused, the microbubbles expand and contract. This mechanical stimulation of the vessels increases permeability and allows compounds to cross the BBB. A wide range of compounds have been delivered using this technique, including Gd-based MRI contrast agents [31-33], fluorescent dextrans [34-36], nanoparticles [37,38], drugs [39,40], peptides [41] and antibodies [42,43]. This ultrasound technology has previously been used to deliver fluorescent dextrans into neurons [35,44], however, it has not been used for neuronal delivery of optical-MRI probes. To date, focused ultrasound combined with microbubbles is the only non-invasive, localized and transient way of getting these compounds into deep regions of the brain.
In this study, we report a way of imaging neurons with a dual-modal imaging agent delivered to the brain with focused ultrasound and microbubbles. Gd(rhodamine-pip-DO3A) was prepared and its optical and relaxivity properties were characterized. The compound was delivered noninvasively to the left hemisphere of mice using focused ultrasound and microbubbles. To examine the distribution of the compound within the parenchyma, fluorescence images were acquired. Its cellular uptake was compared to that of an optical probe (Texas-Red dextran) normally used to assess BBB permeability enhancement following focused ultrasound-mediated delivery. Ex vivo MRI images of the brains were then taken to evaluate the presence of the compound. The delivery of such dual-modal agents into neurons could facilitate the study of neuronal morphology and physiology using both MRI and fluorescence microscopy across different spatiotemporal scales.
Methods
General synthetic and spectroscopic methods
Reagents were purchased and used without further purification from Sigma Aldrich, Fisher Scientific or Goss Scientific. To characterize the different steps of the probe's synthesis, NMR, MALDI and fluorescence spectra were acquired. Proton and carbon nuclear magnetic resonance (1H-NMR; 13C-NMR) spectra were recorded at room temperature on a Bruker AMX-400 spectrometer. Chemical shifts in the NMR spectra are reported in parts per million (ppm) with coupling constants quoted in hertz (Hz) to the nearest decimal point. Multiplicities are abbreviated as follows: s = singlet, d = doublet, t = triplet, q = quartet, m = multiplet, br = broad, sbr = broad singlet. Electrospray ionization (ES+) mass spectra were collected on a Waters LCT Premier spectrometer. MALDI spectra were collected on a low resolution Micromass MALDI-ToF machine. Fluorescence spectra were recorded on a Varian Cary Eclipse fluorescence spectrophotometer using quartz cuvettes. T1 measurements were performed on a Bruker DRX-400 spectrometer. The complexes were dissolved in H2O at five different concentrations and placed in 1.7 mm diameter capillary tubes, sealed with Parafilm. These were placed in 5 mm NMR tubes and filled with D2O and 1/ T1 measurements were performed. The concentration of Gd3+ in these samples was confirmed by measuring the chemical shift difference between HOD and H2O signals induced by the paramagnetic Gd3+ at 25°C on a Bruker AV 500 [45]. Synthetic and spectral details are given in the supplementary information.
Animals
Sixteen female wild-type C57bl/6 mice (8-10 weeks old, 19.07 ± 1.56 g; Envigo, Huntingdon, UK) were used in this study. An acclimatization period of seven days was allowed prior to the initiation of any procedure and all experimental protocols were approved by the institutional animal facility committee and the UK Home Office regulatory establishments.
Ultrasound setup and experimental conditions
Mice were anaesthetized with 1.5-2.0% vaporized isoflurane (Zoetis UK Limited, London, UK) mixed with oxygen (0.8 L/min) using an anesthesia vaporizer (Harvard Apparatus, Cambridge, UK). The fur was first removed from the mouse's head with an electric trimmer and depilatory cream, and then the head was placed within a stereotaxic frame (45° ear bars; World Precision Instruments, Hertfordshire, UK). After applying ultrasound gel to the mouse head, a container covered by a transparent parafilm membrane filled with degassed water was placed on the gel, making the sutures of the skull clear for targeting purposes. The ultrasound transducer, mounted with a cone filled with distilled water covered by an acoustically transparent parafilm membrane, was lowered into the container (Figure 1). For targeting purposes, a 1 mm thick metal cross was aligned to the lambdoid and sagittal sutures of the skull at the bottom of the water container [46]. The transducer was positioned 3 mm laterally from the sagittal suture, 0.5 mm anterior to the lambdoid suture and 3 mm inferior to the skull to target the left hemisphere of the brain with the ultrasound focus above the left hippocampus [44]. This brain region was chosen due to its potential as a therapeutic target and due to the low acoustic attenuation of the parietal bone. The opposite right hemisphere was used as a control (no ultrasound treatment) in all experiments. For this targeting procedure, the ultrasound transducer was used in pulse-echo mode, with the transducer connected to a pulser-receiver (DPR300; Insidix, Seyssins, France) and moved by a 3D computer-controlled positioning system (Velmex Inc., Bloomfield, NY, USA).
Ultrasound experimental setup. The mouse brain was exposed to 1-MHz ultrasound using a ms-long pulse sequence, composed of 10,000-cycle pulses emitted at a slow rate of 0.5 Hz at a peak negative pressure (Pneg) of 0.35 MPa. Ultrasound was emitted onto the left hemisphere through the intact scalp and skull, while the right hemisphere was used as a control, with no ultrasound focused onto it. A 7.5-MHz passive cavitation detector (PCD) was used to detect the microbubble signals to verify their presence. (PC = personal computer, dB values refer to the amount of amplification).
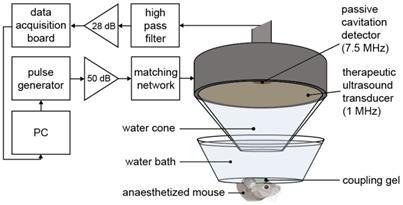
After targeting, therapeutic ultrasound pulses were emitted from the single-element spherical-segment focused ultrasound transducer (centre frequency: 1 MHz, focal depth: 60.5 mm, diameter: 90 mm; Sonic Concepts, Bothell, WA, USA). The pulses were emitted from a function generator (33500B Series; Agilent Technologies, Santa Clara, CA, USA) and passed through a 50-dB power amplifier (Precision Acoustics Ltd, Dorchester, UK) before reaching the transducer. Ultrasound pulses were emitted for all experiments: peak-negative pressure = 0.35 MPapk-neg, pulse length = 10 ms, pulse repetition frequency = 0.5 Hz, number of pulses = 125. Prior to the in vivo experiments, the pressure amplitude reported in this study was measured with a needle hydrophone (needle diameter: 0.2 mm, Precision Acoustics Ltd., Dorchester, Dorset, UK) in a degassed water tank. The peak-positive and peak-negative values were calculated and attenuated by 11.2 ± 3.2 % to correct for the skull attenuation, which was measured experimentally through the parietal bone of the mouse's skull (n = 4). The axial, lateral and elevational full width at half maximum intensities of the ultrasound beam were 20 mm, 2 mm and 1 mm respectively.
During the ultrasound treatment, a passive cavitation detector (PCD, centre frequency: 7.5 MHz, focal length: 76.2 mm; Olympus Industrial, Essex, UK) was used to detect the microbubble signals to verify their presence and behavior in the targeted region. This detector was positioned through the central opening in the therapeutic transducer with the foci aligned and overlapping. These acoustic emissions were filtered by a 3-30 MHz band-pass filter (Mini circuits, Brooklyn, NY, USA) amplified by a 28 dB pre-amplifier (Stanford Research Systems, Sunnyvale, CA, USA) to then be recorded by a 8-bit oscilloscope sampling at 250 MHz (Picoscope 3205A; Pico Technology, Cambridgeshire, UK). The acoustic emissions were processed in Matlab (Mathworks, Natick, MA, USA) to evaluate the energy levels compared to those of the control pulses.
Microbubbles and probe delivery
Ten seconds into the ultrasound sonication, allowing five control pulses to be emitted, SonoVue® microbubbles (Bracco, Milan, Italy) were administered intravenously through a 30 G catheter over a 30 s time period (volume: 100 µl, concentration: 5 µl/g). The microbubbles were activated following manufacturers' instructions and were used within 6 h from activation. One minute from the start of the sonication, Gd(rhodamine-pip-DO3A) (molecular weight: 1 kDa, concentration: 5.6 mg/ml; n = 10) or lysine-fixable Texas Red® 3 kDa dextran (concentration: 5 mg/ml; Life Technologies, Paisley, UK; n = 6) was also injected. The probes were diluted in 100 µl phosphate-buffered saline (PBS) and were not expected to cross an intact BBB due to their size being over the 400 Da threshold [47]. Of the ten mice where Gd(rhodamine-pip-DO3A) was delivered, three brains were imaged with MRI as well as fluorescence microscopy.
Histological staining
Following ultrasound treatment, the mice were euthanized with 20 mL PBS and 20 mL 10% formalin (Sigma Aldrich, St Louis, MO, USA). The brain was extracted from the skull and fixed in formalin overnight, followed by 15% sucrose for 6 hours and 30% sucrose overnight to protect the tissue before frozen sectioning. The brains were embedded in optimal cutting temperature (OCT; Agar Scientific, Stansted, UK) compound and sectioned into sixty 30 µm slices to cover the entire hippocampus using a cryostat (CryoStar NX70; Thermo Fisher, Waltham, MA, USA).
Immunohistochemistry (IHC) of 12 frozen sections from each brain was used to determine which cells (neurons, microglia or astrocytes) were taking up the probes. For neuronal staining: primary recombinant anti-NeuN antibody (1:500 overnight; Ab177487; Abcam, Cambridge, England) and secondary goat anti-rabbit IgG H&L Alexa Fluor® 488 antibody (1:500 for 2 h; Ab150077; Abcam); for microglia staining: primary anti-Iba1 antibody (1:500 overnight; Ab5076; Abcam) and secondary donkey anti-goat IgG H&L Alexa Fluor® 488 antibody (1:500 for 2 h; Ab150129; Abcam); for astrocyte staining: primary GFAP monoclonal antibody (1:50 overnight; 13-0300; ThermoFisher) and secondary mouse anti-rat IgG2a FITC antibody (1:500 for 2 h; 11-4817-82; ThermoFisher).
Microscopy and analysis
Images of the brain slices with the delivered probes and the antibody staining were acquired using fluorescence microscopy (10x; Zeiss Axio Observer; Oberkochen, Germany) and confocal microscopy (20x; Zeiss LSM-510 inverted; Oberkochen, Germany). Gd(rhodamine-pip-DO3A) and Texas Red 3 kDa dextran were excited at 562/40 nm and emissions were filtered at 624/40 nm. The Alexa Fluor 488 and FITC stained slices were excited at 470/40 nm and emissions were filtered at 525/50 nm.
The detected dose was measured with the normalized optical density (NOD) [35]. All pixels with intensities higher than the mean of the control region plus twice its standard deviation were summed for both the control and targeted regions of interest. The sum of the targeted region was subtracted by that of the control region to obtain the NOD. The distribution of the probes was quantified with the coefficient of variation (COV), defined as the standard deviation over the average fluorescence intensity in the targeted region. This was calculated for six slices for each treated brain by selecting regions of interest around the targeted left hippocampus using Matlab® (2016a, The Mathworks, Natick, MA, USA).
Fluorescence Titration with Bovine Serum Albumin
The following binding assay was performed to assess whether Gd(rhodamine-pip-DO3A) might interact with endogenous albumin in the blood. Such binding can slow down the motion of the agent, thereby enhancing r1 relaxivity [48]. A solution of 10 μM bovine serum albumin (BSA) was titrated with increasing concentrations of Gd(rhodamine-pip-DO3A) (1 μM to 10 μM; 0.1 to 1 eq.). After each addition, the fluorescence emission between 310-450 nm was recorded using a Cary Eclipse Fluorescence Spectrophotometer with an excitation wavelength of 295 nm. Emission values at 345 nm (λmax) were normalized to the emission recorded for BSA without any complex added. All samples were measured in triplicate. Quenching constants (Ksv) were calculated by plotting Stern-Volmer plots (I0/I = Ksv[X] + 1, where I = intensity and [X] = complex concentration).
Ex vivo MRI
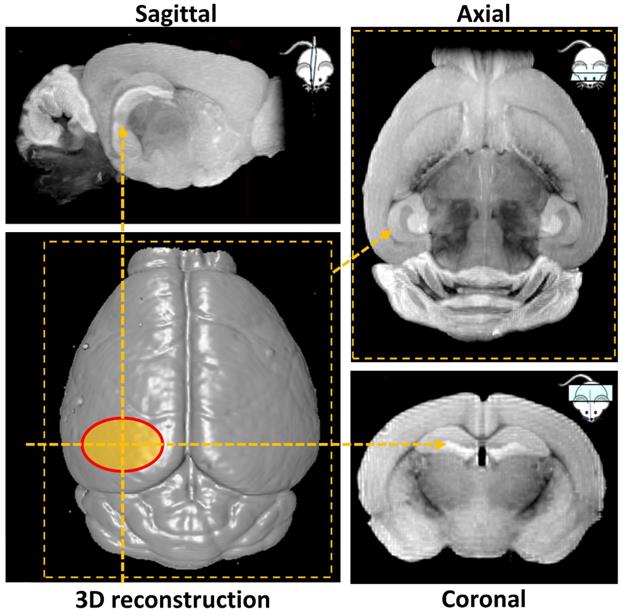
Ex vivo MRI scans were performed at Imperial College Biological Imaging Centre using a pre-clinical 9.4 T scanner (94/20 USR Bruker BioSpec; Bruker Biospin, Ettlingen, Germany) equipped with a 40 mm inner diameter volume transmit/receive quadrature coil. Data was acquired with Paravision 6.0.1 (Bruker, BioSpin). T1 weighted images were obtained with a 3D gradient echo-based FLASH sequence with the field of view selected to cover the entire mouse brain. Additional acquisition parameters were: TR/TE = 50/7.2 ms (TR = repetition time; TE = echo time), flip angle = 32°, spatial resolution = (100×100×100) µm3, 14 averages, total scan time 7 h. 3D volume reconstruction and smoothing was performed in Paravision 6.0.1 to illustrate the surface of the mouse brain and the targeted hippocampal area (Figure 2). Next, maximum intensity projection was carried out over a volume of 1 mm thickness to highlight the targeted left hemisphere and its contralateral side in sagittal, axial and coronal orientation (Figure 2). The signal intensity on the targeted side was compared to the control side by calculating the normalized signal intensity, using the same calculation as used for the NOD.
MRI-based 3D volume reconstruction of the mouse brain highlighting the region where ultrasound targets the left hemisphere (red oval). Maximum intensity projections (MIP) over a volume of 1 mm thickness highlight the targeted hemisphere in sagittal, axial and coronal orientations (yellow arrows).
Statistical analysis
A two-sided Student t test was performed to determine whether the COV values were significantly different between the brains where Gd(rhodamine-pip-DO3A) and dextran were delivered. A value of p < 0.01 was considered statistically significant.
Results
Synthesis of Gd(rhodamine-pip-DO3A)
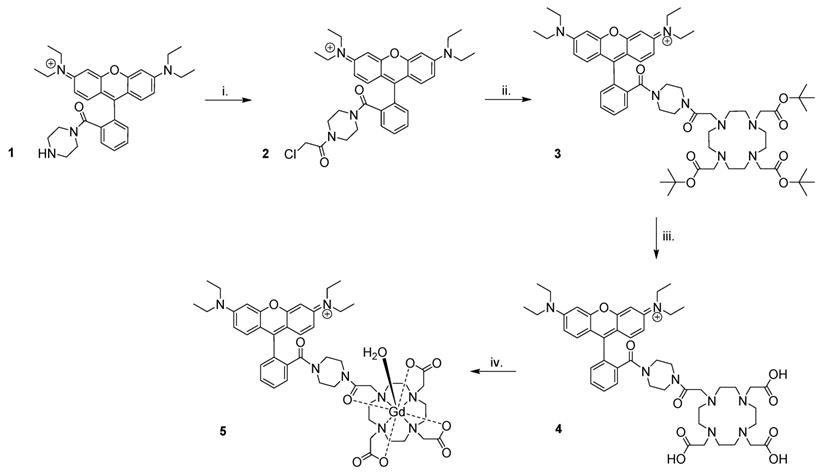
Preparation of Gd(rhodamine-pip-DO3A) (5) was achieved as summarized in Figure 3. Briefly, rhodamine B was treated with 1-boc-piperazine to form a tertiary amide and thus lock the rhodamine unit into its ring-opened, fluorescent form. Hence, the compound was prevented from undergoing spirocyclisation [49], while forming a cationic species at the same time. The resulting compound was purified by column chromatography and deprotected [50] to produce compound 1. Next, chloroacetyl chloride was added under basic conditions to obtain compound 2, before further reaction with tert-butyl protected DO3A to form compound 3. Cleavage of the ester groups resulted in isolation of 4 and subsequent lanthanide complexation afforded compound 5 in good yields (65-87%) after purification using reverse phase column chromatography.
Synthesis of Gd(rhodamine-pip-DO3A). The following reaction conditions were used: i. Chloroacetyl chloride, NEt3, DCM (dichloromethane), 3 h, 0 °C, 62% yield; ii. 1,4,7,10-tetraazacyclododecane-1,4,7-tris(t-butyl acetate), K2CO3, CH3CN, 48 h, 82 °C, 66% yield; iii. TFA (trifluoroacetic acid), DCM, 16 h, room temperature (RT), 74% yield; iv. GdCl3.6H2O, pH 5.5, 24 h, RT, 65-87% yield.
Fluorescence and relaxometric measurements and determination of r1
To determine the optical properties of the probe, the normalized absorption and emission spectra of Gd(rhodamine-pip-DO3A) were obtained in PBS solution at pH 7.3 and are depicted in Figure 4A. Typical rhodamine-based maxima were observed within the absorption spectrum at 562 nm and at 587 nm (λexc = 360 nm) within the emission spectrum and indicated that the compound was suitable to use for in vivo optical applications.
Fluorescence excitation and emission spectra of Gd(rhodamine-pip-DO3A) and T1 relaxation measurements to determine relaxivity (r1). (A) Absorbance and emission spectra of Gd(rhodamine-pip-DO3A) show typical rhodamine maxima (in PBS at pH 7.3, λexc = 360 nm). (B) The change in longitudinal relaxation with increasing concentration of Gd(rhodamine-pip-DO3A) was used to determine relaxivity (r1). T1 represents the relaxation time measured with the contrast agent present while T0 represents the relaxation time measured in water alone without the contrast agent.
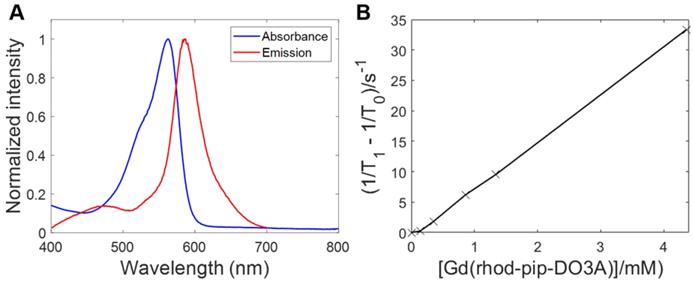
As has been described above, Gd3+ chelates are known to affect T1 relaxation times of surrounding water molecules and as a result can be used to alter the contrast in MRI images, providing a clearer image of physiological changes [51]. To quantify the degree to which a contrast agent alters the water proton relaxation rates (1/T1) of nearby solvent molecules, relaxivity values are used. This parameter is defined as the change in relaxation rate in the presence of the contrast agent divided by the concentration of the metal ion [1,51]. To determine the longitudinal relaxivity value (r1) of Gd(rhodamine-pip-DO3A) and thus predict whether it would act as a useful MRI contrast agent in a physiological context, samples were prepared at five different molar concentrations. Each of their gadolinium concentrations was subsequently determined by 1H-NMR spectroscopy by making use of the chemical shift difference between HOD and H2O signals induced by the paramagnetic Gd3+ [45]. Next, T1-value measurements at well-defined molar concentrations were performed, and the r1 value was determined as 7.8 mM-1s-1 at 400 MHz (25°C) (Figure 4B) [52].
This relaxivity value is higher than that expected for octadentate gadolinium chelates, therefore, we sought to investigate what this could be due to. In solution, lanthanide DOTA complexes are present as two diastereomers that can interconvert, known as the twisted square antiprism (TSAP) isomer and the square antiprism (SAP) isomer [53,54]. Faster water exchange, and thus increased relaxivity values, is often associated with the minor TSAP DOTA isomer [54,55], whereas the major SAP isomer is less beneficial for relaxivity factors.
To approximate the SAP to TSAP ratio and associated water exchange properties in our system, 1H-NMR-spectroscopy is a convenient method to use, as the chemical shift of axial ring protons in the TSAP and SAP isomers are significantly separated [56]. However, due to very large shift ranges and strong line broadening effects, most lanthanide complexes cannot be visualized easily with 1H-NMR spectroscopy [57]. In Eu3+ compounds, these effects are minimized, making them the most convenient analogues for 1H-NMR spectroscopy [58]. To investigate the ratio between the two isomers, we therefore prepared the europium analogue of our Gd probe (Eu(rhodamine-pip-DO3A), Figure S1) and were able to approximate [59] a SAP to TSAP ratio of 1:0.56 by relative integration.
Ultrasound-mediated delivery and neuronal uptake of Gd(rhodamine-pip-DO3A)
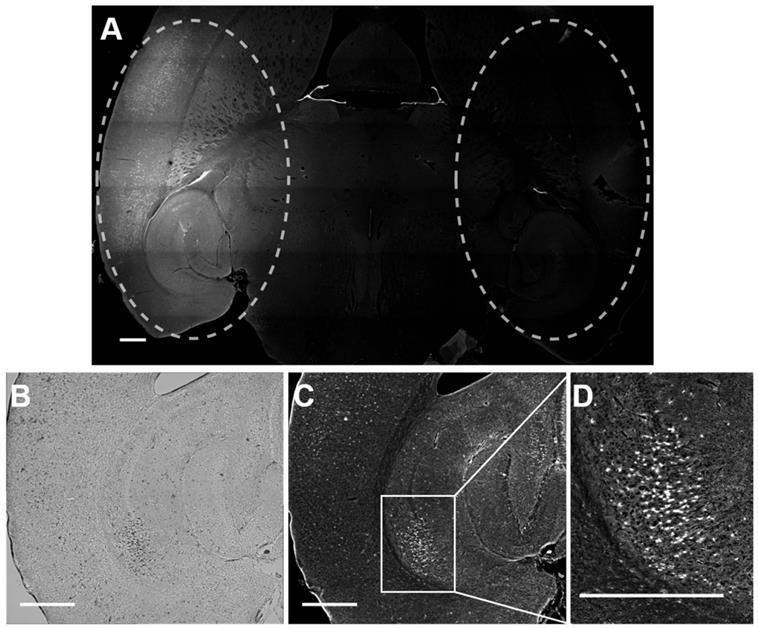
Rhodamine fluorescence was detected in the left hemisphere of all mice treated with focused ultrasound, while in the right hemisphere, where no ultrasound was present, no fluorescence was detected (Figure 5). This result confirmed that Gd(rhodamine-pip-DO3A) does not cross the BBB unless ultrasound is applied in combination with circulating microbubbles. Cellular uptake of Gd(rhodamine-pip-DO3A) was observed in all mouse brains (Figure 5A, C-D). The dark spots observed in the bright field images (Figure 5B) show where cells are present. Most of these dark spots correspond to regions where fluorescence signal was also observed, indicating that the probe is being uptaken by many of the cells in the region where the ultrasound is focused.
Delivery and cellular uptake of Gd(rhodamine-pip-DO3A) in the left hemisphere of the mouse brain. (A) The fluorescence image (10x) shows where Gd(rhodamine-pip-DO3A) was detected in the left hemisphere (left dashed circle) while no fluorescence was detected in the right hemisphere (right dashed circle) where no ultrasound was present (control region). The location of the probe is shown by all the regions where there is high intensity in the fluorescence image (white). (B) This bright field image shows the left hippocampus where the probe was delivered, where the dark spots highlight the location of cells within the selected region. (C-D) In most of these cells, fluorescence is detected indicating that Gd(rhodamine-pip-DO3A) is being uptaken. (D) This zoomed in region highlights an area with high cellular uptake. The white scale bar indicates 500 µm.
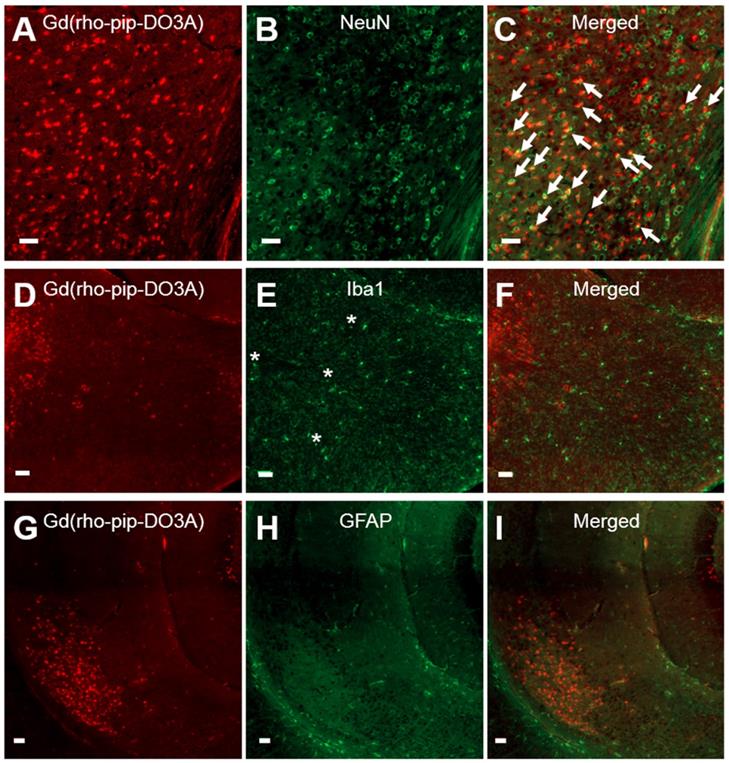
Based on cellular morphology, uptake of the probe was only observed in neuronal-like cells which was confirmed by immunohistological staining (Figure 6 A-C). No uptake, however, was detected in microglia (Figure 6 D-F) or astrocytes (Figure 6 G-I). The number of neurons overlapping with our Gd(rhodamine-pip-DO3A) probe was found to be significantly different from the number of microglia and astrocytes overlapping with the probe (p < 0.01; Figure S2). Although no co-localization was observed, some microglia in the targeted regions appeared more rounded with shorter processes, indicating that they may be in an active form. Lastly, only small signs of red blood cell extravasation and microvacuolations were observed in one of the three brains stained for H&E (haematoxylin & eosin; Figure S3).
Neuronal, microglial and astrocyte staining of brain slices with Gd(rhodamine-pip-DO3A) delivery. Fluorescence images (10x) of Gd(rhodamine-pip-DO3A) distribution (A, D, G) and of immunohistological staining for neurons using NeuN (B), microglia using Iba1 (E) and astrocytes using GFAP (H) with respective merged channels (C, F, I). The white arrows indicate points of colocalisation between the probe and neuronal staining and the asterisks are positioned above more rounded microglia with shorter processes, indicating possible activation. No co-localization was observed between the probe and microglia or astrocytes. The white scale bars indicate 50 µm.
Distribution comparison of Gd(rhodamine-pip-DO3A) with Texas Red dextran
The distribution and cellular uptake of our 1 kDa Gd(rhodamine-pip-DO3A) probe (5) within the brain was compared to that of a larger molecule, Texas Red 3 kDa dextran, often used to assess the permeability enhancement of the BBB following focused ultrasound and microbubble treatment [34-36]. Gd(rhodamine-pip-DO3A) was found to distribute uniformly within the targeted area (Figure 7A, D), while a more heterogeneous pattern was observed when the dextran was delivered (Figure 7B, G). The distribution was quantified using the coefficient of variation (COV) defined as the standard deviation over the average fluorescence intensity in the targeted region. The COV showed that there is less variation in the distribution of the dual-modal probe (COV = 0.4 ± 0.05) compared to the dextran (COV = 1.23 ± 0.04), providing a better coverage of the tissue (Figure 7C). Gd(rhodamine-pip-DO3A) was also detected across a much larger region of the brain compared to the dextran (Figure 7A-B).
Distribution of Gd(rhodamine-pip-DO3A) and dextran within the brain. Fluorescence images (10x) show the distribution of (A) Gd(rhodamine-pip-DO3A) and (B) Texas Red-Dextran in the left hemisphere of the brain. Corresponding right hippocampi, which were control untreated regions, are displayed in smaller white boxes on the bottom right of each image. No fluorescence was detectable in these regions. The white scale bar indicates 500 µm. (C) A significant difference in the coefficient of variation (COV), a measure of distribution heterogeneity, was quantified (n = 6; P < 0.001). The distribution of Gd(rhodamine-pip-DO3A) was more homogeneous than that of dextran. (D-I) Confocal microscopy images (20x) of mouse brain regions exposed to ultrasound reveal (D) Gd(rhodamine-pip-DO3A) delivered homogeneously throughout the parenchyma with (E-F) cell uptake. (G) Dextran instead accumulated mainly around the blood vessels and was also taken up by (H) microglial-looking cells and (I) neuronal cell bodies. The white scale bars in these confocal images indicate 50 µm.
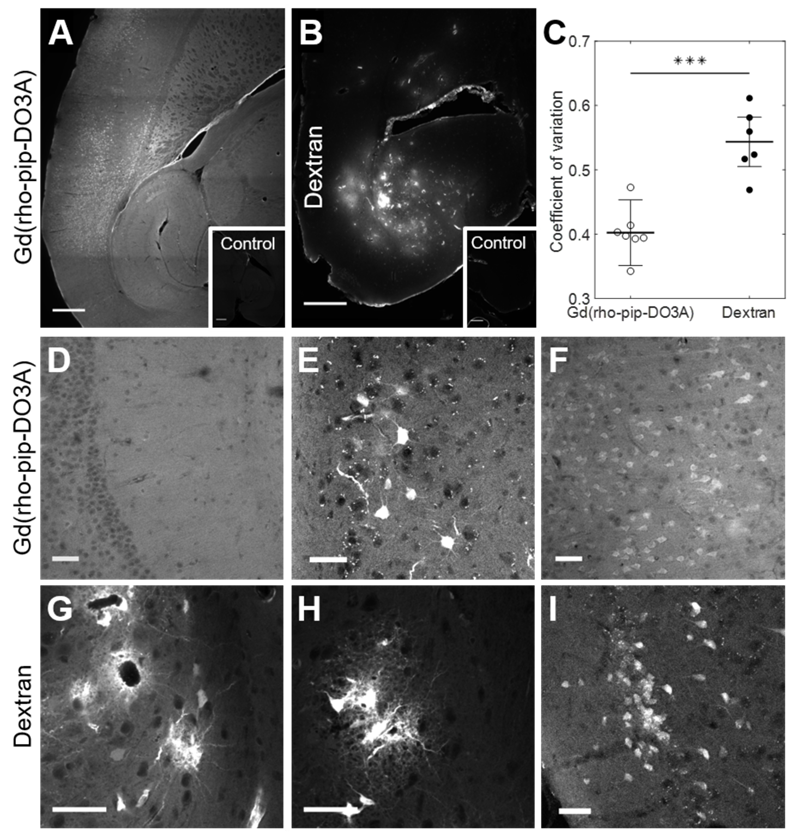
By taking a closer look with confocal microscopy, the synthesized probe not only had a more uniform distribution (Figure 7D), with no accumulation around the blood vessels, but was also uptaken by cells throughout the ultrasound focus (Figure 7E-F). Interestingly, the probe was observed both within the nucleus and cytoplasm of cells with some high intensity regions (approximately 1-3 µm; Figure S4). The dextran, on the other hand, accumulated around the blood vessels (Figure 7G) and was also uptaken by cells, however, these cells were not only neuronal-like cells (Figure 7I) but also glial-like cells (Figure 7G-H). Immunohistochemistry confirmed the uptake of dextran within neurons and more so within microglia but not in astrocytes (Figure S5), while Gd(rhodamine-pip-DO3A) was only found in neurons. With both probes, more rounded microglia with shorter processes were detected in the ultrasound-targeted regions.
Detection of Gd(rhodamine-pip-DO3A) with MRI
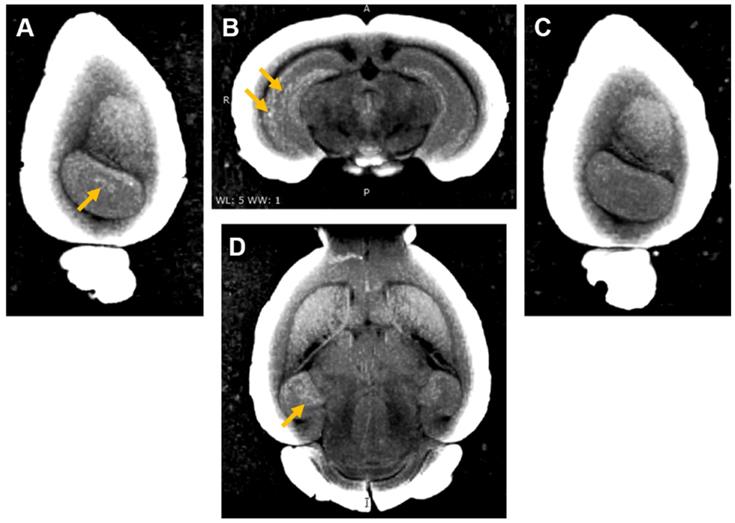
Three of the mouse brains where Gd(rhodamine-pip-DO3A) was delivered were then used to perform ex vivo MRI scans to check whether the probe could be detected by MRI as well as fluorescence microscopy. An increased brightness in T1 images was observed within the left hippocampus where the probe had been delivered (Figure 8 A, B, D). The amount of probe detected in the left hippocampus compared to the control right hippocampus was quantified with the normalized signal intensity, which showed a higher intensity detected in the left hippocampus compared to the control regions in all quantified images (Figure S6). After the MRI scans, the brains were sectioned to visualise the location of the fluorescence compared to that of the increased MRI contrast. Higher signal was detected in similar regions in both MRI (Figure 8) and fluorescence (Figure S7) images.
Ex vivo MRI images of brain with Gd(rhodamine-pip-DO3A) delivery to the left hemisphere. (A) Sagittal, (B) coronal and (D) axial MR views show enhanced T1 contrast in the left hippocampus compared to the (C) contralateral side. The localized distribution of the signal (arrows) confirms the targeted delivery of Gd(rhodamine-pip-DO3A). The periphery of the brain slices has a high intensity due to the increased contrast applied to the images to visualise the probe.
A binding assay of Gd(rhodamine-pip-DO3A) against serum albumin, an abundant protein in the blood, was also performed to assess the interaction of the complex with endogenous albumin in the blood, a factor which can increase the relaxivity of Gd-based contrast agents. Gd(rhodamine-pip-DO3A) was found to interact with albumin as the intrinsic fluorescence emission of serum albumin was quenched upon increasing titration of the probe (Figure S8).
Discussion
Our biologically compatible imaging agent was designed and prepared by combining a fluorescent moiety with a gadolinium chelate, resulting in a dual-modal compound. The ability to image with both fluorescence microscopy and MRI can provide complimentary information about neuronal morphology and physiology. As a result this ability could be used synergistically to achieve high anatomical resolution and depth penetration (MRI) as well as high sensitivities using optical imaging in preclinical research [60,61].
Our chosen fluorophore, rhodamine B, has been locked into a ring-opened, fluorescent form, which is also cationic to facilitate cellular uptake (Figure 3). For chelate design, one of the main considerations is to ensure that Gd3+ ions are not released into a physiological system as these have been shown to be toxic [62]. DOTA-derived, macrocyclic ligand systems have been used extensively to chelate metals in biomedical applications, as they are known to form thermodynamically stable and kinetically inert coordination complexes [63]. Derivatives of this motif are also the ligand of choice in clinically approved contrast agents such as ProHance, Dotarem and Gadovist and are deemed to be comparatively stable in a physiological context [64-66].
Once prepared and purified, we assessed the photophysical properties of Gd(rhodamine-pip-DO3A) and found that the absorption and emission spectra were dominated by typical rhodamine-based signals (Figure 4) that are compatible with microscopy applications and did not substantially change with pH.
The relaxivity value of the compound was determined as 7.8 mM-1 s-1 at 400 MHz (25°C), which is higher than the approximately 3-5 mM-1s-1 usually expected for octadentate gadolinium chelates [67].
Relaxivity values are dependent on parameters such as hydration number, rotational correlation time and water exchange rates, which are influenced by chemical design principles [68]. One of the common factors that lead to increased relaxivity values is an increase in molecular weight or rigidity and a corresponding increase in rotational correlation time.
Another possibility is that relaxivity increases are due to the exchange rates of solvent water molecules, which are largely influenced by the local geometry of the macrocycle encapsulating the Gd3+ ion. By estimating the SAP to TSAP ratio in the Eu3+ analogue [59], we were able to conclude that our compound is likely to have a relatively high TSAP prevalence compared to the parent DOTA complex (~36 % compared to ~15 % for the DOTA complex [69]), which may be the cause for the high relaxivity value.
Next, to deliver the compound into the intended brain region, a method using focused ultrasound and microbubbles was employed. This technique has been previously used to transport Gd-based contrast agents into the brain to visualise the increase in BBB permeability following ultrasound treatment [31-33]. More recently, ultrasound has been utilized to aid the delivery of liposomes labeled with both gadolinium and rhodamine through the BBB to verify liposome delivery via MRI and optically [70]. However, to the best of our knowledge, no optical-MRI probe designed to image neurons has been delivered using this methodology.
In general, Gd-based contrast agents are considered to be extracellular probes due to their hydrophilic nature, however, based on previous studies, we hypothesized that adding a cationic rhodamine derivative to the Gd-DO3A complex would enhance its neuronal uptake [5,16]. Specifically, lipophilic and positively charged species typically permeate cellular membranes in response to the membrane potential, which we sought to achieve by incorporating a positive charge [71,72].
As anticipated, Gd(rhodamine-pip-DO3A) was taken up by cells across all ultrasound-treated regions. Regions with less uptake were observed at the edges of the treated regions, showing that the lower ultrasound pressure led to less probe being delivered [44]. Cells that showed uptake on the fluorescence channel also showed a darker contrast in the bright field images.
Cellular uptake of Gd(rhodamine-pip-DO3A) was only observed in neurons, while microglia and astrocytes did not show any co-localization with the probe. Neuronal uptake mostly depends on the properties of the probe itself and how cell permeable it is, while microglia and astrocytes will both participate in the removal of unwanted molecules to maintain optimal neural function [73]. Microglia are the resident immune cells of the brain and one of their main roles is to phagocytose unwanted molecules, dying or dead cells, and axons to maintain homeostasis in the brain [17]. Astrocytes also participate in this process by driving the phagocytic activity of microglia [74,75]. From our results, we see that microglia and astrocytes are not uptaking the probe, indicating that neurons are being labeled without these glial cells phagocytosing the probe to remove it from the brain. We suggest that rhodamine could be labeling neurons, not only due to its cationic and lipophilic properties, but also due to a facilitated receptor-mediated uptake. However, in our study we only explored uptake immediately after the ultrasound treatment. In the future, uptake will be explored at later time points as this could be a time-sensitive process. In addition, some of the microglia within the treated regions appear to have a more rounded shape and shorter processes, which is an indication of the microglia being activated [76]. To identify astrocytes, we stained brain slices for GFAP, which is a standard method to visualise reactive astrocytes [77]. Astrocyte staining was observed very clearly in all treated regions of the brain but not in the opposite control sides, indicating that the astrocytes could be in a reactive state. Such a response could be occurring due to the presence of the probe itself but also in response to the microbubbles stimulating the blood vessels when increasing the permeability of the BBB. As expected, the smaller 1 kDa Gd(rhodamine-pip-DO3A) probe was delivered across a larger region compared to the 3 kDa dextran molecule. Such observation agrees with the size-threshold effect observed using this ultrasound technology [34,38,78]. At the edges of the ultrasound-treated region, the ultrasound pressure is lower which would allow the Gd-complex through but not the larger dextran. In addition, the distribution of the probes was found to be significantly different. Gd(rhodamine-pip-DO3A), as would be expected from a smaller probe, was distributed uniformly across the treated region. This is advantageous if interested in labeling all the cells within a specific region or for treatment purposes if a theranostic probe were to be used instead. The dextran, however, was delivered in spot-like patterns, mainly around blood vessels. This difference in distribution could be due to the larger size of the probe but also to the different properties of the compounds themselves, such as surface properties and lipophilicity. When delivering larger compounds such as dextran, a more uniform distribution could be obtained by emitting a different ultrasound sequence, such as rapid short-pulses (RaSP) [44]. These shorter pulses have been shown to improve the delivered distribution as well as safety aspects, such as faster blood-brain barrier closing (< 10 min) and reduced albumin extravasation into the brain (3-4 fold less). These short pulses could be the answer to some of the safety issues of this ultrasound technology that have recently been a topic of debate [79-82]. Dextran is also eliciting an immune response, with microglial uptake, whilst Gd(rhodamine-pip-DO3A) is not. The larger dextran molecules could be recognized faster by the immune system as being foreign due to their size and other properties.
Detection of the delivered probe by both MRI and fluorescence allows the advantages of both imaging modalities to be exploited when studying neurons in vivo. Previous studies have reported a lack of MRI enhancement when using Gd-rhodamine-derived probes [5]. In our study, MRI enhancement was detectable in the ex vivo brain and both fluorescence and MRI signals were detected in similar regions. However, as the sensitivity of MRI contrast agents is inherently lower than that of optical agents [83], it is possible that not all the regions where the probe was delivered are visible in the MRI images.
Lastly, the probe was found to interact with albumin in vitro, which we would expect to occur in vivo given that albumin is the most abundant protein in blood [84]. The interaction of the probe with albumin would increase its MRI signal [85]. We have previously shown that albumin crosses the BBB in certain regions with the same ultrasound parameters as those used in this study [44]; however, because albumin is 67 kDa in size, we would expect there to be regions where the probe alone would cross the BBB, whilst albumin would not. Thus, it is possible that we are detecting both the probe itself and the albumin-conjugated probe.
Despite our ability to detect neurons using a dual-modal probe delivered with focused ultrasound, further improvements can be made. In this study, cellular uptake and response to the probe were investigated immediately after the ultrasound-treatment was terminated, allowing the probe under ten minutes to enter the brain and interact with the environment. Looking at these interactions at later time points would enable a more comprehensive understanding of how long the neurons are labeled for and whether the probe would interact with microglia and astrocytes later in time. It could also give insight into how quickly the probe is cleared from the brain. However, the main purpose of this specific dual-modal probe is to facilitate the study of neuronal morphology and physiology rather than for clinical applications, where concerns regarding the presence of free gadolinium in the brain are higher [86]. In future work, we will deliver the probe using a RaSP ultrasound sequence, given the evidence of improved efficacy and safety [44]. This sequence could improve the immune response, reducing microglial and astrocyte activation.
An alternative method to analyse the fluorescence signal in the different cell types, could be to use flow cytometry. This technique has been shown to separate neurons from glia cells allowing quantitative analysis without the need for transgenic models [87]. In the future, we will also investigate the subcellular localization of our synthesized probe, which was detected in the nucleus and cytoplasm with some small high intensity regions. Acquiring higher magnification confocal images of these cells could help identify these high intensity regions. Furthermore, GFAP staining was performed in this study to identify astrocytes. However, GFAP, as mentioned previously, does not label all non-reactive astrocytes as not all these cells express detectable levels of GFAP. In the future we will stain for alternative astrocyte markers to identify non-reactive as well as reactive astrocytes.
Lastly, the location of the probe was detected via MRI in ex vivo brains which allows for longer scanning time and therefore higher resolution. In vivo, the lower resolution could make the probe more difficult to detect, however, the tissue would not be processed and therefore the scanning would be done sooner compared to this study, where the brains were extracted straight after the treatment and then processed for several days before scanning. Under in vivo conditions, waiting longer after the ultrasound treatment could give the probe more time to diffuse and improve the MRI signal. In future work, we intend to detect the probe via in vivo MRI and explore some of the applications of this probe, such as studying changes in neuronal density during development and in specific disease states.
Conclusions
We have herein introduced a method to image neurons with a dual-modal MRI/optical imaging agent delivered non-invasively and locally to the brain using focused ultrasound and microbubbles. We prepared a gadolinium complex combined with a fluorescent rhodamine unit (Gd(rhodamine-pip-DO3A)) and found that its fluorescence and relaxivity properties were suitable for in vivo applications. The probe was delivered locally to the left hemisphere of mice using focused ultrasound and microbubbles and was found to spread uniformly (COV = 0.4 ± 0.05). Its cellular uptake was confirmed in neurons, while microglia and astrocytes, although present, did not uptake the probe. Compared to the more conventionally used Texas-Red dextran, the probe, which was substantially smaller in size, had a more uniform distribution and elicited less of an immune response with no microglial uptake. Gd(rhodamine-pip-DO3A) was detected via both fluorescence and MRI ex vivo. The delivery of such dual-modal agents into neurons could facilitate the study of neuronal morphology and physiology using the advantages of both imaging modalities.
Abbreviations
13C-NMR: carbon nuclear magnetic resonance; 1H-NMR: proton nuclear magnetic resonance; 3D: three dimensions; BBB: blood-brain barrier; BM: Bohr magneton; BODIPY: boron dipyrromethene; br: broad; BSA: bovine serum albumin; COV: coefficient of variation; CPPs: cell penetrating peptides; Cy7: cyanine 7; d: doublet; dB: decibel; DCM: dichloromethane; DO3A: Tetraazacyclododecane-1,4,7-triacetic acid; DOTA: Tetraazacyclododecane-1,4,7,10-tetraacetic acid; ES+: electrospray ionization; FITC: fluorescein isothiocyanate; FLASH: fast low angle shot; Gd: gadolinium; GFAP: glial fibrillary acidic protein; H&E: haematoxylin & eosin; H&L: heavy and light; HeLa: human cervical cancer cells; Hz: hertz; Iba1: ionized calcium binding adaptor molecule 1; IgG: immunoglobulin; IHC: immunohistochemistry; KSV: quenching constants; m: multiplet; MALDI: matrix assisted laser desorption/ionization; MIP: maximum intensity projections; MR: magnetic resonance; MRI: magnetic resonance imaging; NeuN: neuronal nuclei; NMR: nuclear magnetic resonance; NOD: normalized optical density; OCT: optimal cutting temperature; PBS: phosphate buffered saline; PC: personal computer; PCD: passive cavitation detector; Pip: piperazine; Pneg: peak negative pressure; ppm: part per million; q: quartet; r1: relaxivity; RT: room temperature; s: singlet; SAP: square antiprism; sbr: broad singlet; t: triplet; T1: longitudinal relaxation time; TE: echo time; TFA: trifluoroacetic acid; ToF: time of flight; TR: repetition time; TSAP: twisted square antiprism.
Supplementary Material
Supplementary information and figures.
Acknowledgements
The PhD studentships of S.V.M., T.G.C. and T.B. were funded by King's and Imperial College London EPSRC Centre for Doctoral Training in Medical Imaging (EP/L015226/1) and the EPSRC Centre for Neurotechnology (EP/L016737/1). This study used equipment from the Facility for Imaging by Light Microscopy (FILM) at Imperial College London, supported by funding from the Wellcome Trust (grant 104931/ZS/14/Z) and BBSRC (grant BB/L015129/1). N.J.L. is grateful for a Royal Society Wolfson Research Merit Award. The authors would also like to thank Auxtine Micalet and Javier Cudeiro Blanco for their help and support.
Competing Interests
The authors have declared that no competing interest exists.
References
1. Caravan P, Ellison JJ, McMurry TJ, Lauffer RB. Gadolinium(III) chelates as MRI contrast agents: structure, dynamics, and applications. Chem Rev. 1999;99:2293-352
2. Bünzli JCG, Piguet C. Lanthanide-containing molecular and supramolecular polymetallic functional assemblies. Chem Rev. 2002;102:1897-928
3. Aime S, Botta M, Fasano M, Terreno E. Prototropic and water-exchange processes in aqueous solutions of Gd(III) chelates. Acc Chem Res. 1999;32:941-9
4. Jacobs RE, Ahrens ET, Mead TJ, Fraser SE. Looking deeper into vertebrate development. Trends Cell Biol. 1999;9:73-6
5. Hüber MM, Staubli AB, Kustedjo K. et al. Fluorescently detectable magnetic resonance imaging agents. Bioconjug Chem. 1998;9:242-9
6. Lux J, Sherry AD. Advances in gadolinium-based MRI contrast agent designs for monitoring biological processes in vivo. Curr Opin Chem Biol. 2018;45:121-30
7. Louie AY, Hüber MM, Ahrens ET. et al. In vivo visualization of gene expression using magnetic resonance imaging. Nat Biotechnol. 2000;18:321-235
8. Kayyem J, Kumar RM, Fraser SE, Meade TJ. Receptor-targeted co-transport of DNA and magnetic resonance contrast agents. Chem Biol. 1995;2:615-20
9. Heckl S, Debus J, Jenne J. et al. CNN-Gd3+enables cell nucleus molecular imaging of prostate cancer cells: The last 600 nm. Cancer Res. 2002;62:7018-24
10. Bhorade R, Weissleder R, Nakakoshi T, Moore A, Tung CH. Macrocyclic chelators with paramagnetic cations are internalized into mammalian cells via a HIV-tat derived membrane translocation peptide. Bioconjug Chem. 2000;11:301-5
11. Allen MJ, Meade TJ. Synthesis and visualization of a membrane-permeable MRI contrast agent. J Biol Inorg Chem. 2003;8:746-50
12. Lewin M, Carlesso N, Tung CH. et al. Tat peptide-derivatized magnetic nanoparticles allow in vivo tracking and recovery of progenitor cells. Nat Biotechnol. 2000;18:410-4
13. Mishra R, Su W, Pohmann R. et al. Cell-penetrating peptides and peptide nucleic acid-coupled MRI contrast agents: Evaluation of cellular delivery and target binding. Bioconjug Chem. 2009;20:1860-8
14. Allen MJ, MacRenaris KW, Venkatasubramanian PN, Meade TJ. Cellular delivery of MRI contrast agents. Chem Biol. 2004;11:301-7
15. Verdurmen WPR, Brock R. Biological responses towards cationic peptides and drug carriers. Trends Pharmacol Sci. 2011;32:116-24
16. Yamane T, Hanaoka K, Muramatsu Y. et al. Method for enhancing cell penetration of Gd 3+-based MRI contrast agents by conjugation with hydrophobic fluorescent dyes. Bioconjug Chem. 2011;22:2227-36
17. Mishra A, Pfeuffer J, Mishra R. et al. A new class of gel-based DO3A-ethylamine-derived targeted contrast agents for MR and optical imaging. Bioconjug Chem. 2006;17:773-80
18. Jasanoff A. MRI contrast agents for functional molecular imaging of brain activity. Curr Opin Neurobiol. 2007;17:593-600
19. Jasanoff A. Functional MRI using molecular imaging agents. Trends Neurosci. 2005;28:120-6
20. Thanos S, Bonhoeffer F. Investigations on the development and topographic order of retinotectal axons: Anterograde and retrograde staining of axons and perikarya with rhodamine in vivo. J Comp Neurol. 1983;219:420-30
21. Thanos S, Vidal-Sanz M, Aguayo AJ. The use of rhodamine-B-isothiocyanate (RITC) as an anterograde and retrograde tracer in the adult rat visual system. Brain Res. 1987;406:317-21
22. Ogilvy CS, Borges LF. A quantitative analysis of the retrograde axonal transport of 4 different fluorescent dyes in peripheral sensory and motor neurons and lack of anterograde transport in the corticospinal system. Brain Res. 1988;475:244-53
23. Rivas C, Stasiuk GJ, Gallo J, Minuzzi F, Rutter GA, Long NJ. Lanthanide(III) complexes of rhodamine-DO3A conjugates as agents for dual-modal imaging. Inorg Chem. 2013;52:14284-93
24. Chen X, Pradhan T, Wang F, Kim JS, Yoon J. Fluorescent chemosensors based on spiroring-opening of xanthenes and related derivatives. Chem Rev. 2012;112:1910-56
25. Soh JH, Swamy KMK, Kim SK, Kim S, Lee SH, Yoon J. Rhodamine urea derivatives as fluorescent chemosensors for Hg2+. Tet. Lett. 2007;48:5966-5969
26. Abbott NJ, Patabendige AAK, Dolman DEM, Yusof SR, Begley DJ. Structure and function of the blood-brain barrier. Neurobiol Dis. 2010;37:13-25
27. Pardridge WM. The blood-brain barrier: bottleneck in brain drug development. NeuroRx. 2005; 2: 3-14. <http://www.ncbi.nlm.nih.gov/pubmed/15717053%5Cnhttp://. www.pubmedcentral.nih.gov/articlerender.fcgi?artid=PMC539316>
28. Weinmann HJ, Brasch RC, Press WR, Wesbey GE. Characteristics of gadolinium-DTPA complex: A potential NMR contrast agent. Am J Roentgenol. 1984;142:619-24
29. Kroll RA, Neuwelt EA. Outwitting the blood-brain barrier for therapeutic purposes: Osmotic opening and other means. Neurosurgery. 1998;42:1083-99
30. Scheld WM. Drug delivery to the central nervous system: General principles and relevance to therapy for infections of the central nervous system. Rev Infect Dis. 1989;11:S1669-1690
31. Hynynen K, McDannold N, Vykhodtseva N, Jolesz F a. Noninvasive MR imaging-guided focal opening of the blood-brain barrier in rabbits. Radiology. 2001;220:640-6
32. Lamsam L, Johnson E, Connolly ID, Wintermark M, Hayden Gephart M. A review of potential applications of MR-guided focused ultrasound for targeting brain tumor therapy. Neurosurg Focus. 2018;44:E10
33. Sheikov N, McDannold N, Vykhodtseva N, Jolesz F, Hynynen K. Cellular mechanisms of the blood-brain barrier opening induced by ultrasound in presence of microbubbles. Ultrasound Med Biol. 2004;30:979-89
34. Choi JJ, Wang S, Tung YS, Morrison B, Konofagou EE. Molecules of various pharmacologically-relevant sizes can cross the ultrasound-induced blood-brain barrier opening in vivo. Ultrasound Med Biol. 2010;36:58-67
35. Choi JJ, Selert K, Vlachos F, Wong A, Konofagou EE. Noninvasive and localized neuronal delivery using short ultrasonic pulses and microbubbles. Proc Natl Acad Sci USA. 2011;108:16539-44
36. Wang S, Baseri B, Choi JJ, Tung YS, Morrison B, Konofagou EE. Delivery of fluorescent dextrans through the ultrasound-induced blood-brain barrier opening in mice. In: Proceedings - IEEE Ultrasonics Symposium. 2008
37. Lin CY, Liu TM, Chen CY. et al. Quantitative and qualitative investigation into the impact of focused ultrasound with microbubbles on the triggered release of nanoparticles from vasculature in mouse tumors. J Control Release. 2010;146:291-8
38. Chan TG, Morse S V, Copping MJ, Choi JJ, Vilar R. Targeted delivery of DNA-Au nanoparticles across the blood-brain barrier using focused ultrasound. ChemMedChem. 2018;13:1311-4
39. Liu HL, Hua MY, Chen PY. et al. Blood-brain barrier disruption with focused ultrasound enhances delivery of chemotherapeutic drugs for glioblastoma treatment. Radiology. 2010;255:415-25
40. McDannold N, Zhang Y, Supko JG. et al. Acoustic feedback enables safe and reliable carboplatin delivery across the blood-brain barrier with a clinical focused ultrasound system and improves survival in a rat glioma model. Theranostics. 2019;9:6284-99
41. Kinoshita M, Hynynen K. Intracellular delivery of peptides and siRNAs using microbubble enhanced focused ultrasound. In: AIP Conference Proceedings. 2006
42. Liao AH, Chou HY, Hsieh YL, Hsu SC, Wei KC, Liu HL. Enhanced therapeutic epidermal growth factor receptor (EGFR) antibody delivery via pulsed ultrasound with targeting microbubbles for glioma treatment. J Med Biol Eng. 2015;35:156-64
43. Jordão JF, Ayala-Grosso CA, Markham K. et al. Antibodies targeted to the brain with image-guided focused ultrasound reduces amyloid-β plaque load in the TgCRND8 mouse model of Alzheimer's disease. PLoS One. 2010;5:e10549
44. Morse S V, Pouliopoulos AN, Chan TG. et al. Rapid Short-pulse Ultrasound Delivers Drugs Uniformly across the Murine Blood-Brain Barrier with Negligible Disruption. Radiology. 2019;291:459-66
45. Corsi DM, Platas-Iglesias C, Van Bekkum H, Peters JA. Determination of paramagnetic lanthanide(III) concentrations from bulk magnetic susceptibility shifts in NMR spectra. Magn Reson Chem. 2001;39:723-6
46. Choi JJ, Pernot M, Small SA, Konofagou EE. Noninvasive, transcranial and localized opening of the blood-brain barrier using focused ultrasound in mice. Ultrasound Med Biol. 2007;33:95-104
47. Pardridge WM. Blood-brain barrier drug targeting: the future of brain drug development. Mol Interv. 2003;3:90-105
48. Dunand FA, Borel A, Merbach AE. How does internal motion influence the relaxation of the water protons in LnIIIDOTA-like complexes? J Am Chem Soc. 2002;124:710-6
49. Kim HN, Lee MH, Kim HJ, Kim JS, Yoon J. A new trend in rhodamine-based chemosensors: Application of spirolactam ring-opening to sensing ions. Chem. Soc. Rev. 2008;37:1465-1472
50. Yapici NB, Mandalapu S, Gibson KM, Bi LR. Targeted fluorescent probes for detection of oxidative stress in the mitochondria. Bioorg. Med. Chem. Lett. 2015;25:34763-480
51. Caravan P. Strategies for increasing the sensitivity of gadolinium based MRI contrast agents. Chem Soc Rev. 2006;35:512-23
52. Rohrer M, Bauer H, Mintorovitch J, Requardt M, Weinmann HJ. Comparison of magnetic properties of MRI contrast media solutions at different magnetic field strengths. Invest Radiol. 2005;40:715-24
53. Aime S, Botta M, Fasano M. et al. Conformational and coordination equilibria on DOTA complexes of lanthanide metal ions in aqueous solution studied by 1H-NMR spectroscopy. Inorg Chem. 1997;36:2059-68
54. Meyer M, Dahaoui-Gindrey V, Lecomte C, Guilard R. Conformations and coordination schemes of carboxylate and carbamoyl derivatives of the tetraazamacrocycles cyclen and cyclam, and the relation to their protonation states. Coord Chem Rev. 1998;178-180:1313-405
55. Opina ACL, Strickland M, Lee YS. et al. Analysis of the isomer ratios of polymethylated-DOTA complexes and the implications on protein structural studies. Dalton Trans. 2016;45:4673-87
56. Delli Castelli D, Caligara MC, Botta M, Terreno E, Aime S. Combined high resolution NMR and 1H and 17O relaxometric study sheds light on the solution structure and dynamics of the Lanthanide(III) complexes of HPDO3A. Inorg Chem. 2013;52:7130-8
57. Peters JA, Huskens J, Raber DJ. Lanthanide induced shifts and relaxation rate enhancements. Prog Nucl Magn Reson Spectrosc. 1996;28:283-350
58. Blahut J, Hermann P, Tošner Z, Platas-Iglesias C. A combined NMR and DFT study of conformational dynamics in lanthanide complexes of macrocyclic DOTA-like ligands. Phys Chem Chem Phys. 2017;19:26662-71
59. Isley WC, Zarra S, Carlson RK. et al. Predicting paramagnetic 1H NMR chemical shifts and state-energy separations in spin-crossover host-guest systems. Phys Chem Chem Phys. 2014;16:10620-8
60. James ML, Gambhir SS. A molecular imaging primer: Modalities, imaging agents, and applications. Physiol Rev. 2012;92:897-965
61. Rudin M, Weissleder R. Molecular imaging in drug discovery and development. Nat Rev Drug Discov. 2003;2:123-31
62. Rogosnitzky M, Branch S. Gadolinium-based contrast agent toxicity: a review of known and proposed mechanisms. BioMetals. 2016;29:365-76
63. Sherry AD, Caravan P, Lenkinski RE. Primer on gadolinium chemistry. J Magn Reson Imaging. 2009;30:1240-8
64. Wang X, Jin T, Comblin V, Lopez-Mut A, Merciny E, Desreux JF. A kinetic investigation of the lanthanide DOTA chelates. Stability and rates of formation and of dissociation of a macrocyclic gadolinium(III) polyaza polycarboxylic MRI contrast agent. Inorg Chem. 1992;31:1095-9
65. Hermann P, Kotek J, Kubíček V, Lukeš I. Gadolinium(III) complexes as MRI contrast agents: Ligand design and properties of the complexes. Dalton Trans. 2008;23:3027-47
66. Van Eldik R, Hubbard CD. Adv. Inorg. Chem. 2016;68:xiii-xiv
67. Yang CT, Chuang KH. Gd(iii) chelates for MRI contrast agents: From high relaxivity to 'smart', from blood pool to blood-brain barrier permeable. Medchemcomm. 2012;3:552-65
68. Faulkner S, Blackburn OA. The chemistry of lanthanide MRI contrast agents. In: The Chemistry of Molecular Imaging, Wiley. 2015:179-98
69. Tircso G, Webber BC, Kucera BE, Young VG, Woods M. Analysis of the conformational behavior and stability of the SAP and TSAP isomers of lanthanide(III) NB-DOTA-type chelates. Inorg Chem. 2011;50:7966-79
70. Aryal M, Papademetriou I, Zhang YZ, Power C, McDannold N, Porter T. MRI monitoring and quantification of ultrasound-mediated delivery of liposomes dually Labeled with gadolinium and fluorophore through the blood-brain barrier. Ultrasound Med Biol. 2019;45:1733-42
71. Ross MF, Kelso GF, Blaikie FH. et al. Lipophilic triphenylphosphonium cations as tools in mitochondrial bioenergetics and free radical biology. Biokhimiya. 2005;70:222-30
72. Davis S, Weiss MJ, Wong JR, Lampidis TJ, Chen LB. Mitochondrial and plasma membrane potentials cause unusual accumulation and retention of rhodamine 123 by human breast adenocarcinoma-derived MCF-7 cells. J Biol Chem. 1985;260:13844-50
73. Galloway DA, Phillips AEM, Owen DRJ, Moore CS. Phagocytosis in the brain: Homeostasis and disease. Front Immunol. 2019;10:1-15
74. Lenz KM, Nelson LH. Microglia and beyond: Innate immune cells as regulators of brain development and behavioral function. Front Immunol. 2018;9:698
75. Vainchtein ID, Chin G, Cho FS. et al. Astrocyte-derived interleukin-33 promotes microglial synapse engulfment and neural circuit development. Science (80- ). 2018;359:1269-73
76. Kreutzberg GW. Microglia: A sensor for pathological events in the CNS. Trends Neurosci. 1996;19:312-8
77. Sofroniew M V, Vinters H V. Astrocytes: biology and pathology. Acta Neuropathol. 2010;119:7-35
78. Valdez MA, Fernandez E, Matsunaga T, Erickson RP, Trouard TP. Distribution and diffusion of macromolecule delivery to the brain via focused ultrasound using magnetic resonance and multispectral fluorescence imaging. Ultrasound Med Biol. 2019;46:122-36
79. Kovacs ZI, Kim S, Jikaria N. et al. Disrupting the blood-brain barrier by focused ultrasound induces sterile inflammation. Proc Natl Acad Sci USA. 2017;114:E75-84
80. McMahon D, Hynynen K. Reply to Kovacs et al.: Concerning acute inflammatory response following focused ultrasound and microbubbles in the brain. Theranostics. 2018;8:2249-50
81. Kovacs ZI, Burks SR, Frank JA. Focused ultrasound with microbubbles induces sterile inflammatory response proportional to the blood brain barrier opening: Attention to experimental conditions. Theranostics. 2018;8:2245-8
82. Kovacs ZI, Tu TW, Sundby M. et al. MRI and histological evaluation of pulsed focused ultrasound and microbubbles treatment effects in the brain. Theranostics. 2018;8:4837-55
83. Frullano L, Meade TJ. Multimodal MRI contrast agents. J Biol Inorg Chem. 2007;12:939-49
84. Nadal A, Fuentes E, McNaughton PA. Glial cell responses to lipids bound to albumin in serum and plasma. Prog Brain Res. 2001;132:367-74
85. Caravan P. Protein-targeted gadolinium-based magnetic resonance imaging (MRI) contrast agents: Design and mechanism of action. Acc Chem Res. 2009;42:851-62
86. Gulani V, Calamante F, Shellock FG, Kanal E, Reeder SB. Gadolinium deposition in the brain: Summary of evidence and recommendations. Lancet Neurol. 2017;16:564-70
87. Guez-Barber D, Fanous S, Harvey BK. et al. FACS purification of immunolabeled cell types from adult rat brain. J Neurosci Methods. 2012;203:10-8
Author contact
![]() Corresponding author: Nicholas Long, Ph.D., E-mail: n.longac.uk; Phone: +44 20 75 94 57 81.
Corresponding author: Nicholas Long, Ph.D., E-mail: n.longac.uk; Phone: +44 20 75 94 57 81.