Impact Factor
 Global reach, higher impact
Theranostics 2020; 10(10):4359-4373. doi:10.7150/thno.44298 This issue Cite
Review
Signal amplification and quantification on lateral flow assays by laser excitation of plasmonic nanomaterials
Haihang Ye1, Yaning Liu1, Li Zhan2, Yilin Liu2, Zhenpeng Qin1,3,4,5 ![]()
1. Department of Mechanical Engineering, University of Texas at Dallas, Richardson, Texas 75080, USA.
2. Department of Mechanical Engineering, University of Minnesota, 111 Church Street SE, Minneapolis, Minnesota 55455, USA
3. Department of Bioengineering, University of Texas at Dallas, Richardson, Texas 75080, USA
4. Center for Advanced Pain Studies, University of Texas at Dallas, Richardson, Texas 75080, USA
5. Department of Surgery, The University of Texas Southwestern Medical Center, 5323 Harry Lines Blvd, Dallas, Texas 75390, USA
Received 2020-1-26; Accepted 2020-2-23; Published 2020-3-15
Abstract

Lateral flow assay (LFA) has become one of the most widely used point-of-care diagnostic methods due to its simplicity and low cost. While easy to use, LFA suffers from its low sensitivity and poor quantification, which largely limits its applications for early disease diagnosis and requires further testing to eliminate false-negative results. Over the past decade, signal enhancement strategies that took advantage of the laser excitation of plasmonic nanomaterials have pushed down the detection limit and enabled quantification of analytes. Significantly, these methods amplify the signal based on the current LFA design without modification. This review highlights these strategies of signal enhancement for LFA including surface enhanced Raman scattering (SERS), photothermal and photoacoustic methods. Perspectives on the rational design of the reader systems are provided. Future translation of the research toward clinical applications is also discussed.
Keywords: lateral flow assay, gold nanoparticles, SERS, signal amplification and quantification, nanoparticle heating
Introduction
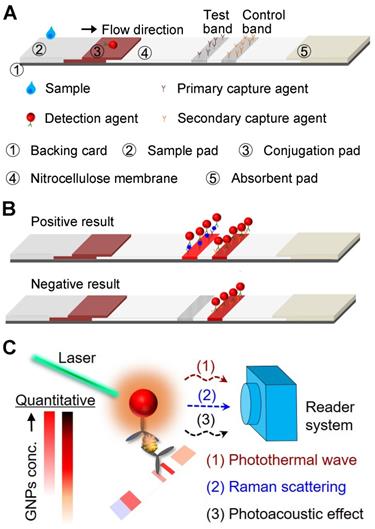
Lateral flow assay (LFA) is one of the most widely used point-of-care (POC) diagnostic tests and can be performed simply and rapidly without specially trained personnel [1-3]. LFA is also cost-effective that allows the easy access to large populations in resource-limited settings. A standard LFA is performed on a paper-based device, and its architecture consists of a sample pad, a conjugation pad, a capillary membrane, and an absorbent pad on a plastic backing card (Figure 1A). For a sandwich-type LFA, the presence of both test and control bands indicates a positive result (Figure 1B). Alternatively, competitive-type LFA is developed with opposite sensing mode. Details of this LFA format could be found in published work elsewhere [4].
Schematics showing the (A) working principle and components of a sandwich-type LFA. (B) Signal readout for positive and negative results of LFA, where the test band shows the signal of detection and the control band functions for the validation. (C) The outline of sensing modes induced by the laser-GNP interaction for the sensitive and quantitative detection on LFA that were elaborated in the review.
Broader applications of LFA have been mainly limited by two factors: the lack of quantification and the low sensitivity, due to the weak optical signal from the detection agents [5]. In fact, the conventional LFA is intentionally designed for qualitative (i.e., yes or no) or semi-quantitative (refers to a color chart) tests so that the results could be read directly by naked eyes without additional instruments [6]. Thus, it only works for the tasks that involve a high concentration of analytes (e.g., ng/mL). These intrinsic limitations prevent the conventional LFA from becoming modern POC diagnostics. For example, the early-stage detection and management of severe and infectious diseases (e.g., COVID-19, [7]) requires rapid and sensitive detection at low analyte concentrations. So far, the analytical performance of conventional LFA is often insufficient to be standalone tests.
In the past decades, extensive efforts have been devoted to improving the sensitivity and quantification for LFA. Considering that the detection agent is the key for the signal generation, one idea is to utilize them with stronger signals to improve the diagnostic performance of LFA [8, 9]. Therefore, different types of detection agents have been developed including organic dyes [10], quantum dots [11, 12], upconverting nanoparticles (NPs) [13], latex beads [14, 15], noble-metal NPs [16, 17], carbon NPs [18, 19], colloidal selenium [20], and magnetic NPs [21]. Notably, these material innovations have advanced the limit of detection (LOD) into the level of pg/mL (vs. ng/mL of conventional LFA) and significantly broadened the applications. High-quality and scalable manufacturing of these nanomaterials is required to translate these techniques from the laboratory experiments to clinical use. Other strategies using additional reagents like metallic enhancement [22, 23], enzyme-based catalytic reactions [24, 25], and a combination of them [26] also lead to remarkable LOD improvement but add complexity to the LFA operation.
An attractive strategy that amplifies signals based on the current LFA design has emerged in the last 5-10 years. The strategy mainly relies on the laser excitation of plasmonic gold NPs (GNPs) and the subsequently generated signal is much stronger than the color signal, resulting in the LOD enhancement. Note, GNPs are the most frequently used detection agents for in vitro diagnostics, especially in LFA. Like other plasmonic nanomaterials, GNPs feature a unique phenomenon called localized surface plasmon resonance (LSPR), making themselves ideal candidates in this revolution [27, 28]. The LSPR comes from the strong interaction between light and GNPs, where the surface electrons of GNPs oscillate collectively with the electric field of light [29]. It also leads to localized effects including enhanced electromagnetic field and eventually heating [30-32]. Taken together, applying laser on the GNPs-based LFA provides a new route to benefit its analytical performance without modifying the current architecture and operation. There are several advantages to this approach. Firstly, it keeps the simplicity and rapidness of LFA and doesn't add complexity in performing the assay. Secondly, it offers additional sensing modes to the conventional LFA. The as-generated signals from GNPs can also serve as indicators to determine target concentration. Thirdly, a more sensitive and quantitative detection could be achieved by a laser-reader system. Reading the color signal by naked eyes, especially for weak color change, inevitably causes inconsistent result in LFA [2]. With the assistance of a reader, robust and consistent results could be realized. Lastly, the laser-reader systems could potentially be miniaturized as handheld devices with all-in-one platform, which is highly desirable for POC diagnostics. To our knowledge, a review of this special topic on laser-induced signal amplification for GNPs-based LFA is not available and will provide intriguing insights from both scientific findings and clinical applications.
In this review, we present the current status of LFA enhancement strategies that emerged over the past decade. Specifically, we will focus on methods that take advantage of laser excitation of plasmonic NPs and directly enhance signal based on the current LFA architecture, including surface enhanced Raman scattering, photothermal and photoacoustic methods (Figure 1C). For each method, we will introduce the principle of signal enhancement strategies, show its implementation on LFA and impacts on the sensitivity and quantification, examine the design of reader systems, and discuss potential limitations. We anticipate that the signal amplification techniques, as well as the perspectives provided in this article, serve as a guideline to explore novel sensing modes and detection approaches for the development of LFA towards highly sensitive POC diagnostics.
Laser-induced Signal Amplification Techniques
Surface enhanced Raman scattering (SERS) enhanced signal
Principle
Surface enhanced Raman scattering (SERS) is a sensing technique that generates and amplifies the inelastic light scattering of molecules when they are adsorbed on the metals (e.g., gold, silver, and copper) [33]. This scattering signal could be enhanced (up to 10 orders of magnitude) by modulating the frequency of excitation light and LSPR of the metallic nanomaterials, relevant to the Stokes and/or anti-Stokes lines of molecules [34]. In SERS-based assay, specific tags made of nanostructures and molecules with known Raman fingerprints are the detection agents. Measuring the peak intensity of Raman molecules allows for the quantification of particle and analyte concentrations. Consequently, SERS has become a powerful tool in diagnostics due to its rapid, sensitive, and multiplexed outcomes [33-35].
LFA demonstration
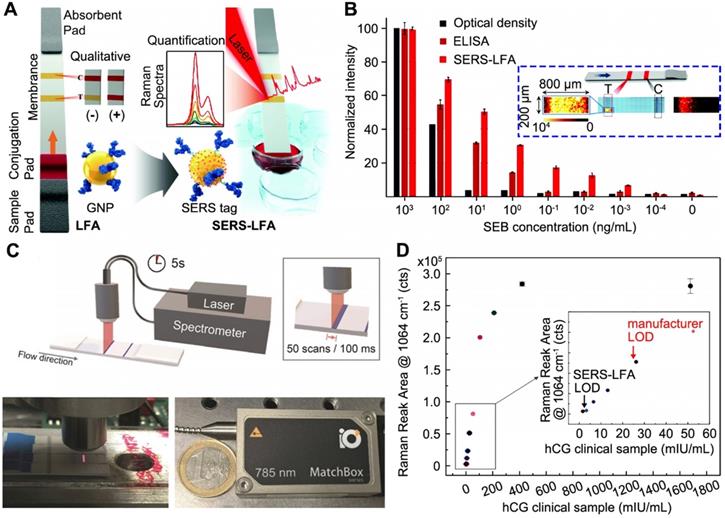
Utilizing SERS for LFA has been explored as a highly sensitive assay platform since 2007 [36]. In SERS-LFA, the assay operation is identical to that of a conventional LFA, except for the tags' preparation. In the work by Hwang et al. [37], Raman molecules and antibody-coated hollow GNPs were utilized as SERS tags for the LFA (Figure 2A). For the SERS signal readout, a completed LFA strip was scanned in a standard Raman microscope system for the measurement, where the SERS peak intensity of test band was monitored for quantitative analysis. Using staphylococcal enterotoxin B (SEB) as a model, the authors performed SERS-LFA, conventional LFA, and ELISA for comparison. SEB is one of the bacterial superantigens secreted from Staphylococcus aureus that infects immune system profoundly and leads to a wide range of infectious diseases [38]. The result shown in Figure 2B demonstrates that SERS increased detection range and improved LOD of LFA by 104-fold, and it was even 103-fold lower than that of ELISA. Particularly, for each strip characterization, a focused area (200 μm × 800 μm) of test band was used to collect the SERS signal, while the control band was tested for verification (see the inset in Figure 2B). Also, due to the uneven distribution of SERS signal on the test band, the average intensity of scanned regions was further used for the quantitative analysis. The concept of combining SERS with LFA for nucleic acids detection was also reported by the same group [39], and soon after that, this assay platform has been widely extended to different targets, including disease biomarkers [40] and pathogens [41].
Surface-enhanced Raman scattering (SERS)-based LFA with enhanced detection sensitivity. (A) Schematics showing the principle of measuring SERS signal on LFA strips with GNPs-based SERS tags. (B) Comparison of the analytical results obtained from the optical density of conventional LFA strips, ELISA, and present SERS-LFA strips in detection of staphylococcal enterotoxin B (SEB). Inset in blue box shows a typical focused scanning of test band (200 μm x 800 μm) and whole control band of LFA strip by SERS spectroscope system. T and C stands for test band and control band, respectively. (C) Schematic representation of a portable SERS reader with line-focused optical fiber probe laser. Scanning steps and time is shown in the box. Photographs show the custom-designed optical fiber probe and a 785 nm diode laser. (D) Dose response curve of the SERS signal after applying different concentrations of hCG clinical samples. Inset shows a linear SERS response at low hCG concentrations and the vertical line marks the LOD of SERS-LFA and commercially available LFA kits. Adapted with permission from [37, 54], copyright 2016 The Royal Society of Chemistry and 2019 The Authors, published by Wiley-VCH Verlag GmbH & Co. KGaA., respectively.
One major factor leads to highly sensitive SERS-LFA is deploying NPs with stronger plasmonic coupling effect. For example, nanostructures with “hot spots” were reported to enhance SERS signals, including plasmonic NPs with rough surface, coupled NPs with nanogaps, and multibranched nanostructures [42-44]. Also, the specific interaction (e.g., electron transfer) between the Raman molecules and the NPs allows further amplification of SERS signal [34]. Meanwhile, the stability of Raman signals is another direction that requires carefully design of the SERS tags. For instance, NPs with high uniformity and protection layers enable evenly distributed signal and avoid the loss of Raman reporters, respectively [45, 46]. Therefore, optimizing the shape and composition of the plasmonic NPs has great promise in the development of SERS-based diagnostics for the amplified and robust signal readouts.
SERS can also lead to multiplexed detection on LFA. Specifically, SERS tags encoded with different Raman molecules are conjugated to the detection antibodies for multiple targets [47, 48]. For example, Doering et al. demonstrated for the first time using Nanoplex Biotags (Au@SiO2 NPs, commercially available from Oxonica, Inc.) for the multiplexed detection of Flu A, Flu B, and respiratory syncytial virus on a standard LFA [36]. However, combining multiple targets in one test band, the as-obtained SERS spectrum could show overlapped or close peaks and may impact on the sensitivity of LFA [49, 50]. Arranging parallel test bands on the membrane could also achieve multiplexed detection, where each band associates to identify one of the targets [51]. This inevitably increases the assay time and reduces the signal throughput [52]. In addition, construction of microarray on LFA strips offers a promising solution to shorten the sample-to-answer time. For example, Zhang et al. demonstrated a multiplexed detection of respiratory tract infection pathogens (up to 11) by grouping two SERS tags and a 2×3 microarray as test dots on the LFA [53]. Collectively, further work could put more efforts in the nanostructure design, strip construction, and Raman reporter's selection for multiplexed detection on SERS-LFA.
Reader development
As a proof-of-principle, bulky Raman microscope system was used to measure the SERS signal of LFA, yet impractical for POC deployment. Recently, Tran et al. reported a portable SERS reader designed for rapid scanning of the LFA strips [54]. The compact setup mainly composed of an optical fiber probe and a 785 nm diode laser (Figure 2C). Taking advantage of the line focus of optical fiber probe, the laser illumination covers the entire width of strip and moves across step by step (0.1 s for each step and 50 steps per band), achieving 5 s acquisition time for the test band (4 mm × 0.8 mm) within an individual scan. In addition, this compact SERS-LFA platform showed improved diagnostic performance for the human chorionic gonadotropin (hCG) detection. Notably, in the work by Tran et al., Au-Ag core-satellite NPs were used as detection agents, which provided 4-fold visual LOD enhancement over the commercial LFA kits. While for SERS detection, the reader further lowered the LOD by 4-fold, thereby 16-fold improvement in total over the commercial LFA kit (Figure 2D).
Limitations
There are several limitations of SERS-LFA technique. Firstly, special design of the SERS tags with strongly enhanced local electromagnetic field are required to generate sufficient and robust Raman signals. For example, Au@SiO2 core-shell NPs, hollow GNPs, Au-Ag core-satellite NPs have been used in the above-mentioned work [36, 37, 54]. This could potentially lead to complexity and difficulty in SERS molecule encoding, antibody conjugation, and maintaining shelf stability. Secondly, the trade-off occurs between signal intensity and data acquisition settings. For instance, point scanning with long acquisition time favors for strong Raman signal. However, this compromises the working efficiency and only samples a limited fraction of the test band, which could lead to under-sampling and inconsistent results from test to test (i.e., low reproducibility). This issue also exists in some commercially available SERS readers (e.g., Snowy Range 'CBEx' Raman spectrometer, Laramie, USA) [55]. In contrast, increasing sampling area and reducing acquisition time result in significantly inferior performance. For instance, Hwang et al. reported 104-fold improvement by point scanning part of the test band (200 μm × 800 μm) with long acquisition time (6 min), while Tran et al. reported 4-fold improvement by line scanning the whole test band (4 mm × 0.8 mm) with short acquisition time (5 s). In addition, the line scanning requires more powerful laser (120 mW) compared with the point-scanning Raman microscope system (3 mW).
Photothermal enhanced signal
Thermal contrast amplification (TCA)
Principle
The heat generation of GNPs has been widely studied in the area of photothermal therapy for cancer treatment [56-59]. Briefly, when the LSPR of GNPs matches with the laser wavelength, they can efficiently convert light energy (photons) into heat. The amount of heat generation could be estimated by the following equation:
Q= NQnano= NCabsI
where the total heat generation (Q, W/m3) is the accumulated contribution of individual GNP (Qnano, W) and the particle concentration of GNPs (N, number/m3). Qnano could be further written as the product of GNP absorption cross-section (Cabs, m2) and laser intensity (I, W/m2). Clearly, the heat is proportional to the number of GNPs and laser energy applied within the detection region, and the Cabs is associated with the physical parameters of GNPs (e.g., size and shape) [32]. This sets the basis to use the heat generation from GNPs and integrate thermography techniques for potential diagnostic applications.
LFA demonstration
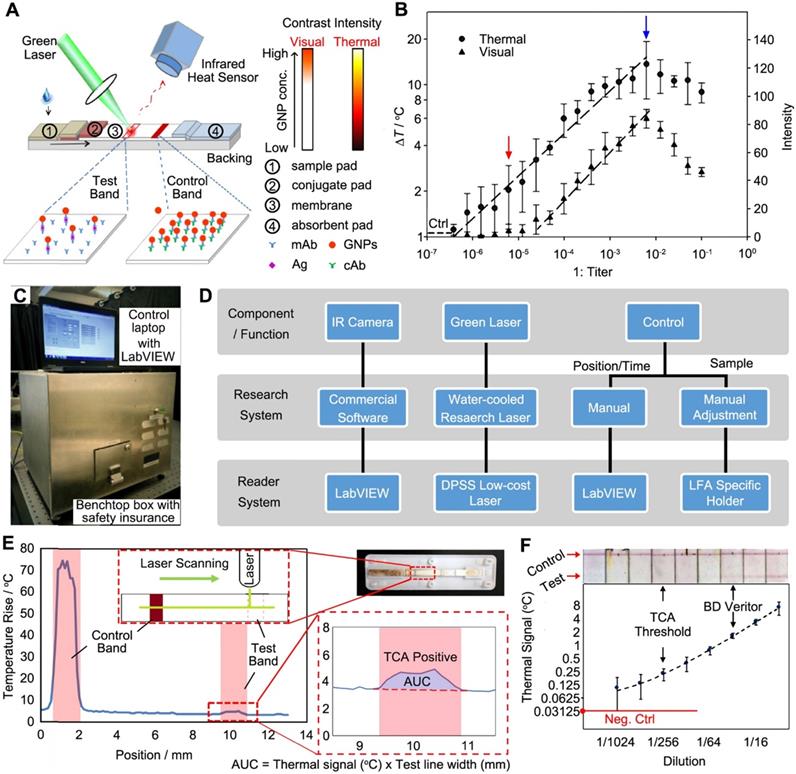
Qin et al. demonstrated for the first time using thermal response of GNPs to improve the LFA [61]. Essentially, a completed LFA strip was irradiated with a 532 nm laser (power = 0.01 W) to activate the GNPs and the thermal contrast signal was recorded by an IR camera (Figure 3A). The thermal analysis of test band gave quantitative results as a function of the GNP concentrations. The analytical performance of FDA-approved LFA strips for detecting cryptococcal antigen (CrAg) was evaluated through the thermal contrast signal. CrAg testing is urgently required for cryptococcal meningitis diagnosis, especially in immunocompromised adults [62]. Figure 3B shows the TCA produced a 32-fold enhancement in the detection sensitivity and extended detection dynamic range over the visual detection. Note the blue arrow marks the high dose “hook” effect with decreased visual and thermal intensity, which can be addressed by diluting the target sample or engineering the format of strip [6]. The TCA technique was further validated in clinical cerebral spinal fluid samples with known CrAg titers from patients with and without cryptococcal meningitis. Recently, clinical cohort study was performed using the commercial CrAg LFA kits (Immy, Inc., USA) assisted with TCA technique [63].
Thermal contrast amplification (TCA) technique for LFA. (A) Schematics showing the detection principle of TCA technique working on LFA strip. (B) Dose response curves of the TCA and colorimetric signals of LFA for CrAg. The “Ctrl” means the background signal from control sample (water). (C) A photograph of the benchtop reader system. (D) Comparison of a TCA research system and the reader system shown in (C). (E) TCA reader algorithm for detection and quantification of temperature rise in an LFA strip. The area under the curve (AUC) analysis was performed along the strip covering the control and test bands for the signal acquisition. The result was obtained from a visual-negative malaria First Response LFA kit as shown in inset. (F) Quantitative results of representative LFA strips using the TCA benchtop device against visual images. Samples are different dilutions of influenza A positive swabs extraction. LFAs are from BD Veritor. Adapted with permission from [61, 67], copyright 2012 John Wiley and Sons and 2016 American Chemical Society, respectively.
The shape and size of the GNPs played an important role in improving their photothermal property and thereby the performance of diagnostics. Changing the spherical GNPs into gold nanorods (GNRs) or gold nanoshells (GNSs) could largely increase the Cabs per particle volume [64]. As a result, under same condition (i.e., particle concentration and laser power), GNRs produce about 10-fold more heat than the spherical GNPs and GNSs when normalized against the particle volume. Moreover, when combined with low-absorbing substrates as the backing materials (e.g., glass and plastic) and higher laser power (i.e., 0.01 W to 1 W), GNRs-based TCA-LFA could have the potential to achieve 104-fold improvement over the visual LOD of LFA [61]. In addition, Hu et al. reported employing gold nanocages with superior photothermal conversion efficiency as detection agents for TCA-LFA, where a 6-fold enhancement of the LOD has been achieved compared with the visual LFA [65]. Zhan et al. also studied the size impact of GNPs on the sensitivity of LFA [66]. Importantly, the size of GNPs not only affects their optical and thermal properties, but also influences the migration speed and antibody binding events within the membrane. By modelling these key parameters (i.e., size and concentration of GNPs, migration rates, binding reaction, and diffusion), Zhan et al. found that larger GNPs could improve the assay performance due to more antibodies on the surface (favoring the binding reaction) and size-dependent properties (larger size resulting in stronger signal generation). For example, 100 nm GNPs yield a 256-fold sensitivity enhancement under the TCA detection mode compared to the colorimetric signal of 30 nm GNP-based LFA. However, even larger GNPs (e.g., 400 nm) would have difficulties in migrating across the strip due to the slower diffusion rates. This inevitably decreases GNP capture and thus the LFA sensitivity. Similar investigation of size impact on the LOD of LFA has also been reported by Loynachan et al. [17].
Reader development
Development of benchtop and portable devices is critical to further translate the technology. The initial detection system reported in [61] is only available in a research lab (i.e., a large laser system on an optical table) with manual control and a simple reading algorithm. In a follow-up study, the same group developed a benchtop TCA reader prototype (46 cm × 34 cm × 34 cm size, 11.7 kg weight, Figure 3C) that is low-cost and compact with automatic data acquisition and analysis [67]. The overall design of the laser-reader system was shown in Figure 3D. In the benchtop device, a continuous wave (CW) laser was employed, of which the cost was significantly reduced but the performance was comparable to the original research laser (Spectra-Physics, Millennia Vs) under the same output power. Other improvements over the research system include automation of a stepper motor and an optical shutter through LabVIEW, as well as the LFA-holding cassettes that could align LFA strips of different sizes and geometries under the laser for reproducible reading. However, the IR camera with software for signal reading and data analysis wasn't changed due to the requirement of spatial resolution and user interface. Based on this benchtop device, a two-stage algorithm was used (Figure 3E): 1) the temperature rise was obtained by capturing multiple points (vs. single point in previous work [61]) of test band subtracting the background temperature rise (outside test band); 2) area under curve (AUC) analysis of the TCA signal pattern was performed for the data reduction and quantitative results. The development of a handheld and portable device for TCA was conceptualized and initial assessment on the individual reader components such as a portable laser and a cheaper IR sensor was performed. Further work has been undergoing to build and test a POC device based on the TCA technique.
To validate the analytical performance of benchtop device, commercially available LFA kits for three diseases (influenza A, malaria, and C. difficile) were used. Both qualitative (i.e., subjective evaluation of TCA data) and quantitative (i.e., AUC analysis) results could be obtained (for simplicity, only influenza A kits were shown in Figure 3F). The TCA reader showed 8-fold enhancement over the visual recognition for all cases. For the quantitative analysis, a prominent linear trend was fitted, indicating the correlation of signal to the target concentration in the sample. In addition, the benchtop TCA reader was carried out to perform test on clinical samples, demonstrating a 4- to 8-fold improvement of analytical sensitivity. Importantly, TCA reader is a simple add-on reader for commercial LFAs without any additional modification.
Limitations
Although there are numerous benefits of TCA reader, some limitations need to be addressed before rigorous field tests. One is the reading time for each test. Currently, 10-20 min are required for data acquisition and analysis, which should ideally be shortened to less than 3 min per test. Also, due to the random distribution of GNPs in test band and point- scanning of the TCA method, reproducible measurements must be carefully considered. Therefore, it is important to develop a portable reader with robust and consistent results since the precise temperature measurements are used as the “thermal” signal.
Thermophotonic lock-in imaging (TPLI)
Principle
Thermophotonic lock-in imaging (TPLI) is a thermography testing technique for industrial evaluation of materials and devices [68]. In this technique, a low-power, continuous, and intensity- modulated laser is introduced to produce a controlled thermal wave inside the feature of interest. The lock-in demodulation evaluates the detected signal that carries information of sample inhomogeneities using the excitation light as reference [69]. In other words, the absorbers located at different depths inside the feature possess different optical scattering and absorption coefficients, contributing to the depth- integrated IR signal. Recent studies have successfully demonstrated the TPLI application to the biological samples such as early detection of dental caries in human teeth [69, 70].
LFA demonstration
When coupled with LFA, the TPLI provides a promising method utilizing thermal response of GNPs as the indicators. Interestingly, the TPLI is capable to inspect the depth of a feature by controlling the laser modulation frequency [68]. This ability enables the detection of GNPs trapped on surface and inside the membrane. In a recent work, Ojaghi et al. developed a long-wave infrared TPLI system for the thermal interpretation of LFA strips [71]. As shown in Figure 4A, the working scheme was to use a laser to first excite the region of interest (ROI) covering both control and test bands for the generation of thermal waves (i.e., Planck radiation), which was subsequently detected by an IR camera. Due to the spatial distribution of GNPs at various layers of the membrane, the diffusive thermal field was altered and resulted in a depth-integrated signal. Therefore, a phase shift was formed when the inner thermal wave reached the surface and contributed to the thermal radiation. Simultaneously, amplitude change of the radiometric signal was induced by the subsurface absorption of light that can also be used to quantify the concentration of GNPs and the analyte.
Thermophotonic lock-in imaging (TPLI) system for LFA. Schematics showing (A) the TPLI working principle and (B) a photograph of the experimental setup, and (C) the major components of TPLI system used for interpretation of LFA results. (D) TPLI phase (top) and amplitude (bottom) images of LFA strip obtained at hCG concentration of 16 mIU and 2 Hz modulation frequency. (E) Average normalized phase values at 2 Hz modulation frequency within the test band against different hCG concentrations. The arrows mark the detection threshold of visual and TPLI readouts. Adapted with permission from [71], copyright 2018 Elsevier.
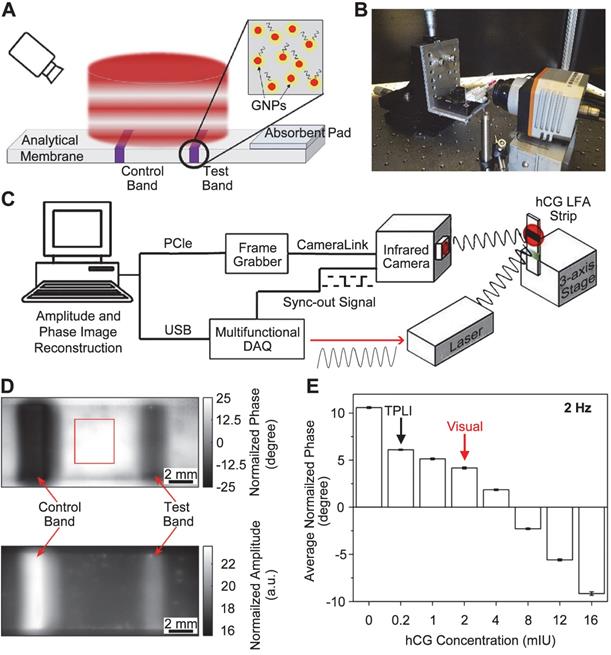
TPLI was then tested to enhance LFA performance. Figure 4B shows the setup for TP signal generation, where the testing strip was mounted on a stage to secure the position and height. A multifunctional data acquisition system was designed to generate analog reference and acquire data synchronously under different excitation cycles (Figure 4C). The as-obtained TP signal was then proceeded via a standard quadrature demodulation/ lock-in analysis to decipher amplitude and phase information. Typical TP phase and amplitude images of LFA strip were shown in Figure 4D at 2 Hz of laser frequency, where the control and test bands and the adjacent background (red box) can be resolved. Due to the different number of GNPs accumulated in those three regions, the corresponding thermal contrast could be observed in both images. Therefore, the variation of contrast in the test bands from different strips was used to correlate with the concentration of GNPs and analyte. Under the optimized modulation frequency (2 Hz), the average normalized phase signal decreases quantitatively as a function of hCG concentration (Figure 4E). Statistically, 0.2 mIU hCG in LFA could be detected through TPLI technique, while only 2 mIU hCG was reached by visual interpretation or optical reader. In addition to the sensitivity and quantification, large-field and simultaneous measurements of multiple LFA strips is possible and could be accomplished in a short time (i.e., 10 s at 2 Hz modulation frequency).
Reader development
The latest report of this technique was performed in a benchtop system (i.e., on an optical table, Figure 4B and C). The authors mentioned that the IR camera can be potentially replaced by cell-phone attachment IR cameras to reduce the cost and size of the reader [71]. More information about reader development is not available.
Limitations
For further development of devices, the following constrains of current technique need to be addressed. Firstly, the instrumental cost needs to be reduced. In the present demonstration [71], IR camera, laser, multifunctional data acquisition board are required to collect the signal, and a computer is used to process the data. Secondly, the LOD improvement strongly depends on the laser modulation frequencies. Optimal modulation frequency that yields thermal diffusion length commensurate with the thickness of the LFA needs to be experimentally tested. This may pose a challenge when different types of LFA kits are tested.
Photothermal laser speckle imaging (PT-LSI)
Principle
Laser speckle imaging (LSI) is an interferometric technique to measure the optical contrast generated by the light scattering of a moving sample [72]. When a laser illuminates a diffuse material, the highly coherent light produces granular interference pattern known as speckle [73]. In a typical LSI, a digital camera records this laser speckle under very short exposure time (several milliseconds), recording the surface intensity pattern of light from a scattering medium. This intensity-fluctuation profile, through a simple Fourier transformation, enables statistical calculation and mapping of species dynamics [74]. Collectively, many applications have been proposed and implemented in the fields of neuroscience, dermatology, and ophthalmology [75-77]. Photothermal laser speckle imaging (PT-LSI) has advanced the conventional LSI with improved depth resolution by incorporating a pulse laser. This leads to the selective excitation of absorbers and allows for highly sensitive detection [78].
LFA demonstration
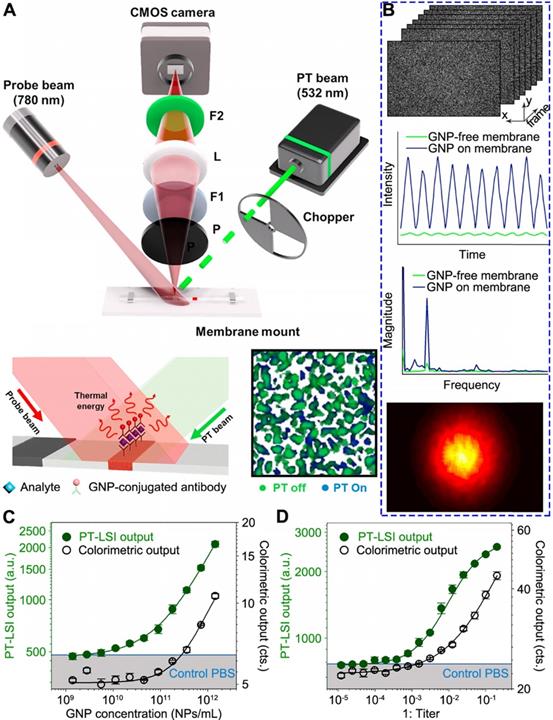
Song et al. have recently demonstrated the use of PT-LSI for LFA [79]. Due to the multiple layered structure of LFA strips, the probe light scatters randomly and forms speckle patterns. The working principle, as shown in Figure 5A, takes advantages of a PT laser with 532 nm beam to specifically excite the GNPs on membrane. As a consequence, the GNPs generate heat and change the speckle pattern of LFA membrane by the scattered light of 780 nm probe laser. Instead of using IR camera as the sensor, the speckle pattern change was monitored by an optical sensor (i.e., CMOS camera), which reduces cost compared with IR cameras. An optical chopper is employed to modulate the intensity of PT light to minimize external noise, such as laser intensity variation. The excited GNPs generate heat that alters the refractive index and causes thermal deformation of the membrane, resulting in the speckle pattern change. This change is associated with the number of GNPs reside, which can be used to quantify the target concentration. A custom-built program implemented in MATLAB was designed to process the PT-LSI signal. The analytical procedure is outlined in Figure 5B (top to bottom). Firstly, the pixel intensity of each PT-LSI image obtained at different time periods is characterized by a fluctuation at the same frequency of the PT light modulation. Note, the presence of GNPs gives a much stronger signal than the background signal from LFA membrane. Secondly, the intensity fluctuation profile is Fourier transformed into magnitude as a function of frequency, which is further mapped into a PT-LSI image based on the corresponding pixels. Lastly, the averaged PT-LSI signals, referred to as “PT-LSI output” over the ROI (i.e., control and test bands), quantify the concentration of GNPs and analytes. As evidenced in Figure 5C and D, the PT-LSI result showed enhanced analytical performance over the colorimetric signal in quantifying the concentration of GNPs solution and CrAg sample. The LOD of the PT-LSI coupled LFA was 125- fold and 68-fold lower than that of the colorimetric LFA for detecting GNP and CrAg, respectively.
Photothermal laser speckle imaging (PT-LSI) system for LFA. (A) Schematics of the PT-LSI setup working on a mounted LFA strip. (B) Outline of the PT-LSI signal processing. The procedures include speckle images acquisition, pixel intensity fluctuation measurements, Fourier transformation of magnitude, and PT-LSI signal output. Dose response curves of PT-LSI signal of LFA for (C) GNPs and (D) CrAg detection. The blue line in both plots marks the noise-equivalent output, which was acquired with PBS buffer only. Adapted with permission from [79], copyright 2018 Elsevier.
Reader development
As mentioned by the authors, the PT-LSI reader can be readily miniaturized to a portable size with inexpensive consumer-grade components [79]. For instance, the optical chopper for PT light modulation can be replaced by diode laser current modulation with a microcontroller, and the high-speed CMOS camera can be substituted with webcams that is less than $20. In addition, the PT light source can be a laser pointer. Alternatives such as using high-speed field programmable gate array devices and pulsed or coded PT light illumination were also proposed to increase the data analysis speed over the current results (i.e., 2.5 min).
Limitations
The robustness of using laser pointers and web camera as the key components for portable reader should be rigorously tested. Especially, the power stability of laser pointer will be a major obstacle for consistent performance during long term usage. In addition, the data processing for speckle images of PT-LSI technique should also be considered for resource-limited settings.
Photoacoustic (PA) enhanced signal
Principle
Photoacoustic (PA) effect is another interesting phenomenon induced by the laser absorption of chromophores and pressure wave generation [80]. Detection method using PA signal was first developed in the 1970s [81]. Essentially, the PA technique provides quantitative results based on three steps, including the optical absorption, the energy conversion from light to heat, and the thermal expansion of the adjacent media that produces acoustic waves as PA signal [82]. As a result, the PA signal increases with the absorbed energy and indicates the optical absorption of a sample. In addition, the PA imaging has deeper penetration due to the ultrasound transmission and sensitive detection, compared with limited light penetration in optical imaging [83]. Taken together, the PA technique has been very attractive to the analytical community and its integration with current diagnostic platforms (e.g., ELISA) [82] is promising to move from the laboratory research to preclinical and clinical realities [83, 84].
LFA demonstration
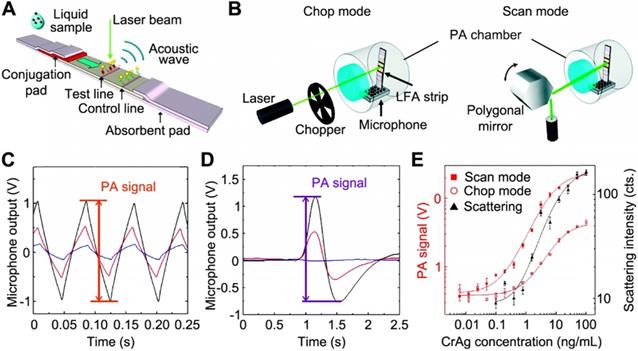
Zhao et al. first explored the combination of PA technique with LFA [85]. Figure 6A shows that, when illuminated by a CW laser beam, the GNPs captured within test/control bands generate PA signal due to the thermal expansion of the adjacent air. Meanwhile, the different density of GNPs at the test band leads to the amplitude change of PA signal, which indicates the analyte concentration. To ensure the precise and quantitative measurements, the LFA strip was enclosed in a small-volume and air-tight chamber with minimized vibration from the environment and the strip itself (see Figure 6B). Also, two detection modes were developed, where the “chop mode” employed an optical chopper to modulate the laser intensity and the “scan mode” used a rotating polygonal mirror for the scanning across the ROI. Notably, the peak-to-peak value of the signals (Figure 6C and D) was marked as the PA signal amplitude and further used to calculate the analyte concentration. Due to the adsorption of light by the strip itself, a strong background signal was observed in the “chop mode” (blue trace in Figure 6C), while in the “scan mode”, the background signal was reduced (blue trace in Figure 6D). This is because, without chopping the laser, the LFA strip absorbs a constant amount of the excitation light during the scan and the laser stimulation generates a GNP-specific signal when scanning across the test band. Using CrAg LFA kits as an example, PA method could significantly enhance the sensitivity over the colorimetric detection. Figure 6E shows the dose-response curves of the colorimetric analysis, chop mode, and scan mode of PA detections, giving LOD of 1.1 ng·mL-1, 0.57 ng·mL-1, and 0.010 ng·mL-1, respectively. These results clearly demonstrated that the PA technique offers a powerful means to amplify the signal, enabling a more sensitive (110-fold enhancement) and quantitative analysis for LFA.
Schematics of the (A) working principle of PA-LFA; and (B) detection modes of PA-LFA. Note an air-tight chamber is used to block the environmental variations and the microphone is for the PA signal amplification. The measured PA waveforms with different number of GNPs absorbed on the strip in chop mode (C) and scan mode (D), respectively. For both plots, the peak-to-peak value was marked as the PA signal; and the color curves mark the concentration of GNPs applied: 1011 mL-1 for black, 3×10¹⁰ mL-1 for red, and 0 for blue (control). (E) Comparison between diagnostic performance of PA measurements under the scan mode and chop mode and colorimetric result. Adapted with permission from [85], copyright 2016 The Royal Society of Chemistry.
Reader development
The authors proposed several options to miniaturize the size and reduce the cost of PA detection system [85]. For instance, it is technically available to replace laser with a LED that matches the absorption of the GNPs and integrate the light source, microphone, the detection chamber, and readout circuit into a palm-size box. Recently, Zhang et al. proposed a miniaturized PA cell for testing of blood glucose on paper-based devise [86]. The Teflon-made PA cell is a cubic structure with 40 × 20 × 20 mm in dimension, where a sample holder, a cylinder chamber, and a microphone are configurated together inside for signal generation and acquisition. The small size of the chamber (~0.2 cm3) prevents the sound loss during the testing. The whole cell is sealed to enable a stable environment for minimal fluctuation of signals. Future work may extend to other paper-based assays (e.g., GNPs-based LFA).
Limitations
In the work by Zhao et al., the LFAs were dried for 15 min before tested by PA method [85]. However, it is noted in most commercially available LFA kits, the results should be read when the strip is wet for more accurate interpretations. It is important to validate this technique for wet LFA readings since low percentage of the acoustic wave is able to travel through water-air interface. Again, reproducibility issue raises the users' concerns due to the intrinsic point-scanning reading of PA technique.
Summary and Outlook
In this article, we have highlighted the laser- induced signal amplification techniques on GNPs- based LFA reported in the past decade. GNPs can be excited by the laser and convert the absorbed energy into enhanced electromagnetic field or heat due to the LSPR. Such responses of GNPs provide new sensing modes that have been successfully integrated on LFA, including SERS, thermal contrast, thermophotonic, speckle, and photoacoustic signals. Different reader systems including hardware (e.g., laser source and detector) and software (e.g., signal acquisition and data proceeding) have been introduced for each technique implementation. Compared with the colorimetric readouts of LFA, those techniques show improved analytical performance upon the sensing of analytes. Promising as they are in this technological development, we are expecting to witness more competing products in the coming decade.
These signal amplification strategies are more straightforward than the colorimetric enhancement strategies since the latter one requires specifically designed detection agents (e.g., enzymes coated GNPs) or additional reagents for improved signal readouts. As clearly illustrated from the above- mentioned examples, the laser-assisted techniques detect the signal from a completed strip without extra assay operation and can be readily implemented on commercially available LFA kits. However, there are several limitations: 1) for SERS-LFA, it suffers from the high assay expenses and special SERS tags preparation; 2) for the photothermal-related detection, the bulky instrumentation needs to be further improved with lower-cost components; 3) clinical assessment is also highly demanded to evaluate the enhanced sensitivity versus the likelihood of false-positives for all techniques; and 4) the point-focus scanning (e.g., TCA and PA methods) needs to be optimized for rapid and robust readouts. The comparison of each method viewed from other aspects has been summarized in Table 1.
Comparison of the presented signal amplification techniques and detection methods.
| Enhancement strategy | Surface enhanced Raman scattering (SERS) | Thermal contrast amplification (TCA) | Thermophotonic lock-in imaging (TPLI) | Photothermal laser speckle imaging (PT-LSI) | Photoacoustic (PA) |
|---|---|---|---|---|---|
| Probes used | SERS tags of 45 nm GNPs and 85 nm Au-Ag NPs | 30-100 nm GNPs | 30 nm GNPs | 30 nm GNPs | 30 nm GNPs |
| Detection system | CW laser Raman spectroscopy | CW laser IR camera | CW laser IR camera | CW laser CMOS camera | CW laser PA detector |
| LOD enhancementa | 104-fold and 4-fold | 8~256-fold | 10-fold | 68-fold | 110-fold |
| Multiplexing | Yes | N/A | |||
| Reading algorithm | Point or line scanning | Point scanning | LFA area imaging | LFA area imaging | Point scanning |
| Automationb | No | Yes | Yes | Yes | No |
| Data acquisition time | 6 min and 5 s | 10 min | 10 s | 20 s | ~5 sc |
| Clinical cohort study | No | Yes | No | No | No |
| Current status | Laboratory R&D | Startup companyd | Laboratory R&D | Laboratory R&D | Laboratory R&D |
| Ref | 37, 54 | 61, 63, 66, 67 | 71 | 79 | 85 |
a: Comparison of LFA LOD with colorimetric readouts; b: Refer to the data acquisition and analysis; c: Estimated by the scanning speed of 3 mm/s; d: Vigilant Diagnostics
With these developments for LFA signal enhancement, we envision that diagnostic performance of an assay is one of several critical parameters towards practical applications. Particularly, minimizing non-specific binding and increasing specific binding at test bands of LFA strips are the key to reduce background signals and interpret accurate results at low target concentrations (vs. false positives). Other factors such as the optimization of whole detection system, including signal generation, miniaturization, cost, operation time, automation, and data analysis, should also be considered from the POC perspective [87]. Toward this end, the development of devices may be divided into three stages: 1) initiate research study to demonstrate the feasibility of integrating new detection techniques on LFA strips and the research outcomes could serve as a guideline to develop portable systems; 2) prototype a benchtop system consisting of lower-cost and smaller components, which offers on-demand tests and can be installed in hospitals or central referral laboratories; and 3) develop a handheld system that can be used in a wide range of environmental settings and fulfill the need of on-site decision making with high sensitivity. Such device development is an important step to translate the innovation from benchtop to bedside [88]. Licensing techniques from academic institutions to startup companies or incubators can further translate these findings into the clinics yet remains another challenge (i.e., “valley of death” [89]). As a good reference, the development of fluorescence- based LFA directs a pathway for the researchers who are interested to pursue further clinical translation, such as LFA manufacturing, fluorescence label design, and instrument optimization. For example, the deployment of upconverting NPs in LFA reduces the background signal from the strip [90]; and there are many commercially available fluorescence readers in the market.
For future POC diagnostics, the highly flexible formats of LFA allow further integration of novel materials and techniques. For instance, GNPs with varied shapes and structures provide a simple yet efficient way for the sensitivity and accuracy improvement of the LFA, while it's now feasible to prepare them in a controlled manner [91, 92]. It is promising to apply them into LFA for new signal-transducer principles and substantial signal enhancement. While for the size-dependent signal transduction, its response usually increases with the GNPs size. However, the membrane structure of LFA strips traps the large particles, and it leaves the assay incomplete. Therefore, rather than enlarging the size of GNPs for stronger signals, the priority should be put in choosing NPs with proper size without difficulties in completing the assay. Also, the multiplexing of LFAs is a critical area for the development of the POC diagnostics. In this case, the creation of pads or other platforms and efficient conjugation events will be of great importance [3, 93, 94]. Microfluidic platforms that are able to precisely manipulate the flow rate of sample and the migration of probes and targets allow for high-throughput screening applications. There will be some potential opportunities to combine the advantage of these two platforms [95, 96]. Smartphone has been developed as a platform for POC diagnostics in recent years, offering great opportunities for delivering healthcare to resource-limited settings due to its availability [97]. The integrated components (e.g., camera, chips, and add-on thermal camera from FLIR®) of smartphone are extremely suitable for signal enhancement and detection of LFA [98-100]. While not a focus in this paper, enhancing the optical signal of GNPs in LFA by increasing the probe density around the analytes like self-assembly and aggregation has been well documented in recent papers [101-103]. Ultimately, we hope that this article can be a valuable source to the communities in academia and industry for future work in this important and emerging field.
Abbreviations
Ag: silver; Au: gold; Pt: platinum; SiO2: silica; ELISA: enzyme-linked immunosorbent assay; FDA: Food and Drug Administration; CMOS: complementary metal-oxide semiconductor; LED: light-emitting diode.
Acknowledgements
This work was partially supported by National Institute of Allergy and Infectious Diseases (NIAID) of the National Institutes of Health under award number R21AI140462, and by the Office of the Assistant Secretary of Defense for Health Affairs through the Peer Reviewed Medical Research Program - Discovery Award under Award No. W81XWH-20-1-0106. Opinions, interpretations, conclusions, and recommendations are those of the authors and are not necessarily endorsed by the National Institutes of Health or Department of Defense.
ORCIDs
Dr. Haihang Ye: ORCID 0000-0002-5199-4418; Yaning Liu: ORCID 0000-0001-8970-7245; Dr. Zhenpeng Qin: ORCID 0000-0003-3406-3045
Competing Interests
ZQ is listed on patents related to thermal contrast amplification and has the equity interest in Vigilant Diagnostics.
References
1. Leuvering JH, Thal PJHM, Waart MVD, Schuurs AHWM. Sol particle immunoassay (SPIA). J Immunoassay. 1980;1:77-91
2. Parolo C, Merkoçi A. Paper-based nanobiosensors for diagnostics. Chem Soc Rev. 2013;42:450-7
3. Xu Y, Liu Y, Wu Y, Xia X, Liao Y, Li Q. Fluorescent probe-based lateral flow assay for multiplex nucleic acid detection. Anal Chem. 2014;86:5611-4
4. Urusov AE, Gubaidullina MK, Petrakova AV, Zherdev AV, Dzantiev BB. A new kind of highly sensitive competitive lateral flow immunoassay displaying direct analyte-signal dependence. Application to the determination of the mycotoxin deoxynivalenol. Microchim Acta. 2018;185:29
5. Zhou Y, Ding L, Wu Y, Huang X, Lai W, Xiong Y. Emerging strategies to develop sensitive AuNP-based ICTS nanosensors. Trends Analyt Chem. 2019;112:147-60
6. Bahadır EB, Sezgintürk MK. Lateral flow assays: Principles, designs and labels. Trends Analyt Chem. 2016;82:286-306
7. Zhu N, Zhang D, Wang W, Li X, Yang B, Song J. et al. A novel coronavirus from patients with pneumonia in China, 2019. N Engl J Med, in press. doi: 10.1056/NEJMoa2001017
8. Gao Z, Ye H, Wang Q, Kim MJ, Tang D, Xi Z. et al. Template regeneration in galvanic replacement: A route to highly diverse hollow nanostructures. ACS Nano. 2020;14:791-801
9. Huang X, Aguilar ZP, Xu H, Lai W, Xiong Y. Membrane-based lateral flow immunochromatographic strip with nanoparticles as reporters for detection: a review. Biosens Bioelectron. 2016;75:166-80
10. Zhang H, Qiu X, Zou Y, Ye Y, Qi C, Zou L. et al. A dye-assisted paper-based point-of-care assay for fast and reliable blood grouping. Sci Transl Med. 2017;9:eaaf9209
11. Li X, Lu D, Sheng Z, Chen K, Guo X, Jin M. et al. A fast and sensitive immunoassay of avian influenza virus based on label-free quantum dot probe and lateral flow test strip. Talanta. 2012;100:1-6
12. Li Z, Wang Y, Wang J, Tang Z, Pounds JG, Lin Y. Rapid and sensitive detection of protein biomarker using a portable fluorescence biosensor based on quantum dots and a lateral flow test strip. Anal Chem. 2010;82:7008-14
13. You M, Lin M, Gong Y, Wang S, Li A, Ji L. et al. Household fluorescent lateral flow strip platform for sensitive and quantitative prognosis of heart failure using dual color upconversion nanoparticles. ACS Nano. 2017;11:6261-70
14. Mao X, Wang W, Du TE. Dry-reagent nucleic acid biosensor based on blue dye doped latex beads and lateral flow strip. Talanta. 2013;114:248-53
15. Lee S, Mehta S, Erickson D. Two-color lateral flow assay for multiplex detection of causative agents behind acute febrile illnesses. Anal Chem. 2016;88:8359-63
16. Gao Z, Ye H, Tang D, Tao J, Habibi S, Minerick A. et al. Platinum-decorated gold nanoparticles with dual functionalities for ultrasensitive colorimetric in vitro diagnostics. Nano Lett. 2017;17:5572-9
17. Loynachan CN, Thomas MR, Gray ER, Richards DA, Kim J, Miller BS. et al. Platinum nanocatalyst amplification: redefining the gold standard for lateral flow immunoassays with ultrabroad dynamic range. ACS Nano. 2017;12:279-88
18. Blažková M, Mičková-Holubová B, Rauch P, Fukal L. Immunochromatographic colloidal carbon-based assay for detection of methiocarb in surface water. Biosens Bioelectron. 2009;25:753-8
19. Qiu W, Xu H, Takalkar S, Gurung AS, Liu B, Zheng Y. et al. Carbon nanotube-based lateral flow biosensor for sensitive and rapid detection of DNA sequence. Biosens Bioelectron. 2015;64:367-72
20. Wang Z, Zhi D, Zhao Y, Zhang H, Wang X, Ru Y. et al. Lateral flow test strip based on colloidal selenium immunoassay for rapid detection of melamine in milk, milk powder, and animal feed. Int J Nanomed. 2014;9:1699
21. Liu C, Jia Q, Yang C, Qiao R, Jing L, Wang L. et al. Lateral flow immunochromatographic assay for sensitive pesticide detection by using Fe3O4 nanoparticle aggregates as color reagents. Anal Chem. 2011;83:6778-84
22. Lee S, O'Dell D, Hohenstein J, Colt S, Mehta S, Erickson D. NutriPhone: a mobile platform for low-cost point-of-care quantification of vitamin B12 concentrations. Sci Rep. 2016;6:28237
23. Fu E, Liang T, Houghtaling J, Ramachandran S, Ramsey SA, Lutz B. et al. Enhanced sensitivity of lateral flow tests using a two-dimensional paper network format. Anal Chem. 2011;83:7941-6
24. He Y, Zhang S, Zhang X, Baloda M, Gurung AS, Xu H. et al. Ultrasensitive nucleic acid biosensor based on enzyme-gold nanoparticle dual label and lateral flow strip biosensor. Biosens Bioelectron. 2011;26:2018-24
25. Parolo C, de la Escosura-Muñiz A, Merkoçi A. Enhanced lateral flow immunoassay using gold nanoparticles loaded with enzymes. Biosens Bioelectron. 2013;40:412-6
26. Fu J, Zhou Y, Huang X, Zhang W, Wu Y, Fang H. et al. Dramatically enhanced immunochromatographic assay using cascade signal amplification for ultrasensitive detection of Escherichia coli O157: H7 in milk. J Agr Food Chem. 2020;68:1118-25
27. Yang X, Yang M, Pang B, Vara M, Xia Y. Gold nanomaterials at work in biomedicine. Chem Rev. 2015;115:10410-88
28. Eustis S, El-Sayed MA. Why gold nanoparticles are more precious than pretty gold: noble metal surface plasmon resonance and its enhancement of the radiative and nonradiative properties of nanocrystals of different shapes. Chem Soc Rev. 2006;35:209-17
29. Kelly KL, Coronado E, Zhao LL, Schatz GC. The optical properties of metal nanoparticles: The influence of size, shape, and dielectric environment. J Phys Chem B. 2003;107:668-77
30. Tong L, Zhu T, Liu Z. Approaching the electromagnetic mechanism of surface-enhanced Raman scattering: from self-assembled arrays to individual gold nanoparticles. Chem Soc Rev. 2011;40:1296-304
31. Huang X, Jain PK, El-Sayed IH, El-Sayed MA. Plasmonic photothermal therapy (PPTT) using gold nanoparticles. Lasers Med Sci. 2008;23:217
32. Qin Z, Bischof JC. Thermophysical and biological responses of gold nanoparticle laser heating. Chem Soc Rev. 2012;41:1191-217
33. Wang Z, Zong S, Wu L, Zhu D, Cui Y. SERS-activated platforms for immunoassay: probes, encoding methods, and applications. Chem Rev. 2017;117:7910-63
34. Qian XM, Nie SM. Single-molecule and single-nanoparticle SERS: from fundamental mechanisms to biomedical applications. Chem Soc Rev. 2008;37:912-20
35. Laing S, Gracie K, Faulds K. Multiplex in vitro detection using SERS. Chem Soc Rev. 2016;45:1901-18
36. Doering WE, Piotti ME, Natan MJ, Freeman RG. SERS as a foundation for nanoscale, optically detected biological labels. Adv Mater. 2007;19:3100-8
37. Hwang J, Lee S, Choo J. Application of a SERS-based lateral flow immunoassay strip for the rapid and sensitive detection of staphylococcal enterotoxin B. Nanoscale. 2016;8:11418-25
38. Mousavi MN, Mehramuz B, Sadeghi J, Alizadeh N, Oskouee MA, Kafil HS. The pathogenesis of Staphylococcus aureus in autoimmune diseases. Microb Pathog. 2017;111:503-7
39. Fu X, Cheng Z, Yu J, Choo P, Chen L, Choo J. A SERS-based lateral flow assay biosensor for highly sensitive detection of HIV-1 DNA. Biosens Bioelectron. 2016;78:530-7
40. Zhang D, Huang L, Liu B, Ni H, Sun L, Su E. et al. Quantitative and ultrasensitive detection of multiplex cardiac biomarkers in lateral flow assay with core-shell SERS nanotags. Biosens Bioelectron. 2018;106:204-11
41. Wang R, Kim K, Choi N, Wang X, Lee J, Jeon JH. et al. Highly sensitive detection of high-risk bacterial pathogens using SERS-based lateral flow assay strips. Sens Actuators B Chem. 2018;270:72-9
42. Fu Q, Liu HL, Wu Z, Liu A, Yao C, Li X. et al. Rough surface Au@Ag core-shell nanoparticles to fabricating high sensitivity SERS immunochromatographic sensors. J Nanobiotechnology. 2015;13:81
43. Khlebtsov BN, Bratashov DN, Byzova NA, Dzantiev BB, Khlebtsov NG. SERS-based lateral flow immunoassay of troponin I by using gap-enhanced Raman tags. Nano Res. 2019;12:413-20
44. Lin LK, Stanciu LA. Bisphenol A detection using gold nanostars in a SERS improved lateral flow immunochromatographic assay. Sens Actuators B Chem. 2018;276:222-9
45. Zhang D, Huang L, Liu B, Ni H, Sun L, Su E. et al. Quantitative and ultrasensitive detection of multiplex cardiac biomarkers in lateral flow assay with core-shell SERS nanotags. Biosens Bioelectron. 2018;106:204-11
46. Rong Z, Xiao R, Xing S, Xiong G, Yu Z, Wang L. et al. SERS-based lateral flow assay for quantitative detection of C-reactive protein as an early bio-indicator of a radiation-induced inflammatory response in nonhuman primates. Analyst. 2018;143:2115-21
47. Xi Z, Ye H, Xia X. Engineered noble-metal nanostructures for in vitro diagnostics. Chem Mater. 2018;30:8391-414
48. Sánchez-Purrà M, Roig-Solvas B, Versiani A, Rodriguez-Quijada C, de Puig H, Bosch I. et al. Design of SERS nanotags for multiplexed lateral flow immunoassays. Mol Syst Des Eng. 2017;2:401-9
49. Wang X, Choi N, Cheng Z, Ko J, Chen L, Choo J. Simultaneous detection of dual nucleic acids using a SERS-based lateral flow assay biosensor. Anal Chem. 2016;89:1163-9
50. Sánchez-Purrà M, Carré-Camps M, de Puig H, Bosch I, Gehrke L, Hamad-Schifferli K. Surface-enhanced Raman spectroscopy-based sandwich immunoassays for multiplexed detection of zika and dengue viral biomarkers. ACS Infect Dis. 2017;3:767-76
51. Li J, Macdonald J. Multiplex lateral flow detection and binary encoding enables a molecular colorimetric 7-segment display. Lab Chip. 2016;16:242-5
52. Zhang D, Huang L, Liu B, Su E, Chen HY, Gu Z. et al. Quantitative detection of multiplex cardiac biomarkers with encoded SERS nanotags on a single T line in lateral flow assay. Sens Actuators B Chem. 2018;277:502-9
53. Di Zhang LH, Liu B, Ge Q, Dong J, Zhao X. Rapid and ultrasensitive quantification of multiplex respiratory tract infection pathogen via lateral flow microarray based on SERS nanotags. Theranostics. 2019;9:4849
54. Tran V, Walkenfort B, König M, Salehi M, Schlücker S. Rapid, quantitative, and ultrasensitive point-of-care testing: a portable SERS reader for lateral flow assays in clinical chemistry. Angew Chem Int Ed. 2019;58:442-6
55. Kearns H, Ali F, Bedics MA, Shand NC, Faulds K, Detty MR. et al. Sensitive SERS nanotags for use with a hand-held 1064 nm Raman spectrometer. R Soc Open Sci. 2017;4:170422
56. Hwang S, Nam J, Jung S, Song J, Doh H, Kim S. Gold nanoparticle-mediated photothermal therapy: current status and future perspective. Nanomedicine. 2014;9:2003-22
57. Rengan AK, Bukhari AB, Pradhan A, Malhotra R, Banerjee R, Srivastava R. et al. In vivo analysis of biodegradable liposome gold nanoparticles as efficient agents for photothermal therapy of cancer. Nano Lett. 2015;15:842-8
58. Terentyuk GS, Maslyakova GN, Suleymanova LV, Khlebtsov NG, Khlebtsov BN, Akchurin GG. et al. Laser-induced tissue hyperthermia mediated by gold nanoparticles: toward cancer phototherapy. J Biomed Opt. 2009;14:021016
59. Huang X, Jain PK, El-Sayed IH, El-Sayed MA. Gold nanoparticles: interesting optical properties and recent applications in cancer diagnostics and therapy. Nanomedicine. 2007;2:681-93
60. Wang S, Singh AK, Senapati D, Neely A, Yu H, Ray PC. Rapid colorimetric identification and targeted photothermal lysis of Salmonella bacteria by using bioconjugated oval-shaped gold nanoparticles. Chem-Eur J. 2010;16:5600-6
61. Qin Z, Chan WC, Boulware DR, Akkin T, Butler EK, Bischof JC. Significantly improved analytical sensitivity of lateral flow immunoassays by using thermal contrast. Angew Chem Int Ed. 2012;51:4358-61
62. Jarvis JN, Meintjes G, Williams A, Brown Y, Crede T, Harrison TS. Adult meningitis in a setting of high HIV and TB prevalence: findings from 4961 suspected cases. BMC Infect Dis. 2010;10:67
63. Boulware DR, Rolfes MA, Rajasingham R, von Hohenberg M, Qin Z, Taseera K. et al. Multisite validation of cryptococcal antigen lateral flow assay and quantification by laser thermal contrast. Emerg Infect Dis. 2014;20:45-53
64. Qin Z, Wang Y, Randrianalisoa J, Raeesi V, Chan WC, Lipiński W. et al. Quantitative comparison of photothermal heat generation between gold nanospheres and nanorods. Sci Rep. 2016;6:29836
65. Hu X, Wan J, Peng X, Zhao H, Shi D, Mai L. et al. Calorimetric lateral flow immunoassay detection platform based on the photothermal effect of gold nanocages with high sensitivity, specificity, and accuracy. Int J Nanomed. 2019;14:7695-705
66. Zhan L, Guo SZ, Song F, Gong Y, Xu F, Boulware DR. et al. The role of nanoparticle design in determining analytical performance of lateral flow immunoassays. Nano Lett. 2017;17:7207-12
67. Wang Y, Qin Z, Boulware DR, Pritt BS, Sloan LM, González IJ. et al. Thermal contrast amplification reader yielding 8-fold analytical improvement for disease detection with lateral flow assays. Anal Chem. 2016;88:11774-82
68. Tabatabaei N, Mandelis A, Amaechi BT. Thermophotonic radar imaging: an emissivity-normalized modality with advantages over phase lock-in thermography. Appl Phys Lett. 2011;98:163706
69. Tabatabaei N, Mandelis A, Amaechi BT. Thermophotonic lock-in imaging of early demineralized and carious lesions in human teeth. J Biomed Opt. 2011;16:071402
70. Ojaghi A, Parkhimchyk A, Tabatabaei N. First step toward translation of thermophotonic lock-in imaging to dentistry as an early caries detection technology. J Biomed Opt. 2016;21:096003
71. Ojaghi A, Pallapa M, Tabatabaei N, Rezai P. High-sensitivity interpretation of lateral flow immunoassays using thermophotonic lock-in imaging. Sens Actuators A Phys. 2018;273:189-96
72. Boas DA, Dunn AK. Laser speckle contrast imaging in biomedical optics. J Biomed Opt. 2010;15:011109
73. Völker AC, Zakharov P, Weber B, Buck F, Scheffold F. Laser speckle imaging with an active noise reduction scheme. Opt Express. 2005;13:9782-7
74. Briers D, Duncan DD, Hirst ER, Kirkpatrick SJ, Larsson M, Steenbergen W. et al. Laser speckle contrast imaging: theoretical and practical limitations. J Biomed Opt. 2013;18:066018
75. Regan C, Choi B. Laser speckle imaging based on photothermally driven convection. J Biomed Opt. 2016;21:026011
76. Choi B, Kang NM, Nelson JS. Laser speckle imaging for monitoring blood flow dynamics in the in vivo rodent dorsal skin fold model. Microvasc Res. 2004;68:143-6
77. Huang YC, Ringold TL, Nelson JS, Choi B. Noninvasive blood flow imaging for real-time feedback during laser therapy of port wine stain birthmarks. Lasers Surg Med. 2008;40:167-73
78. Regan C, Ramirez-San-Juan JC, Choi B. Photothermal laser speckle imaging. Opt Lett. 2014;39:5006-9
79. Song S, Choi S, Ryu S, Kim S, Kim T, Shin J. et al. Highly sensitive paper-based immunoassay using photothermal laser speckle imaging. Biosens Bioelectron. 2018;117:385-91
80. Mallidi S, Larson T, Tam J, Joshi PP, Karpiouk A, Sokolov K. et al. Multiwavelength photoacoustic imaging and plasmon resonance coupling of gold nanoparticles for selective detection of cancer. Nano Lett. 2009;9:2825-31
81. McClelland JF, Kniseley RN. Photoacoustic spectroscopy with condensed samples. Appl Opt. 1976;15:2658-63
82. Zhao Y, Cao M, McClelland JF, Shao Z, Lu M. A photoacoustic immunoassay for biomarker detection. Biosens Bioelectron. 2016;85:261-6
83. Galanzha EI, Shashkov EV, Kelly T, Kim JW, Yang L, Zharov VP. In vivo magnetic enrichment and multiplex photoacoustic detection of circulating tumour cells. Nat Nanotechnol. 2009;4:855-60
84. Camou S, Haga T, Tajima T, Tamechika E. Detection of aqueous glucose based on a cavity size-and optical-wavelength-independent continuous-wave photoacoustic technique. Anal Chem. 2012;84:4718-24
85. Zhao Y, Huang Y, Zhao X, McClelland JF, Lu M. Nanoparticle-based photoacoustic analysis for highly sensitive lateral flow assays. Nanoscale. 2016;8:19204-10
86. Zhang YJ, Chen S, Yu YL, Wang JH. A miniaturized photoacoustic device with laptop readout for point-of-care testing of blood glucose. Talanta. 2020;209:120527
87. Vashist SK, Luppa PB, Yeo LY, Ozcan A, Luong JH. Emerging technologies for next-generation point-of-care testing. Trends Biotechnol. 2015;33:692-705
88. Granger JH, Schlotter NE, Crawford AC, Porter MD. Prospects for point-of-care pathogen diagnostics using surface-enhanced Raman scattering (SERS). Chem Soc Rev. 2016;45:3865-82
89. Moran N. Public sector seeks to bridge 'valley of death'. Nat Biotechnol. 2007;25:266
90. Zhao P, Wu Y, Zhu Y, Yang X, Jiang X, Xiao J. et al. Upconversion fluorescent strip sensor for rapid determination of Vibrio anguillarum. Nanoscale. 2014;6:3804-9
91. Lohse SE, Eller JR, Sivapalan ST, Plews MR, Murphy CJ. A simple millifluidic benchtop reactor system for the high-throughput synthesis and functionalization of gold nanoparticles with different sizes and shapes. ACS Nano. 2013;7:4135-50
92. Niu G, Zhang L, Ruditskiy A, Wang L, Xia Y. A droplet-reactor system capable of automation for the continuous and scalable production of noble-metal nanocrystals. Nano Lett. 2018;18:3879-84
93. Liu B, Zhang D, Ni H, Wang D, Jiang L, Fu D. et al. Multiplex analysis on a single porous hydrogel bead with encoded SERS nanotags. ACS Appl Mater Interfaces. 2018;10:21-6
94. Fenton EM, Mascarenas MR, López GP, Sibbett SS. Multiplex lateral-flow test strips fabricated by two-dimensional shaping. ACS Appl Mater Interfaces. 2008;1:124-9
95. Park BH, Oh SJ, Jung JH, Choi G, Seo JH, Lee EY. et al. An integrated rotary microfluidic system with DNA extraction, loop-mediated isothermal amplification, and lateral flow strip-based detection for point-of-care pathogen diagnostics. Biosens Bioelectron. 2017;91:334-40
96. Martinez AW, Phillips ST, Whitesides GM, Carrilho E. Diagnostics for the developing world: microfluidic paper-based analytical devices. Anal Chem. 2010;82:3-10
97. Xu X, Akay A, Wei H, Wang S, Pingguan-Murphy B, Erlandsson BE. et al. Advances in smartphone-based point-of-care diagnostics. Proc IEEE. 2015;103:236-47
98. Carrio A, Sampedro C, Sanchez-Lopez J, Pimienta M, Campoy P. Automated low-cost smartphone-based lateral flow saliva test reader for drugs-of-abuse detection. Sensors. 2015;15:29569-93
99. Lee S, Kim G, Moon J. Performance improvement of the one-dot lateral flow immunoassay for aflatoxin B1 by using a smartphone-based reading system. Sensors. 2013;13:5109-16
100. Zangheri M, Cevenini L, Anfossi L, Baggiani C, Simoni P, Di Nardo F. et al. A simple and compact smartphone accessory for quantitative chemiluminescence-based lateral flow immunoassay for salivary cortisol detection. Biosens Bioelectron. 2015;64:63-8
101. Chen X, Leng Y, Hao L, Duan H, Yuan J, Zhang W. et al. Self-assembled colloidal gold superparticles to enhance the sensitivity of lateral flow immunoassays with sandwich format. Theranostics, in press. doi:10.7150/thno.42364
102. Huang X, Zhou Y, Ding L, Yu G, Leng Y, Lai W. et al. Supramolecular recognition-mediated layer-by-layer self-assembled gold nanoparticles for customized sensitivity in paper-based strip nanobiosensors. Small. 2019;15:1903861
103. Ye H, Xia X. Enhancing the sensitivity of colorimetric lateral flow assay (CLFA) through signal amplification techniques. J Mater Chem B. 2018;6:7102-11
Author contact
![]() Corresponding author: E-mail: Zhenpeng.Qinedu
Corresponding author: E-mail: Zhenpeng.Qinedu