Impact Factor
- Issue 14; 2026
- Issue 13; 2026
- Issue 12; 2026
- Issue 11; 2026
- Issue 10; 2026
- Volume 16; 2026
- Advance Articles
- Past Issues
- Cover Images
- Cover Suggestion
- Index & Coverage
- Special Issues
Introduction
Materials and Methods
Results and Discussion
Conclusion
Abbreviations
Acknowledgements
Supplementary Material
References
International Journal of Biological Sciences
International Journal of Medical Sciences
 Global reach, higher impact

Theranostics 2020; 10(13):6072-6081. doi:10.7150/thno.42134 This issue Cite
Research Paper
Super-resolution observation of lysosomal dynamics with fluorescent gold nanoparticles
Kangqiang Qiu1,2, Yang Du2,3, Jiyan Liu3, Jun-Lin Guan2, Hui Chao1 ![]() , Jiajie Diao2
, Jiajie Diao2 ![]()
1. MOE Key Laboratory of Bioinorganic and Synthetic Chemistry, School of Chemistry, Sun Yat-Sen University, Guangzhou 510275, China.
2. Department of Cancer Biology, University of Cincinnati College of Medicine, Cincinnati, OH 45267, USA.
3. Department of Biotherapy, Cancer Center, State Key Laboratory of Biotherapy, West China Hospital, West China Medical School, Sichuan University, Chengdu 610041, China.
Received 2019-11-15; Accepted 2020-4-30; Published 2020-5-15
Abstract

Because lysosomes play critical roles in multiple cellular functions and are associated with many diseases, studying them at the subcellular level could elucidate their functionality and support the discovery of therapeutic drugs for treating those diseases. The commonly used dyes for super-resolution imaging of lysosomes are the commercial molecular LysoTrackers. But the tolerance to changes in the lysosomal microenvironment and to lysosomal membrane permeabilization (LMP) and the photostability of the LysoTrackers are worrisome. The purpose of our study was to evaluate the feasibility of performing a fluorescent gold nanoprobe for super-resolution observation of lysosomal dynamics in living cells and compare it to the commercial LysoTrackers.
Methods: The nanoprobe Cy5@Au NP contained three parts: a bio-inert gold core, a biocompatible polyethylene glycol spacer, and a fluorophore cyanine 5. Structured illumination microscopy (SIM) was employed to capture the fluorescence of Cy5@Au NPs in cells. The tolerance assays to changes in the lysosomal microenvironment and to LMP, the photobleaching assay, and the long-term lysosomes labelling assay of Cy5@Au NPs were compared with commercial LysoTrackers. The super-resolution observation of lysosomal dynamics with Cy5@Au NPs was performed.
Results: Cy5@Au NPs can light up lysosomes specifically under SIM. Compared with commercial lysosomal molecular probes, Cy5@Au NPs exhibited stronger tolerance in lysosomes during various treatments, and changes in the lysosomal microenvironment and LMP did not cause Cy5@Au NPs to lose track of their targets. Cy5@Au NPs demonstrated an excellent anti-photobleaching ability, and a long-term labelling assay revealed that they could label lysosomes more than 3 d. Biological events of lysosomes such as the kiss-and-run process, fusion, fission, and mitophagy were recorded with the fluorescent Cy5@Au NPs under SIM.
Conclusions: The nanoprobe Cy5@Au NP was successfully used as a lysosomal probe for the super-resolution observation in living cells and found to overcome the limitations of commercial LysoTrackers. Our results thus confirm that nanoparticles can be useful tools for subcellular super-resolution imaging and highlight new avenues for using nanoparticles in biology.
Keywords: super-resolution imaging, structured illumination microscopy, lysosomes, mitophagy, long-term labelling
Introduction
As the basic components of cells, organelles play important roles in cellular processes and interact with each other in various ways [1-5]. In living cells, organelles have often been visualized by using noninvasive fluorescence microscopy [6-8]. Conventional fluorescence imaging technology is subject to an optical diffraction limit, however, and thus cannot sufficiently resolve the spatial resolution beyond 200 nm, which restricts its applicability in distinguishing the interplay between subcellular structures [9, 10]. More recently, with the rapid development of super-resolution technology, many types of super-resolution microscopy—stochastic optical reconstruction microscopy (STORM), stimulated emission depletion (STED) microscopy, and structured illumination microscopy (SIM), for example—have overcome the diffraction limit (below 200 nm) of conventional optical microscopes and achieved super-resolution imaging at the subcellular level [11-16]. Among those techniques, SIM excites samples by using patterned illumination, with a low illumination intensity and short acquisition time for imaging that risk only slight photodamage to cells [17-22]. Though the spatial resolution of SIM microscopy (100-120 nm) is not at the same level as what can be achieved by STED or STORM techniques (tens of nanometer), it is more than sufficient for investigating organelles. For all of these reasons, SIM can be especially useful for investigating subcellular dynamics in living cells.
Acidic organelles with a variety of acid hydrolases, lysosomes are coated with a phospholipid bilayer in cells [23]. Along with their well-known function as cellular recycling centers that degrade biomacromolecules from endocytosis, autophagy, and phagocytosis [24-26], lysosomes also play critical roles in a range of cellular functions, including plasma membrane repair, cholesterol homeostasis, energy homeostasis, the activation of apoptosis, the generation of building blocks for cell growth, cell migration, activating transcriptional programs, and priming tissues for angiogenesis and metastasis formation [27-29]. As a consequence, the malfunction of lysosomes can cause diseases such as silicosis, cancer, cardiovascular disorders, Parkinson's disease, lysosomal storage diseases, immune system disorders, and neurodegenerative disorders [30-32]. At the same time, most of those lysosomal functions and associated diseases have themselves been found to be associated with other organelles [2-4]. For example, lysosome-mitochondrion interaction is associated with the cellular function of autophagy, along with diseases such as cancer as well as neurodegenerative disorders [33, 34]. Therefore, studying lysosomes at the subcellular level stands to shed light on their functionality and associations with diseases and, in turn, aid the discovery of new therapeutic drugs for such diseases.
To visualize lysosomes, many tags—organic molecules, metal complexes, proteins, and quantum dots, for instance—have been applied in fluorescence imaging [35-40]. Although few such dyes are applicable with SIM imaging, the two most widely used ones are commercial lysosomal dyes: LysoTracker Green (LTG) and LysoTracker Red (LTR) [8, 9, 17, 19]. Those commercial dyes are small molecules that target lysosomes according to their acidic pH, which helps to protonate weak base groups on dyes for trapping lysosomes, thereby achieving the recognition of lysosomes themselves [41, 42]. However, because the pH of lysosomes is unstable and changes when stimulated by drugs (e.g., chloroquine), these commercial dyes can easily become unspecific to lysosomes [43, 44]. Beyond that, common treatments such as cell fixation can cause lysosomal membrane permeabilization (LMP), thereby allowing commercial molecular probes to escape from lysosomes [45, 46]. For that reason, it is important to develop lysosomal probes that are applicable to a variety of situations for SIM imaging.
To overcome the limit of small molecules during LMP, nanoparticles were used as lysosomal probes in our study. Due to their larger size, nanoparticles have a diffusion limit during LMP, and a natural slow exocytosis, which prolongs their retention time in lysosomes. To localize in lysosomes specifically, modification with lysosomal targeting groups is useful, and applies equally to nanoparticles. Meanwhile, most commonly, nanoparticles can entrap into endosomes and subsequently lysosomes by endocytosis process, leading to no requirement for a further derivation with targeting group [47-52]. Herein, with bio-inert gold nanoparticles as the core, biocompatible polyethylene glycol (PEG) was modified on the surface, and a fluorophore cyanine 5 (Cy5) for distinguishing the common colors of commercial dyes was coupled to the PEG terminal end in order to obtain the fluorescent Cy5@Au NPs. Able to localize in the lysosome, the particles can overcome the limitations of commercial lysosomal probes, and under SIM illumination, lysosomal events such as kiss-and-run process, fusion, fission, and mitophagy can be observed.
Materials and Methods
Materials
Carbonyl cyanide m-chlorophenylhydrazone (CCCP, #C2759) was purchased from Sigma, and MitoTracker Green FM (MTG, #M7514), LTR (#L7528), and LTG (#L7526) were purchased from Invitrogen (Thermo Fisher Scientific, USA). Penicillin-streptomycin (#15140163, 10,000 units/mL), fetal bovine serum (FBS, #26140079), and Dulbecco's modified Eagle's medium (DMEM, #11965092) were all purchased from Gibco (Thermo Fisher Scientific, USA). Phosphate-buffered saline (PBS, #SH30256.01) was purchased from Hyclone (GE Healthcare Life Sciences) and the autophagosome detection dye (DAPGreen, #D676) from Dojindo Molecular Technologies, Inc (Japan). LAMP1-mGFP was obtained from Addgene (plasmid, #34831) [53]. The fluorescent gold nanoparticles were custom synthesized by Luna Nanotech Inc. (Toronto, Canada); the size of the gold core was 15 nm, with 5 kDa of PEG and the fluorophore Cy5 modified on the surface. The data characterizing the nanoparticles were measured by Luna Nanotech Inc. as well. The molar concentration of the nanoparticle stock solution was 1.36 × 10⁻⁷ M, and the surface charge of nanoparticles was a negative potential of -4.19 ± 0.22 mV.
Analyzed the number of Cy5 molecules per gold nanoparticle
5 μL of the stock solution with Cy5@Au NPs were completely digested by 3 mL of aqua regia at mild boiling temperature. The solution was evaporated to 1 mL and cooled to room temperature. Subsequently, the sample was diluted to 3% HNO3 by Milli Q H2O, and then the amount of Au (m) was analyzed by inductively coupled plasma mass spectrometry (ICP-MS). Quantification was carried out by external five-point calibration. The molar concentration (cAu NPs) of Cy5@Au NPs is calculated as follows (ρ: density of Au; r: the radius of Au core; N: molar number):
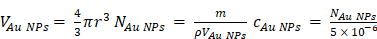
The fluorescence intensity method was used to determine the molar concentration (cCy5) of Cy5 in the stock solution of Cy5@Au NPs. Quantification was carried out by external five-point calibration. The number (R) of Cy5 molecules per gold nanoparticles is calculated as follows:

Cell culture
HeLa cells were generously provided by the lab of Dr. Carolyn M. Price at the University of Cincinnati. The cells were cultured in DMEM containing 10% FBS, 100 units/mL of penicillin, and 100 units/mL of streptomycin in a 5% CO2 cell incubator (Thermo Fisher Scientific, USA) with 100% humidity at 37 °C.
SIM imaging
All cell imaging experiments were performed with structured illumination microscopy (N-SIM, Nikon, Tokyo, Japan), a 3D-SIM equipped with an Apochromat 100×/1.49 numerical aperture oil-immersion objective lens and solid-state lasers (488 nm, 561 nm, 640 nm, the output powers at the fiber end: 15 mW). Raw SIM images (containing nine images: three phases and three angles, 70 ns exposure time per image) were reconstructed and processed with NIS-Elements AR Analysis. SIM frames were deliberately spaced at 3-s or 5-s intervals according to the purpose of each experiment. Confocal imaging was performed on the same machine (640 nm, 70 ns, 20% power). All of Pearson's colocalization coefficients (PCC) were analyzed and quantified in the open-source software CellProfiler [54].
Cy5@Au NPs and commercial tags were prepared with DMEM with 10% FBS, followed by staining with cells in a cell incubator. Super-resolution images were obtained with the N-SIM, which was equipped with a CMOS camera (Hamamatsu, Japan). The green channel images were excited by a 488 nm laser. The red channel images were excited by a 561 nm laser. The far-red channel images were excited by a 640 nm laser. The magenta color in images is not the natural wavelength-color, but a false color of far-red.
To dynamically track lysosomes, Cy5@Au NPs with an excitation wavelength of 640 nm were imaged every 5 s.
Cell viability test
Cell cytotoxicity tests were performed using a Cell Counting Kit-8 (CCK-8, Dojindo Molecular Technologies, Inc., Japan). Once HeLa cells were planted in a 96-well plate, cell density reached at least 10,000/well, and different concentrations of Cy5@Au NPs were added to the wells and placed in the incubator for 24 h. After 10 μL of CCK-8 solution was added to each well, the culture plate was incubated for 2 h. Absorbance at 450 nm was determined with the Synergy Mx microplate reader (BioTek Instruments, Inc., USA).
Results and Discussion
Characterization data and cytotoxicity
As a cell probe, Cy5@Au NPs offer low cytotoxicity that is crucial for imaging. To determine their cytotoxicity, HeLa cells were seeded in a 96-well plate for 24 h and later treated with different concentrations of nanoparticles. After 24 h of the treatment of Cy5@Au NPs, the CCK-8 was incubated with the cells for 2 h, and the optical density of the plate was obtained. As shown in Figure S1, the cell viabilities of the concentrations tested were more than 95%, which marked a low cytotoxicity for Cy5@Au NPs in relation to HeLa cells and indicated the safety of using them as probes for imaging. The Cy5@Au NPs synthesized by Luna Nanotech contained three parts: a gold core, a biocompatible polyethylene glycol (PEG, 5 kDa) spacer, and the fluorescent dye Cy5 (Figure 1A). According to data provided by the manufacturer Luna Nanotech, the diameter of the gold core was 15 nm, and the average hydrodynamic size of the Cy5@Au NPs determined by dynamic light scattering in PBS buffer was 53.39 nm. To stabilize the nanoparticles against charge-induced aggregation, most PEG spacers were conjugated with methoxy to their terminal ends as backfill, and the dye-to-backfill ratio was 3:17. The number of Cy5 on one particle was calculated to be approximately 145. Under 640-nm laser irradiation, an emission between 650 nm and 750 nm for Cy5 was excited, for an emission wavelength that peaked at 670 nm (Figure S2 and S3).
(A) Schematic illustration of the compositions of a Cy5@Au NP. (B) SIM images of HeLa cells stained by Cy5@Au NPs (1.36 × 10⁻¹⁰ M) for different treatment periods. (C) SIM images of HeLa cells stained by Cy5@Au NPs in different concentrations for 24 h. The dilution ratios between original nanoparticles solution and DMEM (with FBS) were 1:2000, 1:1000, and 3:2000 and the corresponding molar concentrations of nanoparticles were 6.8 × 10⁻¹¹ M, 1.36 × 10⁻¹⁰ M, and 2.04 × 10⁻¹⁰ M, respectively.
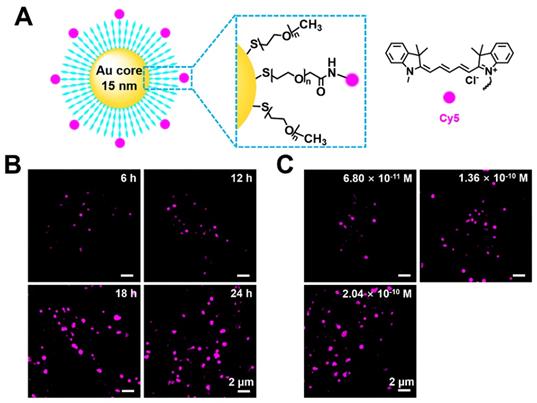
Time-dependent and concentration-dependent cellular uptake
To explore Cy5@Au NP as a potential probe in cells, the cellular internalization of the particles was investigated. Considering that endocytosis is the internalized mechanism of large particles in cells, an interval of 6 h was set as the treatment period. The human cervix carcinoma cell line HeLa was incubated with the particles and imaged under SIM. As shown in Figure 1B, punctate fluorescence was observed. Over time, the punctate fluorescent intensity increased and became stable at 24 h, after which different concentrations of Cy5@Au NPs internalized by cells were studied for 24 h. The fluorescence intensity at a concentration of 6.8 × 10⁻¹¹ M was too weak to be visible, whereas the intensity at a concentration of 2.04 × 10⁻¹⁰ M did not considerably boost the intensity at a concentration of 1.36 × 10⁻¹⁰ M (Figure 1C). Therefore, the concentration of 1.36 × 10⁻¹⁰ M and treatment time of 24 h were applied for the super-resolution imaging in the experiments that followed.
Super-resolution imaging of lysosomes
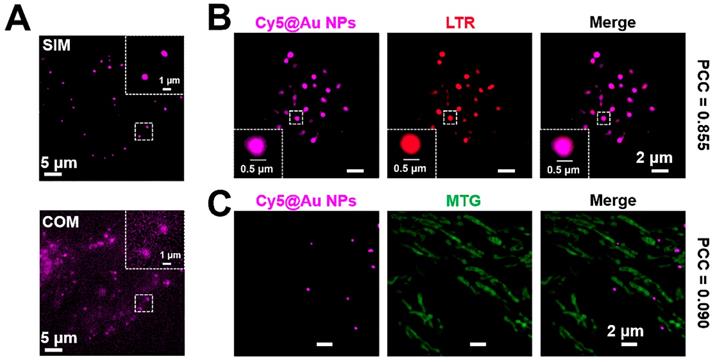
Confocal optical microscopy (COM) has been widely used for cell imaging. To compare the imaging quality of COM and SIM, HeLa cells treated with Cy5@Au NPs were imaged under both types of microscopy, which revealed that the SIM image had a lower fluorescence background and a clearer punctate fluorescence (Figure 2A). Moreover, the full width at half-maximum (FWHM) values of SIM are smaller than the values of COM, demonstrating the advantage using SIM (Figure S4) [55, 56]. To ensure the localization of the punctate fluorescence in cells, a colocalization assay was performed. After 24 h of treatment with Cy5@Au NPs, the lysosomes and mitochondria of HeLa cells were respectively stained with the commercial dyes LTR and MTG for SIM imaging. As shown in Figure 2B, a high overlap emerged in the fluorescence of Cy5@Au NPs and LTR, with a PCC of 0.855. By contrast, the PCC of Cy5@Au NPs and MTG, at only 0.090, indicated little overlap (Figure 2C). The lysosomal colocalization assays of Cy5@Au NPs were also performed with LTG and LAMP1-mGFP, and high PCC values were obtained (Figure S5 and S6). However, because of low transfection efficiency, only a few of cells with fluorescence of LAMP1-mGFP were found. The results thus imply that Cy5@Au NPs distributed in lysosomes specifically. Moreover, the dye Cy5, when incubated with HeLa cells for 24 h, showed a PCC of 0.624 with the commercial lysosomal dye (Figure S7), which suggests that the nanoparticles helped the dye to localize specifically in lysosomes.
(A) Images of COM and SIM. (B) SIM images of a colocalization experiment with HeLa cells costained with Cy5@Au NPs and LTR. (C) SIM images of a colocalization experiment with HeLa cells costained with Cy5@Au NPs and MTG.
Cy5@Au NPs in lysosomes during microenvironment change
The pH value of the microenvironment for lysosomes ranges from 4.5 to 5.0. Commercial dyes (e.g., LTG and LTR), consisting of a fluorophore and a weak base group, can freely permeate cell membranes, and once the weak base group protonates in the acidic microenvironment, LysoTrackers can be trapped in lysosomes. By the same token, when the lysosomal pH changes, the localization of deprotonated LysoTrackers lose track of their target [41, 42]. To determine whether Cy5@Au NPs enter lysosomes by endocytosis and remain there despite fluctuations in pH, the antimalarial drug chloroquine, a cell-permeable base, was used to stimulate living cells to raise the lysosomal pH. After treatment with LTR and LTG particles, HeLa cells were incubated with chloroquine in a concentration of 100 μM for 30 min. Before treatment with chloroquine, bright fluorescence from particles and commercial lysosomal dyes was observed; after treatment, the fluorescence of particles remained in cells, although the signals of LTR and LTG had faded (Figure 3A and S8A).
(A) SIM images of untreated and chloroquine-treated HeLa cells stained with Cy5@Au NPs and LTR, respectively. (B) SIM images of untreated and 4% paraformaldehyde-treated HeLa cells (i.e., for cell fixation) stained with Cy5@Au NPs and LTR, respectively.
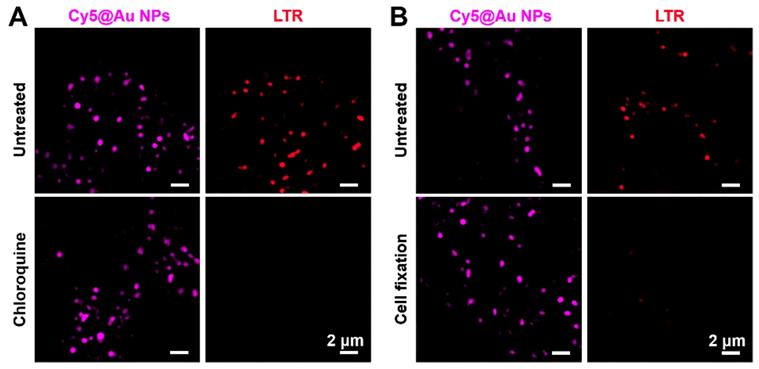
Cy5@Au NPs in lysosomes during LMP
The commercial dyes LTR and LTG are easily washed out when cells are subjected to cell fixation. After cells were fixed in our study, the membrane of lysosomes underwent permeabilization, and the molecular LTR and LTG escaped. As shown in Figures 3B and S8B, the fluorescence signals of LTR and LTG even disappeared in the fixed cells. By contrast, Cy5@Au NPs overcame that limitation, and a bright punctate fluorescence of Cy5@Au NPs for lysosomal staining was achieved in the fixed cells. Ultimately, LMP failed to eliminate nanoparticles from the lysosomes. The results thus suggest that Cy5@Au NPs can remain in lysosomes no matter how the lysosomal microenvironment and its membrane change.
Anti-photobleaching
For all subcellular probes, photostability is crucial for imaging. The photobleaching assays of Cy5@Au NPs, LTG, LTR, and LAMP1-mGFP were performed under laser irradiation with 100% power (15 mW). After 80 s of irradiation, the fluorescence intensity of LTR was entirely bleached (Figure 4C-4E), and remained at 18% for LTG, 30% for LAMP1-mGFP, and 50% for Cy5@Au NPs (Figure S9). As irradiation continued, the fluorescence intensity of Cy5@Au NPs decreased but remained at 35% after 120 s of irradiation (Figure 4A, 4B, and 4E). The results showed that Cy5@Au NPs displayed excellent anti-photobleaching ability.
(A) SIM image of HeLa cells stained with Cy5@Au NPs before photobleaching. (B) Magnified images of the dashed box in (A) during photobleaching. (C) SIM image of HeLa cells stained with LTR before photobleaching. (D) Magnified images of the dashed box in (C) during photobleaching. (E) Normalized intensity during photobleaching of Cy5@Au NPs and LTR. (F) SIM images of HeLa cells stained with Cy5@Au NPs and LTR for 3 d.
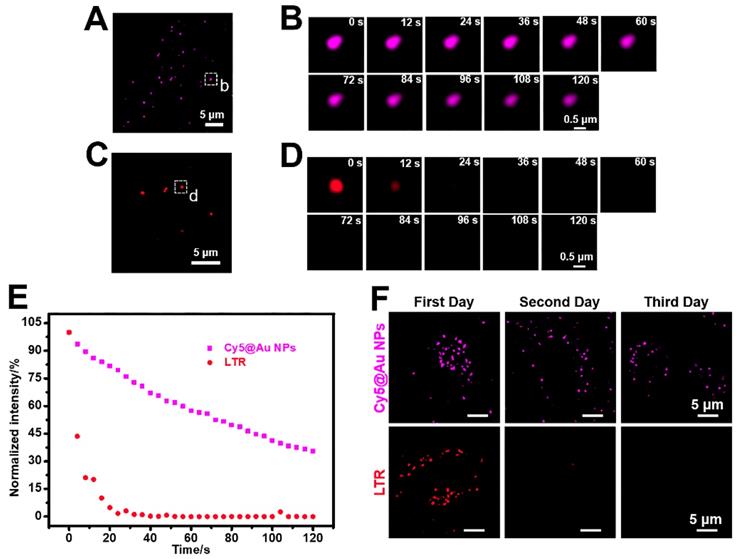
Long-term lysosomal labelling
To understand the particulars of lysosomal functions, the long-term labelling ability of lysosomal probes is pivotal [37, 57], hence our investigation of that ability in Cy5@Au NPs. After 24 h of treatment with Cy5@Au NPs (i.e., the first day), the fluorescence of HeLa cells was captured by SIM. Next, the petri dish was washed with PBS buffer 3 times and kept in the incubator for another 24 h. Given the space of the dish and the rate of cell proliferation, the experiment was performed for 3 d. For contrast, LTR and LTG were tested in the same way. As shown in Figures 4F and S10, the fluorescence signals of LTR and LTG nearly disappeared on the second day. The fluorescence of Cy5@Au NPs was observable on the third day, although its intensity had decreased over time. In sum, the assay exhibited the long-term (i.e., >3 d) lysosomal labelling ability of Cy5@Au NPs.
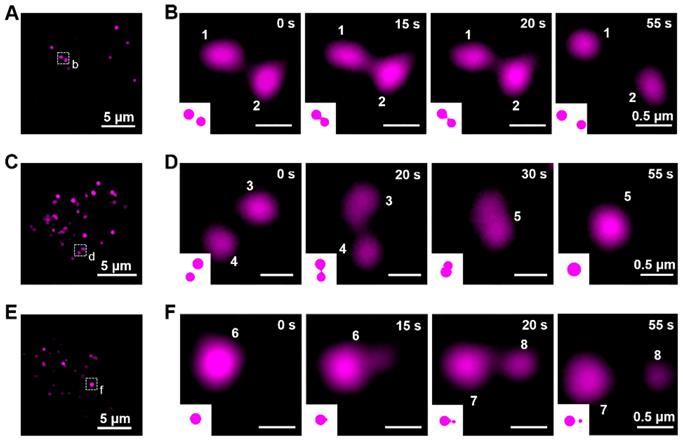
Kiss-and-run process, fusion, and fission of lysosomes
To exercise their cellular functions, lysosomes have to move and interact with each other [58-61]. Using the lysosome probe Cy5@ Au NPs, the fluorescent dynamics of lysosomes were captured by SIM, and their lysosome-lysosome interactions were categorized as kiss-and-run process, fusion, and fission. The kiss-and-run process was recorded first. As shown in Figures 5A, 5B, and S11A as well as in Video S1, two fluorescence lysosomes, labeled 1 and 2, kissed within 15 s and ran away at the 20-s mark. Kiss-and-fusion, as a fusion event, is depicted in Figures 5C, 5D, and S11B as well as in Video S2; therein, two fluorescence lysosomes, labeled 3 and 4, kissed and fused within 10 s to form a hybrid lysosome, labeled 5. Beyond that, during fission, lysosomes can self-divide into multiple lysosomes; thus, for fission, a large lysosome, labeled 6, emerged at first and split into two other lysosomes, labeled 7 and 8, within 5 s and thereafter separated (Figure 5E, 5F, and S11C, Video S3).
The dynamics of lysosomes in living cells. (A) SIM image of HeLa cells stained with Cy5@Au NPs before kiss-and-run process. (B) Magnified images of the dashed box in (A) during kiss-and-run process. (C) SIM image of HeLa cells stained with Cy5@Au NPs before fusion. (D) Magnified images of the dashed box in (C) during fusion. (E) SIM image of HeLa cells stained with Cy5@Au NPs before fission. (F) Magnified images of the dashed box in (E) during fission.
Imaging mitophagy in HeLa cells
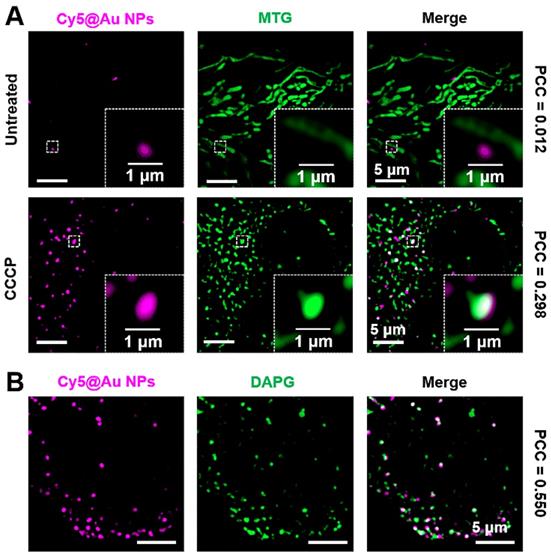
As a vital organelle, lysosomes are involved in many important cellular functions, including autophagy [62, 63], during which a cell consumes itself and is decomposed by lysosomes. Mitophagy is a well-known type of autophagy. Mitochondria are important sites for cellular respiration that provide energy to cells. When mitochondria are damaged, the cell initiates mitophagy in order to recycle the damaged mitochondria [64-66]. CCCP, a de-coupler of oxidative phosphorylation that abolishes the mitochondrial membrane proton gradient, can induce mitochondrial damage [10, 67]. In our study, after staining MTG and Cy5@Au NPs, HeLa cells were thus treated with 10 μM of CCCP for 12 h to damage the mitochondria. Investigated under SIM, the morphologies of most mitochondria changed from filamentous to spherical (Figure 6A), thereby indicating that the mitochondria had been severely damaged. Compared to the untreated cells, the number of lysosomes increased, and the lysosomes showed an increasing overlap of 0.298 with the mitochondria, indicating the fusion of lysosomes and mitochondria [68, 69]. DAPGreen is a commercial fluorescent molecule for autophagosomes and autolysosomes detection, and can be used to detect autophagy [70]. To confirm the occurrence of autophagy, DAPGreen was incubated with the CCCP-treated HeLa cells for 30 min. A symbolic fluorescent signal of DAPGreen indicating autophagy appeared in the cells (Figure 6B), and some of the DAPGreen fluorescence fused with the lysosomes (PCC 0.550), which implies that autolysosomes have formed and that autophagy has occurred.
(A) SIM images of untreated and CCCP-treated HeLa cells stained with Cy5@Au NPs and MTG. (B) SIM images of CCCP-treated HeLa cells stained with Cy5@Au NPs and DAPGreen (DAPG).
Conclusion
The fluorescent gold nanoparticles were used as lysosomal probes for the super-resolution imaging in living cells. Compared with commercial lysosomal dyes, Cy5@Au NPs exhibited stronger tolerance in lysosomes during various treatments, and changes in the lysosomal microenvironment and LMP did not cause Cy5@Au NPs to lose track of their targets. Cy5@Au NPs demonstrated an excellent anti-photobleaching ability, and a long-term labelling assay revealed that they could stain lysosomes more than 3 d. Moreover, the particles exhibited low cytotoxicity to HeLa cells. Last, biological events such as the kiss-and-run process, fusion, fission, and mitophagy were recorded with the fluorescent Cy5@Au NPs under SIM. All of those results indicate that Cy5@Au NPs can be a useful tool for visualizing lysosomes in super-resolution. For the simple modification of fluorophores on the surface, nanoparticles with different fluorophores can meet the requirements of various experiments. Beyond that, autophagy has recently been characterized as a pathway for drug-resistant cells to escape death, and the phagocytosis of drug-damaged organelles was shown to prevent the initiation of apoptosis [71-73]. As lysosomal probes, Cy5@Au NPs can thus be further used to observe the difference of autophagy between cancer cells and corresponding drug-resistant cells in the future.
Abbreviations
STORM: stochastic optical reconstruction microscopy; STED: stimulated emission depletion; SIM: structured illumination microscopy; LTG: LysoTracker Green; LTR: LysoTracker Red; LMP: lysosomal membrane permeabilization; PEG: polyethylene glycol; Cy5: cyanine 5; CCCP: carbonyl cyanide m-chlorophenylhydrazone; MTG: MitoTracker Green FM; FBS: fetal bovine serum; DMEM: Dulbecco's modified Eagle's medium; PBS: phosphate-buffered saline; PCC: Pearson's colocalization coefficients; COM: confocal optical microscopy.
Acknowledgements
We wish to thank CellProfiler team for providing a clear explanation tutorial of their open source software image analysis tool. This work was supported by the National Science Foundation of China (Nos. 21525105, 21778079 and 21904144), and the Ministry of Education of China (No. IRT-17R111).
Supplementary Material
Supplementary figures.
Video S1.
Video S2.
Video S3.
Competing Interests
The authors have declared that no competing interest exists.
References
1. Schrader M, Godinho LF, Costello JL, Islinger M. The different facets of organelle interplay-an overview of organelle interactions. Front Cell Dev Biol. 2015;3:56
2. Gordaliza-Alaguero I, Canto C, Zorzano A. Metabolic implications of organelle-mitochondria communication. EMBO Rep. 2019;20:e47928
3. Wong YC, Kim S, Peng W, Krainc D. Regulation and function of mitochondria-lysosome membrane contact sites in cellular homeostasis. Trends Cell Biol. 2019;29:500-13
4. Wong YC, Ysselstein D, Krainc D. Mitochondria-lysosome contacts regulate mitochondrial fission via RAB7 GTP hydrolysis. Nature. 2018;554:382-6
5. Ba Q, Raghavan G, Kiselyov K, Yang G. Whole-cell scale dynamic organization of lysosomes revealed by spatial statistical analysis. Cell Rep. 2018;23:3591-606
6. Soubannier V, McLelland GL, Zunino R, Braschi E, Rippstein P, Fon EA. et al. A vesicular transport pathway shuttles cargo from mitochondria to lysosomes. Curr Biol. 2012;22:135-41
7. Thomas JA. Optical imaging probes for biomolecules: an introductory perspective. Chem Soc Rev. 2015;44:4494-500
8. Chen Q, Jin C, Shao X, Guan R, Tian Z, Wang C. et al. Super-resolution tracking of mitochondrial dynamics with an iridium(III) luminophore. Small. 2018;14:1802166
9. Han Y, Li M, Qiu F, Zhang M, Zhang YH. Cell-permeable organic fluorescent probes for live-cell long-term super-resolution imaging reveal lysosome-mitochondrion interactions. Nat Commun. 2017;8:1307
10. Chen Q, Shao X, Tian Z, Chen Y, Mondal P, Liu F. et al. Nanoscale monitoring of mitochondria and lysosome interactions for drug screening and discovery. Nano Res. 2019;12:1009-15
11. Wombacher R, Heidbreder M, van de Linde S, Sheetz MP, Heilemann M, Cornish VW. et al. Live-cell super-resolution imaging with trimethoprim conjugates. Nat Methods. 2010;7:717-9
12. Huang B, Jones SA, Brandenburg B, Zhuang X. Whole-cell 3D STORM reveals interactions between cellular structures with nanometer-scale resolution. Nat Methods. 2008;5:1047-52
13. Watanabe S, Punge A, Hollopeter G, Willing KI, Hobson RJ, Davis MW. et al. Protein localization in electron micrographs using fluorescence nanoscopy. Nat Methods. 2011;8:80-4
14. Heller I, Sitters G, Broekmans OD, Farge G, Menges C, Wende W. et al. STED nanoscopy combined with optical tweezers reveals protein dynamics on densely covered DNA. Nat Methods. 2013;10:910-6
15. Li D, Shao L, Chen BC, Zhang X, Zhang M, Moses B. et al. Extended-resolution structured illumination imaging of endocytic and cytoskeletal dynamics. Science. 2015;349:aab3500
16. Nixon-Abell J, Obara CJ, Weigel AV, Li D, Legant WR, Xu CS. et al. Increased spatiotemporal resolution reveals highly dynamic dense tubular matrices in the peripheral ER. Science. 2016;354:aaf3928
17. Fang H, Yao S, Chen Q, Liu C, Cai Y, Geng S. et al. De novo-designed near-infrared nanoaggregates for super-resolution monitoring of lysosomes in cells, in whole organoids, and in vivo. ACS Nano. 2019;13:14426-36
18. Heintzmann R, Huser T. Super-resolution structured illumination microscopy. Chem Rev. 2017;117:13890-908
19. Wang L, Frei MS, Salim A, Johnsson K. Small-molecule fluorescent probes for live-cell super-resolution microscopy. J Am Chem Soc. 2019;141:2770-81
20. Huang X, Fan J, Li L, Liu H, Wu R, Wu Y. et al. Fast, long-term, super-resolution imaging with Hessian structured illumination microscopy. Nat Biotechnol. 2018;36:451-9
21. Chen Q, Shao X, Hao M, Guan R, Tian Z, Li M. et al. Quantitative analysis of interactive behavior of mitochondria and lysosomes using structured illumination microscopy. Biomaterials. 2020;250:120059
22. Shao X, Chen Q, Hu L, Tian Z, Liu L, Liu F. et al. Super-resolution quantification of nanoscale damage to mitochondria in live cells. Nano Res, in press. doi: 10.1007/s12274-020-2822-9.
23. De Duve C, Wattiaux R. Functions of Lysosomes. Annu Rev Physiol. 1966;28:435-92
24. Lie PPY, Nixon RA. Lysosome trafficking and signaling in health and neurodegenerative diseases. Neurobiol Dis. 2019;122:94-105
25. Luzio JP, Pryor PR, Bright NA. Lysosomes: fusion and function. Nat Rev Mol Cell Biol. 2007;8:622-32
26. Platt FM. Emptying the stores: lysosomal diseases and therapeutic strategies. Nat Rev Drug Discov. 2018;17:133-50
27. Ghosh M, Carlsson F, Laskar A, Yuan XM, Li W. Lysosomal membrane permeabilization causes oxidative stress and ferritin induction in macrophages. FEBS Lett. 2011;585:623-9
28. Qiu K, Zhu H, Rees TW, Ji L, Zhang Q, Chao H. Recent advances in lysosome-targeting luminescent transition metal complexes. Coord Chem Rev. 2019;398:113010
29. Rebecca VW, Nicastri MC, McLaughlin N, Fennelly C, McAfee Q, Ronghe A. et al. A unified approach to targeting the lysosome's degradative and growth signaling roles. Cancer Discov. 2017;7:1266-83
30. Pastore N, Vainshtein A, Klisch TJ, Armani A, Huynh T, Herz NJ. et al. TFE3 regulates whole-body energy metabolism in cooperation with TFEB. EMBO Mol Med. 2017;9:605-21
31. Castellano BM, Thelen AM, Moldavski O, Feltes M, van der Welle RE, Mydock-McGrane L. et al. Lysosomal cholesterol activates mTORC1 via an SLC38A9-Niemann-Pick C1 signaling complex. Science. 2017;355:1306-11
32. Saftig P, Klumperman J. Lysosome biogenesis and lysosomal membrane proteins: trafficking meets function. Nat Rev Mol Cell Biol. 2009;10:623-35
33. Nixon RA. The role of autophagy in neurodegenerative disease. Nat Med. 2013;19:983-97
34. Levine B. Cell biology: autophagy and cancer. Nature. 2007;446:745-7
35. Xue Z, Wang S, Li J, Chen X, Han J, Han S. Bifunctional super-resolution imaging probe with acidity-independent lysosome-retention mechanism. Anal Chem. 2018;90:11393-400
36. Zhang H, Zhu X, Liu G, Ding X, Wang J, Yang M. et al. Conformationally induced off-on two-photon fluorescent bioprobes for dynamically tracking the interactions among multiple organelles. Anal Chem. 2019;91:6730-7
37. Qiu K, Huang H, Liu B, Liu Y, Huang Z, Chen Y. et al. Long-term lysosomes tracking with a water-soluble two-photon phosphorescent iridium(III) complex. ACS Appl Mater Interfaces. 2016;8:12702-10
38. Singh H, Sreedharan S, Tiwari K, Green NH, Smythe C, Pramanik SK. et al. Two photon excitable graphene quantum dots for structured illumination microscopy and imaging applications: lysosome specificity and tissue-dependent imaging. Chem Commun. 2019;55:521-4
39. Wu L, Li X, Ling Y, Huang C, Jia N. Morpholine derivative-functionalized carbon dots-based fluorescent probe for highly selective lysosomal imaging in living cells. ACS Appl Mater Interfaces. 2017;9:28222-32
40. Li X, Zhao R, Wang Y, Huang C. A new GFP fluorophore-based probe for lysosome labelling and tracing lysosomal viscosity in live cells. J Mater Chem B. 2018;6:6592-8
41. LysoTracker® and LysoSensorTM probes. https://tools.thermofisher.com/content/sfs/manuals/mp07525.pdf
42. Pierzynska-Mach A. Janowski PA. Dobrucki JW. Evaluation of acridine orange, lysotracker red, and quinacrine as fluorescent probes for long-term tracking of acidic vesicles. Cytometry, Part A. 2014;85:729-37
43. Xu W, Zeng Z, Jiang JH, Chang YT, Yuan L. Discerning the chemistry in individual organelles with small-molecule fluorescent probes. Angew Chem Int Ed. 2016;55:13658-99
44. Liu X, Su Y, Tian H, Yang L, Zhang H, Song X. et al. Ratiometric fluorescent probe for lysosomal pH measurement and imaging in living cells using single-wavelength excitation. Anal Chem. 2017;89:7038-45
45. Johansson AC, Appelqvist H, Nilsson C, Kågedal K, Roberg K, Ollinger K. Regulation of apoptosis-associated lysosomal membrane permeabilization. Apoptosis. 2010;15:527-40
46. Repnik U, Hafner Česen M, Turk B. Lysosomal membrane permeabilization in cell death: concepts and challenges. Mitochondrion. 2014;19:49-57
47. Chen X, Zhang X, Xia LY, Wang HY, Chen Z, Wu FG. One-step synthesis of ultrasmall and ultrabright organosilica nanodots with 100% photoluminescence quantum yield: long-term lysosome imaging in living, fixed, and permeabilized cells. Nano Lett. 2018;18:1159-67
48. Zhang X, Chen X, Guo Y, Jia HR, Jiang YW, Wu FG. Endosome/lysosome-detained supramolecular nanogels as an efflux retarder and autophagy inhibitor for repeated photodynamic therapy of multidrug-resistant cancer. Nanoscale Horiz. 2020;5:481-7
49. Rathore B, Sunwoo K, Jangili P, Kim J, Kim JH, Huang M. et al. Nanomaterial designing strategies related to cell lysosome and their biomedical applications: A review. Biomaterials. 2019;211:25-47
50. Bai S, Xu B, Guo Y, Qiu J, Yu W, Xie G. High-discrimination factor nanosensor based on tetrahedral DNA nanostructures and gold nanoparticles for detection of miRNA-21 in live cells. Theranostics. 2018;8:2424-34
51. Napp J, Markus MA, Heck JG, Dullin C, Möbius W, Gorpas D. et al. Therapeutic fluorescent hybrid nanoparticles for traceable delivery of glucocorticoids to inflammatory sites. Theranostics. 2018;8:6367-83
52. Wang C, Pulli B, Jalali Motlagh N, Li A, Wojtkiewicz GR, Schmidt SP. et al. A versatile imaging platform with fluorescence and CT imaging capabilities that detects myeloperoxidase activity and inflammation at different scales. Theranostics. 2019;9:7525-36
53. Falcón-Pérez JM, Nazarian R, Sabatti C, Dell'Angelica EC. Distribution and dynamics of Lamp1-containing endocytic organelles in fibroblasts deficient in BLOC-3. J Cell Sci. 2005;118:5243-55
54. McQuin C, Goodman A, Chernyshev V, Kamentsky L, Cimini BA, Karhohs KW. et al. CellProfiler 3.0: Next-generation image processing for biology. PLoS Biol. 2018;16:e2005970
55. Dang D, Zhang H, Xu Y, Xu R, Wang Z, Kwok RTK. et al. Super-resolution visualization of self-assembling helical fibers using aggregation-induced emission luminogens in stimulated emission depletion nanoscopy. ACS Nano. 2019;13:11863-73
56. Xu Y, Zhang H, Zhang N, Wang X, Dang D, Jing X. et al. Deep-red fluorescent organic nanoparticles with high brightness and photostability for super-resolution in vitro and in vivo imaging using STED nanoscopy. ACS Appl Mater Interfaces. 2020;12:6814-26
57. Shi H, He X, Yuan Y, Wang K, Liu D. Nanoparticle-based biocompatible and long-life marker for lysosome labeling and tracking. Anal Chem. 2010;82:2213-20
58. Ballabio A, Bonifacino JS. Lysosomes as dynamic regulators of cell and organismal homeostasis. Nat Rev Mol Cell Biol. 2020;21:101-18
59. Bright NA, Gratian MJ, Luzio JP. Endocytic delivery to lysosomes mediated by concurrent fusion and kissing events in living cells. Curr Biol. 2005;15:360-5
60. Saffi GT, Botelho RJ. Lysosome fission: planning for an exit. Trends Cell Biol. 2019;29:635-46
61. Luzio JP, Gray SR, Bright NA. Endosome-lysosome fusion. Biochem Soc Trans. 2010;38:1413-6
62. Yoshii SR, Mizushima N. Monitoring and measuring autophagy. Int J Mol Sci. 2017;18:E1865
63. Parzych KR, Klionsky DJ. An overview of autophagy: morphology, mechanism, and regulation. Antioxid Redox Signal. 2014;20:460-73
64. Palikaras K, Lionaki E, Tavernarakis N. Mechanisms of mitophagy in cellular homeostasis, physiology and pathology. Nat Cell Biol. 2018;20:1013-22
65. Chan DC. Mitochondrial dynamics and its involvement in disease. Annu Rev Pathol. 2020;15:235-59
66. Twig G, Shirihai OS. The interplay between mitochondrial dynamics and mitophagy. Antioxid Redox Signal. 2011;14:1939-51
67. de Graaf AO, van den Heuvel LP, Dijkman HB, de Abreu RA, Birkenkamp KU, de Witte T. et al. Bcl-2 prevents loss of mitochondria in CCCP-induced apoptosis. Exp Cell Res. 2004;299:533-40
68. Wang Y, Li L, Hou C, Lai Y, Long J, Liu J. et al. SNARE-mediated membrane fusion in autophagy. Semin Cell Dev Biol. 2016;60:97-104
69. Tian Z, Gong J, Crowe M, Lei M, Li D, Ji B. et al. Biochemical studies of membrane fusion at the single-particle level. Prog Lipid Res. 2019;73:92-100
70. Iwashita H, Sakurai HT, Nagahora N, Ishiyama M, Shioji K, Sasamoto K. et al. Small fluorescent molecules for monitoring autophagic flux. FEBS Lett. 2018;592:559-67
71. Kondo Y, Kondo S. Autophagy and cancer therapy. Autophagy. 2006;2:85-90
72. Sui X, Chen R, Wang Z, Huang Z, Kong N, Zhang M. et al. Autophagy and chemotherapy resistance: a promising therapeutic target for cancer treatment. Cell Death Dis. 2013;4:e838
73. Ikeda T, Ishii KA, Saito Y, Miura M, Otagiri A, Kawakami Y. et al. Inhibition of autophagy enhances sunitinib-induced cytotoxicity in rat pheochromocytoma PC12 cells. J Pharmacol Sci. 2013;121:67-73
Author contact
![]() Corresponding authors: ceschhsysu.edu.cn (H.C.); jiajie.diaoedu (J. D.).
Corresponding authors: ceschhsysu.edu.cn (H.C.); jiajie.diaoedu (J. D.).