Impact Factor
- Issue 14; 2026
- Issue 13; 2026
- Issue 12; 2026
- Issue 11; 2026
- Issue 10; 2026
- Volume 16; 2026
- Advance Articles
- Past Issues
- Cover Images
- Cover Suggestion
- Index & Coverage
- Special Issues
Introduction
Methods
Results
Discussion
Conclusion
Abbreviations
Supplementary Material
Acknowledgements
References
International Journal of Biological Sciences
International Journal of Medical Sciences
 Global reach, higher impact

Theranostics 2021; 11(4):1845-1863. doi:10.7150/thno.50905 This issue Cite
Research Paper
Mitochondrial ROS promote mitochondrial dysfunction and inflammation in ischemic acute kidney injury by disrupting TFAM-mediated mtDNA maintenance
Meng Zhao1#, Yizhuo Wang1#, Ling Li2, Shuyun Liu1, Chengshi Wang1, Yujia Yuan1, Guang Yang3, Younan Chen1, Jingqiu Cheng1, Yanrong Lu1, Jingping Liu1 ![]()
1. Key Laboratory of Transplant Engineering and Immunology, National Clinical Research Center for Geriatrics, Frontiers Science Center for Disease-related Molecular Network, West China Hospital, Sichuan University, Chengdu, China.
2. Department of Nephrology, West China Hospital, Sichuan University, Chengdu, China.
3. Animal Center, West China Hospital, Sichuan University, Chengdu, China.
#Co-first authors that contributed equally to this work.
Received 2020-7-20; Accepted 2020-11-11; Published 2021-1-1
Abstract

Aims: Ischemia-reperfusion injury (IRI)-induced acute kidney injury (IRI-AKI) is characterized by elevated levels of reactive oxygen species (ROS), mitochondrial dysfunction, and inflammation, but the potential link among these features remains unclear. In this study, we aimed to investigate the specific role of mitochondrial ROS (mtROS) in initiating mitochondrial DNA (mtDNA) damage and inflammation during IRI-AKI.
Methods: The changes in renal function, mitochondrial function, and inflammation in IRI-AKI mice with or without mtROS inhibition were analyzed in vivo. The impact of mtROS on TFAM (mitochondrial transcription factor A), Lon protease, mtDNA, mitochondrial respiration, and cytokine release was analyzed in renal tubular cells in vitro. The effects of TFAM knockdown on mtDNA, mitochondrial function, and cytokine release were also analyzed in vitro. Finally, changes in TFAM and mtDNA nucleoids were measured in kidney samples from IRI-AKI mice and patients.
Results: Decreasing mtROS levels attenuated renal dysfunction, mitochondrial damage, and inflammation in IRI-AKI mice. Decreasing mtROS levels also reversed the decrease in TFAM levels and mtDNA copy number that occurs in HK2 cells under oxidative stress. mtROS reduced the abundance of mitochondrial TFAM in HK2 cells by suppressing its transcription and promoting Lon-mediated TFAM degradation. Silencing of TFAM abolished the Mito-Tempo (MT)-induced rescue of mitochondrial function and cytokine release in HK2 cells under oxidative stress. Loss of TFAM and mtDNA damage were found in kidneys from IRI-AKI mice and AKI patients.
Conclusion: mtROS can promote renal injury by suppressing TFAM-mediated mtDNA maintenance, resulting in decreased mitochondrial energy metabolism and increased cytokine release. TFAM defects may be a promising target for renal repair after IRI-AKI.
Keywords: acute kidney injury, mitochondria, mtDNA, ROS, TFAM
Introduction
Acute kidney injury (AKI) is characterized by a rapid decline in renal function with high mortality and morbidity and is a serious health issue worldwide [1]. AKI is increasing in incidence and can be caused by trauma, sepsis, surgery, or nephrotoxic drugs, and ischemia-reperfusion injury (IRI) is one of its leading causes [2]. IRI disrupts the cellular redox balance and triggers excessive ROS production in the kidneys upon reperfusion, leading to a series of events that follow IRI-induced AKI (IRI-AKI) and include mitochondrial damage, energy depletion, tubular apoptosis and necrosis [3-5]. Moreover, incomplete recovery from AKI can trigger renal fibrosis and thus increase the risk of chronic kidney disease (CKD) and end-stage renal failure (ESRD) [6-8]. Currently, clinical interventions for AKI patients include renal replacement therapy (RRT) and nutritional supplementation. No effective therapy has been established, although many pharmacologic therapies such as diuretics, vasoactive drugs, and growth factors have been reported in animal models or preliminary clinical studies [9,10]. Therefore, novel therapeutic targets for AKI are urgently needed.
The pathological mechanism of IRI-AKI is complicated, and oxidative stress is considered one of the primary factors leading to the condition [11,12]. The overproduction of reactive oxygen species (ROS) contributes to multiple cellular processes related to renal injury, such as cytosolic calcium overload, energy depletion, apoptosis/necrosis, and inflammation [3]. Increasing evidence indicates that the mitochondrion is a main source of intracellular ROS, and ~90% of ROS are generated in mitochondria [3]. Mitochondrial ROS (mtROS) are primarily produced at complexes I and III of the electron transport chain (ETC) when electrons derived from either NADH or FADH2 react with O2 [13]. The formation of mtROS due to proton leakage takes place under normal respiratory conditions but can be greatly enhanced in response to stress [14,15]. The burst of ROS production that occurs after IRI-AKI has been shown to cause direct oxidative damage to mitochondrial proteins and lipids, thereby impairing mitochondrial bioenergetics by disrupting ETC function and increasing mitochondrial membrane permeability [16]. Moreover, mtROS can also induce renal injury by activating proinflammatory signals such as Toll-like receptors (TLRs) and the NLRP3 inflammasome [17,18].
Although the adverse impact of mtROS on renal function has been demonstrated, the detailed mechanism by which ROS initiate mitochondrial dysfunction and inflammation during IRI-AKI is not completely understood. Recently, mitochondrial DNA (mtDNA) damage has emerged as a hallmark feature of AKI, and mtDNA depletion has been found both in preclinical models and in human patients with AKI [19]. However, the link between mtROS and mtDNA damage during IRI-AKI remains unclear. mtDNA encodes 13 protein subunits of the ETC complexes and a set of transfer and ribosomal RNAs; thus, mitochondrial function is extremely dependent on functional mtDNA. mtDNA is a double-stranded circular DNA molecule that is present in multiple copies in the mitochondrial matrix and exists in condensed DNA-protein complexes known as nucleoids. The maintenance of mtDNA stability is primarily mediated by mitochondrial transcription factor A (TFAM), an essential mtDNA packaging protein that is required for mtDNA replication and transcription [20]. Under pathological conditions, disruption of TFAM could lead to mtDNA depletion and deficient mitochondrial bioenergetics [21]. Based on these findings, we speculated that ROS may disrupt the stability of mtDNA, but the detailed process still requires investigation.
In this study, we aimed to investigate the specific role of mtROS in mtDNA damage and inflammation during IRI-AKI. In vivo mouse IRI and in vitro cell hypoxia/reoxygenation (H/R) models were used to mimic the pathology of IRI-AKI. Changes in renal function, mitochondrial function, mtDNA maintenance, and TFAM expression were analyzed in the cell H/R and IRI-AKI mouse models with or without mtROS inhibition. The effects of mtROS on signaling pathways related to mtDNA maintenance and TFAM turnover were also analyzed.
Methods
Materials and reagents
The primary antibodies used in this study were purchased from the following sources: anti-Kim-1 (R&D Systems, USA); anti-TNF-α, anti-TOM20, anti-Bax (Cell Signaling Technology, Beverly, MA, USA); anti-8-OHdG, anti-dsDNA, anti-CD68 (Abcam, USA); anti-TFAM, anti-GAPDH, anti-Lon, anti-NGAL (ABclonal Biotech Co., Ltd., Cambridge, MA, USA); anti-p53, anti-ICAM, anti-ATP5a-1 (Proteintech, Rosemont, IL, USA). Mito-Tempo (MT, an mtROS scavenger) was purchased from Santa Cruz Biotechnology (CA, USA) and was dissolved in DMSO as a stock solution.
Animal experiments
All animal experiments were approved by the Animal Care and Use Committee of West China Hospital, Sichuan University (No. 2018198A) and were conducted according to the National Institutes of Health Guide for the Care and Use of Laboratory Animals. Male C57BL/6 mice (20-25 g) were purchased from the Experimental Animal Center of Sichuan University (Chengdu, China). The animals were housed under standardized conditions with controlled temperature, humidity and 12-h cycles of light and darkness and provided with standard chow and tap water ad libitum. The mice were randomly divided into four groups (n = 6 per group): Control, IRI-AKI, IRI-AKI + MT, and IRI-AKI + vehicle. The mouse model of renal IRI injury used in this study was established as previously described [22]. Briefly, the mice were anesthetized with 1% pentobarbital sodium (50 mg/kg, Merck, Darmstadt, Germany); mice with I/R injury received bilateral clamping of the renal pedicles for 30 min, and the mice in the control group received laparotomy only. To specifically inhibit the ROS burst in the kidney, an initial dose of 25 μL MT (5 μM in 0.05% DMSO in PBS) was directly injected into each kidney of the IRI-AKI mice using an insulin syringe after reperfusion; this was followed by daily intraperitoneal injection of MT (5 mg/kg, dissolved in 5% DMSO in PBS). The mice in the IRI-AKI alone group received vehicle at the same times and in the same volume as did the mice in the other groups using the same protocol. The body temperature of the animals was maintained at 37 °C during the surgery. On day 5 after surgery, the mice in each group were sacrificed by an overdose of anesthesia, and serum and renal samples were collected for further analysis.
Biochemical analysis
Clinical biochemical analysis of the serum samples was performed on an automatic biochemistry analyzer (Cobas 6000, Roche Diagnostics, Switzerland); and the parameters, including creatinine (CREA) and blood urea nitrogen (UREAL), were measured using appropriate kits.
Renal mtROS measurement
Renal tissues were stained with MitoSOX as previous described [23,24]. Briefly, the fresh renal tissues removed from the mice were immediately frozen and cut into 5-µm-thick sections. The renal sections were incubated with MitoSOX Red dye (5 µM, Thermo Fisher Scientific, Sunnyvale, CA, USA) and Hoechst 33258 dye (10 μg/mL, Beyotime Biotechnology, Shanghai, China) in a dark, humidified container at 37 °C for 30 min, and images were acquired by fluorescence microscopy (Imager Z2, Zeiss, Germany).
Renal mitochondrial morphology assay
Fresh renal tissues from the mice were fixed in 2.5% glutaraldehyde, dehydrated and embedded in EPON resin. Ultrathin sections prepared from the embedded tissues were stained with 5% uranyl acetate and lead citrate solution and observed by TEM (H-600, Hitachi, Ltd., Tokyo, Japan). Mitochondrial length/width ratio and average area were measured using ImageJ software (NIH, MD, USA) as previously described [24,25]. In brief, ~15 mitochondria in each image were randomly selected, and the mitochondrial length and width were traced and measured using the Length parameter; mitochondrial area was measured using the Area parameter.
Renal ATP measurement
ATP was measured using a bioluminescence assay kit (Beyotime Biotechnology, Shanghai, China). Briefly, the fresh kidney samples were lysed in the lysis buffer provided with the kit. The supernatant was collected by centrifugation at 12,000 rpm for 5 min at 4 °C. The concentration of ATP present in the samples was determined by mixing 20 μL of the supernatant with 100 μL of luciferase reagent; the luciferase present in the reagent catalyzes the production of luminescence from ATP and luciferin. The luminescence of each sample was measured on a microplate luminometer (Synergy Mx, BioTek Instruments Inc., Winooski, VT, USA). A standard curve of ATP was prepared using a series of standards of known concentrations; the measured ATP is presented as nmol/mg of protein.
Immunofluorescence (IF) staining
Cells and frozen renal tissue sections were fixed with 4% paraformaldehyde in PBS for 10 min at room temperature, washed with PBS, and permeabilized with 0.3% Triton X-100 for 10 min. After blocking in 1% BSA for 30 min, the cells were immunolabeled with primary antibodies (anti-Kim-1 at 1:150 dilution; anti-TNF-α at 1:100 dilution; anti-dsDNA at 1:400 dilution; anti-TOM20 at 1:100 dilution; or anti-TFAM at 1:50 dilution) overnight at 4 °C followed by incubation with FITC- or TRITC-conjugated secondary antibody (1:200) for 1 h at 37 °C. Nuclei were visualized by staining with DAPI for 5 min at room temperature. Digital images of the sections were captured using a fluorescence microscope (Nikon, N-STORM & A1, Tokyo, Japan), and the Pearson's correlation coefficient between the TFAM and dsDNA results was analyzed using Image-Pro Plus.
Renal histopathology
Renal tissues were fixed in 10% formalin and embedded in paraffin, and 5-µm sections of the embedded kidneys were stained with hematoxylin and eosin (H&E). Cell apoptosis was measured by TUNEL staining (Promega, USA) of the frozen renal sections according to the manufacturer's protocol. For immunohistochemical (IHC) staining, the renal sections were incubated with primary antibodies including anti-TFAM (1:50), anti-8-OHdG (1:100), and anti-CD68 (1:100) overnight at 4 °C and then with HRP-conjugated secondary antibodies (Millipore, MA, USA) and the DAB substrate. Micrographs of the stained sections were captured by light microscopy (Zeiss Imager A2, Germany) and quantified using ImageJ (NIH, Bethesda, MD, USA).
RNA isolation and real-time PCR
Total RNA was extracted from renal tissue and cells using Trizol (Gibco, Life Technologies, CA, USA) and reverse-transcribed into cDNA using an iScript cDNA synthesis kit (Bio-Rad, USA). The primers used in this study are listed in Table S1. Real-time polymerase chain reaction (real-time PCR) was performed using SYBR Green PCR mix (Vazyme Biotech, Nanjing, China) in a real-time PCR apparatus (Bio-Rad, CA, USA). The data were analyzed using Bio-Rad CFX Manager software, and relative changes in mRNA levels were calculated by the delta-delta Ct method with GAPDH as the internal reference gene.
Cell culture and treatment
The human renal proximal tubule epithelial cell line HK2 was cultured in DME/F12 medium (HyClone, USA) supplemented with 10% fetal bovine serum (FBS, Gibco, CA, USA), 100 U/mL penicillin, and 100 µg/mL streptomycin in a humidified atmosphere at 37 °C with 5% CO2. Oxidative stress of the cells was induced by treatment with tert-butyl hydroperoxide (t-BHP, 80 μM, Sigma-Aldrich, Taufkirchen, Germany) or hypoxia (≤ 1% O2, 5% CO2, 94% N2 for 24 h)/reoxygenation (21% O2, 5% CO2, 74% N2 for 2 h); excessive mtROS in cells were eliminated by treatment of the cells with MT (25 nM). To determine the roles of various sources and types of ROS, the cells were treated with specific ROS inhibitors, including catalase (CAT, 10 μM), GKT (an NADPH oxidase 4 (Nox4) inhibitor, 5 µM, CSN Pharm, Shanghai, China), apocynin (APO, an NADPH oxidase inhibitor, 10 µM, CSN Pharm, Shanghai, China), and 1400W (an inducible nitric oxide synthase (iNOS) inhibitor, 50 µM, CSN Pharm, Shanghai, China). The activity of Lon protease was inhibited using bortezomib (Borte, 5 µM, CSN Pharm, Shanghai, China) as previously described [26].
Small RNA (siRNA) interference
HK2 cells were cultured to ~50-60% confluence in culture medium containing no penicillin or streptomycin. TFAM siRNA (sense: GAGGGAACUUCCUGAUUCATT; antisense: UGAAUCAGGAAGUUCCCUCTT), Lon siRNA (sense: CCGAGAACAAGAAGGACUUTT; antisense: AAGUCCUUCUUGUUCUCGGTT), and the negative control siRNA were purchased from GenePharma Biotechnology (Shanghai, China). HK2 cells were transfected with siRNA using Lipo6000 (Beyotime Biotechnology, Shanghai, China) according to the manufacturer's instructions.
Cell viability
Cells were seeded in 96-well plates and treated with the indicated agents. CCK-8 (Dojindo, Kumamoto, Japan) solution was added to each well, and the plates were incubated at 37 °C for 2 h. The absorbance at 450 nm was then measured using a microplate reader (BioTek Instruments Inc, USA). The viability of the cells in the experimental groups was normalized to that of the cells in the control group.
Measurement of intracellular ROS
The level of ROS was measured by flow cytometry and confocal microscopy. For the flow cytometry analysis, cells were incubated with MitoSOX (2 µM, Thermo Fisher Scientific, Sunnyvale, CA, USA) for 30 min, washed twice with PBS and analyzed in a flow cytometer (Beckman, USA). For the fluorescence microscopy assay, HK2 cells were incubated with DCFH-DA (10 μM, Beyotime Biotechnology, Shanghai, China) or MitoSOX (5 µM) for 30 min at 37 °C. The stained cells were then washed with PBS and observed using a fluorescence microscope (Olympus, Japan).
Oxygen consumption rate (OCR) assay
The mitochondrial oxygen consumption rate (OCR) was measured in a Seahorse XF-24 Flux Analyzer (Seahorse Biosciences, Agilent, USA) using the Mito Stress Test (MST) Kit. Cells (5 × 10⁴ per well) were plated in quadruplicate in XF-24 extracellular flux assay plates in 500 μL XF base medium equilibrated to a pH of 7.4. After incubation of the plates at 37 °C for 2 h to allow the cells to adhere, the medium was replaced with MST buffer. The test compounds were added in the following order: oligomycin (1 μM), FCCP (1 μM), and rotenone/antimycin A (both 0.5 μM). The values obtained in each measurement for quadruplicate wells were averaged and are displayed as the OCR (pmol O2/min).
Cellular mitochondrial morphology assessment
Mitochondrial morphology in live cells was observed by staining with MitoTracker Deep Red (100 nM, Thermo Fisher Scientific, Sunnyvale, CA, USA) followed by confocal microscopy (Nikon A1, Nikon Corporation, Japan). Mitochondrial length was analyzed using Image-Pro Plus software (Media Cybernetics, Inc., USA). The FF (form factor) was defined as (perimeter2/4 π area). The AR (aspect ratio) was defined as the ratio between the major and minor axes of an ellipse equivalent in size to the mitochondrion. The AR represents the mitochondrial length, and the FF indicates the mitochondrial complexity [27]. FF and AR in images were analyzed using ImageJ software as previously described [28].
Chemotaxis assay
The macrophage chemotaxis assay was performed using cell culture inserts containing a 3.0-μm-pore polyethylene terephthalate membrane (Corning, USA). Conditioned medium (500 μL) harvested from HK2 cells cultured under various conditions was added to each well of a 24-well plate (lower compartment), and inserts were placed in each well along with Raw 264.7 macrophages (5 × 10⁵ cells in 100 μL assay medium; upper compartment). After incubation of the plate at 37 °C for 24 h, the cells that had migrated from the upper to the lower compartment were collected and counted as previously described [29]. The migrated cells were fixed with 4% paraformaldehyde at room temperature for 15 min and stained with 0.1% crystal violet (Sigma). Images of the stained cells were captured using a microscope, and the cell numbers were calculated using ImageJ.
DNA isolation and mtDNA copy number assay
Relative levels of mitochondrial DNA (mtDNA copy number) were determined by qPCR as previously described [30, 31]. Briefly, total DNA was extracted from cells or from renal tissues using a Universal Genomic DNA Kit (CW2298S, CWBIO, Beijing, China), and 10 ng of the DNA was used for qPCR analysis. For human cells, the mitochondrial ND1 gene (mtND1) was used to measure mtDNA copy number and was normalized to nuclear beta-2 microglobulin (B2M) [30]. For mouse tissues, the mitochondrially encoded cytochrome c oxidase subunit 2 (COX2) was used to measure mtDNA copy number and was normalized to the nuclear ribosomal protein s18 (rps18) [31]. The sequences of the primers used in the mtDNA assay are shown in Table S2.
Western blot
Renal tissues and cells were lysed in radioimmunoprecipitation assay (RIPA) buffer supplemented with protease inhibitors (Calbiochem, CA, USA) and phosphatase inhibitors (Calbiochem). The protein concentration was determined using a BCA protein assay kit (CWBIO, China). Equal amounts of protein were subjected to electrophoresis on 12% sodium dodecyl sulfate-polyacrylamide gels (SDS-PAGE) and then transferred to polyvinylidene difluoride membranes (PVDF, Merck Millipore). The membranes were blocked with 5% nonfat milk and incubated with one of the following primary antibodies: anti-Bax (#2772), anti-TFAM (A1926), anti-ATP5a-1 (14676-1-AP), anti-TOM20 (#42406), anti-Lon (A4293), anti-p53 (10442-1-AP), anti-ICAM-1 (10831-1-AP), or anti-GAPDH (AC002) overnight at 4 °C. After washing with PBST, the PVDF membranes were incubated with HRP-conjugated secondary antibody at 37 °C for 1 h. The protein bands on the PVDF membranes were observed using an enhanced chemiluminescence kit (Millipore, USA) and quantified using ImageJ.
Human samples and IF staining
Human renal tissues that had sustained renal injury were obtained from renal biopsies of AKI patients. Normal kidney tissues obtained from surgical nephrectomy of renal carcinoma patients were used as controls. The process of human sample collection was performed in accordance with the guidelines established by the hospital ethics committee, and informed consent was obtained from the patients according to the Declaration of Helsinki. For IF staining, frozen renal sections were stained with primary antibodies (anti-TOM20, 1:100; anti-NGAL, 1:100; anti-dsDNA, 1:400; anti-TFAM, 1:50) overnight at 4 °C followed by incubation with an FITC- or TRITC-conjugated secondary antibody (1:200) for 1 h at 37 °C. Nuclei were visualized by staining with DAPI for 5 min at room temperature. Digital images were captured using a fluorescence microscope (Nikon, N-STORM & A1, Tokyo, Japan).
Statistical analysis
All data are presented as the mean ± SD and were analyzed using SPSS software (version 11.5, IBM Corporation, USA) with one-way ANOVA or Student's t-test; p < 0.05 was considered indicative of a significant difference.
Results
mtROS promoted renal dysfunction, inflammation, and mitochondrial damage in IRI-AKI mice
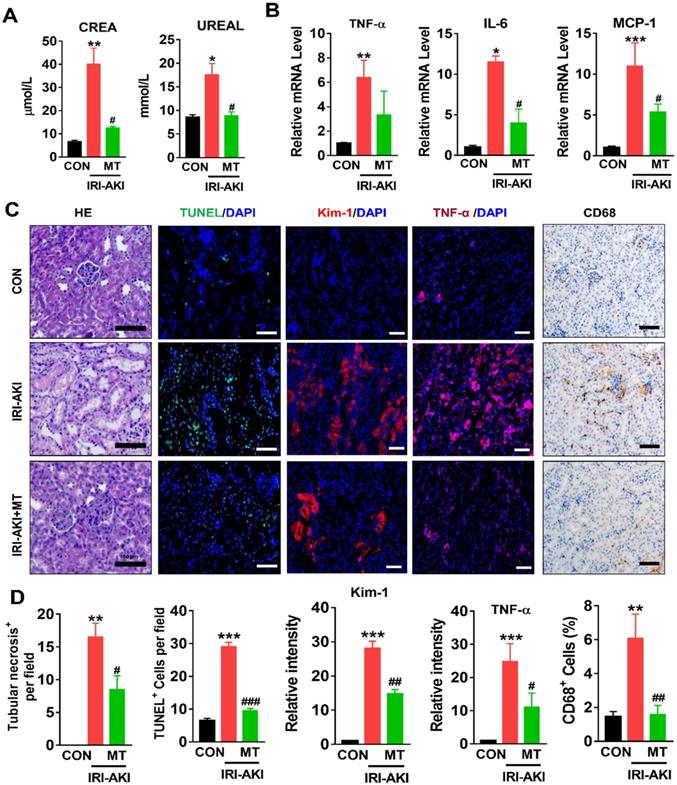
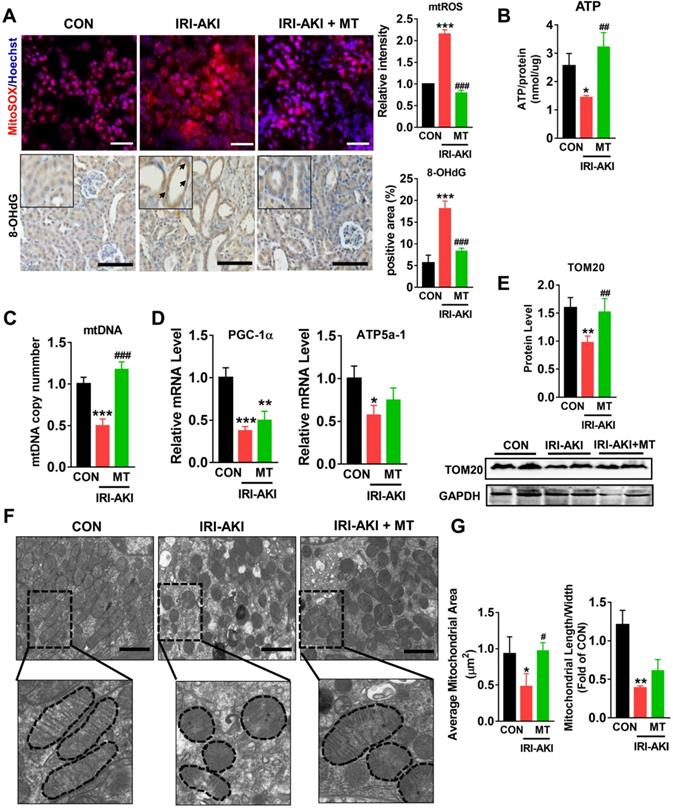
Compared with control mice, IRI-AKI mice showed higher levels of serum CREA/UREAL and greater numbers of renal histological lesions, including cast formation, vacuolization, and extensive tubular necrosis, as well as elevated levels of kidney injury molecule-1 (Kim-1) and TUNEL+ apoptotic cells in the kidneys. The degree of renal inflammatory response as indicated by the expression of cytokines (TNF-α, IL-6, and MCP-1) and infiltration of the tubulointerstitial compartment by CD68+ macrophages was also upregulated in mice with IRI-AKI (Figure 1A-D). In contrast, inhibition of mtROS production with MT significantly ameliorated renal dysfunction, as indicated by decreased levels of serum CREA/UREAL, renal Kim-1, tubular apoptosis/necrosis, and renal inflammatory response in MT-treated IRI-AKI mice compared with untreated IRI-AKI mice (Figure 1A-D). Moreover, the kidneys of IRI-AKI mice exhibited severe mitochondrial damage, as evidenced by increased mtROS levels and decreases in ATP level, PGC-1α/ATP5a-1/TOM20 expression, mitochondrial area, and mitochondrial length/width ratio compared to the controls (Figure 2A-G). Mitochondrial lesions such as mitochondrial swelling and fragmentation, disruption of membrane integrity, and broken or absent cristae were observed in the kidneys of the IRI-AKI mice (Figure 2F). The degree of renal oxidative stress, as indicated by 8-OHdG [32], was also increased in the IRI-AKI mice compared to that in the control mice (Figure 2A). Conversely, MT treatment significantly reduced the levels of mtROS, 8-OHdG, and mitochondrial fragmentation and restored the ATP production and expression of mitochondrial proteins in the kidneys of the IRI-AKI mice (Figure 2A-G). However, treatment with the vehicle alone did not affect the degree of renal injury, inflammation, or mitochondrial dysfunction in IRI-AKI mice (Figure S1).
mtROS promoted renal dysfunction and inflammation in IRI-AKI mice. (A) Serum CREA and UREAL concentrations in mice in different groups on day 5 after IRI-AKI (n = 6). (B) Real-time PCR analysis of TNF-α, IL-6, and MCP-1 mRNA in the kidneys of mice in different groups on day 5 after IRI-AKI (n = 6). (C) Representative micrographs showing renal H&E staining (scale bar = 50 µm), TUNEL staining (scale bar = 100 µm), Kim-1 staining (scale bar = 100 µm), TNF-α IF staining (scale bar = 100 µm), and CD68 IHC staining (scale bar = 50 µm) in the kidneys of mice on day 5 after IRI-AKI. (D) Quantitative analysis of necrotic tubules, TUNEL+ apoptotic cells, Kim-1 expression, TNF-α expression, and CD68+ cell number in the kidneys of mice in different groups (n = 6). *p < 0.05 vs. CON group; **p < 0.01 vs. CON group; ***p < 0.001 vs. CON group; #p < 0.05 vs. IRI-AKI group; ##p < 0.01 vs. IRI-AKI group; ###p < 0.001 vs. IRI-AKI group.
mtROS promoted renal mitochondrial dysfunction in IRI-AKI mice. (A) Representative micrographs showing MitoSOX (scale bar = 50 µm) and 8-OHdG staining (scale bar = 50 µm) in the renal cortex and quantitative analysis of mtROS and 8-OHdG levels (n = 6). (B) Measurement of ATP levels in the kidneys of mice on day 5 after IRI-AKI (n = 6). (C) Measurement of mtDNA copy number levels in the kidneys on day 5 after IRI-AKI (n = 6). (D) Real-time PCR analysis of PGC-1-α and ATP5a-1 mRNA levels in the kidneys on day 5 after IRI-AKI (n = 6). (E) Western blotting for TOM20 protein in the kidneys and quantitative analysis of TOM20 protein expression. (F) Representative TEM images of mitochondria in the renal tubules of mice (scale bar = 2 µm). (G) Quantification of mitochondrial area and the ratio of mitochondrial length to width detected by TEM (n = 6). *p < 0.05 vs. CON group; **p < 0.01 vs. CON group; ***p < 0.001 vs. CON group; #p < 0.05 vs. IRI-AKI group; ##p < 0.01 vs. IRI-AKI group; ###p < 0.001 vs. IRI-AKI group.
mtROS-induced mitochondrial impairment and proinflammatory cytokine release in renal tubular cells (TECs)
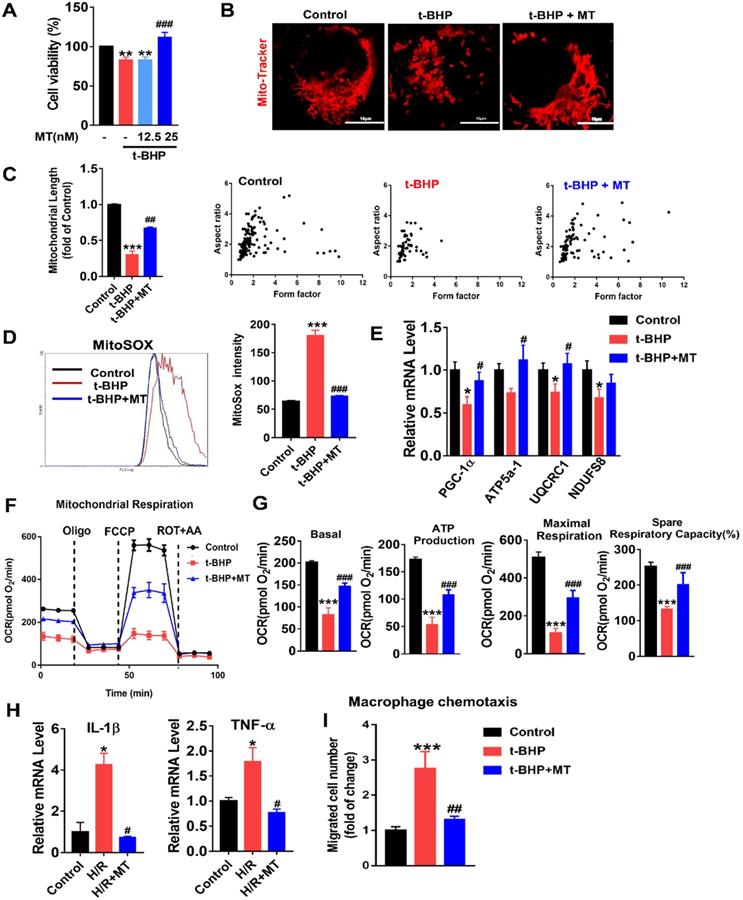
To mimic oxidative stress in IRI-AKI, HK2 cells were stimulated with H/R or t-BHP (a ROS inducer). The elevated mtROS in the HK2 cells induced by H/R or t-BHP was effectively reduced by MT treatment (Figure S2A-C). Oxidative stress decreased the viability of the HK2 cells, while MT treatment restored the cells' viability in a dose-dependent manner (Figure 3A). Moreover, oxidative stress induced by t-BHP or H/R resulted in an increase in mitochondrial fragmentation (Figure 3B, Figure S4A) as well as a reduction in the expression of mitochondrial biogenesis-related genes such as ATP5a-1, PGC-1α, NDUFS8, and UQCRC1 in the HK2 cells (Figure 3E, Figure S4B). The overall mitochondrial respiratory capacity of the HK2 cells was also inhibited by t-BHP treatment (Figure 3F-G). In contrast, MT treatment markedly attenuated the mitochondrial lesions caused by mtROS in HK2 cells treated with t-BHP or H/R (Figure 3B-G, Figure S4). In addition, the increased levels of proinflammatory cytokine (IL-1β, TNF-α) gene expression and macrophage chemotaxis induced in the HK2 cells by oxidative stress were suppressed by the MT treatment (Figure 3H-I). Again, treatment with the vehicle alone had no influence on the expression of cytokines or proapoptotic factors in HK2 cells under stress conditions (Figure S7).
mtROS-induced mitochondrial dysfunction and cytokine release in HK2 cells. (A) Cell viability was determined by the CCK8 assay (n = 3, **p < 0.01 vs. Control group, ###p < 0.001 vs. t-BHP group). (B) Representative micrographs showing MitoTracker staining in HK2 cells (scale bar = 10 µm) and (C) quantification of mitochondrial length. (D) mtROS were measured by flow cytometry after MitoSOX staining. (E) Real-time PCR analysis of PGC-1α, UQCRC1, NDUFS8, and ATP5a-1 mRNA levels in HK2 cells. (F) Measurement of mitochondrial oxygen consumption ratio (OCR) in HK2 cells. (G) Basal respiration, maximal respiration, ATP production, and spare respiratory capacity in HK2 cells (n = 3; ***p < 0.001 vs. Control group; ###p < 0.001 vs. t-BHP group). (H) Real-time PCR analysis of IL-1β and TNF-α mRNA levels in HK2 cells (n = 3; *p < 0.05 vs. Control group; #p < 0.05 vs. H/R group). (I) Relative migration of RAW264.7 cells in response to conditioned medium from HK2 cells (n = 3; ***p < 0.001 vs. Control group; ##p < 0.01 vs. t-BHP group).
mtROS suppressed TFAM transcription and promoted Lon-mediated TFAM degradation in TECs
We next determined whether TFAM expression in renal cells is affected by oxidative stress. Indeed, the protein levels of TFAM and ATP5α-1 in HK2 cells were downregulated by t-BHP, whereas their protein levels partially recovered after MT treatment (Figure 4A). The mRNA level of TFAM was suppressed by mtROS and was also restored by MT treatment (Figure 4B). The majority of the TFAM colocalized with the mitochondrial marker TOM20, but t-BHP stimulation decreased the abundance of TFAM in the mitochondria, whereas the mitochondrial TFAM level recovered after MT treatment (Figure 4C). Similarly, H/R conditions also reduced the TFAM protein level (Figure 4F), especially the amount of TFAM in mitochondria (Figure S5), while the decrease in TFAM protein under H/R conditions was also reversed by MT treatment (Figure 4F and Figure S5). To determine the impact of different ROS sources and types on TFAM protein, HK2 cells under oxidative stress were treated with various ROS inhibitors. Interestingly, the CCK-8 assay results showed that the viability of HK2 cells under oxidative stress was improved by treatment with MT and other ROS inhibitors (Figure S3A), suggesting that oxidative stress-induced cell damage is a complex event that affects both the cytosolic and mitochondrial systems, since the CCK-8 assay results reflect the cellular redox status and can be influenced by a variety of cytosolic and mitochondrial oxidases [33]. However, the decreased TFAM protein level induced by oxidative stress was only restored by treatment with MT and APO (an NADPH oxidase inhibitor), whereas the other inhibitors failed to rescue TFAM protein expression (Figure 4D). Treatment with MT, but not treatment with APO, restored the mitochondrial mass (as indicated by TOM20 expression) in HK2 cells exposed to t-BHP (Figure 4D).
mtROS suppressed TFAM transcription and enhanced TFAM degradation in HK2 cells. (A) Western blotting for TFAM and ATP5a1 proteins in HK2 cells and quantitative analysis of protein expression (n = 3; *p < 0.05 vs. Control group, **p < 0.01 vs. Control group; #p < 0.05 vs. t-BHP group, ##p < 0.01 vs. t-BHP group). (B) Real-time PCR analysis of TFAM mRNA levels in HK2 cells. (C) Double-IF staining of TOM20 (red) and TFAM (green) in HK2 cells (scale bar = 10 µm) and quantitative analysis of TFAM expression (***p < 0.001 vs. Control group; ##p < 0.01 vs. t-BHP group). (D) Western blotting for TFAM and TOM20 proteins in HK2 cells after various treatments and quantitative analysis of protein expression (n = 3; *p < 0.05 vs. Control group; #p < 0.05 vs. t-BHP group). (E) Western blotting for TFAM and Lon proteins in HK2 cells treated with t-BHP and various other agents (n = 3; *p < 0.05 vs. Control group; #p < 0.05 vs. t-BHP group). (F) Western blotting of TFAM and Lon proteins in HK2 cells under H/R with or without bortezomib treatment (n = 3; ***p < 0.001 vs. Control group; #p < 0.05 vs. H/R group, ##p < 0.01 vs. H/R group). (G) Western blotting of TFAM and Lon proteins in HK2 cells treated with t-BHP with or without si-Lon treatment (n = 3; ***p < 0.001 vs. Control group; ###p < 0.001 vs. t-BHP group). (H) Western blotting of TFAM and Lon protein and quantitative analysis of protein expression in HK2 cells under H/R with or without si-Lon treatment (n = 3; ***p < 0.001 vs. Control group; ###p < 0.001 vs. H/R group). (I) mtDNA copy number in HK2 cells treated with t-BHP and various other agents (n = 3; ***p < 0.001 vs. Control group; ##p < 0.01 vs. t-BHP group). (J) mtDNA copy number in HK2 cells under H/R with various treatments (n = 3; *p < 0.05 vs. Control group; ##p < 0.01 vs. H/R group).
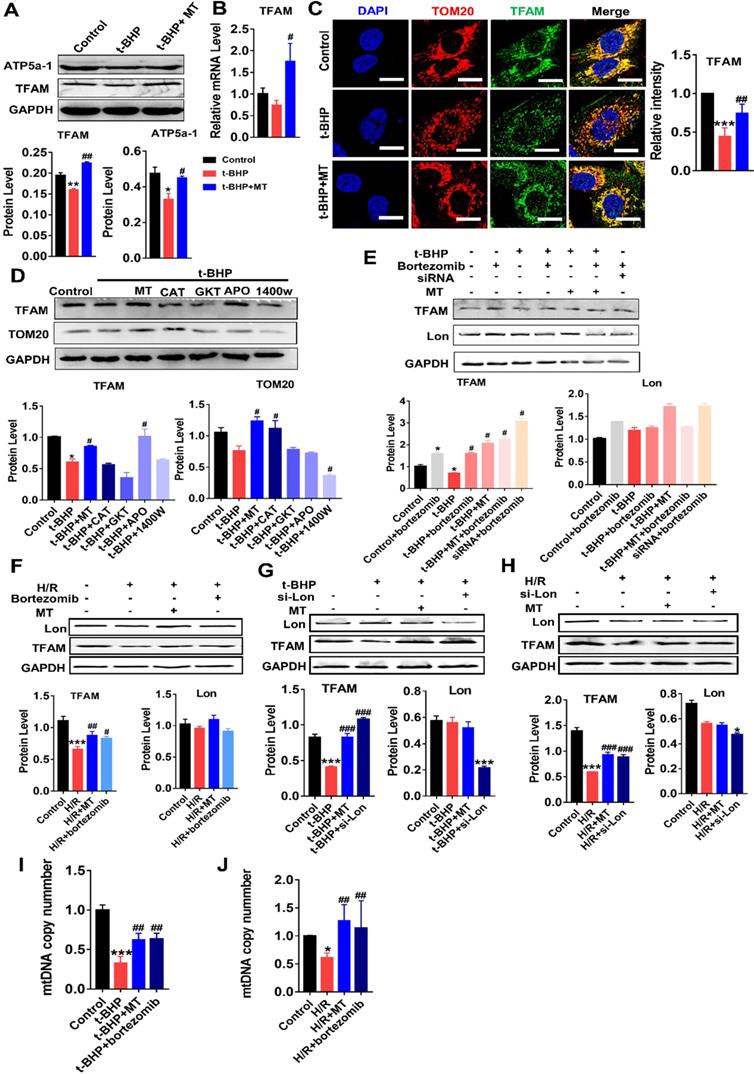
The impact of mtROS on TFAM degradation was also analyzed. Interestingly, the protein level of Lon in HK2 cells was unchanged in response to the ROS induced by t-BHP or H/R, but its protease activity was upregulated by mtROS, as indicated by the elevated amount of TFAM protein in cells stimulated by t-BHP or H/R plus bortezomib (a Lon protease inhibitor) compared to that in cells stimulated by t-BHP or H/R alone (Figure 4E-F, S3B-C). There was no difference in TFAM protein expression in the MT and MT plus bortezomib groups after t-BHP treatment (Figure 4E). The TFAM level, which decreased after treatment with si-TFAM, also recovered after bortezomib treatment (Figure 4E). p53 protein was used as a marker of the activity of bortezomib (Figure S3B-C). Treatment with the vehicle alone did not affect TFAM expression in HK2 cells under oxidative stress (Figure S7A-B). To confirm the specific role of Lon in TFAM degradation, HK2 cells with Lon knockdown were generated using siRNA (Figure S6D). Treatment with si-Lon alone was sufficient to increase TFAM protein levels under normal culture conditions (Figure S6D). Moreover, treatment with si-Lon restored the expression of TFAM protein in HK2 cells exposed to t-BHP or H/R, and it showed a rescue effect on the TFAM protein level similar to that of MT treatment (Figure 4G-H). As a result, the reduction in mtDNA copy number in HK2 cells exposed to t-BHP or H/R was reversed by treatment with MT or bortezomib (Figure 4I-J).
Loss of TFAM caused by mtROS led to mitochondrial dysfunction in TECs
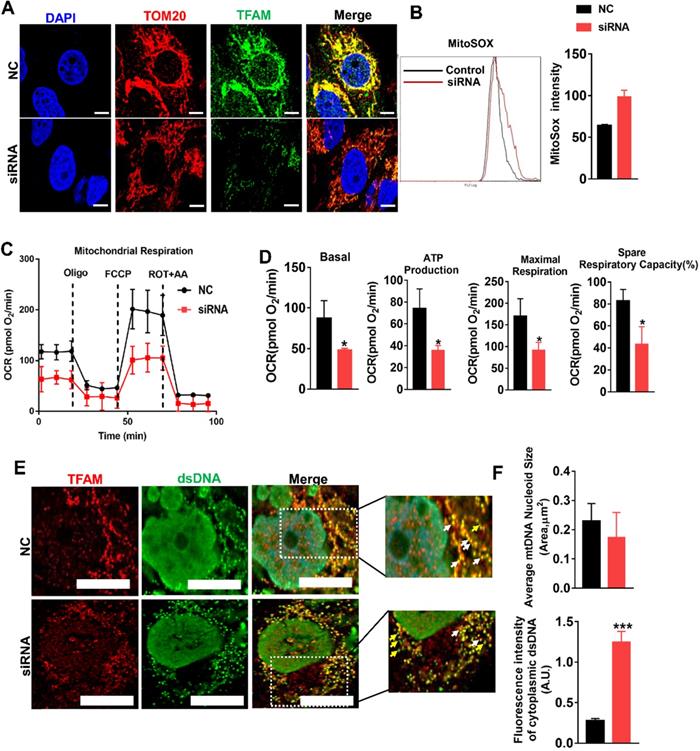
Since our experiments revealed mtROS-induced TFAM defects in TECs, we sought to explore the effects of TFAM deficiency on mtDNA and mitochondrial function. TFAM knockdown cells were generated, and the reduction in TFAM levels was confirmed by qPCR and western blotting (Figure S6A-B). Knockdown of TFAM led to a reduction in the abundance of TFAM in the mitochondria (Figure 5A) and to increased levels of mtROS in HK2 cells under normal culture conditions (Figure 5B). The loss of TFAM led to decreased mitochondrial respiratory capacity in the HK2 cells, as indicated by the lower levels of basal and maximal respiration, ATP production, and spare respiratory capacity observed in the TFAM knockdown cells compared to the cells in the control group (Figure 5C-D). Moreover, the colocalization of TFAM and dsDNA (double-stranded DNA) was reduced by si-TFAM, suggesting that the stability of mtDNA nucleoids was also impaired (Figure 5E-F), considering that it has been reported that both naked DNA and free TFAM are unstable in mitochondria [34,35]. Next, we determined the role of TFAM in mtROS-induced mitochondrial damage in TECs. The elevation in ROS levels induced by H/R or H/R plus si-TFAM was suppressed by MT (Figure 6A-B), but the reduced expression of TFAM in cells under stress was not reversed by MT treatment in the presence of si-TFAM (Figure 6C). TFAM knockdown also abolished the ability of MT to restore the protein level of TFAM in the mitochondria of HK2 cells experiencing oxidative stress induced by t-BHP (Figure 6D), and this finding was further validated in HK2 cells under H/R conditions (Figure S5). As a result, MT failed to attenuate the mtROS-induced mitochondrial respiratory defects in HK2 cells when TFAM was knocked down (Figure 6E-F).
Loss of TFAM was sufficient to induce mitochondrial dysfunction in HK2 cells. (A) Double-IF staining of TOM20 (red) and TFAM (green) in HK2 cells (scale bar = 10 µm). HK2 cells were transfected with normal control siRNA (NC) and TFAM siRNA (siRNA). (B) The intensity of mtROS was determined by flow cytometry. HK2 cells were treated with control siRNA or TFAM siRNA (n = 3). (C) Measurement of mitochondrial oxygen consumption ratio (OCR) in HK2 cells. (D) Basal respiration, ATP production respiration, maximal respiration, and spare respiratory capacity in HK2 cells (n = 3; *p < 0.05 vs. Control group). (E) Double-IF staining of TFAM (red) and dsDNA (green) in HK2 cells (scale bar = 10 µm). (F) Average size of mtDNA nucleoids and cytoplasmic dsDNA (dsDNA without colocalization of TFAM) in HK2 cells detected by IF staining (n = 20; ***p < 0.001 vs. Control group).
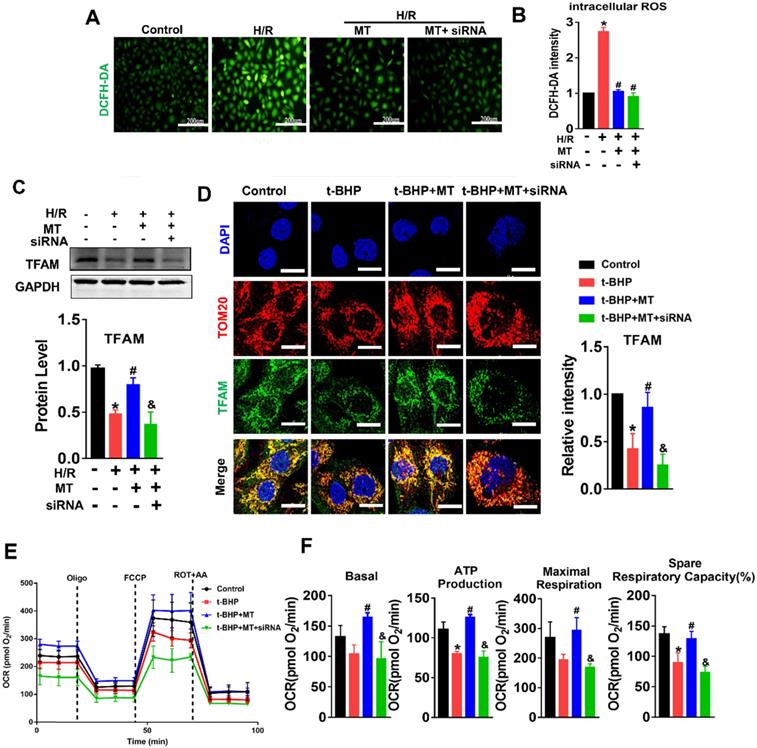
mtROS impaired mitochondrial function by suppressing TFAM in HK2 cells. (A) DCFH-DA fluorescence staining of HK2 cells (scale bar = 200 µm). (B) Quantitative analysis of intracellular ROS in HK2 cells (n = 3; *p < 0.05 vs. Control group; #p < 0.05 vs. H/R group). (C) Western blotting of TFAM protein in HK2 cells and quantitative analysis of protein expression (n = 3; *p < 0.05 vs. Control group; #p < 0.05 vs. H/R group; &P < 0.05 vs. MT group). (D) Double-IF staining of TOM20 (red) and TFAM (green) in HK2 cells and quantitative analysis of TFAM expression (scale bar = 10 µm). (E) Measurement of mitochondrial oxygen consumption ratio (OCR) in HK2 cells after various treatments. (F) Basal respiration, ATP production, maximal respiration, and spare respiratory capacity in HK2 cells (n = 3; *p < 0.05 vs. Control group; #p < 0.05 vs. t-BHP group; &P < 0.05 vs. MT group).
mtROS-induced mtDNA instability and cytokine release by suppressing TFAM in TECs
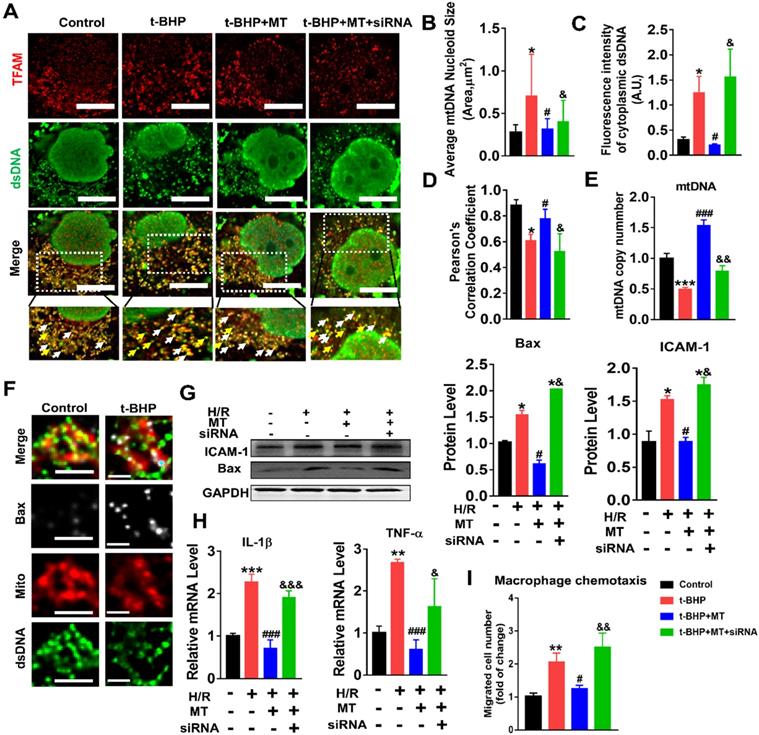
The impact of mtROS on mtDNA stability was evaluated, and mtDNA nucleoids were visualized using TFAM and dsDNA costaining. The mtDNA nucleoids, as indicated by the colocalization of TFAM and dsDNA, were evenly distributed as a network in normal control HK2 cells (Figure 7A, white arrows). Under oxidative stress conditions, the HK2 cells displayed aberrant mtDNA packaging and reduced mtDNA copy number (Figure 7A-E), as indicated by the presence of enlarged nucleoid clusters arranged in a fragmented network, increased amounts of leaked mtDNA (dsDNA without colocalization of TFAM, yellow arrows), and a decrease in the TFAM/dsDNA colocalization coefficient compared to the control (Figure 7A-D). Conversely, inhibition of mtROS by MT treatment attenuated the aberrant mtDNA packaging and restored TFAM/dsDNA colocalization and mtDNA copy number in HK2 cells under oxidative stress, but the beneficial effect of MT was eliminated when TFAM was knocked down (Figure 7A-E). Similarly, H/R induced mtDNA nucleoid damage in the HK2 cells, while the aberrant mtDNA packaging was partially reversed by MT treatment, but the rescue effect of MT was also limited by treatment with the TFAM siRNA (Figure S8). In addition, we observed that Bax protein colocalized with mitochondria (indicated by the MitoTracker) and that it formed macropore-like structures in which mtDNA appeared within the pores (Figure 7F). The upregulation of Bax in HK2 cells under oxidative stress was suppressed by MT treatment, while the inhibitory effect of MT on Bax was abolished when TFAM was knocked down (Figure 7G). Oxidative stress also induced cytokine (IL-1β, TNF-α, and ICAM-1) expression (Figure 7G-H) and macrophage chemotaxis (Figure 7I) in HK2 cells, and these adverse effects were reduced by MT treatment. However, knockdown of TFAM enhanced cytokine expression and macrophage chemotaxis in HK2 cells even in the presence of MT (Figure 7G-I).
Loss of TFAM-induced mtDNA instability and cytokine production in HK2 cells. (A) Double-IF staining of TFAM (red) and dsDNA (green) in HK2 cells (scale bar = 10 µm). (B) Average size of mtDNA nucleoids in HK2 cells (n = 20; *p < 0.05 vs. Control group; #p < 0.05 vs. t-BHP group; &p < 0.05 vs. MT group). (C) Quantification of cytoplasmic dsDNA in HK2 cells (n = 6; ***p < 0.001 vs. Control group; ###p < 0.001 vs. t-BHP group; &&p < 0.01 vs. MT group). (D) Pearson correlation coefficient between TFAM and dsDNA in HK2 cells in different groups (*p < 0.05 vs. Control group; #p < 0.05 vs. t-BHP group; &p < 0.05 vs. MT group). (E) mtDNA copy number in HK2 cells (n = 3; *p < 0.05 vs. Control group; #p < 0.05 vs. t-BHP group; &p < 0.05 vs. MT group). (F) IF staining of dsDNA (green), Bax (white), and mitochondria (Mito; red) in HK2 cells (scale bar = 2.5 µm). (G) Western blotting of ICAM-1 and Bax proteins in HK2 cells and quantitative analysis of protein expression (n = 3; *p < 0.05 vs. Control group; #p < 0.05 vs. H/R group; &p < 0.05 vs. MT group). (H) Real-time PCR analysis of IL-1β and TNF-α mRNA levels in HK2 cells (n = 3; **p < 0.01 vs. Control group; ***p < 0.001 vs. Control group; ###p < 0.001 vs. H/R group; &p < 0.05 vs. MT group, &&&p < 0.001 vs. MT group). (I) Relative migration of RAW264.7 cells in response to conditioned medium from HK2 cells (n = 3; **p < 0.01 vs. Control group; #p < 0.05 vs. H/R group; &&p < 0.01 vs. MT group).
mtROS impaired TFAM and mtDNA homeostasis in the kidneys of IRI-AKI mice
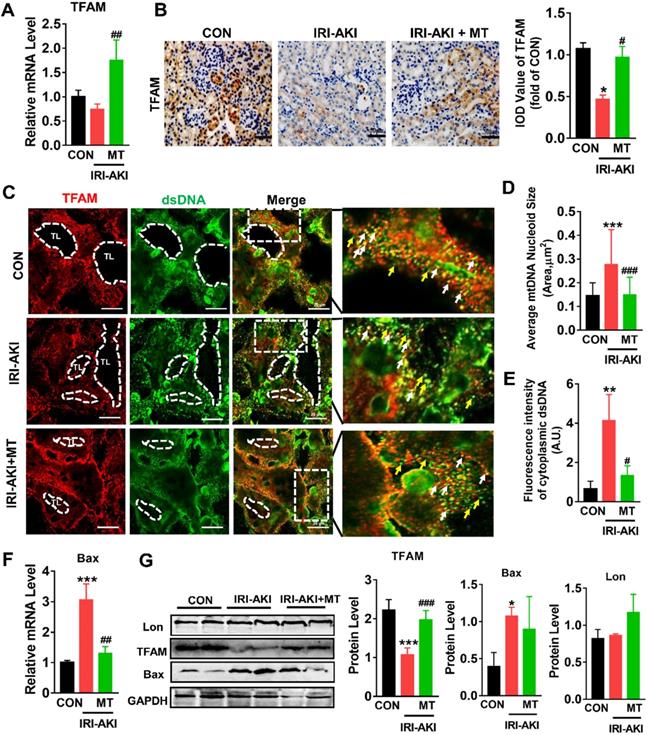
Consistent with the in vitro results, we found that TFAM was mainly expressed in renal tubules and that the mRNA and protein levels of TFAM in the kidneys of IRI-AKI mice were significantly reduced (Figure 8A-B). In the tubules of the control mice, the DAPI signals fully colocalized with the nuclear DNA, and the TFAM signals consistently colocalized with cytosolic DNA (Figure S9). However, the percentage of nucleoids with aberrant mtDNA packaging increased in the renal tubules of the IRI-AKI mice. Moreover, higher levels of leaked mtDNA (dsDNA without TFAM colocalization, indicated by the yellow arrows in Figure 8C and E) and Bax expression (Figure 8F) were found in the kidneys of IRI-AKI mice than in the kidneys of control mice. MT treatment reversed the decrease in TFAM expression in the renal tubules of IRI-AKI mice (Figure 8A-B) and reduced mtDNA instability (Figure 8C-E) in the kidneys of IRI-AKI mice. Moreover, the upregulation of Bax protein and the decrease in TFAM protein in the kidneys of IRI-AKI mice were partially reversed by MT treatment (Figure 8G). However, there was no difference in the Lon protein levels in the different groups (Figure 8G). Again, treatment with vehicle alone did not influence TFAM expression or mtDNA copy number in the kidneys of IRI-AKI mice (Figure S1A-C).
mtROS-induced TFAM deletion and mtDNA instability in the kidneys of IRI-AKI mice. (A) Real-time PCR analysis of TFAM mRNA levels in the kidneys of mice on day 5 after IRI-AKI (n = 6; *p < 0.05 vs. CON group; ##p < 0.01 vs. IRI-AKI group). (B) Representative micrographs showing TFAM IHC staining in the kidneys of mice on day 5 after IRI-AKI (scale bar = 50 µm) and quantitative analysis of TFAM intensity. (C) Double-IF staining of TFAM (red) and dsDNA (green) in the tubules (TL) of mice on day 5 after IRI-AKI (scale bar = 20 µm). (D) Average size of mtDNA nucleoids in the kidneys detected by IF staining (n = 15; ***p < 0.001 vs. CON group; ###p < 0.0 vs. IRI-AKI group). (E) Quantification of cytoplasmic dsDNA intensity (yellow arrows) (n = 6; **p < 0.01 vs. CON group; #p < 0.05 vs. IRI-AKI group). (F) Real-time PCR analysis of Bax mRNA levels in the kidneys of mice on day 5 after IRI-AKI (n = 6; ***p < 0.001 vs. CON group; ##p < 0.01 vs. IRI-AKI group). (G) Western blotting of TFAM, Lon, and Bax proteins in the kidneys of mice on day 5 after IRI-AKI and quantitative analysis of protein expression (n = 6; *p < 0.05 vs. CON group; ***p < 0.001 vs. CON group; ###p < 0.001 vs. IRI-AKI group).
TFAM deficiency and mtDNA damage in the kidneys of AKI patients
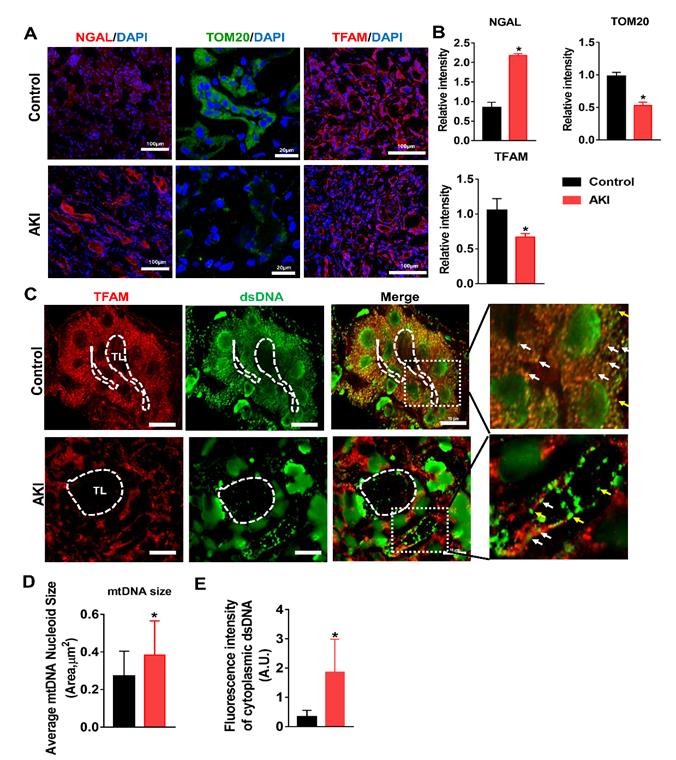
To validate our findings in HK2 cells and in the mouse IRI-AKI model, changes in TFAM and mtDNA nucleoids were analyzed in renal biopsies from AKI patients. Renal sections from AKI patients exhibited higher levels of NGAL in the tubules, and their renal TFAM and TOM20 protein levels were lower than those of controls (Figure 9A-B). Moreover, we observed enlarged mtDNA nucleoids in the kidneys of AKI patients (Figure 9C-D). The amount of leaked mtDNA (dsDNA without TFAM colocalization, indicated by the yellow arrows) in the kidneys of AKI patients was also higher than that in the controls (Figure 9C and E). These results confirmed that TFAM loss occurs with mtDNA damage in the kidneys of AKI patients.
TFAM deficiency and mtDNA instability in the kidneys of AKI patients. (A) Representative micrographs showing IF staining of NGAL (scale bar = 100 µm), TOM20 (scale bar = 20 µm), and TFAM (scale bar = 100 µm) in renal sections from AKI patients. (B) Quantitative analysis of NGAL, TOM20, and TFAM expression detected by IF staining. (n = 3; *p < 0.05 vs. Control group). (C) Double-IF staining of TFAM (red) and dsDNA (green) in the tubules (TL) of AKI patients (scale bar = 10 µm). (D) Average size of mtDNA nucleoids in the renal tubules detected by IF staining (n = 17; *p < 0.05 vs. Control group). (E) Quantification of cytoplasmic dsDNA (yellow arrows) in the tubules by IF staining (n = 6; *p < 0.05 vs. Control group).
Discussion
Mitochondria are essential regulators of cellular energy metabolism and of the cellular redox balance in response to stimuli. Kidneys are organs with a high energy demand, and renal tubules are densely packed with mitochondria [16]. Mitochondrial damage, as indicated by elevated mtROS levels and mtDNA depletion, was markedly increased during IRI-AKI, and these lesions were associated with the severity of renal inflammation and renal dysfunction [16]. Persistent mitochondrial injury after AKI has also been linked to chronic inflammation, progressive renal fibrosis, and the development of CKD [36,37]. Although excessive mtROS have been shown to disturb multiple pathways involved in calcium homeostasis, mitochondrial permeability, and cytochrome C release and to directly induce renal cell death [3,38,39], their specific roles in mitochondrial damage and inflammation during IRI-AKI are not completely understood.
In this study, an initial dose of MT was directly injected into the kidneys of IRI-AKI mice in the early phase after IRI to specifically inhibit the mtROS burst in the kidney. We found that inhibition of mtROS at the early phase was sufficient to attenuate renal dysfunction, cytokine expression, and macrophage infiltration in the kidneys of IRI-AKI mice. Moreover, inhibition of mtROS restored the renal mtDNA level, mitochondrial mass, and ATP production after IRI-AKI. In IRI-AKI mice, some parameters, such as the levels of mtROS, ATP, and mtDNA, were markedly restored by MT therapy, while other indicators of mitochondrial function, such as PGC-1α and ATP5a-1 levels and the mitochondrial length/width ratio, were partially recovered. These results suggest that mtROS are a driving factor in the renal mitochondrial damage and inflammation that occurs in IRI-AKI and that elimination of excessive mtROS at the early phase after IRI would result in superior therapeutic outcomes. To validate the in vivo findings, we established ROS-induced renal TEC injury models and evaluated the impact of mtROS on mitochondria and inflammation in vitro. Consistent with the in vivo data, mtROS inhibition reduced the level of mtDNA loss, mitochondrial respiratory defects, cytokine expression, and macrophage chemotaxis in TECs exposed to stress conditions such as those caused by t-BHP and H/R. These results demonstrate that mtROS are one of the major causative factors of renal mitochondrial damage and inflammation and that they contribute to the pathology of IRI-AKI.
Although the adverse effect of mtROS on renal function in IRI-AKI was previously known, the detailed mechanism has not been fully elucidated. Considering the mtDNA depletion and decreased mitochondrial mass observed after IRI-AKI, we speculated that these renal lesions may be due to disordered mtDNA replication and maintenance. mtDNA is inherited as a protein-DNA complex (the nucleoid), and TFAM serves as the primary coating and packaging protein for mtDNA [40]. TFAM binds to mtDNA specifically at promoter regions to activate mitochondrial transcription and nonspecifically throughout the mitochondrial genome to regulate DNA interactions. Interestingly, a decrease in TFAM has been observed in kidneys with AKI and in TECs under oxidative stress [41,42]. Consistent with these reports, we found that the amount of TFAM, particularly that in mitochondria, was reduced in TECs with increased ROS and in the renal tubules of IRI-AKI mice. In addition to mitochondria, other sources or types of ROS such as Nox4 [43], hydrogen peroxide [44], and iNOS-derived reactive nitrogen species (RNS) [45] have been shown to be involved in the pathology of AKI. Moreover, by using specific inhibitors, we further showed that mtROS might play a predominant role in decreasing TFAM levels and mitochondrial mass in TECs. Mitochondria are highly dynamic organelles, and mitochondrial mass under conditions of stress is regulated by a balance between mitochondrial biogenesis (e.g., TFAM, mtDNA) and degradation (e.g., autophagy) [46]. Interestingly, we found that APO treatment partially restored TFAM levels but not TOM20 levels during t-BHP treatment, which might be due to the direct antioxidant effects [47] of APO and/or to its regulatory effects on autophagy [48,49]. Our results also suggest that the pathology of ROS-induced renal mitochondrial damage is complicated and that other mechanisms such as autophagy may also be involved. However, in the current study, we focused primarily on the impact of ROS on the TFAM pathway and mtDNA maintenance; the exact mechanism requires exploration in future studies.
TFAM is a nuclear-encoded protein that is synthesized in the cytoplasm, imported into mitochondria, and removed by Lon-mediated degradation [26,40]. Thus, the level of intracellular TFAM is determined by a dynamic balance between the transcription and degradation of TFAM. We found that the expression of TFAM mRNA at the transcriptional level was downregulated by mtROS and that it could be rescued by MT. Interestingly, there was a large recovery in TFAM mRNA levels but only a mild recovery in TFAM protein levels in injured HK2 cells after MT treatment, suggesting that mechanisms other than TFAM transcription are also involved. Maintaining an adequate physiological mtDNA copy number is crucial for cellular homeostasis [50]. Intracellular TFAM protein level and mtDNA copy number are regulated by posttranslational mechanisms as well as by TFAM transcription [50]. Next, we sought to determine whether TFAM degradation is affected by mtROS. Lon is a mitochondrial protease that also binds to specific regions of mtDNA and can eliminate disordered mitochondrial proteins. Lon selectively degrades TFAM protein and impacts mtDNA copy number at the posttranslational level [51]. It has been reported that Lon protein is induced in response to various stressors such as hypoxia, ischemia, and heat shock [52]. However, we found that the level of Lon protein was unaffected by t-BHP and H/R, whereas its protease activity increased markedly in response to mtROS. In contrast, inhibition of Lon activity by a chemical inhibitor or by siRNA partially reversed the decrease in TFAM and mtDNA copy number in TECs under stress conditions, again confirming that TFAM is a target of Lon protease. This phenomenon (i.e., increased Lon activity but unchanged Lon protein level) may be a result of the variable expression pattern of Lon in different tissues, since our results are based on TECs, while the previous findings were based on other cell types [52]. Taken together, these results demonstrate that mtROS can suppress the expression of TFAM protein in TECs by inhibiting its transcription and promoting its Lon-mediated degradation.
Since TFAM directly regulates mtDNA abundance, it plays essential roles in the maintenance of mtDNA stability and mitochondrial biogenesis as well as in the responses of cells to energy demand and the responses of signaling pathways to stimuli [53,54]. It has been reported that TFAM and mtDNA stabilize each other by binding to each other; thus, mtDNA can only be stably maintained in the form of nucleoid structures within the mitochondria, whereas both naked DNA and free TFAM in mitochondria are unstable and can be rapidly degraded [34]. During disease development, decreased TFAM levels may impair the interaction of TFAM with mtDNA and thus reduce the number of nucleoids and cause the formation of aberrant clusters; this, in turn, results in depletion of mtDNA and inhibition of mitochondrial transcription [55,56]. Indeed, we found that TFAM knockdown alone was sufficient to induce mtROS production, aberrant packaging of mtDNA nucleoids, and mitochondrial respiratory defects in TECs. Moreover, the protective effects of MT on mtDNA nucleoids and mitochondrial respiration in TECs under oxidative stress were abolished when TFAM was silenced. These results suggest that TFAM is an essential factor in maintaining mtDNA stability and mitochondrial biogenesis in the kidney. Therefore, the loss of TFAM after IRI-AKI caused a reduction in mtDNA synthesis and nucleoid stability, resulting in impaired mitochondrial energy metabolism and renal function.
Moreover, we found that inhibition of mtROS also attenuated the inflammatory response (e.g., cytokine release and infiltration by macrophages) in the kidneys of IRI-AKI mice and in TECs maintained under stress conditions. After renal damage, the release of endogenous damage-associated molecular patterns (DAMPs) such as ROS and mtDNA fragments by injured cells can activate cellular receptors, leading to downstream inflammation in the kidneys [57]. ROS have been proposed as one major type of DAMP that induces renal inflammation in animal and cell models of AKI [37]. Interestingly, we found that inhibition of mtROS reduced cytokine release and macrophage chemotaxis in TECs under stress conditions but that these rescue effects were abolished when TFAM was knocked down, suggesting that other mechanisms are also involved. In AKI patients, the amount of urinary mtDNA was elevated and positively correlated with the severity of renal injury [32]. Moreover, TFAM deficiency was shown to induce aberrant packaging of nucleoids, thereby promoting leakage of mtDNA into the cytosol and the production of cytokines [58]. Consistent with these reports, we found that mtROS increased the number of aberrant mtDNA nucleoids and the amount of leaked mtDNA in the cytosol and that these changes consequently induced cytokine release and macrophage infiltration in TECs and renal tubules. A recent study showed that mitochondrial macropores formed by activated Bax protein under stress allow the release of mtDNA into the cytosol [59]. Similarly, we observed activation of Bax protein and the formation of macropore-like structures in TECs in response to mtROS. Furthermore, we also observed decreased amounts of TFAM, together with increased numbers of aberrant nucleoids and increased amounts of leaked mtDNA, in the renal tubules of AKI patients. These results support the hypothesis that mtROS induce mtDNA release and subsequent inflammation of the kidneys by impairing the stability of TFAM and mtDNA.
Conclusion
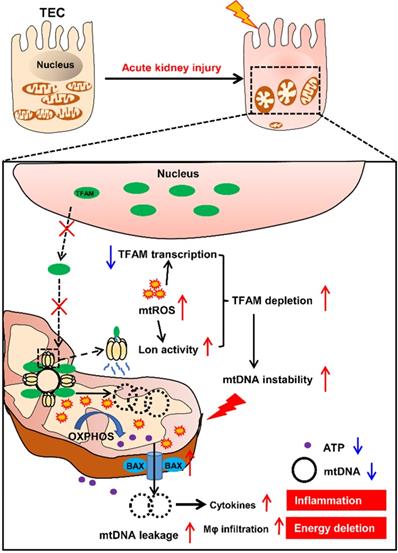
In summary, our results demonstrate that mtROS are one of the drivers of mitochondrial dysfunction and inflammation of the renal tubules in IRI-AKI. Mechanistically, mtROS reduced the abundance of TFAM in TECs by inhibiting its transcription and promoting its Lon-mediated degradation. TFAM deficiency further reduced mtDNA synthesis and mitochondrial biogenesis and thus induced mtDNA depletion and mitochondrial respiratory defects in TECs during IRI-AKI. At the same time, the loss of TFAM also impaired the stability of mtDNA nucleoids and promoted the release of mtDNA fragments and cytokine production in TECs during IRI-AKI (Figure 10). Therefore, mtROS-induced TFAM depletion plays an essential role in the pathology of IRI-AKI, and defective TFAM may serve as a therapeutic target for the promotion of renal recovery after IRI-AKI.
Schematic diagram of the findings of this study. The mtROS burst after IRI-AKI reduces TFAM transcription and promotes Lon-mediated TFAM degradation in renal tubular cells (TECs), leading to decreased mitochondrial TFAM levels in these cells. The loss of TFAM triggered by mtROS also causes depletion of mtDNA and impaired mitochondrial energy metabolism as well as elevated cytosolic mtDNA release and enhanced cytokine production in TECs, thereby exacerbating renal damage after IRI-AKI.
Abbreviations
AKI: acute kidney injury; BUN: blood urea nitrogen; CCK8: cell counting kit 8; CON: control; CREA: serum creatinine; IRI: ischemia/reperfusion injury; NC: negative control; siRNA: si-TFAM; si-Lon: Lon siRNA; ROS: reactive oxygen species; SDS-PAGE: sodium dodecyl sulfate-polyacrylamide gel electrophoresis; TFAM: mitochondrial transcription factor A; MT: Mito-Tempo; mtDNA: mitochondrial DNA; t-BHP: tert-butyl hydroperoxide; mtROS: mitochondrial ROS; TECs: tubule epithelial cells; TUNEL: terminal deoxynucleotidyl transferase mediated dUTP nick-end labeling staining; IF: Immunofluorescence.
Supplementary Material
Supplementary figures and tables.
Acknowledgements
This work was partly supported by grants from National Natural Science Foundation of China (81571808, 31871001, 32071453, and 81870609), Sichuan Science and Technology Program (2019YJ0069), and National Clinical Research Center for Geriatrics (Z20192002), 1.3.5 Project for Disciplines of Excellence (ZYGD18014), West China Hospital of Sichuan University.
Author Contributions
MZ, YZW and JPL designed the research and wrote the paper. MZ and YZW performed the experiments. MZ, YZW, LL, SYL, JPL analyzed the data. CSW and GY helped perform the animal experiments. YNC, JQC, YRL helped design the supporting experiments. JPL, YRL and JQC critically revised the paper.
Competing Interests
The authors have declared that no competing interest exists.
References
1. Thadhani R, Pascual M, Bonventre JV. Acute renal failure. N Engl J Med. 1996;334:1448-60
2. Funk JA, Schnellmann RG. Persistent disruption of mitochondrial homeostasis after acute kidney injury. Am J Physiol Renal Physiol. 2012;302:F853-64
3. Bhargava P, Schnellmann RG. Mitochondrial energetics in the kidney. Nat Rev Nephrol. 2017;13:629-46
4. Yu H, Jin F, Liu D, Shu G, Wang X, Qi J. et al. ROS-responsive nano-drug delivery system combining mitochondria-targeting ceria nanoparticles with atorvastatin for acute kidney injury. Theranostics. 2020;10:2342-57
5. Li X, Liao J, Su X, Li W, Bi Z, Wang J. et al. Human urine-derived stem cells protect against renal ischemia/reperfusion injury in a rat model via exosomal miR-146a-5p which targets IRAK1. Theranostics. 2020;10:9561-78
6. Chawla LS, Kimmel PL. Acute kidney injury and chronic kidney disease: an integrated clinical syndrome. Kidney Int. 2012;82:516-24
7. Coca SG, Singanamala S, Parikh CR. Chronic kidney disease after acute kidney injury: a systematic review and meta-analysis. Kidney Int. 2012;81:442-8
8. Xu L, Li X, Zhang F, Wu L, Dong Z, Zhang D. EGFR drives the progression of AKI to CKD through HIPK2 overexpression. Theranostics. 2019;9:2712-26
9. Bagshaw SM, Uchino S, Kellum JA, Morimatsu H, Morgera S, Schetz M. et al. Association between renal replacement therapy in critically ill patients with severe acute kidney injury and mortality. J Crit Care. 2013;28:1011-8
10. Bellomo R, Cass A, Cole L, Finfer S, Gallagher M, Lo S. et al. Intensity of continuous renal-replacement therapy in critically ill patients. N Engl J Med. 2009;361:1627-38
11. He L, Wei Q, Liu J, Yi M, Liu Y, Liu H. et al. AKI on CKD: heightened injury, suppressed repair, and the underlying mechanisms. Kidney Int. 2017;92:1071-83
12. Himmelfarb J, McMonagle E, Freedman S, Klenzak J, McMenamin E, Le P. et al. Oxidative stress is increased in critically ill patients with acute renal failure. J Am Soc Nephrol. 2004;15:2449-56
13. Chouchani ET, Pell VR, James AM, Work LM, Saeb-Parsy K, Frezza C. et al. A Unifying Mechanism for Mitochondrial Superoxide Production during Ischemia-Reperfusion Injury. Cell Metab. 2016;23:254-63
14. Kozlov AV, Bahrami S, Calzia E, Dungel P, Gille L, Kuznetsov AV. et al. Mitochondrial dysfunction and biogenesis: do ICU patients die from mitochondrial failure? Ann Intensive Care. 2011;1:41
15. Zorov DB, Juhaszova M, Sollott SJ. Mitochondrial reactive oxygen species (ROS) and ROS-induced ROS release. Physiol Rev. 2014;94:909-50
16. Duann P, Lin PH. Mitochondria Damage and Kidney Disease. Adv Exp Med Biol. 2017;982:529-51
17. Collins LV, Hajizadeh S, Holme E, Jonsson IM, Tarkowski A. Endogenously oxidized mitochondrial DNA induces in vivo and in vitro inflammatory responses. J Leukoc Biol. 2004;75:995-1000
18. Shimada K, Crother TR, Karlin J, Dagvadorj J, Chiba N, Chen S. et al. Oxidized mitochondrial DNA activates the NLRP3 inflammasome during apoptosis. Immunity. 2012;36:401-14
19. Maekawa H, Inoue T, Ouchi H, Jao TM, Inoue R, Nishi H. et al. Mitochondrial Damage Causes Inflammation via cGAS-STING Signaling in Acute Kidney Injury. Cell Rep. 2019;29:1261-73
20. Campbell CT, Kolesar JE, Kaufman BA. Mitochondrial transcription factor A regulates mitochondrial transcription initiation, DNA packaging, and genome copy number. Biochimica et Biophysica Acta (BBA) - Gene Regulatory Mechanisms. 2012;1819:921-9
21. Brinkkoetter PT, Bork T, Salou S, Liang W, Mizi A, Ozel C. et al. Anaerobic Glycolysis Maintains the Glomerular Filtration Barrier Independent of Mitochondrial Metabolism and Dynamics. Cell Rep. 2019;27:1551-66
22. Liu S, Zhao M, Zhou Y, Li L, Wang C, Yuan Y. et al. A self-assembling peptide hydrogel-based drug co-delivery platform to improve tissue repair after ischemia-reperfusion injury. Acta Biomater. 2020;103:102-14
23. Zhao M, Zhou Y, Liu S, Li L, Chen Y, Cheng J. et al. Control release of mitochondria-targeted antioxidant by injectable self-assembling peptide hydrogel ameliorated persistent mitochondrial dysfunction and inflammation after acute kidney injury. Drug Deliv. 2018;25:546-54
24. Zhu L, Yuan Y, Yuan L, Li L, Liu F, Liu J. et al. Activation of TFEB-mediated autophagy by trehalose attenuates mitochondrial dysfunction in cisplatin-induced acute kidney injury. Theranostics. 2020;10:5829-44
25. Martinez J, Tarallo D, Martinez-Palma L, Victoria S, Bresque M, Rodriguez-Bottero S. et al. Mitofusins modulate the increase in mitochondrial length, bioenergetics and secretory phenotype in therapy-induced senescent melanoma cells. Biochem J. 2019;476:2463-86
26. Lu B, Lee J, Nie X, Li M, Morozov YI, Venkatesh S. et al. Phosphorylation of human TFAM in mitochondria impairs DNA binding and promotes degradation by the AAA+ Lon protease. Mol Cell. 2013;49:121-32
27. Zhu W, Yuan Y, Liao G, Li L, Liu J, Chen Y. et al. Mesenchymal stem cells ameliorate hyperglycemia-induced endothelial injury through modulation of mitophagy. Cell Death Dis. 2018;9:837
28. Picard M, White K, Turnbull DM. Mitochondrial morphology, topology, and membrane interactions in skeletal muscle: a quantitative three-dimensional electron microscopy study. J Appl Physiol (1985). 2013;114:161-71
29. Zhou Y, Liu S, Zhao M, Wang C, Li L, Yuan Y. et al. Injectable extracellular vesicle-released self-assembling peptide nanofiber hydrogel as an enhanced cell-free therapy for tissue regeneration. J Control Release. 2019;316:93-104
30. Malik AN, Shahni R, Rodriguez-de-Ledesma A, Laftah A, Cunningham P. Mitochondrial DNA as a non-invasive biomarker: accurate quantification using real time quantitative PCR without co-amplification of pseudogenes and dilution bias. Biochem Biophys Res Commun. 2011;412:1-7
31. Eaton JS, Lin ZP, Sartorelli AC, Bonawitz ND, Shadel GS. Ataxia-telangiectasia mutated kinase regulates ribonucleotide reductase and mitochondrial homeostasis. J Clin Invest. 2007;117:2723-34
32. Whitaker RM, Stallons LJ, Kneff JE, Alge JL, Harmon JL, Rahn JJ. et al. Urinary mitochondrial DNA is a biomarker of mitochondrial disruption and renal dysfunction in acute kidney injury. Kidney Int. 2015;88:1336-44
33. Chamchoy K, Pakotiprapha D, Pumirat P, Leartsakulpanich U, Boonyuen U. Application of WST-8 based colorimetric NAD(P)H detection for quantitative dehydrogenase assays. Bmc Biochem. 2019;20:4
34. Kang D, Kim SH, Hamasaki N. Mitochondrial transcription factor A (TFAM): Roles in maintenance of mtDNA and cellular functions. Mitochondrion. 2007;7:39-44
35. Kaufman BA, Durisic N, Mativetsky JM, Costantino S, Hancock MA, Grutter P. et al. The mitochondrial transcription factor TFAM coordinates the assembly of multiple DNA molecules into nucleoid-like structures. Mol Biol Cell. 2007;18:3225-36
36. Szeto HH, Liu S, Soong Y, Seshan SV, Cohen-Gould L, Manichev V. et al. Mitochondria Protection after Acute Ischemia Prevents Prolonged Upregulation of IL-1beta and IL-18 and Arrests CKD. J Am Soc Nephrol. 2017;28:1437-49
37. Mapuskar KA, Wen H, Holanda DG, Rastogi P, Steinbach E, Han R. et al. Persistent increase in mitochondrial superoxide mediates cisplatin-induced chronic kidney disease. Redox Biol. 2019;20:98-106
38. Loor G, Kondapalli J, Iwase H, Chandel NS, Waypa GB, Guzy RD. et al. Mitochondrial oxidant stress triggers cell death in simulated ischemia-reperfusion. Biochim Biophys Acta. 2011;1813:1382-94
39. Wang J, Zhu P, Li R, Ren J, Zhang Y, Zhou H. Bax inhibitor 1 preserves mitochondrial homeostasis in acute kidney injury through promoting mitochondrial retention of PHB2. Theranostics. 2020;10:384-97
40. Kunkel GH, Chaturvedi P, Tyagi SC. Mitochondrial pathways to cardiac recovery: TFAM. Heart Fail Rev. 2016;21:499-517
41. Stallons LJ, Whitaker RM, Schnellmann RG. Suppressed mitochondrial biogenesis in folic acid-induced acute kidney injury and early fibrosis. Toxicol Lett. 2014;224:326-32
42. Yuan Y, Chen Y, Zhang P, Huang S, Zhu C, Ding G. et al. Mitochondrial dysfunction accounts for aldosterone-induced epithelial-to-mesenchymal transition of renal proximal tubular epithelial cells. Free Radic Biol Med. 2012;53:30-43
43. Meng XM, Ren GL, Gao L, Yang Q, Li HD, Wu WF. et al. NADPH oxidase 4 promotes cisplatin-induced acute kidney injury via ROS-mediated programmed cell death and inflammation. Lab Invest. 2018;98:63-78
44. Zhou X, Yang G, Davis CA, Doi SQ, Hirszel P, Wingo CS. et al. Hydrogen peroxide mediates FK506-induced cytotoxicity in renal cells. Kidney Int. 2004;65:139-47
45. Pathak E, Mayeux PR. In vitro model of sepsis-induced renal epithelial reactive nitrogen species generation. Toxicol Sci. 2010;115:475-81
46. Altshuler-Keylin S, Kajimura S. Mitochondrial homeostasis in adipose tissue remodeling. Sci Signal. 2017 10
47. Heumuller S, Wind S, Barbosa-Sicard E, Schmidt HH, Busse R, Schroder K. et al. Apocynin is not an inhibitor of vascular NADPH oxidases but an antioxidant. Hypertension. 2008;51:211-7
48. Itoh H, Matsuo H, Kitamura N, Yamamoto S, Higuchi T, Takematsu H. et al. Enhancement of neutrophil autophagy by an IVIG preparation against multidrug-resistant bacteria as well as drug-sensitive strains. J Leukoc Biol. 2015;98:107-17
49. Feng Y, Cui C, Liu X, Wu Q, Hu F, Zhang H. et al. Protective Role of Apocynin via Suppression of Neuronal Autophagy and TLR4/NF-kappaB Signaling Pathway in a Rat Model of Traumatic Brain Injury. Neurochem Res. 2017;42:3296-309
50. Kang I, Chu CT, Kaufman BA. The mitochondrial transcription factor TFAM in neurodegeneration: emerging evidence and mechanisms. Febs Lett. 2018;592:793-811
51. Matsushima Y, Goto Y, Kaguni LS. Mitochondrial Lon protease regulates mitochondrial DNA copy number and transcription by selective degradation of mitochondrial transcription factor A (TFAM). Proc Natl Acad Sci U S A. 2010;107:18410-5
52. Ngo JK, Pomatto LC, Davies KJ. Upregulation of the mitochondrial Lon Protease allows adaptation to acute oxidative stress but dysregulation is associated with chronic stress, disease, and aging. Redox Biol. 2013;1:258-64
53. Kukat C, Davies KM, Wurm CA, Spahr H, Bonekamp NA, Kuhl I. et al. Cross-strand binding of TFAM to a single mtDNA molecule forms the mitochondrial nucleoid. Proc Natl Acad Sci U S A. 2015;112:11288-93
54. Picca A, Lezza AM. Regulation of mitochondrial biogenesis through TFAM-mitochondrial DNA interactions: Useful insights from aging and calorie restriction studies. Mitochondrion. 2015;25:67-75
55. Donkervoort S, Sabouny R, Yun P, Gauquelin L, Chao KR, Hu Y. et al. MSTO1 mutations cause mtDNA depletion, manifesting as muscular dystrophy with cerebellar involvement. Acta Neuropathol. 2019;138:1013-31
56. Silva RE, Motori E, Bruser C, Kuhl I, Yeroslaviz A, Ruzzenente B. et al. Mitochondrial fusion is required for regulation of mitochondrial DNA replication. Plos Genet. 2019;15:e1008085
57. Rosin DL, Okusa MD. Dangers within: DAMP responses to damage and cell death in kidney disease. J Am Soc Nephrol. 2011;22:416-25
58. West AP, Khoury-Hanold W, Staron M, Tal MC, Pineda CM, Lang SM. et al. Mitochondrial DNA stress primes the antiviral innate immune response. Nature. 2015;520:553-7
59. McArthur K, Whitehead LW, Heddleston JM, Li L, Padman BS, Oorschot V. et al. BAK/BAX macropores facilitate mitochondrial herniation and mtDNA efflux during apoptosis. Science. 2018;359:eaao6047
Author contact
![]() Corresponding author: Jingping Liu, Key Laboratory of Transplant Engineering and Immunology, West China Hospital, Sichuan University, No. 1 Keyuan 4th Road, Gaopeng Ave, Chengdu 610041, China. Tel.: +86-28-85164029; Fax: +86-28-85164030; E-mail: liujingpingedu.cn.
Corresponding author: Jingping Liu, Key Laboratory of Transplant Engineering and Immunology, West China Hospital, Sichuan University, No. 1 Keyuan 4th Road, Gaopeng Ave, Chengdu 610041, China. Tel.: +86-28-85164029; Fax: +86-28-85164030; E-mail: liujingpingedu.cn.