Impact Factor
- Issue 14; 2026
- Issue 13; 2026
- Issue 12; 2026
- Issue 11; 2026
- Issue 10; 2026
- Volume 16; 2026
- Advance Articles
- Past Issues
- Cover Images
- Cover Suggestion
- Index & Coverage
- Special Issues
Introduction
Materials and Methods
Results
Discussion
Abbreviations
Supplementary Material
Acknowledgements
References
International Journal of Biological Sciences
International Journal of Medical Sciences
 Global reach, higher impact

Theranostics 2021; 11(10):4655-4671. doi:10.7150/thno.49007 This issue Cite
Research Paper
Aurka loss in CD19+ B cells promotes megakaryocytopoiesis via IL-6/STAT3 signaling-mediated thrombopoietin production
Xin Chen1,2*, Chennan Wang3*, Na Sun1,2, Shuai Pan1,2, Rongqing Li1,2, Xueqin Li1,2, Jie Zhao1,2, Huan Tong4, Yangyang Tang1,2, Jing Han1,2, Jianlin Qiao4, Hongbin Qiu3, Hui Wang1,2,5 ![]() , Jing Yang1,2,5
, Jing Yang1,2,5 ![]() , Takayuki Ikezoe6
, Takayuki Ikezoe6
1. Jiangsu Province Key Laboratory of Immunity and Metabolism, Xuzhou Medical University, Xuzhou, Jiangsu, China.
2. Department of Pathogenic Biology and Immunology, Xuzhou Medical University, Xuzhou, Jiangsu, China.
3. School of Basic Medicine, Jiamusi University, Jiamusi, Heilongjiang, China.
4. Department of Hematology, The First Affiliated Hospital of Xuzhou Medical University, Xuzhou, Jiangsu, China.
5. National Experimental Demonstration Center for Basic Medicine Education, Xuzhou Medical University, Xuzhou, Jiangsu, China.
6. The Department of Hematology, Fukushima Medical University, Fukushima, Japan.
*Equal contribution
Received 2020-6-2; Accepted 2021-2-15; Published 2021-3-4
Abstract

Rationale: Aurora kinase A (Aurora-A), which is required for mitosis, is a therapeutic target in various tumors. Targeting Aurora-A led to an increase in the differentiation and polyploidization of megakaryocytes both in vivo and in vitro. However, the mechanisms involved in controlling megakaryocyte differentiation have not been fully elucidated.
Methods: Conditional Aurka knockout mice were generated. B cell development, platelet development and function were subsequently examined. Proplatelet formation, in vivo response to mTPO, post-transfusion experiment, colony assay, immunofluorescence staining and quantification, and ChIP assay were conducted to gain insights into the mechanisms of Aurka loss in megakaryocytopoiesis.
Results: Loss of Aurka in CD19+ B cells impaired B cell development in association with an increase in the number of platelets in peripheral blood (PB). Surprisingly, thrombopoietin (TPO) production and IL-6 were elevated in the plasma in parallel with an increase in the number of differentiated megakaryocytes in the bone marrow (BM) of Aurkaf/f;Cd19Cre/+ mice. Interestingly, compared with that of the Aurkaf/f mice, a higher number of CD19+ B cells close to megakaryocytes was observed in the BM of the Aurkaf/f;Cd19Cre/+ mice. Moreover, Aurka loss in CD19+ B cells induced signal transducer and activator of transcription-3 (STAT3) activation. Inhibition of STAT3 reduced the Tpo mRNA levels. ChIP assays revealed that STAT3 bound to the TPO promoter. Additionally, STAT3-mediated TPO transcription was an autocrine effect provoked by IL-6, at least partially.
Conclusions: Deletion of Aurka in CD19+ B cells led to an increase in IL-6 production, promoting STAT3 activation, which in turn contributed to TPO transcription and megakaryocytopoiesis.
Keywords: Aurora-A, thrombopoietin, STAT3, IL-6, megakaryocytopoiesis.
Introduction
Aurora-A, one of the members of the serine/threonine kinase family, is required for centrosome maturation, mitotic spindle formation, and accurate chromosome segregation [1]. Aberrant expression of Aurora-A has been observed in various types of cancers, including colorectal cancer and hematopoietic malignancies [2, 3], indicating that Aurora-A is an attractive target for antitumor therapeutic strategies. However, deletion of the Aurora gene resulted in early embryonic lethality [4], and it is difficult to investigate the contributions of Aurora-A to tumorigenesis under actual physiological conditions. In an inducible mouse model with hematopoietic-specific Aurka deletion, loss of Aurka led to specific enrichment of differentiated megakaryocytes [1]. Additionally, alisertib, a specific inhibitor of Aurora-A, induced polyploidization and differentiation as assessed by CD41 and CD42 expression in megakaryocyte cells [5]. These observations indicated that Aurora-A was dispensable for megakaryocyte polyploidization and differentiation [1]. Nevertheless, the mechanisms involved in controlling megakaryocyte maturation mediated by Aurka deletion remain obscure.
TPO is required for the survival, proliferation and differentiation of BM megakaryocytes [6, 7]. Hepatocytes are one of the major sources of TPO production and secretion [8]. In a dextran sodium sulfate (DSS)-induced mouse model of colitis, the thrombocytosis response was observed in wild-type (WT) mice but not in Il6-/- mice [9]. Additionally, many studies found that the proinflammatory cytokine IL-6 stimulated hepatic TPO synthesis [10, 11], indicating that IL-6 could be involved in mediating the differentiation of megakaryocytes by regulating TPO synthesis.
STAT3, a member of the STAT family, has been extensively studied for its function as a transcriptional regulator and its role as a mediator of development, normal physiology, and pathology in many diseases [12]. In response to cytokines and growth factors, STAT3 is phosphorylated and activated. Activated STAT3 shuttles into the nucleus and binds to the interferon-gamma activated sequence (GAS) within target gene promoters to regulate gene transcription [13]. A recent study showed that upon Jak2 inhibitors, the Tpo mRNA levels were mediated by the Ashwell-Morell receptor (AMR) signal in association with a decrease in the phosphorylated forms of STAT3 in HepG2 cells [14]. However, the roles of STAT3 in Aurka loss-mediated differentiation of megakaryocytes are unknown. In this study, we found that loss of Aurka in CD19+ B cells contributed to the differentiation of megakaryocytes and platelet production via STAT3-mediated TPO transcription, at least partially.
Materials and Methods
Generation of the mice with conditional Aurka knockout
Conditional knockout of Aurka was generated as described previously [15]. The Cd19Cre/+ mice (B6.SJL-Tg(Cd19Cre)997Gum/J) were intercrossed with mice carrying loxP-flanked Aurka alleles (Aurkaf/f). PCR was utilized to identify the conditional Aurka knockout using primers (p5 5′-GGTAAGTGGTCTTGGGTGCT-3′; p6 5′- TAGCCAACTCATCTCCTCTG-3′) and Cd19Cre (OIMR1084: 5′- GCGGTCTGGCAGTAAAAACTATC -3′; OIMR1085: 5′- GTGAAACAGCATTGCTGTCACTT -3′; OIMR1589: 5′- CCTCTCCCTGTCTCCTTCCT-3′; OIMR1590: 5′- TGGTCTGAGACATTGACAATCA-3′) alleles. Mice were strictly bred and maintained under protocols approved by the Institutional Animal Care and Use Committee at Xuzhou Medical University. Six- to eight-week-old age- and sex-matched mice were used for the animal experiments.
Surface staining, flow cytometry and cell sorting
Spleen and BM cell suspensions were prepared as described [16]. After being washed with PBS twice, cells were blocked with either rat anti-mouse CD16/CD32 antibody (2.4G2, BD Biosciences) or APC-Cy7-anti-CD16/CD32 (2.4G2, isotypic control (IC): APC-Cy7-IgG2b, κ, A95-1, BD Biosciences) on ice for 10 min. After which, the cells were stained with indicated antibodies with directly-conjugated fluorochromes (dilution 1/100) or IC antibodies specific to each antibody used (dilution 1/100). Data were analyzed using FlowJo (FlowJo_V10).
For B cell analysis in BM or spleens, Percp-Cy5.5-anti-CD45 (30-F11, IC: PerCP-Cy5.5-IgG2b, κ, A95-1, BD Biosciences, CA, USA), PerCP-anti-B220 (RA3-6B2, IC: PerCP-IgG2a, κ, R35-95, BD Biosciences), V450-anti-CD19 (1D3, IC: V450-IgG2a, κ, R35-95, BD Biosciences), APC-anti-CD21 (7G6, IC: APC-IgG2b, κ, A95-1, BD Biosciences), PE-anti-CD23 (B3B4, IC: PE-IgG2a, κ, R35-95, BD Biosciences), FITC-anti-CD24 (M1-69, IC: FITC-IgG2b, κ, A95-1, BD Biosciences), PE-anti-CD43 (S7, IC: PE-IgG2a, κ, R35-95, BD Biosciences), PE/Cy7-anti-IgM (R6-60.2, IC: PE/Cy7-IgG2a, κ, R35-95, BD Biosciences), and BV510-anti-IgD (11-26c.2a, IC: BV510-IgG2a, κ, R35-95, BD Biosciences) antibodies were used.
For megakaryocyte analysis in BM, an anti-lineage marker cocktail was used: FITC-anti-TER119 (Ter119, IC: FITC-IgG2b, κ, eB149/10H5, eBioscicence), FITC-anti-B220 (RA3-6B2, IC: FITC-IgG2a, κ, RTK2758, Biolegend, San Diego, CA, USA), FITC-anti-CD11b (M1/70, IC: FITC-IgG2b, κ, A95-1, BD Biosciences), FITC-anti-Gr-1 (RB6-8C5, IC: FITC-IgG2b, κ, RTK4530, Biolegend), FITC-CD11c (N418, IC: FITC-IgG, HTK888, Biolegend), FITC-anti-CD4 (RM4-5, IC: FITC-IgG2a, κ, R35-95, BD Biosciences), FITC-anti-CD8a (53-6.7, IC: FITC-IgG2a, κ, R35-95, BD Biosciences). PE/Cyanine7-anti-c-Kit (2B8, IC: PE/Cyanine7-IgG1, κ, MOPC-21, Biolegend), APC/Cyanine7-anti-Sca-1 (D7, IC: APC/Cyanine7-IgG2a, κ, RTK2758, Biolegend), PE-anti-CD34 (RAM34, IC: PE-IgG2a, κ, R35-95, BD Biosciences), PerCP/Cyanine5.5-anti-CD41 (MWReg30, Biolegend), APC-Cy7-anti-CD16/CD32 and APC-anti-Mpl (bs-10362R, IC: APC-IgG, bs-0295P-APC, Bioss, Beijing, China) antibodies were used.
Intracellular cytokine staining was performed as described previously [17]. Briefly, cells were harvested, washed and surface stained prior to intracellular staining using Fixation/Permeabilization kit (BD Biosciences) following the manufacturer's instructions. The antibodies to label the following cell surface markers and cytokines were used: FITC-anti-CD11b, PE-anti-F4/80 (T45-2342, IC: PE-IgG2a, κ, R35-95, BD Biosciences), V450-anti-CD19 (1D3, IC: V450-IgG2a, κ, R35-95, BD Biosciences), APC-anti-IL-6 (MP5-20F3, IC: APC-IgG1, κ, RTK2071, Biolegend), and FITC-anti-p-STAT3 (13A3-1, IC: FITC-IgG1, κ, MOPC-21, Biolegend).
For cell sorting, cells were stained with the indicated antibodies and sorted on a FACSAria flow cytometer. The purity of the sorted cells was greater than 99%.
Cellularity determination
Cellularity determination was performed as previously described [18]. Briefly, an aliquot of BM cell suspensions was diluted in 3% acetic acid to lyse the red blood cells and subjected to cell counting. Trypan blue staining was used to assess cell viability, which was higher than 98% in all experiments.
Mouse megakaryocytes culture
Briefly, mouse BM cells were flushed from the femur and tibia and were then sorted for Lin-c-Kit+ cells by flow cytometry after staining with anti-lineage marker cocktail and anti-c-Kit antibodies. Lin-c-Kit+ cells were grown in 10% FBS-supplemented RPMI-1640 medium with 2 mM L-glutamine, penicillin/streptomycin, and 20 ng/mL murine stem cell factor (SCF, Peprotech; Rocky Hill, NJ, USA) at 37°C under 5% CO2 for 2 days. The cells were then cultured in the presence of 20 ng/mL murine SCF and 200 ng/mL murine TPO (mTPO, Peprotech) for the indicated time points to obtain murine megakaryocytes as described previously [19, 20].
Isolation of primary mouse hepatocytes
Aurkaf/f mice were treated with either control diluent or 1 µg IL-6 as previously described [10]. Hepatocytes were isolated from mice by two-step collagenase perfusion. Briefly, after perfusion and dissociation, cells were filtered through a 70 mm filter. Hepatocytes were further separated and purified by centrifugation at low speed, and Percoll gradient centrifugation was performed as described previously [21-23].
Platelet counts and preparation
Platelet, mean platelet volume and blood cell counts were performed with a Sysmex XP-100 Hematologic Analyzer (Sysmex Corporation). Platelet was prepared as previously described [24].
Reticulated platelets (RP) analysis
RP was examined as described previously [25]. Briefly, 50 μL whole blood was collected into 50 μL of 0.76% sodium citrate, and incubated with PE-CD41 (MWReg30, BD Biosciences) for 10 min in the dark at room temperature. After which, platelet rich plasma (PRP) was prepared by centrifugation (180 g for 5 min at room temperature) and diluted with 4% formaldehyde. Fixed platelets were stained with thiazole orange (100 ng/mL, Retic-count, Becton Dickinson, SA) for 30 min in the dark at room temperature, and subjected to flow cytometry. A total of 5 × 10⁴ identified platelets were collected, and the percentage of RP was analyzed.
Proplatelet formation
Proplatelet formation was performed as previously described [20]. Briefly, Lin-c-Kit+ cells from mouse BM were sorted and cultured in 10% FBS-supplemented RPMI-1640 medium with 2 mM L-glutamine and penicillin/streptomycin in the presence of 200 ng/mL mTPO for 4 days.
For coculture experiments, CD19+ B cells from the Aurkaf/f;Cd19Cre/+ mice were sorted and cocultured with Lin-c-Kit+ hematopoietic progenitors from normal mice in 10% FBS-supplemented RPMI-1640 medium with 2 mM L-glutamine and penicillin/streptomycin in the presence of 200 ng/mL mTPO together with murine 5 ng/mL murine IL-17 (mIL-17, Peprotech; Rocky Hill, NJ, USA). CD41+ von Willebrand factor (vWF)+ (11778-1-AP, Proteintech) cells with cytoplasmic processes longer than the diameter of the cytoplasm were defined as proplatelet-forming megakaryocytes, in which vWF staining indicates platelet buds scattered throughout proplatelets [20]. The number of proplatelet-forming megakaryocytes was determined by Immunofluorescence staining. For confocal microscopy, cells were fixed with 10% formalin and permeabilized with 0.25% Triton X-100. After which, cells were stained with anti-CD41 (dilution 1/200) and anti-vWF (dilution 1/50) antibodies. The nuclei were stained with 4', 6-diamidino-2-phenylindole (DAPI). The slides were imaged by laser confocal microscope.
Tail bleeding time
Tail bleeding time was measured to examine platelet function in vivo as described previously [26]. Briefly, a 3-mm segment of the tail tip of each mouse was cut off, and the tail was immersed in prewarmed sterile saline solution (37°C). Tail bleeding time was defined as the time taken for bleeding to stop.
Ploidy analysis
Hoechst 33342 (10 µg/mL, MCE) was added to the medium of cultured megakaryocytes for 2 h at 37°C as described previously [27]. Cells were stained with the directly coupled monoclonal antibodies PE-anti-CD41 and APC-anti-Mpl for 30 min at 4°C. Ploidy was measured in the CD41+Mpl+ cell population.
Transmission electron microscopy
The ultrastructure of megakaryocytes was examined by transmission electron microscopy as described previously [28]. Briefly, Lin-c-Kit+ cells from mouse BM were first sorted with flow cytometry. Then, the cells were grown in 10% FBS-supplemented RPMI-1640 medium with 2 mM L-glutamine and penicillin/streptomycin medium in the presence of 20 ng/mL murine SCF and 200 ng/mL murine TPO. After 4 days, the cells were centrifuged at 1500 rpm for 10 min and washed twice with phosphate-buffered saline. Then, the pellets were immersed in a fixative consisting of 2.5% glutaraldehyde and 3% paraformaldehyde and subjected to transmission electron microscope analysis (Philips Tecnai-10; Eindhoven, The Netherlands).
In vivo response to mTPO
For determination of whether the Aurkaf/f;Cd19Cre/+ mice have a different sensitivity to TPO, 6-week-old mice were subcutaneously (s.c.) injected with either 0.1% bovine BSA or mTPO at a dose of 100 ng/g body weight for 3 consecutive days as described previously [29]. The number of platelets was counted every other day.
Post-transfusion experiment
A post-transfusion experiment was performed as previously described [24]. Briefly, washed murine platelets labeled with 5 μg/mL calcein (BD Biosciences) were incubated at RT for 1 h and were transfused into acceptor mice through the tail (1 × 10⁸ platelets in 100 μL of MTB). Blood sampling at the tail was collected at 1 min (baseline), 6 h, 12 h, 24 h and 48 h, and total platelets were labeled with PE-anti-CD41 antibody. The percentage of calcein-labeled platelets remaining in circulation was assessed by flow cytometry.
Colony assay
Colony forming unit (CFU) assays were performed by culturing freshly sorted BM lin-c-kit+Sca-1+ cells on Methocult GF M3434 (StemCell Technologies). Methocult GF M3434 media (1 mL) containing 1000 lin-c-kit+Sca-1+ cells was plated and cultured for 7-10 days for CFU-erythroid (E), CFU-granulocyte/macrophage (GM), CFU-granulocyte (G), CFU-macrophage (M) and CFU-multipotential progenitor cell-granulocyte/erythrocyte/macrophage/megakaryocyte (GEMM) scoring. 2000 lin-c-kit+Sca-1+ cells were mixed with 1 mL of semisolid medium (Methocult-c, 04974, StemCell Technologies) supplemented with 10 ng/mL IL-3, 20 ng/mL IL-6 and 50 ng/mL TPO, and cultured for 6 days for CFU- megakaryocyte (MK) scoring.
Real-time reverse transcription-polymerase chain reaction (real-time RT-PCR)
A total of 1 × 10⁴ sorted cells were lysed in lysis buffer (TaKaRa, 3735A) and subjected to real-time RT-PCR according to the instruments.
1 × 10⁶ sorted CD19+ B cells from either the Aurkaf/f or Aurkaf/f;Cd19Cre/+ mice were exposed to either 10 mM C188-9 and/or 100 ng/mL IL-6. After 24 h, cells were harvested, RNA was extracted and subjected to real-time RT-PCR.
Hepatocytes were isolated from Aurkaf/f mice treated with either control diluent or 1 µg IL-6. RNA was extracted and subjected to real-time RT-PCR. The primer sets for PCR are shown in Table 1.
Real time RT-PCR primers.
| Gene | Direction | Primer |
|---|---|---|
| Aurka | Forward | 5'-CGTCTTGGTGACTGAGCAGA-3' |
| Reverse | 5'-GACCTGCTCCAAGTTTCTGG-3' | |
| Tpo | Forward | 5'-GCTCTTTGCTGGAACCTCAC-3' |
| Reverse | 5'-AGGCTTGGAGAAGGAGGAAG-3' | |
| Mpl | Forward Reverse | 5'-TCACCTTGGTGACTGCTCTG-3' 5'-AGCATGCCTCAGTCTCCTGT-3' |
| Actb | Forward | 5'-GCTACAGCTTCACCACCACA-3' |
| Reverse | 5'-TCTCCAGGGAGGAAGAGGAT-3' | |
| Gata1 | Forward | 5'-AGCAACGGCTACTCCACTGT-3' |
| Reverse | 5'-CCGGTTCTGACCATTCATCT-3' |
Immunoblotting
Immunoblotting was performed as previously described [30]. Anti-Aurora-A (35C1, ab13824) antibody was purchased from Abcam (MA, USA). Anti-p-STAT1 (Tyr701)(D4A7, #7649), anti-STAT1 (D1K9Y, #14994), anti-p-STAT3 (Tyr705) (D3A7, #9145) and anti-STAT3 (D3Z2G, #12640) were purchased from Cell Signaling Technology (MA, USA). Anti-β-actin (66009-1-Ig) antibodies were purchased from Proteintech.
Histologic analysis
Tissues were fixed in 4% formaldehyde and embedded in paraffin. Sections with a thickness of 4 µm were stained with hematoxylin-eosin (Beyotime Biotechnology, Nantong, Jiangsu, China) as described previously [31, 32].
Immunofluorescence staining and quantification
Multiplex staining and multispectral imaging were performed to identify the cell subsets expressing CD41 (24552-1-AP, Proteintech), Mpl (bs-10362R, Bioss, dilution 1/50), IL-6 (bs-0782R, Bioss, dilution 1/50), TPO (Invitrogen, dilution 1/50), CD138 (10593-1-AP, Proteintech, dilution 1/50) or CD19 (D4V4B, #90176, Cell Signaling Technology, dilution 1/100) in the BM sections using a PANO 4-plex IHC kit (Yuanxi, Shanghai, China). Different primary antibodies were sequentially applied, followed by horseradish peroxidase-conjugated secondary antibody incubation and tyramide signal amplification. The slides were microwave heat-treated after each TSA operation. Nuclei were stained with 4', 6-diamidino-2-phenylindole (DAPI, Sigma) after all the mouse antigens had been labeled.
Images of BM sections were acquired using a Zeiss Axio Imager 2 microscope (×20 magnification) and analyzed using TissueFAXs and StrataQuest tissue analysis software (TissueGnostics, Beijing, China) as described previously [33]. Briefly, identical exposure times and threshold settings were used for each channel on all sections of similar experiments. The algorithm detected nuclei on the basis of the signal from the DAPI channel, then expanded and built a mask over the cytoplasm [33]. On the generated mask, the algorithm searched for the localization of 520, 570 and 650 signals. Results were plotted onto scattergrams, and events were manually verified for all quadrants. The number of CD41+Mpl+ megakaryocytes per area (mm2), and the number of CD19+ B cells or CD138+ plasma cells within the indicated distance with respect to megakaryocytes were calculated.
Enzyme-linked immunosorbent assay (ELISA)
The concentrations of the indicated cytokines in the plasma were examined using ELISA kits (R&D) according to the manufacturer's instructions. The concentration of TPO in the plasma and in spleen or liver tissues was analyzed using an ELISA kit (mmBio, China) according to the manufacturer's instructions. Briefly, frozen spleen or liver tissues (20 - 30 mg) were weighed and homogenized in 50 mL PBS (pH 7.4). Homogenates were sonicated for 20 s and then centrifuged at 13200 rpm for 10 min at 4°C to remove cellular debris. After centrifugation, the supernatant was collected and subjected to ELISA. The concentration of TPO in tissues was calculated following the formula: (concentration × sample volume × diluent factor)/weight used for ELISA.
ChIP assay
ChIP analysis was performed using a commercially available kit (Beyotime Biotechnology). DNA-bound proteins were crosslinked using formaldehyde at a final concentration of 1% for 20 min at 37°C. Protein-DNA complexes were immunoprecipitated using primary antibodies against STAT3 (#9145, Cell Signaling Technology). The binding sites of STAT3 on the TPO promoter were predicted using LASAGNA-Search 2.0: Searching for transcription factor binding sites (TFBSs) (https://biogrid-lasagna.engr.uconn.edu/lasagna_search). STAT3 and TPO promoter complexes were measured by PCR. The primer sets used for the amplification of the TPO promoter region between -1030 to -832 bp were as follows: forward 5'- GGGAAAACGATCCAACCAC-3', reverse 5'-GGAGGAGAGCAGGAGAAAGAA-3'; -3778 to -3637 bp without predicted STAT3 binding sites as a negative control, forward 5'-CTCTGGGGCTACTCTTGGTG-3', reverse 5'-ACCCTGATGTGCCTTGTTTC-3'. The samples were separated by electrophoresis in a 2% agarose gel and visualized by ethidium bromide staining.
Correlation analysis using the GEPIA web tool
The online database Gene Expression Profiling Interactive Analysis (GEPIA2, http://gepia2.cancer-pku.cn/#index) was used to analyze a pairwise gene correlation analysis for any given set of expression data from the Genotype-Tissue Expression (GTEx) using Pearson correlation statistics.
Statistical analysis
Statistical analysis was performed to assess the difference using an unpaired Student's t-test, two-way ANOVA followed by multiple comparisons by Prism statistical analysis software (GraphPad Software, San Diego, CA). Data are presented as the mean ± SD. Significance is indicated as follows: *P < 0.05 or n.s. for not significant.
Results
Aurka deficiency impaired B cell development
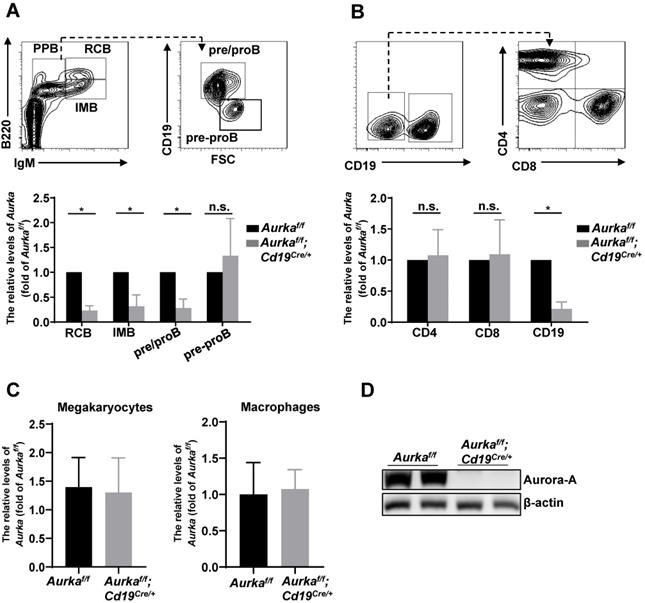
To study the role of Aurora-A in B cells, we deleted the Aurka gene specifically in CD19-expressing B cells by crossing Cd19Cre/+ mice with Aurkaf/f mice. The Aurkaf/f;Cd19Cre/+ mice were born at the Mendelian ratio and phenotypically grossly normal (data not shown). We examined the Aurka mRNA levels by real-time RT-PCR and found that the levels of Aurka were obviously decreased in recirculating B cells (RCB), immature B cells (IMB) and pre/pro B cells (PPB) sorted from the Aurkaf/f;Cd19Cre/+ mice compared with those of the Aurkaf/f mice (Figure 1A). However, the levels of Aurka did not change in pre-pro B cells without CD19 expression isolated from the BM of the Aurkaf/f;Cd19Cre/+ mice compared with the Aurkaf/f mice (Figure 1A). As shown in Figure 1B, the levels of Aurka mRNA were dramatically reduced in the CD19-expressing B cells but not in the CD4- or CD8-expressing T cells. Additionally, the Aurka mRNA levels were almost identical in myeloid cells such as megakaryocytes and macrophages sorted from the Aurkaf/f;Cd19Cre/+ mice compared with those sorted from the Aurkaf/f mice (Figure 1C). Western blot analysis further confirmed the decreased Aurora-A protein in the CD19-expressing B cells (Figure 1D).
Aurka was deleted in CD19+ B cells. (A) The mRNA levels of Aurka were examined in sorted RCB, IMB, pre/pro B and pre-pro B cells. *, P < 0.05, n.s., not significant. (B) The mRNA levels of Aurka were examined in sorted CD4+ T, CD8+ T and CD19+ B cells. *, P < 0.05, n.s., not significant. (C) The mRNA levels of Aurka were examined in sorted megakaryocytes and macrophages. (A-C) Data shown is mean ± SD of one of three independent experiments (n = 3 mice/group) with similar results. Significance was calculated using an unpaired Student's t-test. *, P < 0.05. (D) Aurora-A expression was examined in sorted CD19+ B cells from either Aurkaf/f mice (n = 2) or Aurkaf/f;Cd19Cre/+ mice (n = 2) by Western blotting. The data shown is representative of one of two independent experiments.
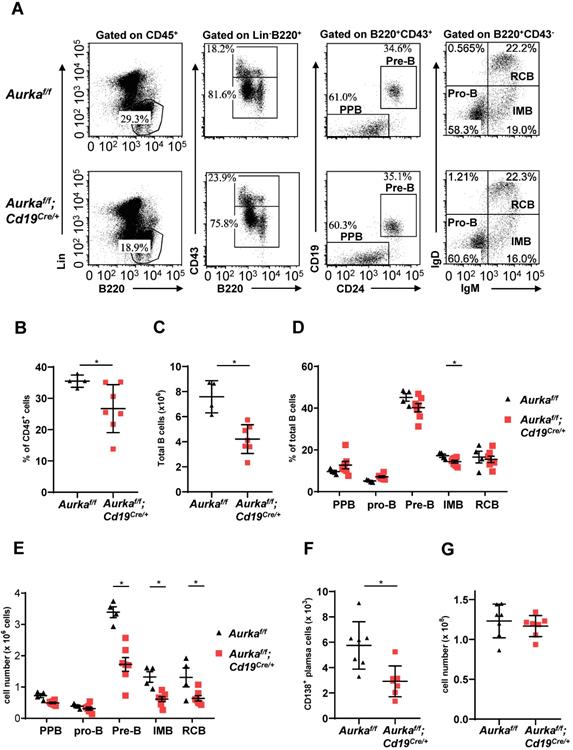
B-cell development was impaired in the BM of the Aurkaf/f;Cd19Cre/+ mice. Compared with that of the Aurkaf/f mice, the percentage of B220+ cells in gated CD45+ cells was obviously decreased (Figures 2A and 2B). The total number of B cells in BM was dramatically reduced in the Aurkaf/f;Cd19Cre/+ mice (Figure 2C). In addition, the percentage of IMB and the numbers of pre-B, IMB, RCB and CD138+ plasma cells were also significantly decreased in the BM of the Aurkaf/f;Cd19Cre/+ mice (Figures 2D-2F). However, the nucleated cell number in BM from the Aurkaf/f;Cd19Cre/+ mice was almost identical to that in BM from the Aurkaf/f mice (Figure 2G).
B cell development was impaired in BM. (A) The distribution of various B-cell populations in the BM of mice with different genotypes was assessed by flow cytometry. The data shown are representative of one of three independent experiments. (B) The dot graph shows the percentage of Lin-B220+ B cells gated on CD45+ cells in the BM. *, P < 0.05. (C) The dot graph shows the total number of Lin-B220+ B cells in the BM. *, P < 0.05. (D) The dot graph shows the percentage of various B-cell populations in the BM of mice with different genotypes. *, P < 0.05. (E) Dot graph shows the total number of various B-cell populations in the BM of mice with different genotypes. The total number of indicated cells was calculated following the following formula: the number of indicated B cells/the number of gated single cells × the total nucleated cells recovered from BM. *, P < 0.05. (F) CD19+ B cells (1 × 10⁵) in the BM of mice with different genotypes were analyzed. The dot graph shows the number of CD138+ plasma cells in these CD19+ B cells. *, P < 0.05. (G) The dot graph shows the total number of nucleated cells in the BM of mice with different genotypes. *, P < 0.05. (B-G) Data shown are mean ± SD of one of three independent experiments (n = 4 - 7 mice/group) with similar results. Significance was calculated using an unpaired Student's t-test.
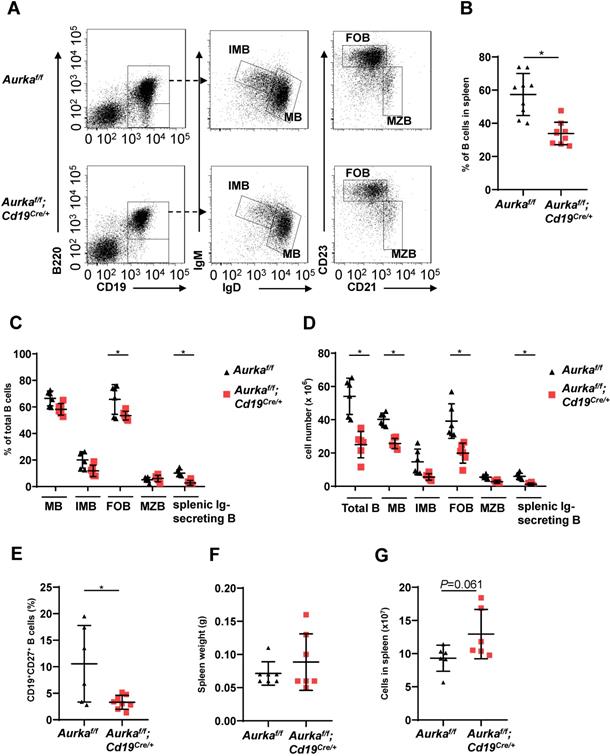
We next investigated the development of B cells in spleens and found that the percentage of B cells and the total number of B cells in spleens were potently decreased (Figures 3A-3C). As expected, the percentages of mature B (MB), IMB, follicular B (FOB) and splenic Ig-secreting B cells were lower in the Aurkaf/f;Cd19Cre/+ mice than in the Aurkaf/f mice (Figure 3C). Additionally, the numbers of MB, IMB, FOB, marginal zone B (MZB) and splenic Ig-secreting B cells were decreased in the Aurkaf/f;Cd19Cre/+ mice compared with the Aurkaf/f mice (Figure 3D). The percentages of CD27+ memory B cells were obviously lower in spleens isolated from the Aurkaf/f;Cd19Cre/+ mice than in those isolated from the Aurkaf/f mice (Figure 3E). Unexpectedly, the weights of the spleens as well as the total splenic nucleated cell number were slightly increased in the Aurkaf/f;Cd19Cre/+ mice compared with the Aurkaf/f mice (Figures 3F and 3G).
B cell development was impaired in the spleen. (A) Approximately 1 × 10⁵ nucleated cells in the spleens of mice with different genotypes were analyzed. The distribution of various B-cell populations in the spleen of mice with different genotypes was assessed by flow cytometry. The data shown is representative of one of two independent experiments. (B) The dot graph shows the percentage of CD19+ B cells gated on CD45+ cells in the spleens removed from the Aurkaf/f mice or the Aurkaf/f;Cd19Cre/+ mice. Data shown are mean ± SD of one of two independent experiments (n = 9 mice/group) with similar results. P-value was calculated using an unpaired Student's t-test. *, P < 0.05. (C) The dot graph shows the percentage of various B-cell populations in the total B cells of the spleens removed from the Aurkaf/f mice or the Aurkaf/f;Cd19Cre/+ mice. *, P < 0.05. (D) The dot graph shows the total number of indicated B cells in spleens. The total number of indicated cells was calculated with the following formula: the number of indicated B cells/the number of gated single cells × the total nucleated cells recovered from the spleen. *, P < 0.05. (E) CD19+ B cells (1 × 10⁵) in the spleens removed from the Aurkaf/f mice or the Aurkaf/f;Cd19Cre/+ mice were analyzed. The dot graph shows the total number of CD27+ memory B cells in these CD19+ B cells. *, P < 0.05. (C-E) Data shown are mean ± SD of one of two independent experiments (n = 6 mice/group) with similar results. Significance was calculated using an unpaired Student's t-test. (F) The dot graph shows the spleen weight of either the Aurkaf/f mice or the Aurkaf/f;Cd19Cre/+ mice. The data shown are representative of one of two independent experiments (n = 7 mice/group) with similar results. Significance was calculated using an unpaired Student's t-test. (G) The dot graph shows the total number of nucleated cells in the spleens of either the Aurkaf/f mice or the Aurkaf/f;Cd19Cre/+ mice. The data shown are representative of one of two independent experiments (n = 6 mice/group) with similar results. Significance was calculated using an unpaired Student's t-test.
Aurka loss in CD19+ B cells led to an increase in platelet production
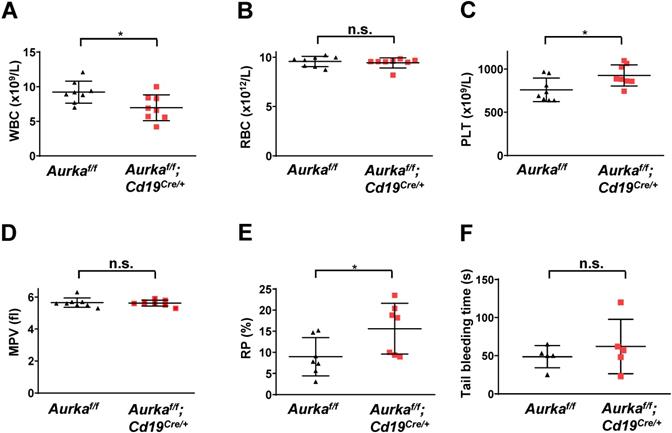
To further confirm whether deletion of Aurora-A in CD19-expressing cells could induce a decrease in the number of white blood cells (WBCs), we performed blood cell counts and found that the total number of WBCs was obviously decreased (Figure 4A). Deletion of Aurka did not influence the number of red blood cells (RBCs, Figure 4B). Unexpectedly, the total platelet count was elevated in the Aurkaf/f;Cd19Cre/+ mice compared with of the Aurkaf/f mice or the Aurka+/+;Cd19Cre/+ mice (Figures 4C and S1). Additionally, the percentage of RP was also increased in the Aurkaf/f;Cd19Cre/+ mice compared with of the Aurkaf/f mice, although the mean platelet volume was identical in the Aurkaf/f;Cd19Cre/+ mice and the Aurkaf/f mice (Figures 4D and 4E). We also investigated whether Aurka loss in CD19+ B cells influenced platelet function in vivo. We performed a tail bleeding assay and found that the Aurkaf/f;Cd19Cre/+ mice demonstrated slightly increased tail bleeding times compared with the Aurkaf/f mice (Figure 4F).
The total number of platelets was increased in the Aurkaf/f;Cd19Cre/+ mice. (A) The total number of WBCs in the peripheral blood of either the Aurkaf/f mice or the Aurkaf/f;Cd19Cre/+ mice was examined by a Sysmex XP-100 hematologic analyzer. *, P < 0.05. (B) Dot graph shows the total number of RBCs in the peripheral blood of either the Aurkaf/f mice or the Aurkaf/f;Cd19Cre/+ mice. n.s., not significant. (C) The dot graph shows the total number of platelets in the peripheral blood of either the Aurkaf/f mice or the Aurkaf/f;Cd19Cre/+ mice. *, P < 0.05. (D) The dot graph shows the mean platelet volume. n.s., not significant. (A-D) The data shown are representative of one of two independent experiments (n = 8 mice/group) with similar results. Significance was calculated using an unpaired Student's t-test. (E) The dot graph shows the percentage of RPs in approximately 3 × 10⁴ platelets isolated from either the Aurkaf/f mice or the Aurkaf/f;Cd19Cre/+ mice. The data shown are representative of one of three independent experiments (n = 5 - 8 mice/group) with similar results. Significance was calculated using an unpaired Student's t-test. *, P < 0.05. (F) Tail bleeding time analysis was used to analyze platelet function in vivo. The data shown are representative of one of two independent experiments (n = 5 mice/group) with similar results. Significance was calculated using an unpaired Student's t-test. n.s., not significant.
Deletion of Aurka in CD19+ B cells promoted thrombopoiesis
Deletion of Aurka in hematopoietic cells or inhibition of Aurora-A activity by its inhibitor promoted the differentiation of megakaryocytes [1]. To determine whether the observed elevated platelets in the Aurkaf/f;Cd19Cre/+ mice were linked to an increase in megakaryocyte progenitor cells as well as differentiated megakaryocytes, we first examined the percentages of Lin-c-Kit+Sca1-CD34-CD16- cells that enrich bipotential precursors (MEPs) [34]. As shown in Figures 5A and 5B, the number of MEPs was almost identical in the Aurkaf/f;Cd19Cre/+ mice and the Aurkaf/f mice. Interestingly, the number of CD41+Mpl+ megakaryocytes was significantly increased in the Aurkaf/f;Cd19Cre/+ mice compared with the Aurkaf/f mice. Multiplex immunofluorescence staining also revealed that the number of CD41+Mpl+ megakaryocytes was obviously elevated in the Aurkaf/f;Cd19Cre/+ mice compared with the Aurkaf/f mice (Figure 5C). A previous study showed that megakaryocytes interact with plasma cells and are an important component of the niche for long-lived plasma cells in the BM [35]. However, whether CD19+ B cells or plasma cells are critical for megakaryocytes is unclear. We therefore examined the localization of CD19+ B cells with respect to megakaryocytes in BM and found that the cell number of CD19+ B cells surrounding CD41+Mpl+ megakaryocytes (within 25 mm) was higher in the BM of the Aurkaf/f;Cd19Cre/+ mice than in that of the Aurkaf/f mice (Figure 5D). However, the number of CD138+ plasma cells surrounding CD41+Mpl+ megakaryocytes (within 25 mm) was lower in the BM of the Aurkaf/f;Cd19Cre/+ mice than in that of the Aurkaf/f mice (Figure 5D).To further confirm the megakaryocyte differentiation observed in the Aurkaf/f;Cd19Cre/+ mice, we examined the ploidy and ultrastructure of megakaryocytes. An increase in megakaryocyte ploidy was observed in the Aurkaf/f;Cd19Cre/+ mice compared with the Aurkaf/f mice (Figure 5E). Moreover, well-developed demarcation membranes (DMs) were observed in cultured megakaryocytes from the Aurkaf/f;Cd19Cre/+ mice compared with those from the Aurkaf/f mice (Figure 5F).
Aurka loss increased the number of CD41+Mpl+ megakaryocytes and megakaryocyte differentiation. (A) Approximately 3 × 10⁴ Lin-c-Kit+Sca-1- cells were analyzed. The distribution of MEPs and megakaryocytes in the BM of mice with different genotypes was assessed by flow cytometry. The data shown are representative of one of two independent experiments. (B) The dot graph shows the number of MEPs and megakaryocytes in BMs removed from the Aurkaf/f mice or the Aurkaf/f;Cd19Cre/+ mice. The data shown are representative of one of two independent experiments (n = 7 mice/group) with similar results. Significance was calculated using an unpaired Student's t-test. *, P < 0.05. (C, left) H&E and Immunofluorescence staining for CD41+Mpl+ megakaryocytes, CD19+ B cells, or CD138+ plasma cells in the BM sections from the Aurkaf/f or Aurkaf/f;Cd19Cre/+ mice. (C, right) The dot graph shows the number of CD41+Mpl+ megakaryocytes in the BM sections from the Aurkaf/f mice or the Aurkaf/f;Cd19Cre/+ mice. The data shown is representative of one of two independent experiments (n = 3 mice/group, 5 slides/mouse) with similar results. P values were obtained using a 2-sided, unpaired Student's t-test. **, P < 0.01. (D) Dot graph shows the number of CD19+ B cells or CD138+ plasma cells within the 25 mm distance with respect to megakaryocytes in the BM sections from the Aurkaf/f mice or the Aurkaf/f;Cd19Cre/+ mice. The data shown is representative of one of two independent experiments (n = 3 mice/group, 5 slides/mouse) with similar results. Significance was calculated using an unpaired Student's t-test. n.s., not significant. (E) The ploidy of megakaryocytes was studied after staining with anti-CD41, anti-Mpl antibodies and Hoechst labeling. The histograms show one of three independent experiments (n = 5 mice/group) with similar results. (F) The ultrastructure of megakaryocytes was visualized by TEM. DM, demarcation membrane; N, nucleus; A, α-granules. The data shows one of three independent experiments (n = 3 mice/group) with similar results. (G) Lin-c-Kit+ cells from the BM of either the Aurkaf/f mice or the Aurkaf/f;Cd19Cre/+ mice were cultured in the presence of 200 ng/mL mTPO for 4 days. (Left) Representative staining of megakaryocytes with anti-CD41 (green) and anti-vWF (red) antibodies was shown. (Right) Proplatelet forming megakaryocytes were counted. The data shows one of two independent experiments (n = 3 - 5 mice/group) with similar results. Significance was calculated using an unpaired Student's t-test. **, P < 0.01. (H) Lin-c-Kit+ cells from the BM of the Aurkaf/f mice were cultured with CD19+ B cells sorted from either the Aurkaf/f mice or the Aurkaf/f;Cd19Cre/+ mice in the presence of 200 ng/mL mTPO together with murine IL-17 for 4 days. Proplatelet-forming megakaryocytes were counted. The dot graph shows one of two independent experiments with similar results. Significance was calculated using an unpaired Student's t-test. * P < 0.05.
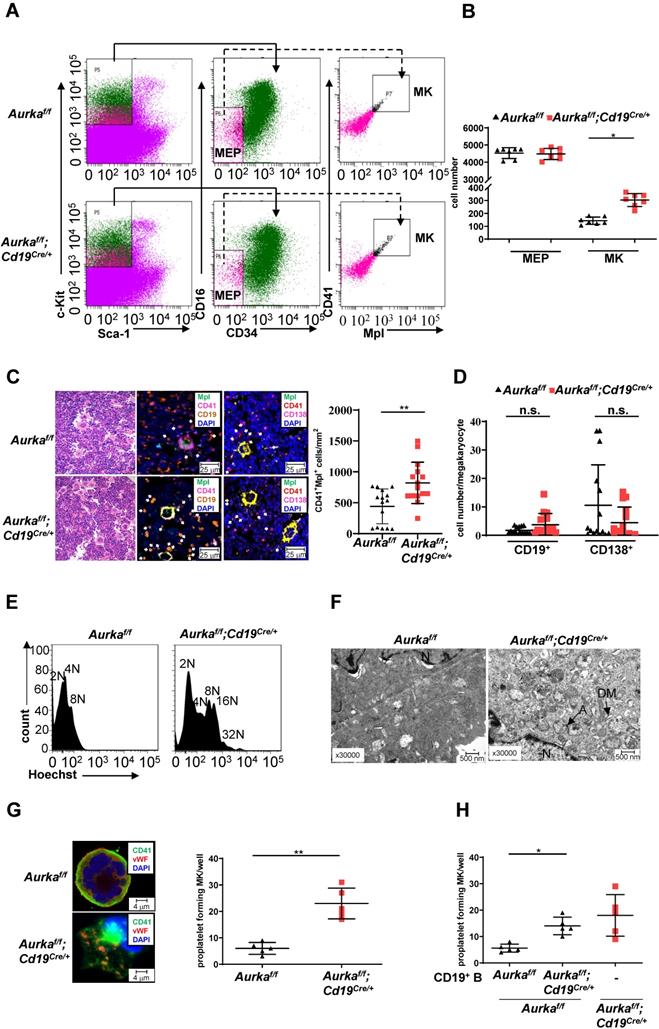
The above results indicated that Aurka loss in CD19+ B cells could influence the late stage of megakaryocyte differentiation. Therefore, we assessed proplatelet formation. As shown in Figure 5G, an increase in the number of proplatelet formations was observed in megakaryocytes from the Aurkaf/f;Cd19Cre/+ mice. To further investigate whether Aurka deficiency in CD19+ B cells promoted thrombopoiesis, we cocultured Lin-c-Kit+ hematopoietic progenitors from the Aurkaf/f mice with CD19+ B cells sorted from either the Aurkaf/f or Aurkaf/f;Cd19Cre/+ mice. We found that the number of proplatelet-forming megakaryocytes was obviously increased when Lin-c-Kit+ hematopoietic progenitors from the Aurkaf/f mice were cocultured with CD19+ B cells from the Aurkaf/f;Cd19Cre/+ mice (Figure 5H).
To further test whether the proliferative status of hematopoietic stem cells (HSCs) was impaired and HSCs tended toward a megakaryocyte bias in the BMs of the Aurkaf/f;Cd19Cre/+ mice, we performed a colony assay. Compared to that of the Aurkaf/f mice, the proliferative status of Lin-c-Kit+Sca-1+ cells, which enrich HSCs, was not affected in the Aurkaf/f;Cd19Cre/+ mice (Figure S2A). Compared with Lin-c-Kit+Sca-1+ cells from the Aurkaf/f mice, Lin-c-Kit+Sca-1+ cells from the Aurkaf/f;Cd19Cre/+ mice did not show an obvious bias toward megakaryocyte colonies (Figure S2B). To clarify whether the higher numbers of megakaryocytes in the BM of the Aurkaf/f;Cd19Cre/+ mice were associated with an increase in megakaryocytopoiesis in the spleens, we examined the population of megakaryocytes in spleens. The number of CD41+Mpl+ cells was increased in spleens (Figure S2C), although the spleen weights were slightly increased (Figure 3F).
Deletion of Aurka in CD19+ B cells induced TPO production
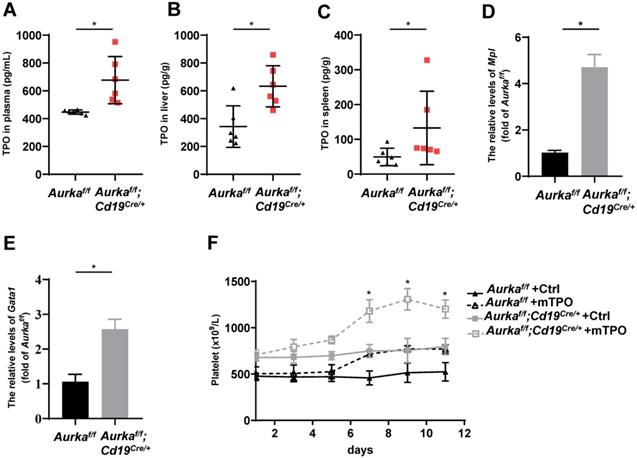
TPO has been identified as the most important regulator of megakaryocyte maturation and platelet production signaling via its receptor, c-Mpl [36]. We analyzed the levels of TPO in plasma and tissues. We found that the concentration of TPO was increased in the plasma of the Aurkaf/f;Cd19Cre/+ mice compared with the Aurkaf/f mice (Figure 6A). Unexpectedly, the concentration of TPO was increased in the livers and spleens of the Aurkaf/f;Cd19Cre/+ mice compared with those of the Aurkaf/f mice (Figures 6B and 6C). We next examined Mpl expression in sorted CD41+Mpl+ megakaryocytes and found that the mRNA levels of Mpl were markedly upregulated in the CD41+Mpl+ megakaryocytes sorted from the Aurkaf/f;Cd19Cre/+ mice (Figure 6D). In addition, the mRNA levels of Gata1, a transcription factor that is essential for proper growth and differentiation of megakaryocytes, were significantly increased in the Aurkaf/f;Cd19Cre/+ mice compared with the Aurkaf/f mice (Figure 6E). To further investigate whether the elevated platelets were the consequence of megakaryocyte maturation mediated by an increase in TPO production, we treated the Aurkaf/f;Cd19Cre/+ mice and the Aurkaf/f mice with either control diluent or mTPO. We found that upon mTPO treatment, the number of platelets was increased in the Aurkaf/f;Cd19Cre/+ mice compared with the Aurkaf/f mice (Figure 6F).
Aurka deficiency in CD19+ B cells induced TPO production. (A) The concentrations of TPO in the plasma were examined by ELISA. * P < 0.05. (B) Frozen livers were weighed, homogenized, and followed by sonication. After centrifugation, the supernatant was collected and subjected to ELISA to examine the concentrations of TPO. The concentrations of TPO in the liver were calculated following the formula: (concentration × sample volume × diluent factor)/weight. * P < 0.05. (C) Frozen spleen were weighed, homogenized, and followed by sonication. After centrifugation, the supernatant was collected and subjected to ELISA. The concentrations of TPO in the spleen were examined by ELISA, and calculated following the formula: (concentration × sample volume × diluent factor)/weight. * P < 0.05. (A-C) The dot graphs show one of two independent experiments (n = 6 mice/group) with similar results. P-value was calculated using an unpaired Student's t-test. (D) Real-time RT-PCR to quantify the Mpl mRNA levels in sorted CD41+Mpl+ megakaryocytes from the Aurkaf/f or Aurkaf/f;Cd19Cre/+ mice. *P < 0.05. (E) Real-time RT-PCR to quantify Gata1 mRNA levels in the sorted CD41+Mpl+ megakaryocytes from the Aurkaf/f or Aurkaf/f;Cd19Cre/+ mice. * P < 0.05. (D-E) The graphs show one of two independent experiments (n = 3 mice/group) with similar results. Significance was calculated using an unpaired Student's t-test. (F) The graph shows the total number of platelets in the peripheral blood of the indicated mice treated with either control diluent or mTPO. The data shows one of two independent experiments (n = 5 mice/group) with similar results. Significance was calculated using two way ANOVA followed by Tukey's multiple comparisons test. *, P < 0.05.
IL-6 was critical for TPO production
IL-6 promotes thrombopoiesis by mediating TPO mRNA levels [10]. To further investigate the mechanisms involved in regulating megakaryocyte differentiation in the Aurkaf/f;Cd19Cre/+ mice, we examined the concentration of IL-6, and we found that compared with that of the Aurkaf/f mice, the concentration of IL-6 was increased in the plasma harvested from the Aurkaf/f;Cd19Cre/+ mice (Figure 7A). Given that a relatively lower number of B cells was observed in the Aurkaf/f;Cd19Cre/+ mice and that IL-6 promotes hepatocyte TPO production, we assumed that Aurka loss in CD19+ B cells could contribute to IL-6 expression, which promotes hepatocyte TPO expression. To clarify the tissue origin of these cytokines present in the plasma, we first analyzed the population of CD19+ B cells expressing IL-6 in spleens and PB and found that the number of CD19+IL-6+ B cells was increased in the spleens and PB of the Aurkaf/f;Cd19Cre/+ mice compared with the Aurkaf/f mice (Figures 7B and S3A). Similarly, in the BM of the Aurkaf/f mice, IL-6-secreting B cells were barely detected, whereas CD19+IL-6+ B cells were close to megakaryocytes in the BM of the Aurkaf/f;Cd19Cre/+ mice (Figure 7C, left panel and Figure 7D).
IL-6-activated STAT3 was required for Tpo transcription. (A) The concentration of IL-6 in the plasma was examined by ELISA. The data shows one of two independent experiments (n = 5 - 6 mice/group) with similar results. **P < 0.01. (B) CD19+ B cells (3 × 10⁴) in the spleens of the Aurkaf/f mice or the Aurkaf/f;Cd19Cre/+ mice were analyzed. The dot graph shows the total number of IL-6-positive cells in these CD19+ B cells. The data shows one of two independent experiments (n = 5 mice/group) with similar results. *, P < 0.05. (C, left) Immunofluorescence for CD19 (red), IL-6 (green) and DAPI (blue) in the BM sections from the Aurkaf/f or Aurkaf/f;Cd19Cre/+ mice. Mk, megakaryocyte. (C, right) Immunofluorescence for CD19 (red), TPO (green) and DAPI (blue) in the BM sections from the Aurkaf/f or Aurkaf/f;Cd19Cre/+ mice. The data shows one of two independent experiments with similar results. (D) Dot graph of Figure 7C shows the number of CD19+IL-6+ B cells, or CD19+TPO+ B cells close to megakaryocytes in the BM sections from the Aurkaf/f mice (n = 3 mice/group, 5 slides/mouse) or the Aurkaf/f;Cd19Cre/+ mice (n = 3 mice/group, 5 slides/mouse). *, P < 0.05. (E) Aurkaf/f mice were treated with either control diluent or 1 µg IL-6. After which, hepatocytes were isolated and subjected to real-time RT-PCR to quantify the Tpo mRNA levels. The data shows one of two independent experiments (n = 5 mice/group) with similar results. *, P < 0.05. (A-E) P-values were obtained using a 2-sided, unpaired Student's t-test. (F) The expression of the indicated protein was examined in spleens from either the Aurkaf/f or Aurkaf/f;Cd19Cre/+ mice by Western blotting. (G) CD19+ B cells were sorted from either the Aurkaf/f or Aurkaf/f;Cd19Cre/+ mice. 5 × 10⁵/mL sorted CD19+ B cells were exposed to 10 mM C188-9. After 24 h, cells were harvested, fixed and subjected to FACS to examine the levels of p-STAT3. (F-G) The data shows one of two independent experiments. (H) CD19+ B cells were sorted from either the Aurkaf/f or Aurkaf/f;Cd19Cre/+ mice. 1 × 10⁶/mL sorted CD19+ B cells were exposed to 10 mM C188-9. After 24 h, cells were harvested, RNA was extracted and subjected to real-time RT-PCR to quantify the Tpo mRNA levels. Data shown is mean ± SD of one of two independent experiments (n = 3 mice/group) with similar results. Significance was calculated using an unpaired Student's t-test. *, P < 0.05. (I) The correlation of STAT3 and TPO was assessed by GEPIA. (J) CD19+ B cells were sorted from either the Aurkaf/f or Aurkaf/f;Cd19Cre/+ mice. After being crosslinked with formaldehyde, protein-DNA complexes were immunoprecipitated using an anti-STAT3 antibody. After which, DNA was extracted and subjected to PCR to measure the STAT3 binding sites on the TPO promoter. The PCR products were separated in a 2% agarose gel and visualized by ethidium bromide staining. bp, base pair. Data shows one of two independent experiments with similar results. (K) CD19+ B cells were sorted from either the Aurkaf/f or Aurkaf/f;Cd19Cre/+ mice. 1 × 10⁶/mL sorted CD19+ B cells were exposed to either 10 mM C188-9 and/or 100 ng/mL IL-6. After 24 h, cells were harvested, RNA was extracted and subjected to real-time RT-PCR to quantify the Tpo mRNA levels. Data shown is mean ± SD of one of two independent experiments (n = 3 mice/group) with similar results. Significance was calculated using an unpaired Student's t-test. *P < 0.05.
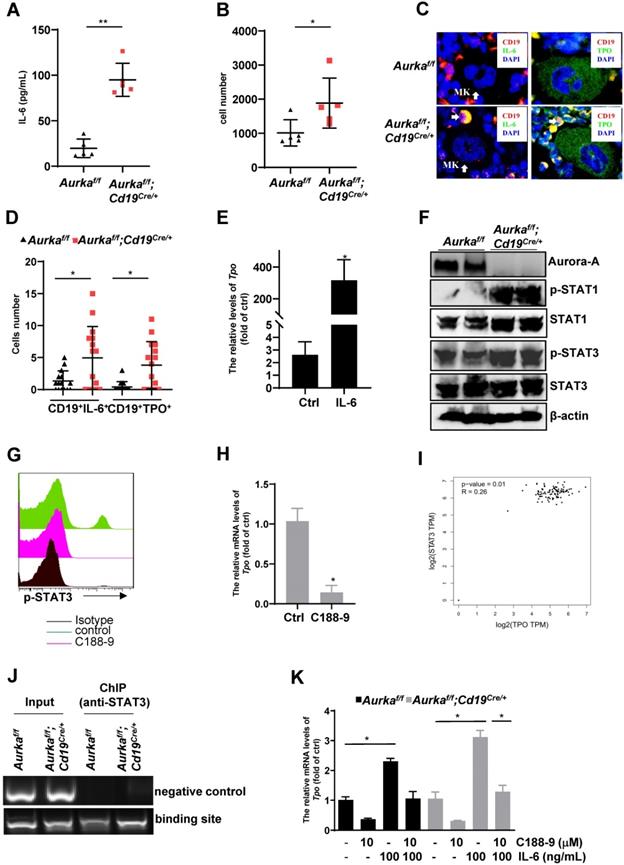
Unexpectedly, TPO-secreting B cells were found around megakaryocytes in the BM of the Aurkaf/f;Cd19Cre/+ mice compared with the Aurkaf/f mice (Figure 7C, right panel and Figure 7D). We next treated the Aurkaf/f mice with either control diluent or IL-6. As shown in Figure 7E, compared with those of the Aurkaf/f mice treated with control diluent, the mRNA levels of Tpo were dramatically increased in the hepatocytes sorted from the Aurkaf/f mice treated with IL-6. These observations suggested that Aurka deficiency in CD19+ B cells led to upregulation of IL-6, which was critical for hepatocyte TPO production. Additionally, Aurka loss could induce an increase in TPO expression in CD19+ B cells.
STAT3 activation was critical for TPO transcription in Aurka-deficient B cells
STAT3 is the main downstream effector molecule of IL-6 [37]. STAT3 plays an important role in Ashwell-Morell receptor-induced hepatic TPO transcription [14]. We therefore explored whether STAT3 was activated and required for TPO transcription. As we expected, the levels of the phosphorylated forms of STAT3 were upregulated in the spleen tissues of the Aurkaf/f;Cd19Cre/+ mice compared to those of the Aurkaf/f mice (Figure 7F). In addition, consistent with our unpublished data, the total amount of STAT1 was upregulated in the spleen tissues of the Aurkaf/f;Cd19Cre/+ mice compared to that of the Aurkaf/f mice (Figure 7F). To confirm the role of activated STAT3 in TPO expression, we treated CD19+ B cells sorted from the Aurkaf/f;Cd19Cre/+ mice with C188-9, a STAT3 inhibitor (Figure 7G). As shown in Figure 7H, the levels of Tpo mRNA were reduced in these cells. We also analyzed the correlation of STAT3 and TPO using the GEPIA web tool. Our data indicated that the expression of STAT3 was positively correlated with the expression of TPO (Figure 7I). To explore whether STAT3 directly mediated TPO transcription, we performed a ChIP assay and found that STAT3 bound to the TPO promoter (Figure 7J).
To further investigate whether STAT3-mediated TPO expression in Aurka-deficient B cells is an autocrine effect provoked by IL-6, we treated CD19+ B cells sorted from either the Aurkaf/f mice or Aurkaf/f;Cd19Cre/+ mice with 100 ng/mL IL-6 and/or 10 mM C188-9. IL-6 (100 ng/mL) induced an increase in the mRNA levels of Tpo in sorted CD19+ B cells, which was attenuated in the presence of C188-9 (Figure 7K). These observations indicated that STAT3-mediated TPO transcription could be due to the autocrine effect provoked by IL-6.
Aurka deficiency did not affect platelet clearance
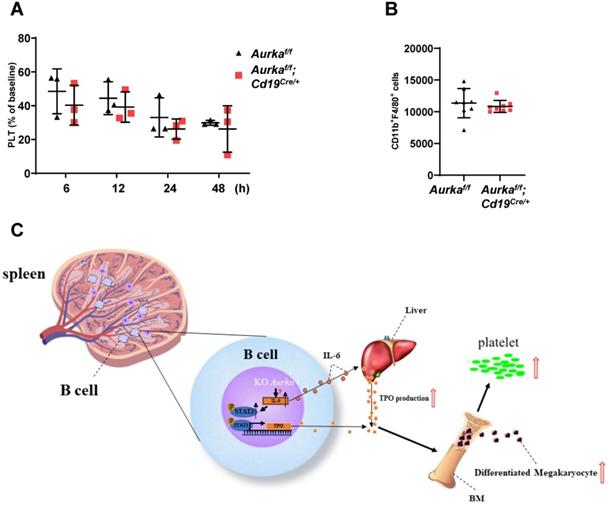
To investigate whether platelet clearance was impaired in the Aurkaf/f;Cd19Cre/+ mice, we injected calcein-labeled platelets isolated from the Aurkaf/f mice into the Aurkaf/f;Cd19Cre/+ mice. Platelet clearance was not impaired in either the Aurkaf/f;Cd19Cre/+ mice or the Aurkaf/f mice (Figure 8A). Previous studies have indicated that splenic macrophages are involved in mediating platelet clearance [24]. We therefore examined the population of macrophages and found that the number of splenic macrophages was identical in the Aurkaf/f;Cd19Cre/+ mice compared with the Aurkaf/f mice (Figure 8B).
Platelet clearance was not affected. (A) Isolated platelets from either the Aurkaf/f or Aurkaf/f;Cd19Cre/+ mice were incubated with calcein and transfused into the Aurkaf/f mice. The percentage of calcein-positive platelets remaining in circulation was assessed at the indicated time points by FACS; Data shown is mean ± SD of one of two independent experiments (n = 3 - 5 mice/group) with similar results. Baseline was defined as the percentage of calcein-positive platelets within 1 min after platelet transfusion. (B) The population of macrophages in the CD45+ cells (1 × 10⁵) of the spleen was examined by FACS. The graph shows the mean ± SD of one of two independent experiments (n = 8 mice/group) with similar results. (C) Schematic representation of Aurka deficiency-mediated Tpo transcription and platelet production in the Aurkaf/f;Cd19Cre/+ mice. In CD19+ B cells, silencing Aurka led to an increase in IL-6 production, inducing STAT3 activation, which contributed to Tpo transcription and production; additionally, elevated IL-6 enhanced TPO production in the liver, which in turn promoted megakaryocyte differentiation, leading to an increase in platelet production.
Discussion
Aurora-A, one of the members of the Aurora family, plays an essential role in mitosis. Its overexpression has also been implicated in the pathogenesis of various hematologic neoplasms, including highly aggressive B-cell non-Hodgkin's lymphomas [38, 39]. Suppression of Aurora-A resulted in defects in mitotic spindle assembly [40]. In our study, we showed that Aurka deficiency in CD19+ B cells significantly reduced the number of total B cells and subsets of B cells, including pre-B cells, IMB cells and FOB cells, in the BM or spleen (Figures 2-3). The number of memory B cells and plasma cells was also decreased in the Aurkaf/f;Cd19Cre/+ mice compared with the Aurkaf/f mice (Figures 2F and 3E). Additionally, our unpublished data indicated that antibody maturation and class switching were abrogated in the Aurkaf/f;Cd19Cre/+ mice compared with the Aurkaf/f mice. These observations indicated that loss of Aurka in CD19+ B cells impaired the development and homeostasis of B cells, which could be the consequence of defects in mitotic spindle assembly.
A growing number of studies have shown that silencing Aurora-A in hematopoietic cells or inhibition of Aurora-A activity by its specific inhibitors induced the differentiation of megakaryocytes, in contrast to the survival defects of other hematopoietic lineages [1, 5], indicating that Aurora-A is required for adult hematopoiesis rather than the polyploidization and differentiation of megakaryocytes [1]. In this study, an increase in the number of platelets and RP was also observed in the Aurkaf/f;Cd19Cre/+ mice, without influencing the mean volume of platelets or platelet function in vivo, compared with the Aurkaf/f mice (Figures 4C-4F). Interestingly, the cellularity was almost identical in the Aurkaf/f;Cd19Cre/+ mice and the Aurkaf/f mice (Figure 2G). However, the population of CD41+Mpl+ megakaryocytes, but not Lin-c-Kit+Sca1-CD34-CD16- cells, which enrich BEMPs, was significantly elevated in the BM of the Aurkaf/f;Cd19Cre/+ mice compared with the Aurkaf/f mice (Figures 5A-5C). Additionally, no impaired hematopoiesis or obvious bias toward megakaryocyte colonies was observed in the Aurkaf/f;Cd19Cre/+ mice (Figures S2A and S2B), suggesting that deletion of Aurka in CD19+ B cells contributed to elevated platelet numbers by indirectly influencing the late stage of megakaryocyte differentiation. Additionally, IL-6 plays an important role in mediating thrombopoiesis. The presence of STAT3 inhibitors not only blocked MPO pathway but also IL-6 pathway. We therefore, cannot rule out the possibility that elevated IL-6 contributed to megakaryocytopoiesis. Interestingly, the level of IL-6 was obviously higher in the plasma of Aurkaf/f;Cd19Cre/+ mice as compared with that of Aurkaf/f mice (Figure 7A). Whereas, in the spleens, the number of IL-6 producing B cells was modestly increased in Aurkaf/f;Cd19Cre/+ mice as compared with Aurkaf/f mice (Figures 7B and S3A), which implicated that the non-B cells expressing IL-6, such as macrophages could be involved in IL-6 production. To address the question, we examined the number of IL-6 producing macrophages and found that the population of IL-6 producing macrophages was higher in BMs and spleens of Aurkaf/f;Cd19Cre/+ mice as compared with Aurkaf/f mice (Figures S3A and S3B). The mechanisms by which the number of macrophages expressing IL-6 was induced needed to be further investigated.
In this study, we found that deletion of Aurka in CD19+ B cells contributed to megakaryocytopoiesis in the spleen (Figure S2C). Moreover, ploidy assays (Figure 5E) and the ultrastructure of megakaryocytes assessed by transmission electron microscopy analysis (Figure 5F) revealed that loss of Aurka in CD19+ B cells promoted megakaryocyte differentiation. BEMPs are indeed characterized as Lin-c-Kit+Sca1-CD34-CD16- cells [41, 42]. A study demonstrated that in vitro, Lin-cKit+Sca1-IL7Rα-FcγRII/IIIloCD150+ cells generated an increase in the proportion of megakaryocytes and erythroid cells in the response to TPO and EPO, respectively, although these cells proliferated less than their bipotential erythroid-megakaryocyte progenitors (BEMPs) counterparts [34], indicating that the cultured Lin-cKit+Sca1-IL7Rα-FcγRII/IIIloCD150+ cells could be appropriate to described BEMPs among freshly isolated LSK cells.
A previous study demonstrated that megakaryocytes are an important component of the niche for long-lived plasma cells in the BM [35]. Unexpectedly, the number of CD19+ B cells, but not plasma cells close to megakaryocytes, was higher in the BM of the Aurkaf/f;Cd19Cre/+ mice (Figure 5D), indicating that these cells could be involved in mediating megakaryocyte differentiation. Notably, in contrast to the Aurkaf/f mice in which IL-6-secreting CD19+ B cells or TPO-secreting CD19+ B cells were barely detected around megakaryocytes, the number of IL-6-secreting CD19+ B cells or TPO-secreting CD19+ B cells relatively close to megakaryocytes was higher in the BM of the Aurkaf/f;Cd19Cre/+ mice (Figures 7C and 7D). In combination with the relatively higher levels of TPO and IL-6 in the plasma of the Aurkaf/f;Cd19Cre/+ mice (Figures 6A and 7A), these data indicated that TPO and IL-6 could be involved in mediating thrombopoiesis in the Aurkaf/f;Cd19Cre/+ mice(Figure 8C).
Consistent with previous studies, IL-6 induced TPO production [10] and directly increased the platelet count by mediating megakaryocyte maturation in vivo [43]. Our results also demonstrated that IL-6 was responsible for the increased Tpo mRNA levels in hepatocytes (Figure 7E). Additionally, IL-6 induced upregulation of Tpo mRNA levels in CD19+ B cells, although the elevated levels were lower than those in hepatocytes, but this change was attenuated by the STAT3 inhibitor C188-9 (Figures 7H and 7K), suggesting that Aurka loss in CD19+ B cells promoted Tpo transcription via STAT3 activation, at least partially.
As a transcription factor, STAT3 plays a pivotal role in many cellular processes, including oncogenesis, tumor growth and stemness, by positively or negatively mediating numerous target genes. In HepG2 cells, suppression of the Jak2/STAT3 signaling pathway reduced the levels of Tpo mRNA mediated by AMR [10]. In this study, we found that there were STAT3 binding sites on the TPO promoter (Figure 7J). STAT3 is a key mediator of the IL-6 signaling pathway. Together with the above data that higher levels of IL-6 were observed in Aurkaf/f;Cd19Cre/+ mice, STAT3-mediated TPO expression in Aurka-deficient B cells seemed to be an autocrine effect provoked by IL-6.
Nuclear Aurora-A functions as a transcription factor by interacting with heterogeneous nuclear ribonucleoprotein K (hnRNP K) [44]. We assumed that Aurora-A could directly suppress IL-6 mRNA transcription. Unfortunately, the transcription levels of IL-6 were almost identical in the 293T cells transfected with Aurora-A plasmid DNA and the 293T cells transfected with control plasmid DNA (data not shown).
Phosphorylation of STAT1 at Thr749 stabilized IL-6 mRNA and induced an increase in the production of IL-6 [45]. We therefore assessed the levels of activated STAT1 in CD19+ B cells sorted from either the Aurkaf/f mice or the Aurkaf/f;Cd19Cre/+ mice. We found that the levels of STAT1 were also increased in the Aurkaf/f;Cd19Cre/+ B cells (Figure 7F), although we were unable to examine p-STAT1 (Thr749) expression due to the lack of a commercial anti-p-STAT1 (Thr749), which was consistent with our unpublished data showing that inhibition of Aurora-A activity or deletion of Aurora-A contributed to epigenetic activation of STAT1. These observations indicated that deletion of Aurora-A in CD19+ B cells could promote STAT1 phosphorylation at Thr749, leading to an increase in the levels of IL-6 mRNA, at least partially.
Overall, the current study demonstrated that in CD19+ B cells, silencing Aurka led to an increase in IL-6 production, promoting STAT3 activation, which in turn contributed to TPO transcription, promoting megakaryocyte differentiation and leading to an increase in platelet number.
Abbreviations
Aurora-A: Aurora kinase A; PB: peripheral blood; TPO: thrombopoietin; BM: bone marrow; STAT3: signal transducer and activator of transcription-3; DSS: dextran sodium sulfate; WT: wild-type; GAS: gamma activated sequence; AMR: Ashwell-Morell receptor; SCF: stem cell factor; mTPO: murine TPO; RP: Reticulated platelets; PRP: platelet rich plasma; DAPI: 4', 6-diamidino-2-phenylindole; vWF: von Willebrand factor; CFU: Colony forming unit; MK: megakaryocyte; ELISA: Enzyme-linked immunosorbent assay; RCB: recirculating B cells; IMB: immature B cells; PPB: pre/pro B cells; MB: mature B; FOB: follicular B; MZB: marginal zone B; WBCs: white blood cells; RBCs: red blood cells; DMs: demarcation membranes; HSCs: hematopoietic stem cells; BEMPs: bipotential erythroid-megakaryocyte progenitors.
Supplementary Material
Supplementary figures.
Acknowledgements
Financial Support
This work was supported by grants from the Foundation for Key Program of Universities of Jiangsu Province (No. 17KJA320010) and the Jiangsu Shuangchuang Program and Jiangsu Distinguished Professorship Program to J.Y.
Author Contributions
Conception and design: J. Yang; Development of methodology: J. Yang; Acquisition of data (provided animals, acquired and managed patients, provided facilities, etc.): X. Chen, C. Wang, N. Sun, S. Pan, R. Li, X. Li, J. Zhao, J. Han, J. Qiao, H. Qiu, H. Wang, J. Yang and T. Ikezoe; Analysis and interpretation of data (e.g., statistical analysis, biostatistics, computational analysis): J. Qiao, H. Wang, J. Yang and T. Ikezoe; Writing, review, and/or revision of the manuscript: X. Chen, H. Wang, J. Yang and T. Ikezoe; Administrative, technical, or material support (i.e., reporting or organizing data, constructing databases): X. Chen, C. Wang, N. Sun, S. Pan, R. Li, X. Li, J, Zhao, H. Tong, Y. Tang, J. Han, H. Wang and J. Yang; Study supervision: J. Yang.
Competing Interests
The authors have declared that no competing interest exists.
References
1. Goldenson B, Kirsammer G, Stankiewicz MJ, Wen QJ, Crispino JD. Aurora kinase A is required for hematopoiesis but is dispensable for murine megakaryocyte endomitosis and differentiation. Blood. 2015;125:2141-50
2. Yang J, Ikezoe T, Nishioka C, Tasaka T, Taniguchi A, Kuwayama Y. et al. AZD1152, a novel and selective aurora B kinase inhibitor, induces growth arrest, apoptosis, and sensitization for tubulin depolymerizing agent or topoisomerase II inhibitor in human acute leukemia cells in vitro and in vivo. Blood. 2007;110:2034-40
3. Yang J, Ikezoe T, Nishioka C, Nobumoto A, Udaka K, Yokoyama A. CD34(+)/CD38(-) acute myelogenous leukemia cells aberrantly express Aurora kinase A. International journal of cancer. 2013;133:2706-19
4. Sasai K, Parant JM, Brandt ME, Carter J, Adams HP, Stass SA. et al. Targeted disruption of Aurora A causes abnormal mitotic spindle assembly, chromosome misalignment and embryonic lethality. Oncogene. 2008;27:4122-7
5. Wen Q, Goldenson B, Silver SJ, Schenone M, Dancik V, Huang Z. et al. Identification of regulators of polyploidization presents therapeutic targets for treatment of AMKL. Cell. 2012;150:575-89
6. Kaushansky K. The molecular mechanisms that control thrombopoiesis. The Journal of clinical investigation. 2005;115:3339-47
7. Kuter DJ. Thrombopoietin and thrombopoietin mimetics in the treatment of thrombocytopenia. Annual review of medicine. 2009;60:193-206
8. Sungaran R, Markovic B, Chong BH. Localization and regulation of thrombopoietin mRNa expression in human kidney, liver, bone marrow, and spleen using in situ hybridization. Blood. 1997;89:101-7
9. Senchenkova EY, Komoto S, Russell J, Almeida-Paula LD, Yan LS, Zhang S. et al. Interleukin-6 mediates the platelet abnormalities and thrombogenesis associated with experimental colitis. The American journal of pathology. 2013;183:173-81
10. Kaser A, Brandacher G, Steurer W, Kaser S, Offner FA, Zoller H. et al. Interleukin-6 stimulates thrombopoiesis through thrombopoietin: role in inflammatory thrombocytosis. Blood. 2001;98:2720-5
11. Wolber EM, Fandrey J, Frackowski U, Jelkmann W. Hepatic thrombopoietin mRNA is increased in acute inflammation. Thrombosis and haemostasis. 2001;86:1421-4
12. Carpenter RL, Lo HW. STAT3 Target Genes Relevant to Human Cancers. Cancers. 2014;6:897-925
13. Darnell JE Jr, Kerr IM, Stark GR. Jak-STAT pathways and transcriptional activation in response to IFNs and other extracellular signaling proteins. Science. 1994;264:1415-21
14. Grozovsky R, Begonja AJ, Liu K, Visner G, Hartwig JH, Falet H. et al. The Ashwell-Morell receptor regulates hepatic thrombopoietin production via JAK2-STAT3 signaling. Nature medicine. 2015;21:47-54
15. Han J, Jiang Z, Wang C, Chen X, Li R, Sun N. et al. Inhibition of Aurora-A Promotes CD8(+) T-Cell Infiltration by Mediating IL10 Production in Cancer Cells. Molecular cancer research: MCR. 2020;18:1589-602
16. Xie X, Shi Q, Wu P, Zhang X, Kambara H, Su J. et al. Single-cell transcriptome profiling reveals neutrophil heterogeneity in homeostasis and infection. Nature immunology. 2020;21:1119-33
17. Brickshawana A, Shapiro VS, Kita H, Pease LR. Lineage(-)Sca1+c-Kit(-)CD25+ cells are IL-33-responsive type 2 innate cells in the mouse bone marrow. J Immunol. 2011;187:5795-804
18. Bettigole SE, Lis R, Adoro S, Lee AH, Spencer LA, Weller PF. et al. The transcription factor XBP1 is selectively required for eosinophil differentiation. Nature immunology. 2015;16:829-37
19. Mazharian A, Watson SP, Severin S. Critical role for ERK1/2 in bone marrow and fetal liver-derived primary megakaryocyte differentiation, motility, and proplatelet formation. Experimental hematology. 2009;37:1238-49 e5
20. Kozuma Y, Ninomiya H, Murata S, Kono T, Mukai HY, Kojima H. The pro-apoptotic BH3-only protein Bim regulates cell cycle progression of hematopoietic progenitors during megakaryopoiesis. Journal of thrombosis and haemostasis: JTH. 2010;8:1088-97
21. Hu H, Gehart H, Artegiani B, C LO-I, Dekkers F, Basak O. et al. Long-Term Expansion of Functional Mouse and Human Hepatocytes as 3D Organoids. Cell. 2018;175:1591-606 e19
22. Li WC, Ralphs KL, Tosh D. Isolation and culture of adult mouse hepatocytes. Methods Mol Biol. 2010;633:185-96
23. Broutier L, Andersson-Rolf A, Hindley CJ, Boj SF, Clevers H, Koo BK. et al. Culture and establishment of self-renewing human and mouse adult liver and pancreas 3D organoids and their genetic manipulation. Nature protocols. 2016;11:1724-43
24. Chen M, Yan R, Zhou K, Li X, Zhang Y, Liu C. et al. Akt-mediated platelet apoptosis and its therapeutic implications in immune thrombocytopenia. Proceedings of the National Academy of Sciences of the United States of America. 2018;115:E10682-E91
25. Hartley PS, Sheward J, Scholefield E, French K, Horn JM, Holmes MC. et al. Timed feeding of mice modulates light-entrained circadian rhythms of reticulated platelet abundance and plasma thrombopoietin and affects gene expression in megakaryocytes. British journal of haematology. 2009;146:185-92
26. Qiao J, Wu X, Luo Q, Wei G, Xu M, Wu Y. et al. NLRP3 regulates platelet integrin alphaIIbbeta3 outside-in signaling, hemostasis and arterial thrombosis. Haematologica. 2018;103:1568-76
27. Lordier L, Bluteau D, Jalil A, Legrand C, Pan J, Rameau P. et al. RUNX1-induced silencing of non-muscle myosin heavy chain IIB contributes to megakaryocyte polyploidization. Nature communications. 2012;3:717
28. Xu Y, Wang S, Shen M, Zhang Z, Chen S, Chen F. et al. hGH promotes megakaryocyte differentiation and exerts a complementary effect with c-Mpl ligands on thrombopoiesis. Blood. 2014;123:2250-60
29. Sparger KA, Ramsey H, Lorenz V, Liu ZJ, Feldman HA, Li N. et al. Developmental differences between newborn and adult mice in response to romiplostim. Platelets. 2018;29:365-72
30. Zhang B, Gu X, Han X, Gao Q, Liu J, Guo T. et al. Crosstalk between DNA methylation and histone acetylation triggers GDNF high transcription in glioblastoma cells. Clinical epigenetics. 2020;12:47
31. Del Reino P, Alsina-Beauchamp D, Escos A, Cerezo-Guisado MI, Risco A, Aparicio N. et al. Pro-oncogenic role of alternative p38 mitogen-activated protein kinases p38gamma and p38delta, linking inflammation and cancer in colitis-associated colon cancer. Cancer research. 2014;74:6150-60
32. Lu J, Wang H, Zhang R, Wan Z, Gao H, Cai J. et al. Effects of Photoperiod on Acetaminophen-Induced Hepatotoxicity in Mice. Digestive diseases and sciences. 2020;65:178-88
33. Kohanbash G, Carrera DA, Shrivastav S, Ahn BJ, Jahan N, Mazor T. et al. Isocitrate dehydrogenase mutations suppress STAT1 and CD8+ T cell accumulation in gliomas. The Journal of clinical investigation. 2017;127:1425-37
34. Ng AP, Kauppi M, Metcalf D, Di Rago L, Hyland CD, Alexander WS. Characterization of thrombopoietin (TPO)-responsive progenitor cells in adult mouse bone marrow with in vivo megakaryocyte and erythroid potential. Proceedings of the National Academy of Sciences of the United States of America. 2012;109:2364-9
35. Winter O, Moser K, Mohr E, Zotos D, Kaminski H, Szyska M. et al. Megakaryocytes constitute a functional component of a plasma cell niche in the bone marrow. Blood. 2010;116:1867-75
36. Kuter DJ. New thrombopoietic growth factors. Blood. 2007;109:4607-16
37. Zhang HY, Zhang Q, Zhang X, Yu C, Huo X, Cheng E. et al. Cancer-related inflammation and Barrett's carcinogenesis: interleukin-6 and STAT3 mediate apoptotic resistance in transformed Barrett's cells. American journal of physiology Gastrointestinal and liver physiology. 2011;300:G454-60
38. Yakushijin Y, Hamada M, Yasukawa M. The expression of the aurora-A gene and its significance with tumorgenesis in non-Hodgkin's lymphoma. Leukemia & lymphoma. 2004;45:1741-6
39. Kanagal-Shamanna R, Lehman NL, O'Donnell JP, Lim MS, Schultz DS, Chitale DA. et al. Differential expression of aurora-A kinase in T-cell lymphomas. Modern pathology: an official journal of the United States and Canadian Academy of Pathology, Inc. 2013;26:640-7
40. Carpinelli P, Moll J. Aurora kinase inhibitors: identification and preclinical validation of their biomarkers. Expert Opin Ther Targets. 2008;12:69-80
41. Metcalf D, Ng AP, Loughran SJ, Phipson B, Smyth GK, Di Rago L. et al. Murine hematopoietic blast colony-forming cells and their progeny have distinctive membrane marker profiles. Proceedings of the National Academy of Sciences of the United States of America. 2009;106:19102-7
42. Akashi K, Traver D, Miyamoto T, Weissman IL. A clonogenic common myeloid progenitor that gives rise to all myeloid lineages. Nature. 2000;404:193-7
43. Burstein SA. Effects of interleukin 6 on megakaryocytes and on canine platelet function. Stem Cells. 1994;12:386-93
44. Zheng F, Yue C, Li G, He B, Cheng W, Wang X. et al. Nuclear AURKA acquires kinase-independent transactivating function to enhance breast cancer stem cell phenotype. Nature communications. 2016;7:10180
45. Metwally H, Tanaka T, Li S, Parajuli G, Kang S, Hanieh H. et al. Noncanonical STAT1 phosphorylation expands its transcriptional activity into promoting LPS-induced IL-6 and IL-12p40 production. Science signaling. 2020 13
Author contact
![]() Corresponding authors: Hui Wang, Email: hui.wangedu.cn; Jing Yang, Email: jingyangedu.cn; Jiangsu Province Key Laboratory of Immunity and Metabolism, Department of Pathogenic Biology and Immunology, Xuzhou Medical University, 209 Tongshan Road, Xuzhou, 221004, Jiangsu, China.
Corresponding authors: Hui Wang, Email: hui.wangedu.cn; Jing Yang, Email: jingyangedu.cn; Jiangsu Province Key Laboratory of Immunity and Metabolism, Department of Pathogenic Biology and Immunology, Xuzhou Medical University, 209 Tongshan Road, Xuzhou, 221004, Jiangsu, China.