Impact Factor
- Issue 14; 2026
- Issue 13; 2026
- Issue 12; 2026
- Issue 11; 2026
- Issue 10; 2026
- Volume 16; 2026
- Advance Articles
- Past Issues
- Cover Images
- Cover Suggestion
- Index & Coverage
- Special Issues
Introduction
Methods
Results and Discussion
Limitations
Conclusion
Abbreviations
Supplementary Material
Acknowledgements
References
International Journal of Biological Sciences
International Journal of Medical Sciences
 Global reach, higher impact

Theranostics 2021; 11(18):8874-8893. doi:10.7150/thno.59759 This issue Cite
Research Paper
Macrophage targeted theranostic strategy for accurate detection and rapid stabilization of the inflamed high-risk plaque
Joon Woo Song1#, Hyeong Soo Nam2#, Jae Won Ahn3#, Hyun-Sang Park2, Dong Oh Kang1, Hyun Jung Kim1, Yeon Hoon Kim2, Jeongmoo Han2, Jah Yeon Choi1, Seung-Yul Lee1, Sunwon Kim1, Wang-Yuhl Oh2, Hongki Yoo2 ![]() , Kyeongsoon Park3
, Kyeongsoon Park3 ![]() , Jin Won Kim1
, Jin Won Kim1 ![]()
1. Multimodal Imaging and Theranostic Lab., Cardiovascular Center, Korea University Guro Hospital, Seoul, South Korea.
2. Department of Mechanical Engineering, Korea Advanced Institute of Science and Technology, Daejeon, South Korea.
3. Department of Systems Biotechnology, Chung-Ang University, Anseong, South Korea.
#These authors contributed equally to this work.
Received 2021-2-24; Accepted 2021-7-21; Published 2021-8-18
Abstract

Rationale: Inflammation plays a pivotal role in the pathogenesis of the acute coronary syndrome. Detecting plaques with high inflammatory activity and specifically treating those lesions can be crucial to prevent life-threatening cardiovascular events.
Methods: Here, we developed a macrophage mannose receptor (MMR)-targeted theranostic nanodrug (mannose-polyethylene glycol-glycol chitosan-deoxycholic acid-cyanine 7-lobeglitazone; MMR-Lobe-Cy) designed to identify inflammatory activity as well as to deliver peroxisome proliferator-activated gamma (PPARγ) agonist, lobeglitazone, specifically to high-risk plaques based on the high mannose receptor specificity. The MMR-Lobe-Cy was intravenously injected into balloon-injured atheromatous rabbits and serial in vivo optical coherence tomography (OCT)-near-infrared fluorescence (NIRF) structural-molecular imaging was performed.
Results: One week after MMR-Lobe-Cy administration, the inflammatory NIRF signals in the plaques notably decreased compared to the baseline whereas the signals in saline controls even increased over time. In accordance with in vivo imaging findings, ex vivo NIRF signals on fluorescence reflectance imaging (FRI) and plaque inflammation by immunostainings significantly decreased compared to oral lobeglitazone group or saline controls. The anti-inflammatory effect of MMR-Lobe-Cy was mediated by inhibition of TLR4/NF-κB pathway. Furthermore, acute resolution of inflammation altered the inflamed plaque into a stable phenotype with less macrophages and collagen-rich matrix.
Conclusion: Macrophage targeted PPARγ activator labeled with NIRF rapidly stabilized the inflamed plaques in coronary sized artery, which could be quantitatively assessed using intravascular OCT-NIRF imaging. This novel theranostic approach provides a promising theranostic strategy for high-risk coronary plaques.
Keywords: atherosclerosis, targeted theranostics, drug delivery, PPARγ, OCT-NIRF
Introduction
Inflammation promotes the rupture of fibrous cap within an atherosclerotic plaque and precipitates a fatal acute myocardial infarction [1]. While statin is well-known to provide clinical benefits in numerous trials including optical coherence tomography (OCT) [2, 3], intravascular ultrasound [4, 5], and PET-CT [6], data from clinical studies regarding stabilizing effects of statin on the high-risk plaques in acute phase have been still inconclusive [7-9]. Nonetheless, based on the growing evidences supporting a key role of inflammation in acute coronary events [10-13], acutely administered anti-inflammatory therapy seems to be beneficial by rapidly stabilizing the atheroma.
Peroxisome proliferator-activated receptor gamma (PPARγ) agonist is known to have pleiotropic anti-inflammatory and anti-atherosclerotic efficacy [14]. However, as a higher dose of PPARγ agonist to enhance sufficient therapeutic effects on the plaque is associated with systemic adverse effects [14], targeted drug delivery is emerging as a promising strategy to increase the local drug concentration at the lesions and to avoid undesirable systemic effects [15-21]. Our group previously developed a MMR targeted PPARγ agonist, lobeglitazone, delivery system (MMR-Lobe). While MMR-Lobe effectively reduced plaque burden and inflammation via activation of cholesterol efflux in macrophage foam cells [22], a long-term administration of MMR-Lobe should be required to fully enhance the anti-atherosclerotic effects on the murine atheroma. Until now, current treatments are ineffective to sufficiently stabilize the inflamed plaque in acute phase of coronary artery disease. Given the intravenous route of MMR-Lobe administration, inevitable multiple injection requirement is a critical hurdle for clinical application. Furthermore, the efficacy proved only in murine model limited the potential for translational application in the coronary plaque and an injectable form of the targeted strategy needs to be simultaneously applicable for both therapy and diagnosis.
To address these unmet needs, here, we developed a novel macrophage-targeted NIRF-emitting PPARγ activator, which integrated both diagnostic and therapeutic abilities in one agent, and applied this theranostic agent in rabbit models for both imaging and treatment of coronary-sized inflamed plaques, particularly in acute settings. We scaled up the MMR binding drug carrier, labeled it with near-infrared fluorescence dye (Cy7), and then incorporated PPARγ agonist, lobeglitazone, into it (MMR-Lobe-Cy). Combining MMR-Lobe-Cy with the OCT-NIRF structural-molecular imaging, which has the ability to simultaneously detect the inflammatory activity and plaque structure in coronary arteries [23-27], allows us to quantitatively estimate the specific delivery of loaded PPARγ agonist to plaque macrophages and serially assess dynamic changes of plaque inflammatory activity. We evaluated whether this novel strategy of OCT-NIRF imaging with MMR-Lobe-Cy could accurately localize inflamed high-risk atheroma and rapidly suppress the inflammation in coronary-sized atheroma. Additionally, we provided the mechanistic evidence for our strategy and explored whether the anti-inflammatory activity following a short-term treatment of MMR-Lobe-Cy could alter the plaque characteristics with respect to transition of atheroma composition into a more stable phenotype.
Methods
Materials
Maleimide-polyethylene glycol 2000-succinimidyl carboxymethyl ester (MAL-PEG-NHS) was obtained from JenKem Technology (Plano, TX, USA). Glycol chitosan (GC), deoxycholic acid (DOCA), mannosamine hydrochloride (MAN), trimethylamine (TEA), dimethylformamide (DMF), lipopolysaccharide (LPS), mannan, dimethyl sulfoxide (DMSO), 1-ethyl-3-(3-dimethylaminopropyl)-carbodiimide hydrochloride (EDC), N-hydroxysuccinimide (NHS), methanol (MeOH), ethanol (EtOH), DMSO-d6, deuterium oxide (D2O), chloroform-d, and low-density lipoprotein (LDL) were purchased from Sigma-Aldrich (St. Louis, MO, USA). Cy7-NHS ester was ordered from Lumiprobe Corporation (Hunt Valley, MD, USA). Lobeglitazone (CDK-501) was obtained from Chong Kun Dang Pharmaceutical Corp. (Seoul, South Korea) and dialysis membranes (molecular weight cut-off (MWCO): 1, 6-8, and 12-14 kDa) were purchased from Spectrum Laboratories, Inc. (Rancho Dominguez, CA, USA).
Synthesis and characterizations of MMR-Lobe-Cy
GC was dissolved in the co-solvent of deionized water:MeOH (1:2, v/v) and reacted with pre-activated DOCA for 12 h. Then, the pre-activated MAN-PEG-NAC in the presence of EDC and NHS in MeOH was added to the solution and reacted for 12 h to fabricate the MAN-PEG-GC-DOCA (termed as MMR carrier). The mixture was then dialyzed against deionized water (DW) containing 30% EtOH for 2 days and DW for additional 2 days using a dialysis membrane (MWCO: 12-14 kDa), and then lyophilized to yield the MMR carrier. The synthesis of the MMR carrier was analyzed with a 1H-nuclear magnetic resonance (NMR) spectrometer (600 MHz NMR; Varian, Palo Alto, CA, USA). To synthesize a targetable imaging probe, MMR-Cy, the MMR carrier dissolved in the co-solvent of DW:MeOH (1:2, v/v) was reacted with Cy7-NHS ester under darkness for 24 h. The resulting solution was purified by dialysis in the same manner described above and freeze-dried to obtain MMR-Cy. The targeted imaging agents have been exploited to identify high-risk plaques in vivo [23, 28]. Next, a theranostic nanodrug, MMR-Lobe-Cy, was fabricated as follows: MMR-Cy and lobeglitazone were completely solubilized in 200 mL of the co-solvent of DW:MeOH (1:3, v/v) for 3 h, dialyzed against DW using a dialysis membrane (MWCO: 6-8 kDa) for 2 days, and lyophilized to yield MMR-Lobe-Cy. The amount of Cy7 in MMR-Cy or MMR-Lobe-Cy was analyzed by measuring the absorbance at 760 nm after MMR-Lobe-Cy (1 mg) or MMR-Cy (1 mg) was clearly dissolved in DMSO (1 mL), respectively. The drug loading content of lobeglitazone in MMR-Lobe-Cy was determined by high-performance liquid chromatography (HPLC) analysis. For particle size analysis, MMR-Lobe-Cy was dispersed in DW using probe-type sonicator and its particle sizes were then analyzed using a Zetasizer 3000 instrument (Malvern Instruments, Malvern, UK). The morphology of MMR-Lobe-Cy was observed using an energy filtering transmission electron microscope (EF-TEM; LEO 912AB OMEGA, Carl Zeiss, Oberkochem, Germany). In vitro drug release study was performed using MMR-Lobe-Cy in dialysis membrane (MWCO: 6-9 kDa) immersed in fresh PBS (pH 7.4), and the amount of lobeglitazone released from MMR-Lobe-Cy was measured by HPLC at predetermined time points. The stability of MMR-Lobe-Cy was determined by measuring the hydrodynamic diameters of MMR-Lobe-Cy in PBS and 10% heat-inactivated fetal bovine serum (FBS)-containing Dulbecco's Modified Eagle Medium (DMEM) for 6 days. The detailed experimental methods for the synthesis and characterizations are provided in the supplementary information.
Preparation of macrophage foam cells and quantification of CD206 expression
Macrophages (RAW264.7 cell; Korean Cell Line Bank, Seoul, South Korea) were incubated in RPMI 1640 medium (Welgene, Gyeongsan, South Korea) supplemented with10% FBS, 100 U/mL penicillin, and 100 μg/mL streptomycin at 37 °C in a humidified 5% CO2 atmosphere. Foam cells were established by treating macrophages with LPS (200 ng/mL) and LDL (100 μg/mL) for 24 h [22].
The CD206 mRNA expression in non-stimulated macrophages and foam cells was measured using quantitative PCR (qPCR) assay. Primers that were used are listed in Table S1. Non stimulated RAW264.7 cells and macrophage-derived foam cells were immunostained using primary antibody against CD206 (MR5D3; 1:20; Bio-Rad Laboratories, CA, USA) and secondary antibody conjugated to Alexa Fluor 488 antibody (#405418; 1:50; BioLegend, CA, USA), and then observed under a confocal fluorescence microscope (LSM 900, Carl Zeiss, Oberkochem, Germany). For flow cytometry, samples were incubated with anti-CD206 antibody (MR5D3; 1:10) and Anti-Rat IgG secondary antibody (#405418) according to the manufacturer's instructions, and CD206 expression was analyzed using an LSRFortessa X-20 cell analyzer (BD Bioscience, San Diego, CA, USA). The detailed experimental methods for the qPCR, immunofluorescence and flow cytometry are provided in the supplementary information.
In vitro cellular uptake of MMR-Lobe-Cy to foam cells
Foam cells were treated with MMR-Lobe-Cy (equivalent of 50 μM lobeglitazone) for 1 h. For blocking experiment, foam cells were pre-treated with free mannan (1 mg/mL; a mannose receptor blocker) for 1 h, and additionally treated with MMR-Lobe-Cy (equivalent of 50 μM lobeglitazone) for 1 h. Afterwards, the cells were washed twice with phosphate-buffered saline (PBS). After fixing cells with 3.7% paraformaldehyde, the intracellular internalization was imaged using our custom-built confocal laser-scanning fluorescence microscope (CLSFM) [22]. The mean fluorescence intensity of minimum 10 cells was quantified using the ImageJ software (n = 5).
Anti-inflammatory effects of MMR-Lobe-Cy on foam cells
To verify anti-inflammatory effects in macrophage-derived foam cells, macrophages were pre-treated with MMR-Lobe-Cy (equivalent of 50 μM lobeglitazone) for 2 h, and the cells were additionally treated with LPS (200 ng/mL) and LDL (100 μg/mL) for 24 h. For blocking experiments, mannan (1 mg/mL) was pre-treated 1 h before MMR-Lobe-Cy treatment. Non-stimulated macrophages were used as control cells and macrophage-derived foam cells without MMR-Lobe-Cy treatment as a positive control. After collecting the supernatants from each group, the levels of inflammatory factors including inflammatory chemokine monocyte chemoattractant protein-1 (MCP-1), cytokines IL-1β, and interleukin-6 (IL-6) were determined using a commercial enzyme-linked immunosorbent assay (ELISA) kit (R&D systems, Minneapolis, MN, USA). Cell lysates from each group were tested for enzyme matrix metalloproteinase-9 (MMP-9).
Tissue distribution and blood half-life of MMR-Lobe-Cy
All animal experiments were approved by the Institutional Animal Care and Use Committee (IACUC) of Korea University College of Medicine (KOREA-2018-0066) and performed in accordance with the National Institutes of Health guide for the care and use of Laboratory animals (NIH Publications No. 8023, revised 1978). For tissue distribution study, MMR-Lobe-Cy (10 mg/kg) was intravenously administered into New Zealand white rabbits (male, 3-month-old; Doo-Yeol Biotech, Seoul, South Korea) (n = 6). At 24 h post-injection, rabbits were sacrificed and the tissues including the liver, spleen, kidney, and lung were excised. Then, the fluorescence signals of the tissues were measured using a fluorescence reflectance imaging (FRI) equipment (excitation: 760 ± 20 nm; Davinch-K Co., Seoul, South Korea) equipped with Cy7 NIRF channel. Also, to determine the blood half-life, a rabbit was also intravenously received 10 mg/kg of MMR-Lobe-Cy. At designated time points (1, 6, 12, 36, 120, and 168 h), 1 mL of blood was collected in BD Vacutainer Heparin Tubes and chilled until analysis. The fluorescence intensity of MMR-Lobe-Cy was measured with the FRI equipment. The blood half-life curve of MMR-Lobe-Cy was fitted using two exponential functions (Prism 7.0; GraphPad, San Diego, CA, USA).
Atheromatous rabbit models and drug treatments
Atherosclerotic plaques in coronary-sized vessels of rabbits were induced by balloon injury and high cholesterol diet-feeding. After at least 9 to 11 weeks following the balloon injury, total 15 atheromatous rabbits were randomly grouped into MMR-Lobe-Cy (n = 5), oral lobeglitazone (n = 5), and saline control group (n = 5). Rabbits in each group were treated with MMR-Lobe-Cy by intravenous injection (10 mg/kg), lobeglitazone by oral gavage (2 mg/kg), or placebo (saline injection), respectively. Considering the drug loading content and oral bioavailability of lobeglitazone (> 95%) [29], the amount of lobeglitazone in a single dose of MMR-Lobe-Cy is equivalent to that in oral lobeglitazone per se. To perform intravascular OCT-NIRF imaging for oral lobeglitazone and control groups, MMR-Cy was additionally treated at a dose of 4 mg/kg via intravenous injection so that the NIRF intensity levels in these groups were almost identical to that in the MMR-Lobe-Cy group at baseline. Our previous study reported that the minimum dose of MMR-Cy needed for in vivo OCT-NIRF imaging of plaque macrophages was at least 2.5 mg/kg for atheromatous rabbit models [23]. FRI analysis demonstrated that fluorescence intensity in 4 mg/kg of MMR-Cy was equivalent to that in 10 mg/kg of MMR-Lobe-Cy. After one week, MMR-Lobe-Cy, lobeglitazone per se, saline, and/or MMR-Cy were treated again in the same manner mentioned above. The detailed experimental procedures regarding the development of atheromatous rabbit models were described in the supplementary information.
Levels of lipids and glucose in blood and body weight
Prior to intravascular imaging, blood samples were collected from the iliac artery and stored in serum separator tube (SST) tubes. Then, the collected blood samples were centrifuged in 4 °C at 3,000 rpm for 5 min to obtain the serum. The levels of total cholesterol (TCHO), triglycerides (TG), LDL, and high-density lipoprotein (HDL) in serum were analyzed using a dry chemistry analyzer (DRI-CHEM NX500, Fuji, Tokyo, Japan) according to the manufacturer's instruction. Blood glucose levels were determined using Accu-Chek glucometer (Roche, Basel, Switzerland). Body weights of the rabbits in all groups were also measured.
In vivo intravascular OCT-NIRF imaging in coronary-sized vessels of atheromatous rabbit models
In vivo intravascular OCT-NIRF imaging of plaque lesions was performed as following procedures. At 24 h post-drug treatment, serial imaging was conducted to monitor the NIRF inflammatory signal at baseline (designated as Day 0) and at follow-up time (designated as Day 7). The detailed in vivo imaging experiments were mentioned in the supplementary information.
Analysis of in vivo OCT-NIRF imaging
After the raw NIRF data acquisition, the distance-dependent decay of NIRF intensity was computationally compensated based on automated lumen contour segmentation and a pre-determined compensation curve (Figure S3) [30, 31]. To eliminate differences in NIRF intensities across rabbits from further analyses, the compensated NIRF signals were normalized as the plaque target-to-background ratio (pTBR) by dividing them by the background value. The background value was determined for each rabbit and calculated by averaging the five lowest per-frame maximum NIRF signals obtained from neighboring normal-looking segments, as previously described [24]. We calculated the mean pTBR, a representative inflammatory index of each data, by obtaining the maximum pTBR value for each cross-section and then averaging the values of all cross-sections within a plaque segment. For the detailed intra-animal frame-to-frame NIRF comparison (Day 0 vs. Day 7), the aforementioned maximum pTBR value for each cross-sectional frame was utilized and termed as pTBR/Frame. Corresponding frame pairs between Day 0 and Day 7 were matched by two independent OCT experts, who were blinded to NIRF data, based on side branch orifice, plaque morphology, and plaque size as a morphological guide. Matched frames were randomly sampled at regular intervals from the paired sets of OCT-NIRF images, and 30 pairs selected from each animal were analyzed. For comparison of NIRF intensity changes after treatment among the groups, Δ mean pTBR was calculated by subtracting the mean pTBR at Day 0 from that at Day 7 for each rabbit. To analyze the degree of inflammation reduction following MMR-Lobe-Cy treatment according to baseline inflammation, a total of 150 frame pairs were collected from the MMR-Lobe-Cy group (30 frame pairs in a rabbit and 5 rabbits per group) and analyzed by comparing the relationship between pTBR/Frame values at Day 0 (baseline) and the pTBR/Frame reduction at Day 7 (Δ pTBR/Frame; pTBR/Frame at Day 7 - pTBR/Frame at Day 0). The collected data set was also stratified into three groups according to tertiles of the baseline pTBR/Frame values, and then compared again.
Ex vivo fluorescence reflectance imaging
After acquiring in vivo intravascular images, arterial tissues were flushed with saline following sacrifice of rabbits under CO2 inhalation. Then, infrarenal aorta was carefully removed while preserving arterial bifurcations. Ex vivo NIRF images and signals of the arterial tissues were examined using the FRI system (excitation: 760 ± 20 nm, emission: 832 ± 18 nm). Also, brightfield images were obtained to visualize the plaque formation, and then regions of interests (ROIs) were manually drawn within plaque segments and adjacent normal artery using ImageJ software (National Institute of Health, Bethesda, MD, USA). Likewise, the ex vivo mean pTBR was represented as the ratio of the mean NIRF intensity of atheroma and that of normal segment. In vivo NIRF 2-dimensional (2D) mappings and ex vivo FRI images were matched using the arterial bifurcation, and then the intra-animal correlation between in vivo and ex vivo NIRF signals was examined along the catheter-axis and aorta-axis, respectively. Both in vivo and ex vivo NIRF signals from each image were sampled at 0.5 mm interval.
Histological evaluation of acute anti-inflammatory effects of MMR-Lobe-Cy
After performing the FRI imaging, the arteries were cut transversely at 3 mm intervals, and each tissue segment was frozen in optimal cutting temperature compound (Tissue-Tek®, Sakura Finetek, Tokyo, Japan) at -70 °C. The frozen tissues were cut at 30 μm thickness for fluorescence microscope imaging, and additionally sectioned at 10 μm thickness for further histological validation. Fluorescence microscope (FM) images were acquired using our custom-built CLSFM with an excitation wavelength of 780 nm for Cy7 and 488 nm for auto-fluorescence imaging [22]. To observe the overall morphology of the plaques and lipid accumulation, the sectioned samples were stained with hematoxyline and eosin (H&E; Scytek, Logan, UT, USA) and oil-red O (ORO; Scytek), respectively. For immunohistochemistry (IHC) to visualize plaque macrophages, tissue sections were treated with RAM11 anti-macrophage antibody (1:1000 dilution; Dako, Glostrup, Denmark). Moreover, to validate the mechanism for in vivo anti-inflammatory effects of MMR-Lobe-Cy, the sections were stained using the following primary antibodies such as MCP-1 (1:500 dilution; Proteintech, Rosemont, IL, USA), ATP-binding cassette subfamily A member 1 (ABCA1, 1:400 dilution; Novus Biologicals, Centennial, CO, USA), and Toll-like receptor-4 (TLR4, 1:200 dilution; Novus Biologicals). RAM11, MCP-1, ABAC1, and TLR4-stained tissues were detected with the Polink-2 HRP Plus Mouse DAB Detection System (GBI Labs, Bothell, WA, USA). After dehydration, clearing, and mounting process, all stained specimens were observed with a light microscope (BX51, Olympus, Tokyo, Japan), and images were acquired with an automated slide scanner (Axio Scan Z1, Zeiss, Oberkochen, Germany).
In vivo evaluation of macrophage contents, protease expression, and collagen contents in plaques after MMR-Lobe-Cy treatment
To further investigate whether MMR-Lobe-Cy treatment affects the changes of macrophages contents, protease expression, and collagen contents in plaques, atheromatous rabbits received with MMR-Lobe-Cy (10 mg/kg, n = 3) or saline (n = 3) once a week for 2 weeks (Figure S5). At Day 14, the harvested aorta tissues were frozen in optimal cutting temperature compound and then sectioned at 10 μm thickness. To examine macrophages and protease expression, the specimens were stained with RAM11 anti-macrophage (1:1000 dilution) and 4A3 anti-MMP-9 (1:100 dilution; Novus Biologicals). Sections were then labeled with the Polink-2 HRP Plus Mouse DAB Detection System and stained tissues were then observed using the light microscope. For collagen contents analysis, the tissue specimens were stained using Picro-Sirius Red (PSR) Stain Kit (SRC-1-IFU; Scytek). Detailed staining method of PSR was described in the supplementary information. PSR-stained tissues were imaged twice with brightfield and polarized microscopy (BX51, Olympus) to identify overall collagen contents and collagen type I, respectively.
Quantitative analysis of stained tissue images
For quantitative analysis of ORO and PSR-stained sections, we introduced algorithms for the segmentation of the overall and positive-stained tissue section areas. Detailed methods for quantifying ORO and PSR stained images were described in the supplementary information. Also, an open-source digital IHC image analysis software was used to separate the positive-stained areas from IHC images including RAM11, MCP-1, ABCA1, TLR4, and MMP-9 [32]. This tool can analyze antibody staining intensity from the immunostained images, provide quantitative scale from zero to one, and differentiate the antibody- and counter-stained areas. After segmentation of tissue section area, the pixels with an antibody staining intensity greater than 0.1 in the tissue section area were selected as positive-stained pixels. All selected intensity values were summed to calculate the positive-stained ratio of the immunostained images. The histopathology and IHC quantitation processes were implemented using ImageJ and MATLAB (R2017a; The MathWorks, Natick, MA, USA).
Western blotting
To explore whether MMR-Lobe-Cy affects the activation of PPARγ and thereby inhibiting TLR4-dependent NF-κB signal pathways, the cultured macrophages (2 × 10⁶ cells per 100 mm dish) were pre-treated with PBS or T0070907 (a potent and selective PPARγ inhibitor; Sigma Aldrich) for 2 h, and they were then treated with MMR-Lobe-Cy (equivalent of 50 μM lobeglitazone) for 1 h. Afterwards, the cells were further exposed with LPS (200 ng/mL) and LDL (100 μg/mL). After 24 h, the cells were lysed with M-PER Mammalian Protein Extraction Reagent (Thermo Scientific, Waltham, MA, USA). After collecting cell lysates by centrifugation at 14,000 rpm for 30 min at 4 °C, cell lysates (20 μg/lane) were separated by 10% sodium dodecyl sulfate (SDS)-polyacrylamide gels, and the proteins were transferred on polyvinylidene difluoride (PVDF) membranes. The membranes were then incubated with the primary antibodies such as PPARγ (NBP1-04676; 1:1000; Novus Biologicals), TLR4 (NBP100-56566; 1:500; Novus Biologicals), total NF-κB (#8242S; 1:1000; Cell Signaling, Danvers, MA, USA), and phosphorylated NF-κB (pNF-κB; #3033S; 1:1000; Cell Signaling) at 4 °C overnight. They were additionally incubated with secondary antibody (1:3000; Santa Cruz Biotechnology Inc., Dallas, TX, USA) for 1 h and then detected using the chemiluminescence western blotting detection kit (Bio-D, Gwangmyeong, South Korea). Quantification of western blot was performed using the ImageJ software by normalizing to loading controls as indicated, and presented as fold changes over the untreated controls.
Biosafety of MMR-Lobe-Cy
In vitro cytotoxicity of MMR-Lobe-Cy in RAW264.7 cells and foam cells were evaluated using cell counting kit-8 (CCK-8, Dojindo Laboratories, Japan) after treatment of MMR-Lobe-Cy containing 0, 1, 5, 10, 20, 50 μM of lobeglitazone for 24 h, and the optical density values were read using a microplate reader at a wavelength of 450 nm. Complete blood count and biochemistry were analyzed in rabbits injected with either saline or a single dose of MMR-Lobe-Cy (10 mg/kg) at 1 day and 1 week after the injection. Red blood cells, hemoglobin, platelets, and white blood cells were analyzed using an automated hematology system (XN-9100; Sysmex Corporation, Kobe, Japan). Aspartate transaminase (AST), alanine transaminase (ALT), blood urea nitrogen (BUN), and creatinine (CRE) were measured on an automatic analyzer (DRI-CHEM NX500i; FUJIFLIM, Japan). The rabbits used for the comprehensive blood testing were sacrificed after 1 week, and their spleen, kidney, liver, and lung were immediately extracted, followed by formalin-fixation, paraffin-sectioning, and H&E staining. The detailed experimental methods for the cytotoxicity, complete blood counting, and biochemistry were provided in the supplementary information.
Statistical analysis
Statistical analysis was performed with SPSS (Version 23, SPSS Inc., Chicago, IL, USA) and Prism (version 7.0, GraphPad). Quantitative data were expressed as mean ± standard error of the mean. Mean values between three groups were compared via a Kruskal-Wallis test followed by the Mann-Whitney U test with Bonferroni correction for post hoc multiple comparisons. Between two groups, a Mann-Wehitney U test was used. The Wilcoxon matched-pairs signed rank test was used to assess the differences in mean pTBR values between at Day 0 and Day 7 from the same rabbit atheroma. Intra-animal frame-to-frame NIRF comparison was analyzed with paired t-test. Relationships between two measurements were assessed by Spearman's or Pearson's correlation analysis according to the Shapiro-Wilk normality test. The P values of less than 0.05 were considered statistically significant and all tests were two-tailed.
Results and Discussion
Synthesis and characterizations of MMR-Lobe-Cy
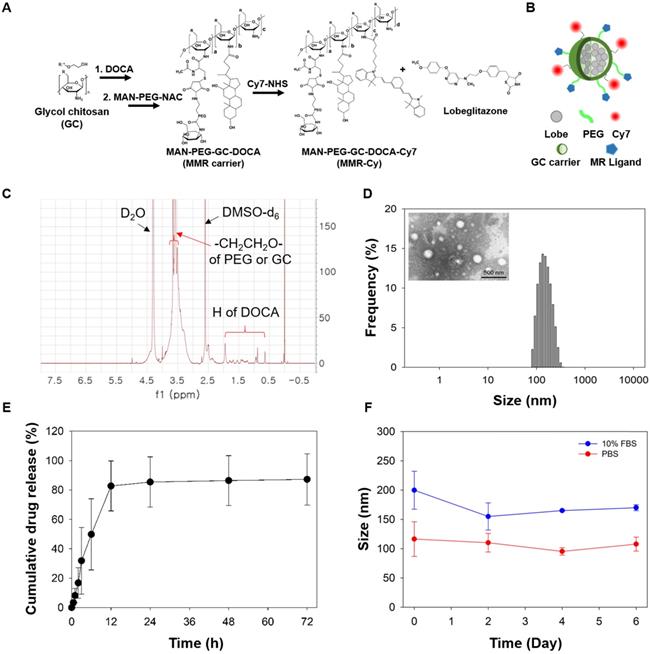
As an MMR-targeted theranostic agent, the NIRF-emitting MMR carrier was prepared to specifically deliver lobeglitazone into plaque macrophages and scaled up for the translational application to the plaques in coronary-sized arteries. Previous studies have reported that D-mannose had higher binding affinity towards mannose receptors than other monosugars (i.e., N-acetylglucosamine, glucose, xylose, and galactose) [33-37]. In this study, we used mannosamine as a specific ligand to mannose receptors because it has the equatorial hydroxyl groups at both the C3 and C4 positions that are the principal determinants of recognition towards mannose receptors (Figure S1). After conjugating it with MAL-PEG-NHS, and as a result, the formed N-acetylmannosamine moiety in MMR-Lobe-Cy had similar structure with mannose (Figure S1D), indicative of specific binding affinity of MMR-Lobe-Cy to MMR. For gram-scale synthesis of MMR-Cy, GC was sequentially reacted with DOCA as a hydrophobic moiety, MAN-PEG-NAC as a specific ligand to the mannose receptor, and Cy7-NHS ester as a NIRF agent (Figure 1A). The conjugation of MAN-PEG-NAC and DOCA with GC was confirmed using the 1H-NMR spectrometer. As shown in Figure 1C, we detected proton peaks at 0.63-1.82 ppm from DOCA and methylene, and at 3.3-3.65 ppm from GC and PEG. Then, to obtain MMR-Lobe-Cy, the hydrophobic lobeglitazone as a PPARγ agonist was incorporated into the hydrophobic inner cores of MMR-Cy using a dialysis method (Figure 1A-B). MMR-Lobe-Cy (1 mg) and MMR-Cy (1 mg) contained 0.75 μg and 1.6 μg of Cy7, respectively, as measured by an ultraviolet-visible (UV-Vis) spectrophotometer analysis. The fluorescence intensity of Cy7 in 10 mg of MMR-Lobe-Cy was relatively comparable to that in 4 mg of MMR-Cy as quantitated by the FRI imaging. The loading amount of lobeglitazone within 1 mg of MMR-Lobe-Cy was 0.258 mg as determined by HPLC. The prepared MMR-Lobe-Cy formed the self-assembled nanoparticles in aqueous solution with a hydrodynamic diameter of 207.2 ± 34.79 nm because MMR-Lobe-Cy was composed of hydrophilic outer shell of MAN-PEG-GC and hydrophobic inner cores of DOCA and lobeglitazone (Figure 1B and 1D). The TEM image confirmed the formation of self-assembled nanostructure (Figure 1D). The drug release profile showed that MMR-Lobe-Cy provided a rapid release of lobeglitazone within the first 12 h, followed by a sustained release (Figure 1E). The stability of MMR-Lobe-Cy was tested by measuring the size in PBS and 10% FBS over the 6 days period, and there were no significant changes in the average size of MMR-Lobe-Cy (Figure 1F). These findings suggest that the MMR-Lobe-Cy is stable under biological conditions and avoids unwanted aggregation.
Characteristics of MMR-Lobe Cy. (A) Sequential synthetic processes of a theranostic nanodrug, MMR-Lobe-Cy, with strong binding affinity to mannose receptors on macrophages and/or foam cells. MMR-Lobe-Cy was designed to simultaneously detect inflammatory activity and deliver lobeglitazone as an anti-atherogenic drug into high-risk plaque lesions. (B) Schematic illustration of MMR-Lobe-Cy. Hydrophobic lobeglitazone molecules were encapsulated within the hydrophobic inner cores of MMR-Cy. (C) 1H-NMR spectrum of MMR carrier. (D) Particle size distribution of MMR-Lobe-Cy dispersed in aqueous solution. Inset: TEM image of MMR-Lobe-Cy. Scale bar, 500 nm. (E) In vitro release profile of lobeglitazone from MMR-Lobe-Cy. (F) The hydrodynamic diameter variation of MMR-Lobe-Cy in PBS (pH 7.4) and 10% FBS-containing DMEM medium.
Specific binding affinity and anti-inflammatory effects of MMR-Lobe-Cy
We first performed qPCR, immunofluorescence staining, and flow cytometry analysis to examine the expressed levels of mannose receptor CD206 in foam cells. As measured by qPCR analysis, CD206 mRNA expression was significantly upregulated in foam cells compared to non-stimulated macrophages (Figure 2A). Immunofluorescence microscopy showed that the CD 206 protein expression was higher in foam cells compared to the control cells (Figure 2B). Flow cytometry analysis revealed that the CD206 expression was significantly increased in foam cells (28.6%) compared to the control cells (1.3%) (Figure 2C).
In vitro and in vivo feasibility study of MMR-Lobe-Cy. (A-C) Expression of CD206 in foam cells. (A) CD206 (Mrc1) mRNA expression in non-stimulated control macrophages and foam cells by qPCR analysis. *P < 0.05 by Mann-Whitney U test. (B) Representative immunofluorescence images of non-stimulated control cells (left) and foam cells (right) labeled with CD206 antibody (green). Scale bar, 50 µm. (C) Flow cytometry analysis of CD206 expression in control (left) and foam cells (right). Red colored area indicates negative control (staining only with secondary antibody). (D) CLSFM images of MMR-Lobe-Cy internalization in foam cells (MMR-derived NIRF in red). The cellular uptake of MMR-Lobe-Cy decreased when mannose receptors on foam cells were blocked with pre-treated free mannan. Scale bars, 30 µm. *P < 0.05 by Kruskal-Wallis test followed by Mann-Whitney U test with Bonferroni correction. (E) In vitro anti-inflammatory effects of MMR-Lobe-Cy on foam cells as assessed by the expression of inflammatory mediators including MCP-1, MMP-9, IL-1β, and IL-6 by ELISA. Mannose receptor blocking assay with mannan showed the neutralized effects of MMR-lobe-Cy from the foam cells. *P < 0.05 by one-way ANOVA followed by Tukey's post-hoc test. (F) Representative ex vivo fluorescence imaging of the harvested liver, kidney, spleen, and lung of MMR-Lobe-Cy after 24 h post-injection in rabbits (left), and quantitative fluorescence analysis of tissue biodistribution (n = 6) (right). Data represent the means ± standard error of the mean. *P < 0.05 by Kruskal-Wallis test followed by Mann-Whitney U test with Bonferroni correction. (G) Time-dependent blood pharmacokinetics of MMR-Lobe-Cy in a rabbit. After collecting blood sample at predetermined time intervals, NIRF intensity of MMR-Lobe-Cy at each tme step was measured and fitted to calculate the estimated blood half-life time. (H) Representative result of in vivo intravascular longitudinal OCT-NIRF imaging, in vivo 2-dimensional (2D) NIRF mapping, and ex vivo FRI. The corresponding in vivo axial OCT-NIRF cross-sections, FM images (MMR-derived NIRF in red, autofluorescence in green), and RAM11 immunostained tissue images were designated by white dotted lines; (a) non-injured (normal) and (b) balloon-injured (plaque) arterial segments. Scale bar, 500 µm. Equally windowed.
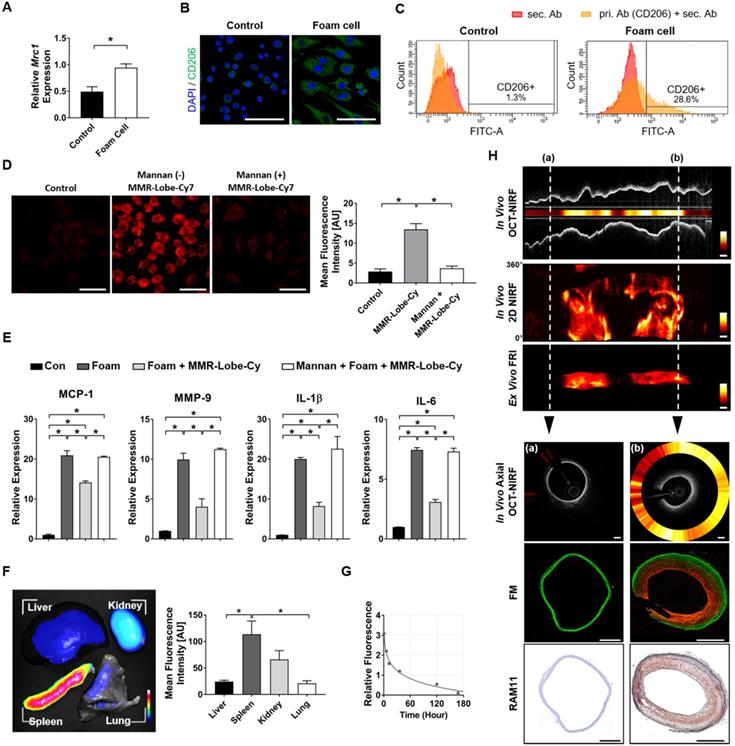
In vitro binding affinity of MMR-Lobe-Cy to atherogenic foam cells was examined using the custom-built CLSFM. MMR-Lobe-Cy was localized to cytoplasm of foam cells, and receptor blocking by pre-treatment with a mannose receptor blocker, mannan, reduced the internalization of MMR-Lobe-Cy into foam cells (Figure 2D), demonstrating that MMR-Lobe-Cy was internalized into foam cells via mannose receptor-mediated endocytosis. To assess the anti-inflammatory effects of MMR-Lobe-Cy on foam cells, we analyzed the expression of inflammatory chemokine MCP-1, enzyme MMP-9, cytokines IL-1β and IL-6 in foam cells using the ELISA kit. The expression of MCP-1, MMP-9, IL-1β, and IL-6 were significantly decreased in foam cells treated with MMR-Lobe-Cy, while these changes were reversed by the pre-treatment with mannan, indicating that MMR-Lobe-Cy can more specifically target mannose receptors (Figure 2E). Taken together, the specific binding affinity and anti-inflammatory efficacy of MMR-Lobe-Cy synthesized at gram-scale were consistent with those of our previous MMR-Cy and MMR-Lobe prepared at subgram-scale [22, 23]. These in vitro data indicate that the modified gram-scale synthesis of MMR-Lobe-Cy was reproducible for targetability to mannose receptors, NIRF visualization, and inhibition of inflammatory activity, implying that the targeted theranostic potential of MMR-Lobe-Cy allows to specifically detect atherogenic foam cells and simultaneously reduce inflammatory activity within the targeted cells.
Feasibility study for the specific targeting of MMR-Lobe-Cy to atheromatous plaques using in vivo intravascular OCT-NIRF imaging system
Next, we validated in vivo biodistribution, pharmacokinetics, and feasibility to image plaque macrophages in rabbit atherosclerotic model followed by intravenous injection of MMR-Lobe-Cy. As shown in Figure 2F, the MMR-Lobe-Cy deposition was greatest in the spleen, followed by that in the kidney, liver and lung. The highest uptake of MMR-Lobe-Cy in the spleen might have been attributed to the size of nanoparticle, as larger nanoparticles with diameter greater than 200 nm are typically sequestered by the spleen as a result of mechanical filtration. In addition, the MMR-targeted theranostic agent could accumulate in the kidney by targeting mannose receptors expressed on the mesangial cells [31], by exhibiting a high fluorescence intensity in the kidney. Meanwhile, weaker fluorescence signal was observed in the liver, since attachment of PEG polymer chain to the MMR-targeted agent forms a hydration layer on the particle surface by attracting water molecules and further reduces the hepatic Kupffer cells' ability to phagocytose nanoparticles by opsonin-mediated endocytosis [38-40]. Lung uptake of MMR-Lobe-Cy was almost negligible because larger nanomaterials with a size greater than 1000 nm preferentially accumulate in the pulmonary capillary beds by forming a microembolism [41]. The half-life of MMR-Lobe-Cy in the blood of rabbit was estimated to 17.4 h according to the fitting result (Figure 2G). Based on these data, we decided 24 h as in vivo intravascular imaging time after MMR-Lobe-Cy injection. To investigate whether MMR-Lobe-Cy is able to specifically target rabbit atheroma, we performed in vivo intravascular OCT-NIRF imaging at 24 h after the intravenous injection of MMR-Lobe-Cy, and then the imaged aortic vessel was validated using ex vivo FRI, CLSFM, and immunostaining (Figure 2H). In vivo OCT-NIRF and subsequent ex vivo FRI images demonstrated that the NIRF signal at balloon-injured atheroma segments was much stronger than that at non-injured segment. Furthermore, FM and immunostaining imaging clearly supported that MMR-Lobe-Cy specifically targets the macrophages in atheroma regions. The RAM11 positive-staining fraction highly correlated with MMR-Lobe-Cy-derived NIRF signals (r = 0.88, P < 0.001; Figure S2). Taken together, these results suggest that MMR-Lobe-Cy can identify the inflammatory activity in atheroma lesions in the rabbit aorta as well as distinguish between atheromatous plaques and normal-looking artery.
In vivo serial OCT-NIRF imaging for the evaluation of acute anti-inflammatory effects of MMR-Lobe-Cy in rabbit atheroma
To assess acute anti-inflammatory effects of MMR-Lobe-Cy in vivo, serial OCT-NIRF imaging was performed in rabbit aortic plaque at initial (Day 0) and follow-up time (Day 7) after treatment with MMR-Lobe-Cy, lobeglitazone per se, or saline (Figure 3A). In this study, we excluded a MMR c MR carrier had no effects on the inflammation reduction in plaque as well as the activation of the PPARγ pathway [22]. In addition, based on the lack of specific binding affinity of non-targeting probe to plaque macrophages [23], the drug delivery efficiency of non-targeting nanodrug was expected to be similar to that of lobeglitazone per se. We utilized a dedicated user-interface software that allows real-time display of cross-sectional OCT-NIRF images and further analysis of the corresponding NIRF intensity. The distance-dependent decay of NIRF intensity [31] was computationally compensated based on automated lumen contour segmentation (Figure S3) [30].
In vivo serial OCT-NIRF imaging to evaluate acute inflammation reduction effect of MMR-Lobe-Cy. (A) Schematic diagrams of the establishment of atheromatous rabbit models (n = 5 per group), drug treatments, and in vivo serial OCT-NIRF imaging experiments. Lobe: lobeglitazone. (B-D) Representative in vivo longitudinal (upper panel) and corresponding axial (lower panel) OCT-NIRF images acquired at initial baseline (Day 0) and follow-up time (Day 7) from groups of (B) MMR-Lobe-Cy, (C) oral lobeglitazone, and (D) saline control. NIRF data were normalized to the plaque target-to-background ratio (pTBR), and then color-coded for the combined visualization. Scale bars, 500 μm. Equally windowed. (E-I) Quantitative comparison of the pTBR values among MMR-Lobe-Cy, oral lobeglitazone, and saline control groups. Comparison of (E) mean pTBR and (F) pTBR/Frame from each group, and (G) Δ mean pTBR among three groups. The mean pTBR was obtained by spatially averaging the maximum pTBR value of each frame (pTBR/Frame) within plaque segments. Δ mean pTBR was calculated by subtracting the mean pTBR at Day 0 from that at Day 7. *P < 0.05, **P < 0.01, and ***P < 0.001 by Wilcoxon matched-pairs signed rank test (E), by paired t-test (F), and by Kruskal-Wallis test followed by Mann-Whitney U test with Bonferroni correction (G). ns, non-significant. (H) Spearman's correlation coefficient analysis between initial pTBR/Frame (Day 0) and changes in pTBR/Frame along time (Δ pTBR/Frame; pTBR/Frame at Day 7 - pTBR/Frame at Day 0). (I) The distribution of Δ pTBR/Frame across tertiles of initial pTBR/Frames (Day 0). I, II, and III denote the first (lowest), second, and third (highest) tertile group of the initial pTBR/Frame (n = 30 frames per rabbit, total 150 frames). ***P < 0.001 by Kruskal-Wallis test followed by Mann-Whitney U test with Bonferroni correction.
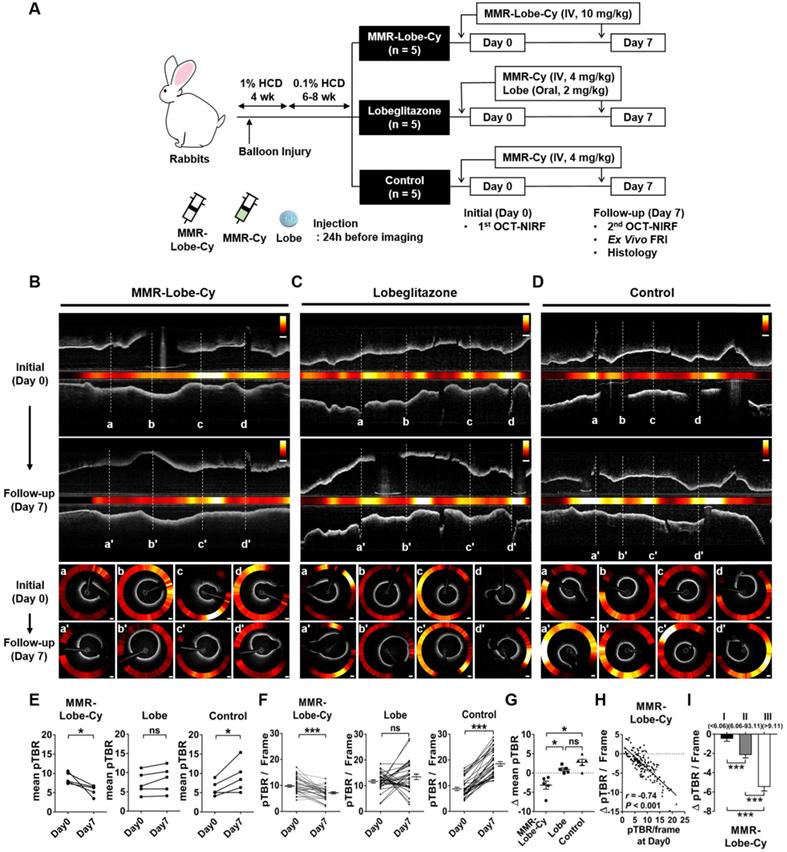
In MMR-Lobe-Cy treated rabbits, the mean pTBR, a representative inflammatory index of each data, was significantly reduced at Day 7 compared to Day 0 (Day 0 vs. Day 7: 8.77 ± 0.65 vs. 5.63 ± 0.61, P = 0.043; Figure 3B and 3E), whereas, in saline controls, the mean pTBR was even higher at Day 7 compared to baseline (Day 0 vs. Day 7: 6.06 ± 0.87 vs. 9.77 ± 1.82, P = 0.043; Figure 3D and 3E). There was no significant difference of mean pTBR between Day 0 and Day 7 in the rabbits treated with lobeglitazone per se (Day 0 vs. Day 7: 7.31 ± 1.33 vs. 8.25 ± 1.52, P = 0.080; Figure 3C and 3E). Consistently, the changes in plaque inflammation activities were evident in OCT-guided frame matching analyses. MMR-Lobe-Cy treatment significantly reduced pTBR/Frame, the maximum pTBR value for each frame, within the atheroma at Day 7 compared to Day 0 (Day 0 vs. Day 7: 10.03 ± 0.49 vs. 6.76 ± 0.40, P < 0.001; a-a' to d-d' in Figure 3B and 3F; Movie S1), while pTBR/Frame increased at Day 7 in the saline-treated rabbit atheroma compared to baseline (Day 0 vs. Day 7: 8.92 ± 0.63 vs. 18.65 ± 0.86, P < 0.001; a-a' to d-d' in Figure 3D and 3F; Movie S3). There was no difference of NIRF activities in the matched frame pairs of the oral lobeglitazone group (Day 0 vs. Day 7: 11.71 ± 0.57 vs. 13.47 ± 1.01, P = 0.180; a-a' to d-d' in Figure 3C and 3F; Movie S2). The value of Δ mean pTBR, a difference in mean pTBR between Day 0 and Day 7, differed significantly among three treatment groups (MMR-Lobe-Cy vs. oral lobeglitazone vs. control: -3.14 ± 1.07 vs. 0.94 ± 0.41 vs. 2.77 ± 0.81, P = 0.005; Figure 3G). The reduction of mean pTBR after treatment was more pronounced in the MMR-Lobe-Cy group compared to oral lobeglitazone or control groups. To further investigate whether the anti-inflammatory efficacy of MMR-Lobe-Cy can be augmented according to the plaque inflammatory levels at baseline, we analyzed the relationship between initial inflammation (pTBR/Frame at Day 0) and inflammation reduction after treatment (Δ pTBR/Frame; Day 7 - Day 0). Intriguingly, the baseline NIRF activity in the plaques negatively correlated with Δ pTBR/Frame, implicating that MMR-Lobe-Cy attenuates plaque inflammation in a macrophage-dependent manner (r = -0.74, P < 0.001; Figure 3H). As stratified by the baseline inflammation level, a significant difference in Δ pTBR/Frame was noted according to the baseline pTBR/Frame tertiles, indicating that the higher the inflammatory activities at baseline, the greater the reduction of inflammation after MMR-Lobe-Cy treatment (Δ pTBR/Frame: tertile I vs. II vs. III: -0.47 ± 0.26 vs. -2.16 ± 0.31 vs. -5.47 ± 0.42, P < 0.001; Figure 3I). In the previous non-targeted PPARγ study, three month administration of pioglitazone significantly suppressed inflammation in atherosclerotic rabbits [42]. In contrast, remarkably, our targeted MMR-Lobe-Cy treatment showed a robust decrease in plaque inflammation within 1 week in coronary-sized vessels. Furthermore, acute anti-inflammatory effects of MMR-Lobe-Cy was much more pronounced depending on baseline inflammatory activity. This augmented effect could be explained by targeted property of MMR-Lobe-Cy; localized accumulation of more PPARγ agonist within the macrophage abundant areas of the atheroma. These results indicate that serial in vivo assessment using a dual-modal intravascular OCT-NIRF imaging demonstrated a robust reduction of plaque inflammation in coronary-sized arteries within 1 week following MMR-Lobe-Cy administration.
Ex vivo FRI imaging for confirmation of in vivo OCT-NIRF findings
In vivo NIRF 2D mapping results were also acquired at initial (Day 0) and follow-up time (Day 7). Unlike the oral lobeglitazone and saline control groups, MMR-Lobe-Cy could effectively reduce the pTBR/Frame values within plaque segments, showing its prominent anti-inflammatory effects (Figure 4A). To further validate these in vivo findings, OCT-NIRF imaged aortas were resected, and then ex vivo FRI was performed. A strong NIRF signal was detected in the advanced atheroma portion of the brightfield images (Figure 4B). This ex vivo NIRF signals well matched with the in vivo NIRF 2D mapping at Day 7 (Figure 4A and 4B). The in vivo mean pTBR from OCT-NIRF images at Day 7 significantly correlated with ex vivo mean pTBR from FRI (r = 0.84, P < 0.001; Figure 4C). Likewise, the in vivo and ex vivo pTBR/Frame values along the pullback direction in each artery were well co-localized (r = 0.713, P < 0.001; Figure 4D). The ex vivo mean pTBR in MMR-Lobe-Cy group was significantly lower compared to both oral lobeglitazone and saline control groups as well (MMR-Lobe-Cy vs. oral lobeglitazone vs. control, 2.80 ± 0.05 vs. 3.77 ± 0.24 vs. 4.06 ± 0.37, P = 0.005; Figure 4E). Consistent with the in vivo findings, this evidence implies that ex vivo imaging analysis corroborated the specific targeting of MMR-Lobe-Cy to atheroma and reduction of inflammatory activity within plaques after MMR-Lobe-Cy treatment.
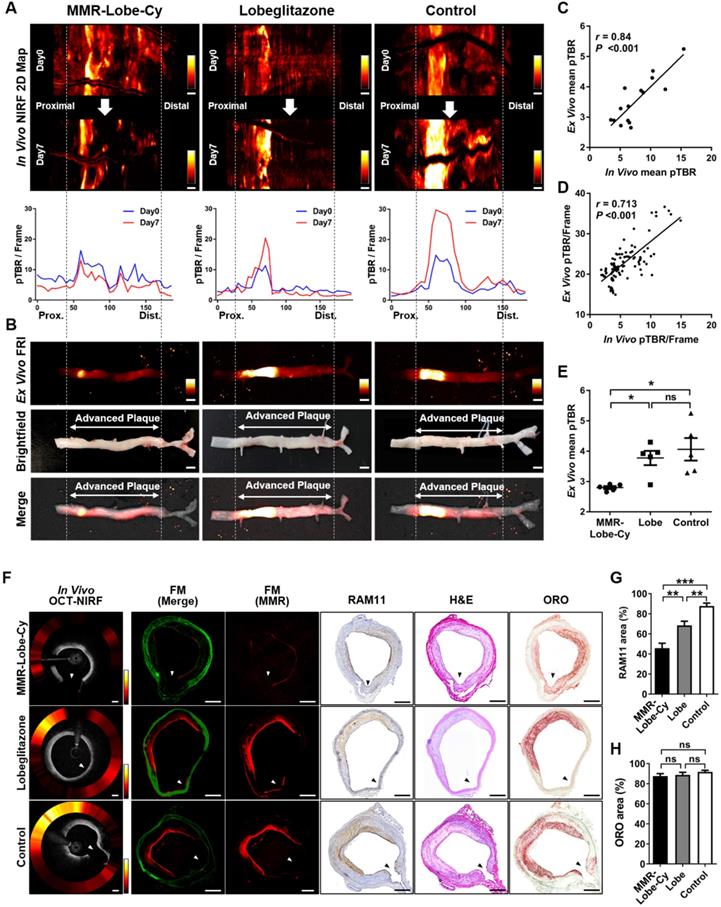
Ex vivo FRI NIRF imaging for confirmation of in vivo findings. (A) Comparison of representative in vivo NIRF 2-dimensional (2D) mapping between Day 0 (1st row) vs. Day 7 (2nd row), and pTBR/Frame (3rd row) along the pullback direction. NIRF signals decreased after MMR-Lobe-Cy treatment at Day 7 (1st column), whereas the signals tended to increase after administration with saline (3rd column). Prox., proximal; Dist., distal. Scale bars, 4 mm. Equally windowed. (B) Ex vivo FRI NIRF (top), brightfield (middle), and merged images (bottom) of resected arteries. Scale bars, 4 mm. Equally windowed. (C) Pearson correlation analysis of in vivo and ex vivo mean pTBR. (D) A linear relationship between in vivo vs. ex vivo pTBR/Frame values of the corresponding sites of the artery (r: Spearman correlation coefficient). (E) Quantitative comparison of ex vivo mean pTBR comparison among each group. *P < 0.05 by Kruskal-Wallis test followed by Mann-Whitney U test with Bonferroni correction. ns, non-significant. (F-H) Co-relationship between in vivo axial OCT-NIRF images and histological validation. (F) The representative in vivo axial OCT-NIRF cross-sectional images of each group correspond with the FM images (MMR-derived NIRF in red, autofluorescence in green), macrophage immunostaining (RAM11), haematoxylin and eosin staining (H&E), and oil red O (ORO) lipid staining, respectively. Scale bars, 500 µm. Equally windowed. (G) Quantitative analysis of RAM11-positive macrophage areas of each treatment group including MMR-Lobe-Cy, oral lobeglitazone, and saline control. (H) ORO staining area comparison for lipid composition of each group. **P < 0.01, ***P < 0.001 by Kruskal-Wallis test followed by Mann-Whitney U test with Bonferroni correction. ns, non-significant.
Correlative fluorescence microscopy and histological validation
In vivo axial OCT-NIRF images obviously supported that MMR-Lobe-Cy had prominent acute anti-inflammatory effects on rabbit atheroma compared to oral lobeglitazone or saline control groups (Figure 4F). To further confirm the prominent anti-inflammatory effects of MMR-Lobe-Cy, FM imaging and histological validation were carried out using the resected aortae from each group. The NIRF signals from in vivo axial OCT-NIRF images well corresponded to those on FM images from the matched sections (Figure 4F). Consistent with in vivo OCT-NIRF imaging, the NIRF signals from FM images in MMR-Lobe-Cy group was much weaker than those in oral lobeglitazone or saline control groups. On the FM images and corresponding immunohistochemistry of RAM11, strong NIRF signals in oral lobeglitazone or saline control groups were detected at the macrophage-abundant areas of the plaques, whereas weak NIRF signal in MMR-Lobe-Cy were observed at macrophage-scarce areas (Figure 4F). The amount of plaque macrophages quantitatively decreased in the MMR-Lobe-Cy group by 33.2% vs. oral lobeligtazone (P = 0.006) and by 47.9% vs. control (P < 0.001) (Figure 4G). The RAM11 positive area was reduced by 22.0% in the oral lobeglitazone group compared to the saline control group (P = 0.003) (Figure 4G). Further histological validation was performed with ORO lipid staining to assess the cholesterol efflux activity by PPARγ [22], however, no significant difference was observed between the groups (P = 0.640) (Figure 4H). These results imply that the short-term administration of MMR-Lobe-Cy has prominent anti-inflammatory effects on atheroma, but is insufficient to reduce lipid contents in the plaque within a short period time.
Inhibition of TLR4/NF-κB by MMR-Lobe-Cy
Previous studies reported that PPARγ agonists have anti-inflammatory effects by inhibiting the TLR4/NF-κB signaling pathway, the key regulator of inflammatory responses [43-45]. To investigate whether the PPARγ activation through the specific delivery of lobeglitazone using MMR-Lobe-Cy negatively regulates the TLR4/NF-κB signaling pathway in atherogenic foam cells, we performed western blotting to assess the protein expression of PPARγ, TLR4, NF-κB and pNF-κB in foam cells treated with MMR-Lobe-Cy. MMR-Lobe-Cy increased PPARγ expression and negatively regulated TLR4 and pNF-κB expressions in foam cells, and these actions were blocked by a PPARγ antagonist, T0070907 (Figure 5A). This finding suggests that MMR-Lobe-Cy inhibits TLR4/NF-κB signaling pathway through PPARγ activation in macrophage foam cells.
Inhibition of TLR4/NF-κB signaling pathway by MMR-Lobe-Cy. (A) Western blot analysis of PPARγ, TLR4, phosphorylated NF-κB (pNF-κB), and total NF-κB. PBS- or T0070907 PPARγ inhibitor pre-treated macrophages were treated with MMR-Lobe-Cy, followed by stimulation with LPS and LDL. TLR4, Toll-like receptor-4; NF-κB, nuclear factor-κB. Quantification of PPARγ, pNF-κB, and TLR4 was normalized to β-Actin, NF-κB, and β-Actin, respectively, and presented as fold changes over the controls. (B-D) Comparison of MCP-1, ABCA1, and TLR4 expression in rabbit atheroma between the groups of MMR-Lobe-Cy, oral lobeglitazone, and saline control. Representative immunohistochemical images and quantitative comparison of (B) MCP-1, (C) ABCA1, and (D) TLR4 expression in rabbit atheroma after drug treatments. Scale bars, 500 µm. *P <0.05, **P < 0.01, ***P < 0.001 by Kruskal-Wallis test followed by Mann-Whitney U test with Bonferroni correction. (E) Model for mechanisms of inflammation inhibition by MMR-Lobe-Cy in plaque macrophages. MMR-Lobe-Cy provides specific delivery of lobeglitazone to plaque macrophages via receptor-mediated endocytosis. Released lobeglitazone activates PPARγ, binds to PPAR response element (PPRE) in target genes, and its transcription upregulates ABCA1 that induces cholesterol efflux. In addition, activated PPARγ represses the transcription of NF-κB that binds to DNA through NF-κB response element (NF-κB RE), and then inhibits the production of inflammatory mediators through blocking of TLR4/NF-κB pathway.
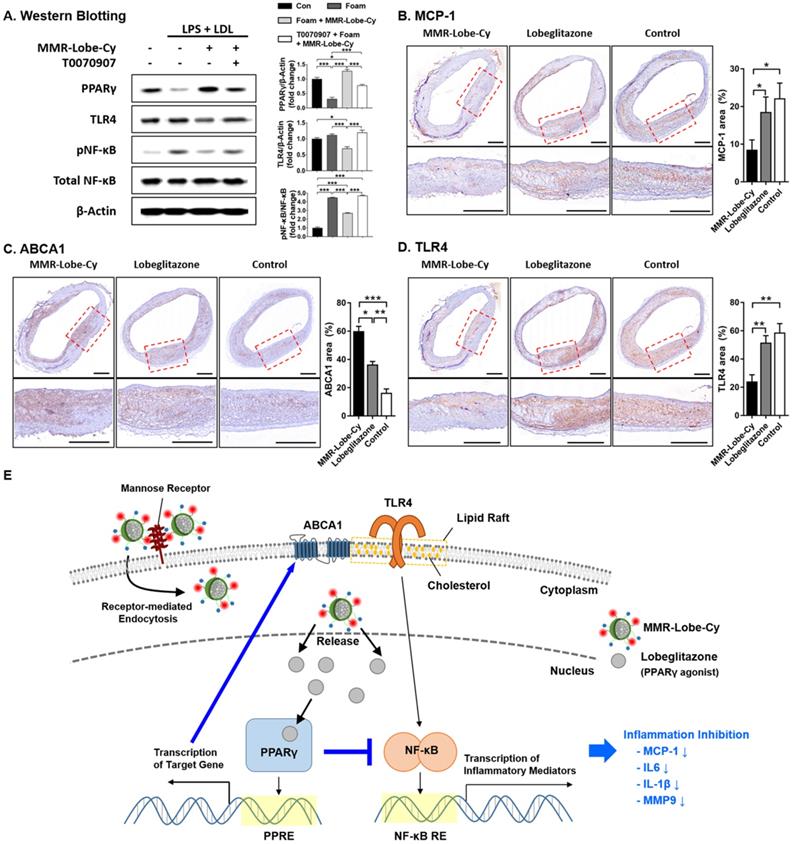
Monocyte infiltration mainly contributes to accumulation of plaque macrophages. The expression of MCP-1 is enhanced by macrophages [46] and reduced in atherosclerotic plaques by treatment of PPARγ agonist [47]. To further demonstrate in vivo effects of MMR-Lobe-Cy on MCP-1 expression, we assessed the expression of MCP-1 in macrophage-rich atheroma treated with MMR-Lobe-Cy. MMR-Lobe-Cy significantly inhibited the expression of MCP-1 compared to both oral lobeglitazone and control groups (MCP-1 area (%) between MMR-Lobe-Cy vs. oral lobeglitazone, P = 0.032; MMR-Lobe-Cy vs. control, P = 0.017; oral lobeglitazone vs. control, P = 1.00) (Figure 5B), suggesting that MMR-Lobe-Cy attenuated inflammation in the plaques partly via reduction of MCP-1, which is primarily responsible for monocyte chemotaxis and infiltration in atherosclerosis [48, 49]. As ABCA1 expression reorganizes plasma membrane lipid rafts at the site where signaling cascade is concentrated [50], we investigated the effects of MMR-Lobe-Cy on the expression of ABCA1 and TLR4 within the atheroma. MMR-Lobe-Cy significantly increased the expression of ABCA1 (MMR-Lobe-Cy vs. oral lobeglitazone, P = 0.028; MMR-Lobe-Cy vs. control, P < 0.001; oral lobeglitazone vs. control, P = 0.003) (Figure 5C) and suppressed the expression of TLR4 within the plaque (MMR-Lobe-Cy vs. oral lobeglitazone, P = 0.005; MMR-Lobe-Cy vs. control, P = 0.001; oral lobeglitazone vs. control, P = 1.00) (Figure 5D). Notably, MMR-Lobe-Cy treatment in macrophage foam cells elicits the expression of PPARγ and blocked the expression of TLR4 and pNF-κB. This is consistent with the previous reports that PPARγ agonists repress the transcriptional activity of NF-κB [51-53] and regulate inflammation through TLR4 [54]. Furthermore, MMR-Lobe-Cy treatment in rabbit atheroma significantly enhanced ABCA1 levels and inhibited TLR4 expression compared to oral lobeglitazone and saline control. As PPARγ activation enhanced the ABCA1 expression and attenuated the TLR4 expression through modulation of macrophage membrane lipid rafts that coordinate various signaling pathways [50, 55, 56], MMR-Lobe-Cy taken up by plaque macrophages could specifically activate PPARγ pathway, resulting in acute suppression of inflammatory activity through blocking of NF-κB and ABCA1-mediated inhibition of TLR4/NF-κB signaling. Taken together, these results suggest the underlying mechanism of MMR-Lobe-Cy inducible anti-inflammatory effects on atheroma, supported by increased ABCA1 expression and blocked TLR4/NF-κB-dependent inflammatory pathway, and also reduction of MCP-1 (Figure 5E).
Metabolic parameters following MMR-Lobe-Cy treatment
Body weight, blood glucose levels, and lipid profiles of the subjects were measured to assess systemic metabolic influences of MMR-Lobe-Cy. There were no significant differences in body weights, blood glucose levels, and lipid levels among the three groups at the end of the experiments (Figure S4), indicating that MMR-Lobe-Cy does not cause metabolic side effects.
Biosafety of MMR-Lobe-Cy
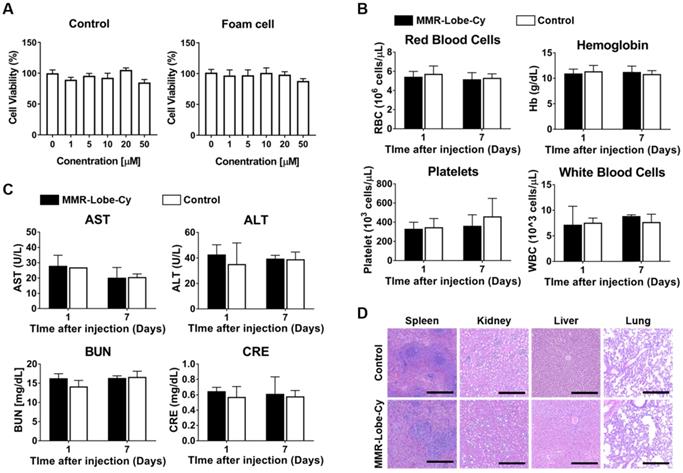
To evaluate the biosafety of MMR-Lobe-Cy, we performed cell viability assay, comprehensive blood test, and histological analysis. As shown in Figure 6A, by CCK-8 assay, MMR-Lobe-Cy was not toxic up to a concentration containing 50 μM of lobeglitazone in both macrophages and foam cells (P > 0.05). Complete blood count data collected twice from the rabbits injected with either saline or a single dose of MMR-Lobe-Cy (10 mg/kg) at 1 day and 1 week after the injection showed no significant differences in white blood cells, red blood cells, hemoglobin, and platelets between saline vs. MMR-Lobe-Cy treated rabbits (Figure 6B). Blood chemistry analysis also revealed no signs of hepatic or renal toxicity in MMR-Lobe-Cy group as compared to the control group (Figure 6C). The rabbits used for the comprehensive blood testing were sacrificed after 1 week, and their spleen, kidney, liver, and lung were immediately harvested for the histopathological examination. As shown in Figure 6D, there were no evidence of damage or impairment in the tissues. These data indicate that MMR-Lobe-Cy at a dose of 10 mg/kg causes no harmful effects on liver, kidney and other major organs. The backbone of MMR-Lobe-Cy was composed of biologically safe components, including DOCA, PEG, and chitosan. DOCA is approved for submental fat reduction [57], and PEGlyated lipid is currently used as an excipient in two types of mRNA-based SARS-CoV-2 vaccines manufactured by the Moderna and Pfizer-BioNTech [58]. Chitosan is considered as a GRAS (Generally Recognized as Safe) compound, and numbers of clinical studies are ongoing to investigate the biocompatibility, safety, and efficacy of chitosan-based nanoparticles [59, 60]. Furthermore, our toxicity assay has provided that MMR-Lobe-Cy has negligible effects on body weight, hematological, biochemical, and histological profiles in vivo (Figure 6). While further studies are required to clarify the quality, safety, and efficacy of our scale-up agent, we believe that MMR-Lobe-Cy has high translational potential for the clinical application.
Biosafety assessment of MMR-Lobe-Cy. (A) Effect of MMR-Lobe-Cy on the viability of control cells (RAW264.7 without treatment) and foam cells (RAW264.7 with LPS and LDL). The concentration refers to the amount of loaded lobeglitazone. Data are presented as mean ± standard error of the mean (n = 4). (B, C) Eight rabbits were injected with either normal saline (n = 4) or 10 mg/kg of MMR-Lobe-Cy (n = 4). Blood was collected at 1 and 7 days after the injection. (B) Complete blood counts showed no effects of MMR-Lobe-Cy on red blood cells, hemoglobin, platelets and white blood cells. (C) Biochemistry analysis of AST, ALT, BUN and CRE. (D) Histological analysis of spleen, kidney, liver and lung from rabbits 7 days after the MMR-Lobe-Cy injection. Scale bar, 100 µm. P-values were calculated by Mann-Whitney U tests (two sided). RBC, red blood cells; Hb, hemoglobin; WBC, white blood cell; AST, aspartate aminotransferase; ALT, alanine transaminase; BUN, blood urea nitrogen; CRE, creatinine.
Ultimate shift of plaque composition to a more stable phenotype by MMR-Lobe-Cy
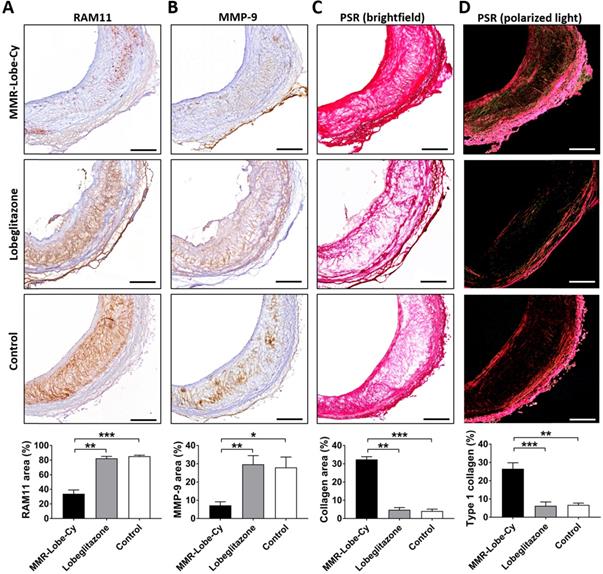
To evaluate whether the anti-inflammatory effects of MMR-Lobe-Cy influence plaque composition, we performed the immunostainings of RAM11 and MMP-9, and the histological staining of collagen in sister sections of the rabbits treated with MMR-Lobe-Cy, lobeglitazone or saline at Day 14 (Figure S5). The atheroma immunostained with anti-RAM11 antibody exhibited a robust macrophage depletion in the MMR-Lobe-Cy treated rabbits (% area, 33.89 ± 5.24) as compared to oral lobeglitazone (% area, 82.48 ± 2.63, P < 0.01) and control groups (% area, 85.39 ± 1.40, P < 0.001) (Figure 7A). Similarly, MMP-9 expression decreased markedly within the plaques of MMR-Lobe-Cy group (% area, 7.21 ± 1.96) compared to those of oral lobeglitazone (% area, 29.72 ± 4.78, P < 0.01) and control groups (% area, 28.03 ± 5.68, P < 0.05) (Figure 7B). Intriguingly, brightfield images of PSR staining showed a greater amount of collagen within the plaques of MMR-Lobe-Cy group (% area, 32.37 ± 1.52) than those of oral lobeglitazone (% area, 4.78 ± 1.22, P < 0.01) and control groups (% area, 4.12 ± 1.03, P < 0.001) (Figure 7C). These changes of collagen contents were observed only at Day 14, whereas there were no changes in collagen contents at Day 7. In particular, the amount of collagen type I, as assessed by polarized light microscopic analysis, was significantly increased in the MMR-Lobe-Cy-treated plaques (% area, 26.56 ± 3.30) compared to those in the lobeglitazone (% area, 6.24 ± 2.14, P < 0.001) and saline-treated lesions (% area, 6.74 ± 1.01, P < 0.01) (Figure 7D). It is well-known that infiltrated macrophages in plaques are the key sources of matrix metalloproteinases which contribute to the degradation of interstitial collagen, leading to plaque rupture [12, 61]. Interestingly, at 2 weeks of MMR-Lobe-Cy treatment, in vivo histological staining data showed a diminished macrophages and MMP-9 expression with an increase of type I collagen matrix, whereas similar effects of oral pioglitazone on murine atheroma required a long-term administration over 8 weeks [62]. These findings suggest that the plaques in MMR-Lobe-Cy treated group were more fibrotic compared to those in oral lobegltiazone and controls, and accordingly, it appears that current MMR-Lobe-Cy treatment substantially enhances the plaque stability by reduction of inflammation including macrophage infiltration and matrix metalloproteinase activity, and also increase of collagen contents, particularly, type I. Taken together, we suggest that MMR-Lobe-Cy treatment enabling a rapid shift of high-risk plaque into a more stabilized atheroma could be a promising therapeutic opportunity for cardiovascular disease, particularly in the acute settings.
In vivo evaluation of macrophage contents, protease expression, and collagen contents in rabbit atheroma after 14 days of MMR-Lobe-Cy treatment. Comparison of (A) RAM11 macrophage contents and (B) MMP-9 expression in rabbit atheroma. PSR-stained plaques imaged with (C) brightfield microscopy to show total collagen contents and (D) polarized microscopy to evaluate collagen type I contents. n = 3 segments per rabbit, n = 3 rabbits per group. Scale bar, 200 µm. *P < 0.05, **P < 0.01, and ***P < 0.001 by Kruskal-Wallis test followed by Mann-Whitney U test with Bonferroni correction.
Limitations
Despite providing intriguing data, the current study has still limitations. First, MMRs could be associated with alternatively activated macrophages, although they are also present in high-risk plaques such as thin-cap fibroatheroma [63], plaques with neovascularization and intraplaque hemorrhages [64, 65]. However, this dichroic classification which chiefly relies on cell surface markers is still an issue due to a plasticity of both surface markers and M1/M2 markers [66]. Additionally, a heterogeneous spectrum of macrophage phenotypes between anti- and pro-inflammatory poles has imperfect implications for the translation of mouse to large animals [67, 68]. Considering that MMR-Lobe-Cy ultimately transformed the high-risk plaque to a more stable one, MMR-positive macrophages may serve as an effective carrier to deliver the PPARγ agonist to the high-risk plaques beyond M2 macrophages and we speculate that MMR-Lobe-Cy treatment has overall favorable effects on the inflamed coronary atheroma, albeit further research regarding the long-term effects of MMR-Lobe on macrophage plasticity is needed. Second, rabbits were fed with normal diet after treatment of MMR-Lobe-Cy to avoid the cholesterol-mediated hepatotoxicity. Given that the low-density lipoprotein cholesterol (LDL-C) induces inflammation in the arterial wall [69, 70], switching from high cholesterol to normal diet could potentially reduce LDL-C levels and further promote attenuation of plaque inflammation. Despite concerns about normal diet supplementation, average serum LDL-cholesterol levels of these rabbits after 1 week were 376 mg/dL (Figure S4), which was as nearly twice as much as even severe hypercholesterolemic patients (> 190 mg/dL) [71]. Furthermore, by serial OCT-NIRF imagings, inflammatory activity along the aortic wall significantly increased in the same rabbit models injected with saline (Figure 3D and 3E). Taken together, we assume that the acute anti-inflammatory effects were mainly attributed to the treatment of MMR-Lobe-Cy rather than a short period dietary change.
Conclusion
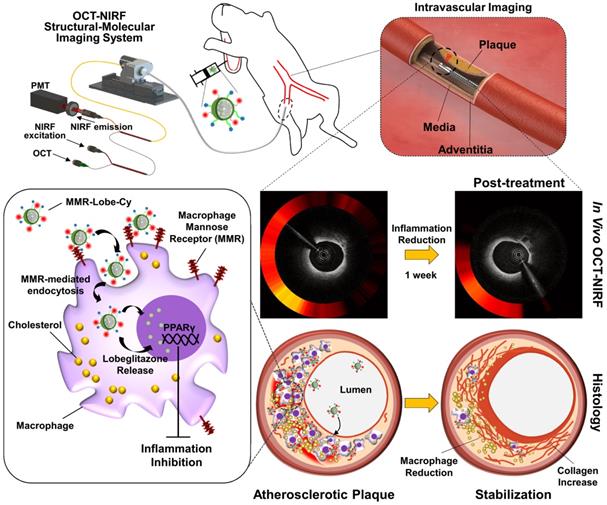
In conclusion, our targeted theranostic agent, MMR-Lobe-Cy, showed a robust acute anti-inflammatory effects on inflamed plaque in coronary-sized arteries by inhibition of TLR4/NF-κB pathway, and shifted the plaque composition to a stable phenotype, which was successfully assessed by our integrated OCT-NIRF imaging (Figure 8). This approach could be an innovative strategy for management of cardiovascular disease in acute settings, with translational implications for high-risk plaques.
Schematic illustration of in vivo OCT-NIRF imaging for monitoring vascular inflammation and simultaneous drug delivery for plaque stabilization using a theranostic nanodrug, MMR-Lobe-Cy. In vivo intravascular OCT-NIRF catheter imaging was performed to monitor early inflammation responses in plaques in coronary-sized arteries after MMR-Lobe-Cy treatment in atheromatous rabbit. Due to the strong binding affinity to mannose receptors, MMR-Lobe-Cy is internalized into plaque macrophages and foam cells. After the uptake into the cells, MMR-Lobe-Cy releases the drug (lobeglitazone) and activates PPARγ pathway, leading to the inflammation inhibition in plaque lesions. Rapid reduction of inflammation by MMR-Lobe-Cy leads to subsequently change the atheroma into a macrophage-poor and collagen-rich stable plaque phenotype. PMT, photomultiplier tube.
Abbreviations
MMR: macrophage mannose receptor; Lobe: lobeglitazone; PPARγ: peroxisome proliferator-activated gamma; OCT: optical coherence tomography; NIRF: near-infrared fluorescence; FRI: fluorescence reflectance imaging; TLR4: toll-like receptor-4; NF-κB: nuclear factor-κB; PET: positron emission tomography; CT: computed tomography; LPS: lipopolysaccharide; LDL: low-density lipoprotein; CLSFM: confocal laser-scanning fluorescence microscope; MCP-1: monocyte chemoattractant protein-1; MMP-9: matrix metalloproteinase-9; IL-1β: interleukin-1β; IL-6: interleukin-6; TCHO: total cholesterol; TG: triglycerides; HDL: high-density lipoprotein; pTBR: plaque target-to-background ratio; FM: fluorescence microscope; IHC: immunohistochemistry; ABCA1: ATP-binding cassette subfamily A member 1; UV-Vis: ultraviolet-visible; PPRE: PPAR response element; NF-κB RE: NF-κB response element.
Supplementary Material
Supplementary figures and tables.
Supplementary movie S1.
Supplementary movie S2.
Supplementary movie S3.
Acknowledgements
This work was supported by the National Research Foundation of Korea (NRF-2018R1A2B3002001 to J.W.K, K.P. and NRF-2019M3A9E2066882 to H.Y, J.W.K and K.P.). This work was supported by the Korea Medical Device Development Fund grant funded by the Korea government (the Ministry of Science and ICT, the Ministry of Trade, Industry and Energy, the Ministry of Health & Welfare, the Ministry of Food and Drug Safety) (1711138039, KMDF_PR_20200901_0054-02 to J.W.K and H.Y.). We thank Dr. Min Woo Lee for 3D images of schematic summary illustration, and Soovin Lee for veterinary assistance.
Competing Interests
The authors have declared that no competing interest exists.
References
1. Libby P, Tabas I, Fredman G, Fisher EA. Inflammation and its resolution as determinants of acute coronary syndromes. Circ Res. 2014;114:1867-79
2. Gili S, Iannaccone M, Colombo F, Montefusco A, Amabile N, Calcagno S. et al. Effects of statins on plaque rupture assessed by optical coherence tomography in patients presenting with acute coronary syndromes: insights from the optical coherence tomography (OCT)-FORMIDABLE registry. Eur Heart J Cardiovasc Imaging. 2018;19:524-31
3. Komukai K, Kubo T, Kitabata H, Matsuo Y, Ozaki Y, Takarada S. et al. Effect of atorvastatin therapy on fibrous cap thickness in coronary atherosclerotic plaque as assessed by optical coherence tomography: the EASY-FIT study. Journal of the American College of Cardiology. 2014;64:2207-17
4. Nicholls SJ, Ballantyne CM, Barter PJ, Chapman MJ, Erbel RM, Libby P. et al. Effect of two intensive statin regimens on progression of coronary disease. N Engl J Med. 2011;365:2078-87
5. Nissen SE, Tuzcu EM, Schoenhagen P, Crowe T, Sasiela WJ, Tsai J. et al. Statin therapy, LDL cholesterol, C-reactive protein, and coronary artery disease. N Engl J Med. 2005;352:29-38
6. Tawakol A, Fayad ZA, Mogg R, Alon A, Klimas MT, Dansky H. et al. Intensification of statin therapy results in a rapid reduction in atherosclerotic inflammation: results of a multicenter fluorodeoxyglucose-positron emission tomography/computed tomography feasibility study. Journal of the American College of Cardiology. 2013;62:909-17
7. Berwanger O, Santucci EV, de Barros ESPGM, Jesuino IA, Damiani LP, Barbosa LM. et al. Effect of Loading Dose of Atorvastatin Prior to Planned Percutaneous Coronary Intervention on Major Adverse Cardiovascular Events in Acute Coronary Syndrome: The SECURE-PCI Randomized Clinical Trial. Jama. 2018;319:1331-40
8. Patti G, Cannon CP, Murphy SA, Mega S, Pasceri V, Briguori C. et al. Clinical benefit of statin pretreatment in patients undergoing percutaneous coronary intervention: a collaborative patient-level meta-analysis of 13 randomized studies. Circulation. 2011;123:1622-32
9. Patti G, Pasceri V, Colonna G, Miglionico M, Fischetti D, Sardella G. et al. Atorvastatin pretreatment improves outcomes in patients with acute coronary syndromes undergoing early percutaneous coronary intervention: results of the ARMYDA-ACS randomized trial. Journal of the American College of Cardiology. 2007;49:1272-8
10. Moore KJ. Targeting inflammation in CVD: advances and challenges. Nature reviews Cardiology. 2019;16:74-5
11. Geovanini GR, Libby P. Atherosclerosis and inflammation: overview and updates. Clinical science (London, England: 1979). 2018;132:1243-52
12. Newby AC. Metalloproteinase production from macrophages - a perfect storm leading to atherosclerotic plaque rupture and myocardial infarction. Experimental physiology. 2016;101:1327-37
13. Libby P, Ridker PM, Hansson GK, Leducq Transatlantic Network on A. Inflammation in atherosclerosis: from pathophysiology to practice. Journal of the American College of Cardiology. 2009;54:2129-38
14. Chandra M, Miriyala S, Panchatcharam M. PPARgamma and Its Role in Cardiovascular Diseases. PPAR Res. 2017;2017:6404638
15. Bejarano J, Navarro-Marquez M, Morales-Zavala F, Morales JO, Garcia-Carvajal I, Araya-Fuentes E. et al. Nanoparticles for diagnosis and therapy of atherosclerosis and myocardial infarction: evolution toward prospective theranostic approaches. Theranostics. 2018;8:4710-32
16. Ma S, Motevalli SM, Chen J, Xu MQ, Wang Y, Feng J. et al. Precise theranostic nanomedicines for inhibiting vulnerable atherosclerotic plaque progression through regulation of vascular smooth muscle cell phenotype switching. Theranostics. 2018;8:3693-706
17. Manzari MT, Shamay Y, Kiguchi H, Rosen N, Scaltriti M, Heller DA. Targeted drug delivery strategies for precision medicines. Nature Reviews Materials. 2021;6:351-70
18. Gao C, Huang Q, Liu C, Kwong CHT, Yue L, Wan JB. et al. Treatment of atherosclerosis by macrophage-biomimetic nanoparticles via targeted pharmacotherapy and sequestration of proinflammatory cytokines. Nat Commun. 2020;11:2622
19. Li R, He Y, Zhang S, Qin J, Wang J. Cell membrane-based nanoparticles: a new biomimetic platform for tumor diagnosis and treatment. Acta Pharm Sin B. 2018;8:14-22
20. Wang Y, Zhang K, Li T, Maruf A, Qin X, Luo L. et al. Macrophage membrane functionalized biomimetic nanoparticles for targeted anti-atherosclerosis applications. Theranostics. 2021;11:164-80
21. Shang Y, Ma C, Zhang J, Wang Z, Ren C, Luo X. et al. Bifunctional supramolecular nanofiber inhibits atherosclerosis by enhancing plaque stability and anti-inflammation in apoE(-/-) mice. Theranostics. 2020;10:10231-44
22. Choi JY, Ryu J, Kim HJ, Song JW, Jeon JH, Lee DH. et al. Therapeutic Effects of Targeted PPAR Activation on Inflamed High-Risk Plaques Assessed by Serial Optical Imaging In vivo. Theranostics. 2018;8:45-60
23. Kim JB, Park K, Ryu J, Lee JJ, Lee MW, Cho HS. et al. Intravascular optical imaging of high-risk plaques in vivo by targeting macrophage mannose receptors. Sci Rep. 2016;6:22608
24. Kim S, Lee MW, Kim TS, Song JW, Nam HS, Cho HS. et al. Intracoronary dual-modal optical coherence tomography-near-infrared fluorescence structural-molecular imaging with a clinical dose of indocyanine green for the assessment of high-risk plaques and stent-associated inflammation in a beating coronary artery. Eur Heart J. 2016;37:2833-44
25. Lee JJ, Lee MW, Kim TS, Song JW, Nam HS, Oh DJ. et al. Intravascular Optical Molecular Imaging of a Macrophage Subset Within Intraplaque Hemorrhages. JACC Cardiovasc Imaging. 2018;11:371-2
26. Lee S, Lee MW, Cho HS, Song JW, Nam HS, Oh DJ. et al. Fully integrated high-speed intravascular optical coherence tomography/near-infrared fluorescence structural/molecular imaging in vivo using a clinically available near-infrared fluorescence-emitting indocyanine green to detect inflamed lipid-rich atheromata in coronary-sized vessels. Circ Cardiovasc Interv. 2014;7:560-9
27. Yoo H, Kim JW, Shishkov M, Namati E, Morse T, Shubochkin R. et al. Intra-arterial catheter for simultaneous microstructural and molecular imaging in vivo. Nature medicine. 2011;17:1680-4
28. Tong W, Hui H, Shang W, Zhang Y, Tian F, Ma Q. et al. Highly sensitive magnetic particle imaging of vulnerable atherosclerotic plaque with active myeloperoxidase-targeted nanoparticles. Theranostics. 2021;11:506-21
29. Lee JH, Noh CK, Yim CS, Jeong YS, Ahn SH, Lee W. et al. Kinetics of the Absorption, Distribution, Metabolism, and Excretion of Lobeglitazone, a Novel Activator of Peroxisome Proliferator-Activated Receptor Gamma in Rats. Journal of pharmaceutical sciences. 2015;104:3049-59
30. Nam HS, Kim CS, Lee JJ, Song JW, Kim JW, Yoo H. Automated detection of vessel lumen and stent struts in intravascular optical coherence tomography to evaluate stent apposition and neointimal coverage. Med Phys. 2016;43:1662
31. Ughi GJ, Verjans J, Fard AM, Wang H, Osborn E, Hara T. et al. Dual modality intravascular optical coherence tomography (OCT) and near-infrared fluorescence (NIRF) imaging: a fully automated algorithm for the distance-calibration of NIRF signal intensity for quantitative molecular imaging. The international journal of cardiovascular imaging. 2015;31:259-68
32. Varghese F, Bukhari AB, Malhotra R, De A. IHC Profiler: an open source plugin for the quantitative evaluation and automated scoring of immunohistochemistry images of human tissue samples. PLoS One. 2014;9:e96801
33. Feinberg H, Jegouzo SAF, Lasanajak Y, Smith DF, Drickamer K, Weis WI. et al. Structural analysis of carbohydrate binding by the macrophage mannose receptor CD206. J Biol Chem. 2021;296:100368
34. Ohsumi Y, Chen VJ, Bettyyan S-C, Wold F, Lee YC. Interaction between new neoglycoproteins and thed-Man/l-fuc receptor of rabbit alveolar macrophages. Glycoconjugate Journal. 1988;5:99-106
35. Shepherd VL, Lee YC, Schlesinger PH, Stahl PD. L-Fucose-terminated glycoconjugates are recognized by pinocytosis receptors on macrophages. Proceedings of the National Academy of Sciences of the United States of America. 1981;78:1019-22
36. Stahl PD, Rodman JS, Miller MJ, Schlesinger PH. Evidence for receptor-mediated binding of glycoproteins, glycoconjugates, and lysosomal glycosidases by alveolar macrophages. Proceedings of the National Academy of Sciences of the United States of America. 1978;75:1399-403
37. Zamze S, Martinez-Pomares L, Jones H, Taylor PR, Stillion RJ, Gordon S. et al. Recognition of bacterial capsular polysaccharides and lipopolysaccharides by the macrophage mannose receptor. J Biol Chem. 2002;277:41613-23
38. sCole AJ, David AE, Wang J, Galban CJ, Yang VC. Magnetic brain tumor targeting and biodistribution of long-circulating PEG-modified, cross-linked starch-coated iron oxide nanoparticles. Biomaterials. 2011;32:6291-301
39. Pasut G, Veronese FM. State of the art in PEGylation: the great versatility achieved after forty years of research. J Control Release. 2012;161:461-72
40. Samuelsson E, Shen H, Blanco E, Ferrari M, Wolfram J. Contribution of Kupffer cells to liposome accumulation in the liver. Colloids and surfaces B, Biointerfaces. 2017;158:356-62
41. Weissleder R, Nahrendorf M, Pittet MJ. Imaging macrophages with nanoparticles. Nat Mater. 2014;13:125-38
42. Vucic E, Dickson SD, Calcagno C, Rudd JH, Moshier E, Hayashi K. et al. Pioglitazone modulates vascular inflammation in atherosclerotic rabbits noninvasive assessment with FDG-PET-CT and dynamic contrast-enhanced MR imaging. JACC Cardiovasc Imaging. 2011;4:1100-9
43. Dana N, Vaseghi G, Haghjooy Javanmard S. Crosstalk between Peroxisome Proliferator-Activated Receptors and Toll-Like Receptors: A Systematic Review. Adv Pharm Bull. 2019;9:12-21
44. Scirpo R, Fiorotto R, Villani A, Amenduni M, Spirli C, Strazzabosco M. Stimulation of nuclear receptor PPAR-γ limits NF-kB-dependent inflammation in mouse cystic fibrosis biliary epithelium. Hepatology (Baltimore, Md). 2015;62:1551
45. Shen W, Gao Y, Lu B, Zhang Q, Hu Y, Chen Y. Negatively regulating TLR4/NF-kappaB signaling via PPARalpha in endotoxin-induced uveitis. Biochimica et biophysica acta. 2014;1842:1109-20
46. Ikeda U, Matsui K, Murakami Y, Shimada K. Monocyte chemoattractant protein-1 and coronary artery disease. Clin Cardiol. 2002;25:143-7
47. Hulsmans M, Geeraert B, Arnould T, Tsatsanis C, Holvoet P. PPAR agonist-induced reduction of Mcp1 in atherosclerotic plaques of obese, insulin-resistant mice depends on adiponectin-induced Irak3 expression. PLoS One. 2013;8:e62253
48. Lin J, Kakkar V, Lu X. Impact of MCP-1 in atherosclerosis. Current pharmaceutical design. 2014;20:4580-8
49. Deshmane SL, Kremlev S, Amini S, Sawaya BE. Monocyte chemoattractant protein-1 (MCP-1): an overview. J Interferon Cytokine Res. 2009;29:313-26
50. Yvan-Charvet L, Welch C, Pagler TA, Ranalletta M, Lamkanfi M, Han S. et al. Increased inflammatory gene expression in ABC transporter-deficient macrophages: free cholesterol accumulation, increased signaling via toll-like receptors, and neutrophil infiltration of atherosclerotic lesions. Circulation. 2008;118:1837-47
51. Daynes RA, Jones DC. Emerging roles of PPARs in inflammation and immunity. Nat Rev Immunol. 2002;2:748-59
52. Glass CK, Saijo K. Nuclear receptor transrepression pathways that regulate inflammation in macrophages and T cells. Nat Rev Immunol. 2010;10:365-76
53. Liu T, Zhang L, Joo D, Sun SC. NF-kappaB signaling in inflammation. Signal Transduct Target Ther. 2017;2:17023
54. Ji Y, Liu J, Wang Z, Liu N, Gou W. PPARgamma agonist, rosiglitazone, regulates angiotensin II-induced vascular inflammation through the TLR4-dependent signaling pathway. Lab Invest. 2009;89:887-902
55. Moore KJ, Koplev S, Fisher EA, Tabas I, Bjorkegren JLM, Doran AC. et al. Macrophage Trafficking, Inflammatory Resolution, and Genomics in Atherosclerosis: JACC Macrophage in CVD Series (Part 2). Journal of the American College of Cardiology. 2018;72:2181-97
56. Fessler MB, Parks JS. Intracellular lipid flux and membrane microdomains as organizing principles in inflammatory cell signaling. J Immunol. 2011;187:1529-35
57. Jones DH, Carruthers J, Joseph JH, Callender VD, Walker P, Lee DR. et al. REFINE-1, a Multicenter, Randomized, Double-Blind, Placebo-Controlled, Phase 3 Trial With ATX-101, an Injectable Drug for Submental Fat Reduction. Dermatol Surg. 2016;42:38-49
58. Let's talk about lipid nanoparticles. Nature Reviews Materials. 2021; 6: 99-.
59. Bellich B, D'Agostino I, Semeraro S, Gamini A, Cesaro A. “The Good, the Bad and the Ugly” of Chitosans. Mar Drugs. 2016;14:99
60. Garg U, Chauhan S, Nagaich U, Jain N. Current Advances in Chitosan Nanoparticles Based Drug Delivery and Targeting. Adv Pharm Bull. 2019;9:195-204
61. Libby P. Collagenases and cracks in the plaque. J Clin Invest. 2013;123:3201-3
62. Chang K, Francis SA, Aikawa E, Figueiredo JL, Kohler RH, McCarthy JR. et al. Pioglitazone suppresses inflammation in vivo in murine carotid atherosclerosis: novel detection by dual-target fluorescence molecular imaging. Arterioscler Thromb Vasc Biol. 2010;30:1933-9
63. Tahara N, Mukherjee J, de Haas HJ, Petrov AD, Tawakol A, Haider N. et al. 2-deoxy-2-[18F]fluoro-D-mannose positron emission tomography imaging in atherosclerosis. Nature medicine. 2014;20:215-9
64. Chinetti-Gbaguidi G, Colin S, Staels B. Macrophage subsets in atherosclerosis. Nature reviews Cardiology. 2015;12:10-7
65. Finn AV, Nakano M, Polavarapu R, Karmali V, Saeed O, Zhao X. et al. Hemoglobin directs macrophage differentiation and prevents foam cell formation in human atherosclerotic plaques. Journal of the American College of Cardiology. 2012;59:166-77
66. Lavine KJ, Pinto AR, Epelman S, Kopecky BJ, Clemente-Casares X, Godwin J. et al. The Macrophage in Cardiac Homeostasis and Disease: JACC Macrophage in CVD Series (Part 4). Journal of the American College of Cardiology. 2018;72:2213-30
67. Murray PJ, Allen JE, Biswas SK, Fisher EA, Gilroy DW, Goerdt S. et al. Macrophage activation and polarization: nomenclature and experimental guidelines. Immunity. 2014;41:14-20
68. Murray PJ, Wynn TA. Obstacles and opportunities for understanding macrophage polarization. J Leukoc Biol. 2011;89:557-63
69. Jukema RA, Ahmed TAN, Tardif JC. Does low-density lipoprotein cholesterol induce inflammation? If so, does it matter? Current insights and future perspectives for novel therapies. BMC Med. 2019;17:197
70. Tall AR, Yvan-Charvet L. Cholesterol, inflammation and innate immunity. Nat Rev Immunol. 2015;15:104-16
71. Grundy SM, Stone NJ, Bailey AL, Beam C, Birtcher KK, Blumenthal RS. et al. 2018 AHA/ACC/AACVPR/AAPA/ABC/ACPM/ADA/AGS/APhA/ASPC/NLA/PCNA Guideline on the Management of Blood Cholesterol: A Report of the American College of Cardiology/American Heart Association Task Force on Clinical Practice Guidelines. Circulation. 2019;139:e1082-e143
Author contact
![]() Corresponding authors: Jin Won Kim, M.D., Ph.D., F.A.C.C. (Cardiovascular Center, Korea University Guro Hospital, 148, Gurodong-ro, Guro-gu, Seoul 08308, Korea, Tel: 82-2-2626-3021, Fax: 82-2-863-1109, E-mail: kjwmmac.kr); Kyeongsoon Park, Ph.D. (Department of Systems Biotechnology, College of Biotechnology and Natural Resources, Chung-Ang University, Anseong, Gyeonggi-do, 17546, Korea, Tel: 82-31-670-3357. Fax: 82-31-675-1381, E-mail: kspark1223ac.kr); Hongki Yoo, Ph.D. (Department of Mechanical Engineering, KAIST, 291 Daehak-ro, Yuseong-gu, Daejeon 305-701, Korea, Tel: 82-42-350-3243, E-mail: h.yooac.kr).
Corresponding authors: Jin Won Kim, M.D., Ph.D., F.A.C.C. (Cardiovascular Center, Korea University Guro Hospital, 148, Gurodong-ro, Guro-gu, Seoul 08308, Korea, Tel: 82-2-2626-3021, Fax: 82-2-863-1109, E-mail: kjwmmac.kr); Kyeongsoon Park, Ph.D. (Department of Systems Biotechnology, College of Biotechnology and Natural Resources, Chung-Ang University, Anseong, Gyeonggi-do, 17546, Korea, Tel: 82-31-670-3357. Fax: 82-31-675-1381, E-mail: kspark1223ac.kr); Hongki Yoo, Ph.D. (Department of Mechanical Engineering, KAIST, 291 Daehak-ro, Yuseong-gu, Daejeon 305-701, Korea, Tel: 82-42-350-3243, E-mail: h.yooac.kr).