Impact Factor
- Issue 14; 2026
- Issue 13; 2026
- Issue 12; 2026
- Issue 11; 2026
- Issue 10; 2026
- Volume 16; 2026
- Advance Articles
- Past Issues
- Cover Images
- Cover Suggestion
- Index & Coverage
- Special Issues
Introduction
Results
Discussion
Materials and methods
Supplementary Material
Acknowledgements
References
International Journal of Biological Sciences
International Journal of Medical Sciences
 Global reach, higher impact

Theranostics 2021; 11(19):9503-9518. doi:10.7150/thno.63992 This issue Cite
Research Paper
The kinase PDK1 regulates regulatory T cell survival via controlling redox homeostasis
Peiran Feng1,2#, Quanli Yang1,2#, Liang Luo1,2, Yadong Sun1,2, Wenkai Lv1,2, Shuo Wan1,2, Zerong Guan1,2, Zhiqiang Xiao1,2, Feng Liu1,2, Zehua Li3, Zhongjun Dong3 ![]() , Meixiang Yang1,2
, Meixiang Yang1,2 ![]()
1. Zhuhai Institute of Translational Medicine, Zhuhai People's Hospital (Zhuhai Hospital Affiliated with Jinan University), Jinan University, Zhuhai, Guangdong, 519000, China.
2. The Biomedical Translational Research Institute, Faculty of Medical Science, Jinan University, Guangzhou, Guangdong, 510632, China.
3. School of Medicine and Institute for Immunology, Tsinghua University, Beijing Key Lab for Immunological Research on Chronic Diseases, Tsinghua University, Beijing, 100084, China.
#Co-first authors.
Received 2021-6-17; Accepted 2021-8-29; Published 2021-9-13
Abstract

Rationale: Regulatory T cells (Treg cells) play an important role in maintaining peripheral tolerance by suppressing over-activation of effector T cells. The kinase PDK1 plays a pivotal role in conventional T cell development. However, whether PDK1 signaling affects the homeostasis and function of Treg cells remains elusive.
Methods: In order to evaluate the role of PDK1 in Treg cells from a genetic perspective, mice carrying the floxed PDK1 allele were crossbred with Foxp3Cre mice to efficiently deleted PDK1 in Foxp3+ Treg cells. Flow cytometry was used to detect the immune cell homeostasis of WT and PDK1fl/flFoxp3Cre mice. RNA-seq was used to assess the differences in transcriptional expression profile of WT and PDK1-deficient Treg cells. The metabolic profiles of WT and PDK1-deficient Treg cells were tested using the Glycolysis Stress Test and Mito Stress Test Kits by the Seahorse XFe96 Analyser.
Results: PDK1 was essential for the establishment and maintenance of Treg cell homeostasis and function. Disruption of PDK1 in Treg cells led to a spontaneous fatal systemic autoimmune disorder and multi-tissue inflammatory damage, accompanied by a reduction in the number and function of Treg cells. The deletion of PDK1 in Treg cells destroyed the iron ion balance through regulating MEK-ERK signaling and CD71 expression, resulting in excessive production of intracellular ROS, which did not depend on the down-regulation of mTORC1 signaling. Inhibition of excessive ROS, activated MEK-Erk signaling or overload Fe2+ could partially rescue the survival of PDK1-deficient Treg cells.
Conclusion: Our results defined a key finding on the mechanism by which PDK1 regulates Treg cell survival via controlling redox homeostasis.
Keywords: Treg cell, PDK1, ROS, Iron homeostasis, MAPK, Immune cell death
Introduction
Regulatory T cells, defined by expression of the transcription factor Foxp3, play a pivotal role in immune tolerance and tissue homeostasis [1, 2]. Mutation or absence of the gene encoding Foxp3 rapidly results in the development of multiorgan autoimmune disease [3-5]. Conversely, tumors actively recruit Treg cells to limit the anti-tumor immune response and promote angiogenesis and tumor growth [6, 7]. The critical role of Treg cells in immune tolerance has led to great interest in identifying the signals that control the homeostasis and function of Treg cells. Several studies have reported the mechanisms involved in the balance between Treg cell proliferation and apoptosis [8], the dependence of Treg cells on paracrine interleukin-2, transcription factors and metabolic regulators [9, 10].
The serine/threonine kinase 3-phosphoinositide-dependent protein kinase 1 (PDK1) is a critical metabolic regulator connecting PI3K and downstream components of mTOR activation [11]. PDK1 is important for multiple types of immune cell development and function, including T cells, B cells, and NK cells [12-17]. Deletion of PDK1 in T cells via CD4-Cre induced chronic inflammation of intestine with a reduction in the number of Treg cells [18]. Recently, Yu's group reported that PDK1 is critical for of T follicular helper cell homeostasis [19]. However, the regulatory role of PDK1 on Treg cells remains poorly studied.
Reactive oxygen species (ROS) has been shown to be important for T cell differentiation and function [20, 21]. However, excessive ROS is detrimental to cell function and survival [22]. The ROS produced by the Fenton reaction of excessive iron is an important source of cytotoxic ROS. Iron is essential for a wide range of biological processes, such as DNA synthesis, metabolism, and cell proliferation [23]. Cellular iron uptake mainly depends on transferrin receptor protein 1 (TFRC), also known as CD71, which is essential for the maintenance of T cell homeostasis and function. Iron metabolism is also essential for the function of innate immune cells such as macrophages [24]. However, the effect of iron homeostasis on the function and survival of Treg cells, especially the regulatory mechanism of iron homeostasis in Treg cells, is largely unknown.
In this study, we found that disruption of PDK1 in Treg cells resulted in early onset of a fatal inflammatory disease, with substantially decreased number of Treg cells. Importantly, we demonstrated that PDK1-deficient Treg cells produced excessive ROS which may be induced via the PDK1-MEK-ERK-CD71 axis, resulting in iron overload in Treg cells. Collectively, our data demonstrated that PDK1 is indispensable for Treg cell survival and function, which is of great significance to immune homeostasis and tolerance.
Results
Specific deletion of PDK1 in Treg cells leads to lethal inflammation
In this study, we aimed to investigate whether the kinase PDK1 regulates Treg cell biology. We firstly examined the amount of phosphorylated PDK1, which represents the activity of PDK1 in naturally occurring Treg cells in a steady state using a multidimensional, unbiased approach. Based on the mapping of the markers such as CD3, CD4, Foxp3, CD44, CD62L, phosphorylated PDK1S241 and pAKTT308, two-dimensional t-distributed stochastic neighbor embedding (t-SNE) plots were generated for 3 clusters, including naïve T cells (CD3+CD4+ Foxp3-CD62LhiCD44lo), effector T cells (CD3+CD4+ Foxp3-CD62LloCD44hi) and Treg cells (CD3+CD4+ Foxp3+) (Figure 1A). In fact, the amount of pPDK1S241 in Treg cells was relatively higher than that in conventional T cells. Phosphorylation of AKT at Thr 308 and pS6, two representative substrates for PDK1, were also higher expressed in Treg cells (Figure 1A, B). We then examined whether the elevated activity of PDK1 in Treg cells was involved in T-cell activation signaling emanated from TCR plus IL-2 receptor. Indeed, stimulation of Treg cells with anti-CD3/CD28 plus IL-2 significantly increased the amount of phosphorylated PDK1S241 and its two substrates, AKTT308 and pS6 (Figure 1C). Thus, PDK1 activity is highly preserved in resting Treg cells and prepares for TCR plus IL-2 signaling pathway.
Treg cells require PDK1 to suppress spontaneous autoimmunity. (A) Heatmap overlay of Foxp3, CD44, pPDK1 S241, pAKT T308 onto a t-SNE plot generated from splenic CD3+CD4+ T cells in WT mice. (B) Comparison of phosphorylation of PDK1 (S241), S6, and AKT (T308) between naïve T cells (CD4+Foxp3-CD44lo) and Treg cells (CD4+Foxp3+). (C) Comparison of phosphorylation of PDK1 (S241), S6, and AKT (T308) between freshly isolated and activated Treg cells. Mean fluorescent intensity (MFI) is presented above the plot. (D) PDK1 gene expression (qPCR) in Treg cells isolated from wild-type and PDK1fl/flFoxp3Cre mice. (E) Analysis of phosphorylation of pPDK1 S241 in CD4+Foxp3+ Treg cells, CD4+Foxp3- T cells and CD8+ T cells from the spleen of WT and PDK1fl/flFoxp3Cremice. (F) Weight of 35-day-old PDK1+/+Foxp3Cre (WT) and PDK1fl/flFoxp3Cre (KO) mice (n=6). (G) Images of 35-day-old PDK1+/+Foxp3Cre and PDK1fl/flFoxp3Cre mice. Arrows indicate the scaly tail and ulceration of the body. (H) Survival curve of PDK1+/+Foxp3Cre and PDK1fl/flFoxp3Cre mice. (n≥12, P≤0.0001). (I) Representative images of spleen and peripheral lymph nodes from PDK1+/+Foxp3Cre and PDK1fl/flFoxp3Cre mice. (J) Cell numbers of the spleen (left) and peripheral lymph nodes (LN) (right) of PDK1+/+Foxp3Cre and PDK1fl/flFoxp3Cre mice (n≥5). (K) Hematoxylin and eosin staining of skin, colon, lung, pancreas, liver (original magnification, ×10), from 35-day-old PDK1+/+Foxp3Cre and PDK1fl/flFoxp3Cre mice. All results are presented as the mean ± SEM; **P ≤ 0.01; ***P ≤ 0.001; unpaired Student's t test. Data represent three independent experiments.
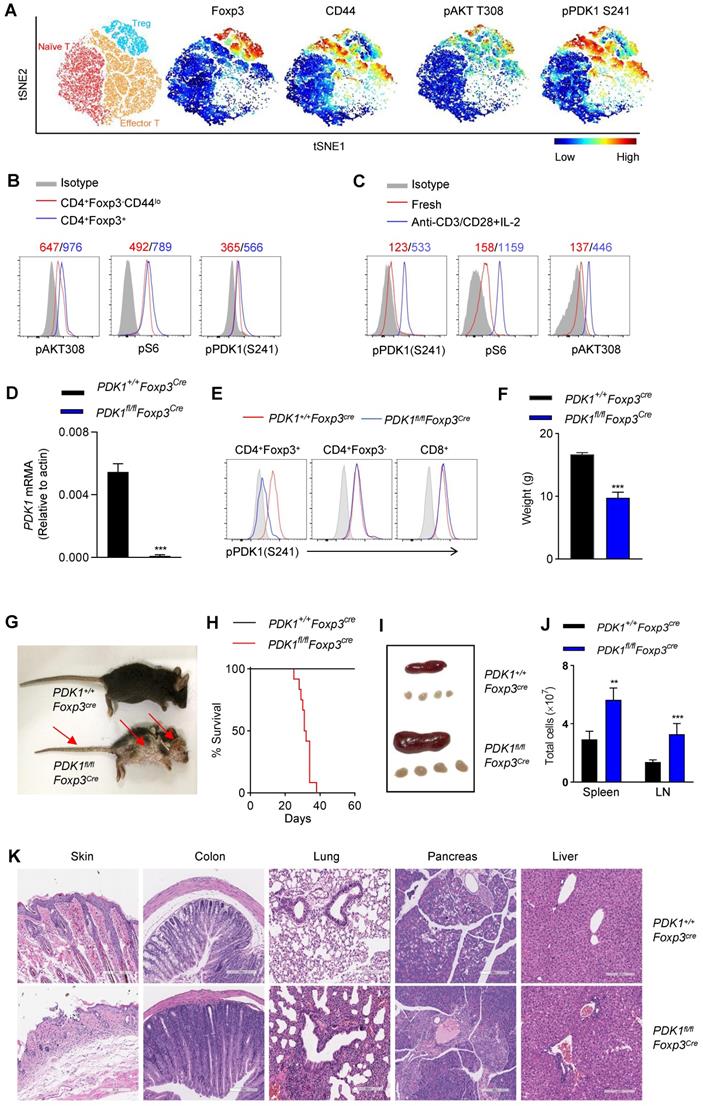
In order to evaluate the role of PDK1 in Treg cells from a genetic perspective, mice carrying the floxed PDK1 allele were crossbred with Foxp3Cre mice. PDK1 was efficiently deleted in Foxp3+ Treg cells of PDK1fl/flFoxp3Cre mice (Figure 1D). Not surprisingly, PDK1 phosphorylation was not detectable in Treg cells lacking PDK1, but it was retained in conventional T cells and CD8+ T cells (Figure 1E).
We first noticed that PDK1fl/flFoxp3Cre mice developed significant weight loss, severe dermatitis with scabs on the ears, eyelids and tail, especially skin ulcers on the head and upper back, along with hair loss, and they eventually died within 6 weeks (Figure 1F-H). PDK1fl/flFoxp3Cre mice showed splenomegaly and subcutaneous lymphadenopathy with increased cell numbers (Figure 1I, J). The loss of PDK1 in Treg cells resulted in thymus atrophy with markedly reduced cellularity (Figure S1A-D). Histological analysis of tissue samples from PDK1fl/flFoxp3Cre mice showed inflammatory cell infiltration in all detected organs (Figure 1K). Together, these phenomena suggest that the absence of PDK1 in Treg cells can lead to early and fatal inflammation.
Deficiency of PDK1 in Treg cells disrupts immune homeostasis
Next, we investigated inflammation-related cellular immunity in PDK1fl/flFoxp3Cre mice. These mice had more T cells in their spleen and the subcutaneous lymph nodes (Figure 2A). Among T cells, the proportion of CD8+ T cells increased, while CD4+ T cell decrease dramatically, resulting in a change in the ratio of CD4+/CD8+ in PDK1fl/flFoxp3Cre mice. Compared with Foxp3Cre mice, the number of CD4+ and CD8+ T cells were significantly increased in PDK1fl/flFoxp3Cre mice (Figure 2B-D). T cells in PDK1fl/flFoxp3Cre mice were enlarged, and Ki-67 was highly expressed (Figure S2A). These cells were also highly expressed with more nutrient receptors, such as CD71 (the transferrin receptor) and CD98 (a subunit of L-amino acid transporter) (Figure S2B). These data suggest that T cells in PDK1fl/flFoxp3Cre mice are highly metabolic and therefore robust proliferating.
Disrupted immune homeostasis in PDK1fl/flFoxp3cre mice. (A) The number of CD3+ T cells in spleen and lymph nodes (LN) from PDK1+/+Foxp3Cre and PDK1fl/flFoxp3Cre mice (n≥7). (B) The ratios of CD4+/CD8+ T cells in spleen and lymph nodes (LN) from PDK1+/+Foxp3Cre and PDK1fl/flFoxp3Cre mice (n=5). (C) CD3+CD8+ T cells percentages (left) and numbers (right) in spleen and lymph nodes (LN) from PDK1+/+Foxp3Cre and PDK1fl/flFoxp3Cre mice (n≥5). (D) CD3+CD4+ T cells percentages (left) and numbers (right) in spleen and lymph nodes (LN) from PDK1+/+Foxp3Cre and PDK1fl/flFoxp3Cre mice (n=5). (E) Heatmap overlay of CD44, CD62L onto a t-SNE plot generated from splenic CD4+ T cells in PDK1+/+Foxp3Cre and PDK1fl/flFoxp3Cre mice. (F) Percentage of naïve CD4+ T cells in total CD4+ T cells in spleen and lymph nodes (LN) from PDK1+/+Foxp3Cre and PDK1fl/flFoxp3Cre mice (n≥6). (G) Heatmap overlay of CD44, CD62L onto a t-SNE plot generated from splenic CD8+ T cells in PDK1+/+Foxp3Cre and PDK1fl/flFoxp3Cre mice. (H) Percentage of naïve CD8+ T cells in total CD8+ T cells in spleen and lymph nodes (LN) from PDK1+/+Foxp3Cre and PDK1fl/flFoxp3Cre mice (n≥6). (I) IFN-γ, IL-17, IL-4 and IL-10 production in CD4+ cells and IFN-γ production in CD8+ cells from PDK1+/+Foxp3Cre and PDK1fl/flFoxp3Cre mice (n≥3). All results are presented as the mean ± SEM; *P ≤ 0.05; **P ≤ 0.01; ***P ≤ 0.001; unpaired Student's t test. Data represent three independent experiments.
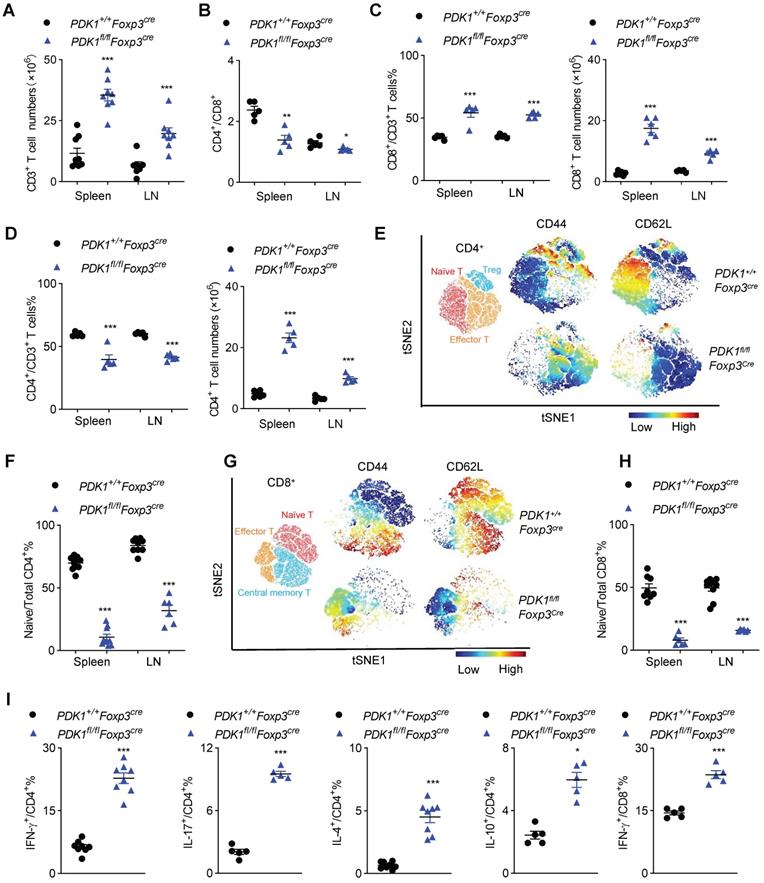
To further characterize T cell subsets, we found that PDK1fl/flFoxp3Cre mice had reduced frequencies of CD62LhiCD44lo naïve T cells (both CD4+ and CD8+) but had increased frequencies of CD62LlowCD44hi memory/effector T cell in the detected spleen and lymph nodes (Figure 2E-H and Figure S2C, D). Furthermore, CD4+ T cells from PDK1fl/flFoxp3Cre mice produced more pro-inflammatory cytokines such as IFN-γ and IL-17, as well as other cytokines like IL-4 and IL-10. IFN-γ-producing CD8+ T cells were also enriched in this genotype (Figure 2I and Figure S2E). Thus, PDK1 deficiency in Treg cells induces T cell subsets to become highly inflammatory.
PDK1 is necessary for Treg cell differentiation and homeostasis
Next, we figured out whether the fetal inflammation in PDK1fl/flFoxp3Cre mice was caused by the imbalance in Treg cell number or its function. Compared with control Foxp3Cre mice, PDK1fl/flFoxp3Cre mice had much lower proportion of YFP+/ Foxp3+ Treg cells among CD4+ T cells in the detected organs (Figure 3A, B and Figure S3A, B). The decrease in the number of Treg cells might not be due to the change in Foxp3 expression level, because the remaining YFP+ Treg cells expressed with a normal amount of Foxp3 (Figure S3C). To rule out the possibility that severe inflammation in PDK1fl/flFoxp3Cre male mice would induce Treg cell activation phenotype, we took advantage of PDK1fl/flFoxp3Cre/+ female mice, where Cre only expressed in half of the Treg cells due to X-chromosome random inactivation. In theory, the half of Treg cells that are YFP+ don't contain PDK1, while the other half Treg cells that are YFP-negative have normal PDK1 expression in PDK1fl/flFoxp3Cre/+ mice. Intriguingly, PDK1fl/flFxop3Cre/+ mice did not develop any symptoms of inflammation disease. Histological analysis of tissue samples from PDK1fl/flFoxp3Cre/+ mice also showed that there was no inflammatory cell infiltration in the detected organs (Figure S4A). The abnormal ratio of CD4+/CD8+ and inflammatory T cell subsets observed in PDK1fl/flFoxp3Cre were never observed in PDK1fl/flFoxp3Cre/+ mice (Figure S4B-D). Therefore, PDK1fl/flFoxp3Cre/+ mice are ideal models to investigate whether severe inflammation in PDK1fl/flFoxp3Cre in turn interferes with Treg cell homeostasis. Compared with the PDK1+/+Foxp3Cre/+ mice, the proportion of YFP-negative Foxp3+ Treg cells in PDK1fl/flFoxp3Cre/+ mice relatively increased, but the proportion and absolute number of YFP-positive Foxp3+ Treg cells dramatically reduced (Figure 3C, D). Notably, we found that as the mice get older, the proportion of YFP+ Treg cells declined progressively (Figure S4E). If we compared YFP+ with YFP- Treg cells in PDK1fl/flFoxp3Cre/+ mice, we clearly noticed that YFP+ cells were much apoptotic and low proliferative (Figure 3E, F and Figure S4F, G). Therefore, although the over-activated phenotype of Treg cells in PDK1fl/flFoxp3Cre mice may be attributed to external inflammation, PDK1 is necessary for Treg cell differentiation and homeostasis, regardless of whether it is related to the inflammatory environment.
Treg cell require PDK1 to maintains its survival and proliferation. (A, B) Representative plots (A) and the average frequency (left) and numbers (right) (B) of CD4+YFP+ Treg cells in spleen, lymph nodes (LN) and thymus from PDK1+/+Foxp3Cre and PDK1fl/flFoxp3Cre mice (3-4 weeks old) (n≥6). (C) The fraction of YFP+ Treg cells among Foxp3+ populations in spleen, lymph nodes (LN) and thymus from heterozygous female PDK1+/+Foxp3Cre/+ and PDK1fl/flFoxp3Cre/+ mice, in which half of the Treg compartment expresses YFP-cre. (D) Treg cells (Foxp3+YFP+) percentages (left) and numbers (right) in spleen , lymph nodes (LN) and thymus from PDK1+/+Foxp3Cre/+ and PDK1fl/flFoxp3Cre/+ mice (n≥6). (E) Expression of Caspase3 in CD4+ Foxp3+YFP- T cells (WT) and CD4+ Foxp3+YFP+ T cells (KO) in spleen and lymph nodes (LN) from PDK1fl/flFoxp3Cre/+ mice (n=6, paired Student's t test). (F) Expression of Ki67 in CD4+YFP+ T cells in CD4+ Foxp3+YFP- T cells (WT) and CD4+ Foxp3+YFP+ T cells (KO) in spleen and lymph nodes (LN) from PDK1fl/flFoxp3Cre/+ mice (n≥3, paired Student's t test). (G) Experimental schematic for in vivo pTreg maintenance assay. (H) Percentages (left) and numbers (right) of donor-derived Foxp3+ pTreg in Rag1-/- mice 2 weeks after adoptive co-transfer of naïve CD4+ T cells isolated from wild-type (CD45.1) and PDK1fl/flFoxp3Cre (CD45.2) mice at 1:1 ratio. (paired Student's t test) (n=5). (I) Heatmap of differentially expressed genes in Treg cells from PDK1+/+Foxp3Cre/+ and PDK1fl/flFoxp3Cre/+ mice. (J) MFI statistic of CTLA-4, ICOS, Helios, GITR in CD4+ Foxp3+YFP- Treg cells (WT) and CD4+Foxp3+YFP+ Treg cells (KO) from PDK1fl/flFoxp3Cre/+ mice. (n=7) (paired Student's t test). (K) Heatmap of expression of CTLA4, GITR, ICOS, Helios of donor-derived Foxp3+ pTreg in Rag1-/- mice 2 weeks after adoptive co-transfer of naïve CD4+ T cells isolated from wild-type (CD45.1) and PDK1fl/flFoxp3Cre (CD45.2) mice at 1:1 ratio (n=6). All results are presented as the mean ± SEM; *P ≤ 0.05; **P ≤ 0.01; ***P ≤ 0.001; unpaired Student's t test. Data represent two independent experiments.
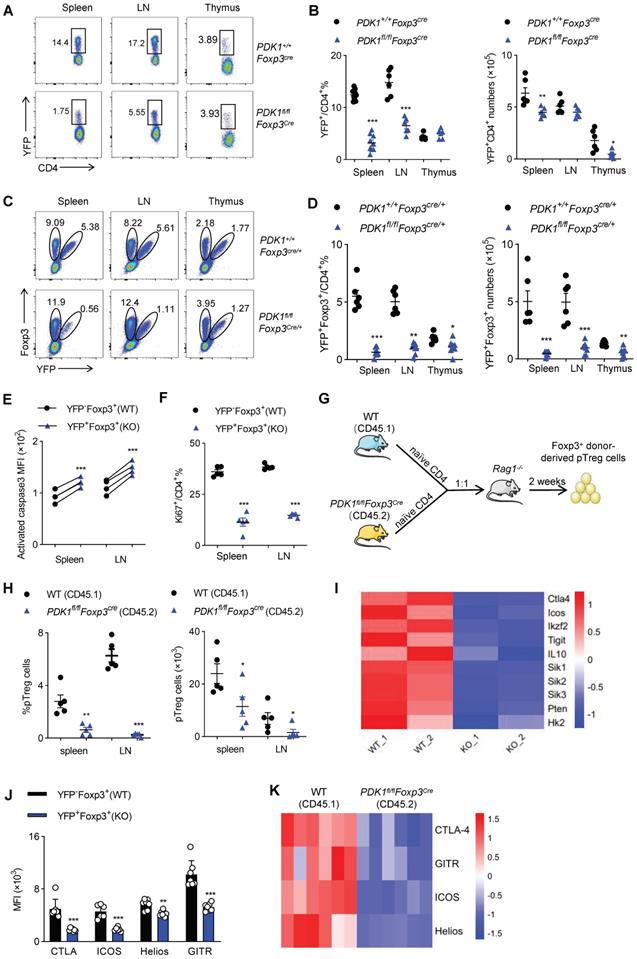
Finally, to verify whether PDK1 is required for inducing and maintaining peripheral Treg (pTreg) cells, naïve YFP-CD4+ T cells isolated from WT (CD45.1) mice or PDK1fl/flFoxp3Cre mice (CD45.2) were adoptively co-transferred into Rag1-/- mice at 1:1 ratio (Figure 3G). In this chimeric experiment, PDK1 was intact in Treg cells derived by CD45.1+ cells, while CD45.2+ CD4+ T cells obtained the expression of Foxp3, which may drive transcription of transgenic Cre and thus delete the floxed PDK1 allele in Foxp3+ pTreg cells. The frequency and the number of Foxp3-negative CD4+ T cells that were differentiated from the two donors were comparable (Figure S4H). However, the proportion and number of CD45.2+ pTreg cells in spleen and lymph nodes were significantly lower than that of CD45.1+ pTreg (Figure 3H and Figure S4I). Thus, PDK1 is also required for pTreg induction and maintenance.
PDK1 deficiency alters the gene profile of Treg cells
In order to further reveal the mechanism by which PDK1 affects Treg cell differentiation and function, we isolated YFP+ Treg cells from female PDK1+/+Foxp3Cre/+ and PDK1fl/flFoxp3Cre/+ mice and analyzed their gene expression profiles by RNA-seq. Intriguingly, genes clusters associated with inhibitory function, proliferation and metabolism of Treg cells were significantly down-regulated (Figure 3I). This difference was further verified by flow cytometry, that is, the expression of CTLA-4, ICOS, Helios and GITR was down-regulated in YFP+Foxp3+ Treg cells from PDK1fl/flFoxp3Cre/+ mice (Figure 3J and Fig S4J). In addition, the expression of these functional molecules in CD45.2-derived pTreg cells was also significantly down-regulated in the chimeric assay, similar to Figure 3J (Figure 3K). Therefore, PDK1 may enhance the suppressive function of Treg cells by regulating the expression of key functional molecules.
PDK1 deficiency impairs the function of Treg cells
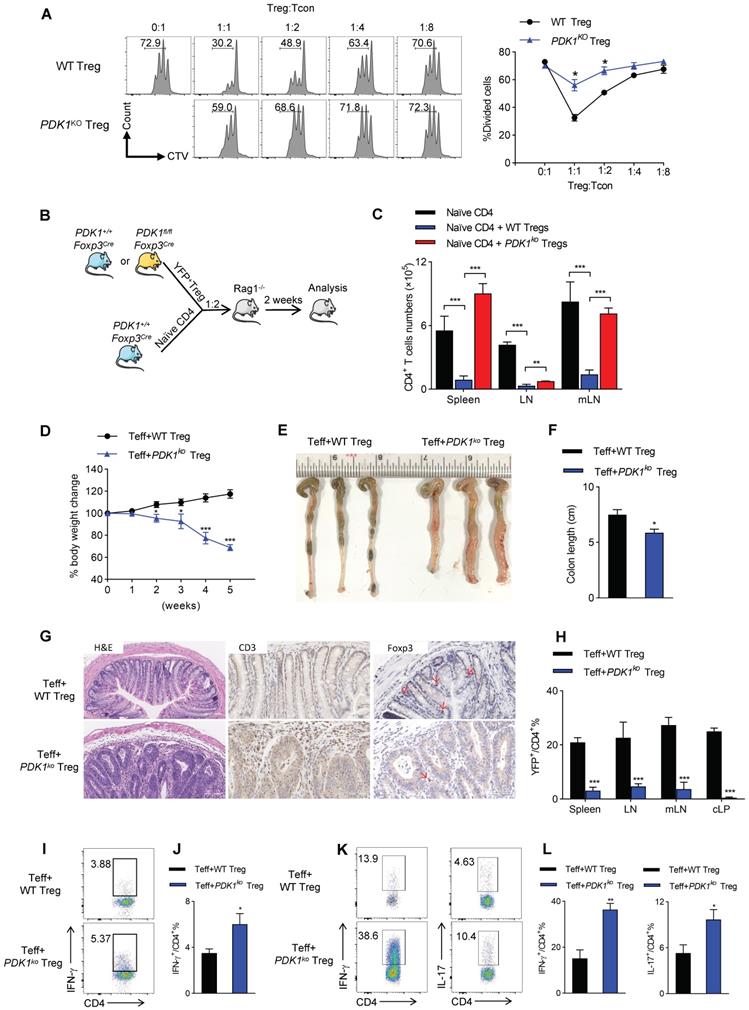
Based on the gene-profiling (Figure 3I), we then investigated whether PDK1 deficiency would affect the ability of Treg cells to inhibit T cell proliferation and activation. Thus, YFP+ Treg cells either from PDK1+/+Foxp3Cre/+ or PDK1fl/flFoxp3Cre/+ mice were sorted. In CTV-labeled in vitro assay, PDK1-sufficient Treg cells significantly suppressed T cell division, as indicated by CTV dilution. However, even at a condition of 1:1 ratio, PDK1-deficient Treg cells did not prevent T cell division (Figure 4A). This defect was also shown in an in vivo assay. Adoptively transferred PDK1-deficient Treg cells did not maintain the homeostasis proliferation of CD4+ T cell in Rag1-deficient mice (Figure 4B, C). We finally established a classic of T-cell mediated model colitis in Rag1-deficeint mice, in which a mixture of CD4+CD45RB+CD25- effector T cells plus WT or PDK1-deficient Treg cells was transferred. Compared with WT Treg cells as donor, mice receiving PDK1-deleted Treg cells showed weight loss after 2 weeks after transplantation (Figure 4D). Five weeks after cell transfer, the colons of these mice were shortened and thickened (Figure E, F). Histological analysis revealed a loss of goblet cells, a transmural thickening of the colon, and a high infiltration of inflammatory cells. Not surprisingly, histological analysis also showed the colons from mice receiving PDK1-deleted Treg cells infiltrated with higher CD3+ T cells, but fewer Foxp3+ Treg cells (Figure 4G). Flow cytometric analysis also confirmed that mice receiving PDK1-deleted Treg cells lacked YFP+ Treg cells in the spleen, lymph nodes, mesenteric lymph nodes and colon lamina propria (cLP) (Figure 4H), but enriched CD4+ T cells producing IFN-γ and IL-17 in spleen (Figure 4I-J) and cLP (Figure 4K-L). Taken together, PDK1 deficiency severely compromises inhibitory function of Treg cells.
PDK1 deletion impairs Treg function in vitro and in vivo. (A) In vitro suppressive activity of Treg cells from PDK1+/+Foxp3Cre/+ and PDK1fl/flFoxp3Cre/+ mice. (B) Experimental schematic for in vivo Treg suppressive activity assay. (C) Contrasting effects of WT and PDK1-deficient Tregs on the extent of homeostatic proliferation at 14 days after adoptive transfer of WT naïve CD4+ T cells injected into Rag1-/- mice (n=4). (D) Percentage body weight changes over time of Rag1-/- mice after co-transferred WT or PDK1-deficient (PDK1ko) Treg cells with WT Teff cells at 1:2 ratio. (E, F) Images (E) and length (F) of colons from Rag1-/- mice after co-transferred WT or PDK1-deficient Treg cells with WT Teff cells at 1:2 ratio (n≥3). (G) Compare the histological morphology, expression of CD3 and Foxp3 of colons from Rag1-/- mice after co-transferred WT or PDK1-deficient Treg cells with WT Teff cells at 1:2 ratio (original magnification, ×20, ×40, ×40). (H) Percentages of Treg cells in spleen, lymph nodes (LN), mesenteric lymph nodes (mLN) and cLP from Rag1-/- mice after transferred (n=3). (I, J) IFN-γ production in CD4+ T cells in spleen from Rag1-/- mice after transferred (n≥3). (K, L) IFN-γ and IL-17 production in CD4+ T cells in cLP from Rag1-/- mice after transferred (n≥3). All results are presented as the mean ± SEM; *P ≤ 0.05; **P ≤ 0.01; ***P ≤ 0.001; unpaired Student's t test. Data represent three independent experiments.
ROS inhibition rescues PDK1-deficiency Treg cell survival
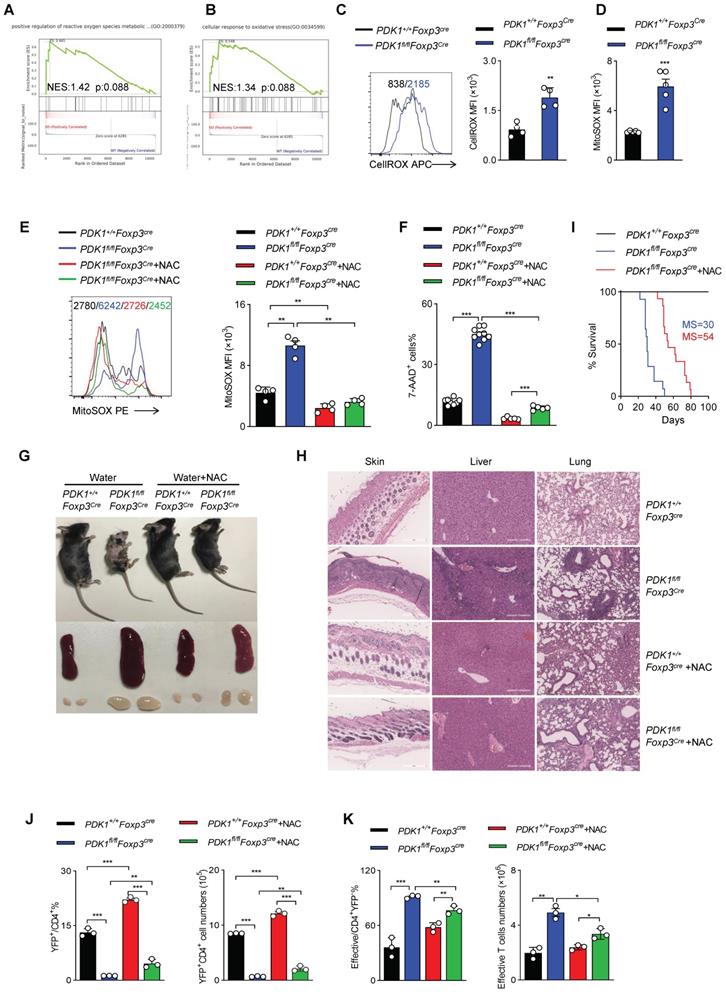
To further clarify how PDK1 regulates Treg cell homeostasis, we performed GSEA analysis on RNA-seq datasets containing WT and PDK1-deficient Treg cells. Notably, two sets of ROS-related transcripts, “positive regulation of reactive oxygen species metabolic” and “cellular response to oxidative stress”, were enriched (Figure 5A, B). Thus, the amount of total ROS and mitochondrial ROS in Treg cells was detected. Indeed, compared with WT Treg cells, both total ROS and mitochondrial ROS levels were significantly increased in PDK1-deficient Treg cells (Figure 5C, D). Treg cells of PDK1fl/flFoxp3Cre/+ female mice also produced higher level of ROS than that of control mice (Figure S5A, B). We further investigated whether high level of ROS associated with increased death in PDK1-deleted Treg cells. Mitochondrial ROS level in Treg cells from PDK1+/+Foxp3Cre and PDK1fl/flFoxp3Cre mice was significantly reduced by NAC (N-acetyl-L-cysteine, used as ROS scavengers) treatment (Figure 5E). Interestingly, NAC treatment could significantly reduce in vitro death of Treg cells in both genotypes (Figure 5F). Supplementation of NAC in drinking water for young PDK1fl/flFoxp3Cre mice could largely reduce the development of inflammation disease, such as less skin ulceration, smaller spleen and lymph nodes and fewer inflammatory cell infiltration in multiple organs after 20 days of post-treatment (Figure 5G, H). Treatment of NAC also significantly extended the lifespan of PDK1fl/flFoxp3Cre mice likely by increasing the proportion and number of Treg cells (Figure 5I-J). The proportion and number of effective CD4+ T cells were also reasonably down-regulated in PDK1fl/flFoxp3Cre mice after treated with NAC (Figure 5K). Analysis on cytokine showed that CD4+ and CD8+ T cell IFN-γ secretion were significantly reduced from PDK1fl/flFoxp3Cre mice after NAC treatment (Figure S5C-F). Thus, ROS-associated cell death impairs the survival of PDK1-deficient Treg cells.
PDK1 is essential to inhibit excessive ROS-induced Treg cell death. (A, B) Pathways commonly enriched in WT and PDK1-deficient Treg cells based on GSEA analysis of RNA-seq datasets. (C) MFI statistic of total ROS level in Treg cells from PDK1+/+Foxp3Cre and PDK1fl/flFoxp3Cre mice (n=4). (D) MFI statistic of mitochondrial ROS levels in Treg cells from PDK1+/+Foxp3Cre and PDK1fl/flFoxp3Cre mice (n=5). (E, F) Treg cells purified from PDK1+/+Foxp3Cre and PDK1fl/flFoxp3Cre mice were treated with or without NAC (5mM) for 24h, statistic of mitochondrial ROS levels (E) and percentages of 7AAD+ cells (F) are shown. (G) Indicated mice were fed water with or without NAC (1.5g/L) for 20 days from 18-day-old, representative images of mice, spleen and peripheral lymph nodes are shown. (H) Hematoxylin and eosin staining of skin, liver, lung, (original magnification, ×10) from indicated mice feed water with or without NAC (1.5 g/L) for 20 days from 18-day-old. (I) Survival curve of indicated mice fed water with or without NAC (1.5g/L), median survival (MS) was shown (n≥14). (J) The percentage (left) and numbers (right) of Treg cells in spleen from PDK1+/+Foxp3Cre and PDK1fl/flFoxp3Cre mice fed water with or without NAC (1.5g/L) for 20 days from 18-day-old (n=3). (K) The percentage (left) and numbers (right) of effective CD4+ T cell in spleen from PDK1+/+Foxp3Cre and PDK1fl/flFoxp3Cre mice fed water with or without NAC (1.5g/L) for 20 days from 18-day-old (n=3). All results are presented as the mean ± SEM; *P ≤ 0.05; **P ≤ 0.01; ***P ≤ 0.001; unpaired Student's t test. Data represent two independent experiments.
PDK1 deficiency induces Treg cell apoptosis and iron ion-dependent cell death
Mitochondria play a key role in regulating cell energy and cell death signal transduction. In addition to producing adenosine triphosphate, mitochondria are also the main source of ROS production [25]. To further investigate how ROS excessively generated in PDK1-deficient Treg cells, the mitochondrial functions of Treg cells sorted from PDK1+/+Foxp3Cre and PDK1fl/flFoxp3Cre mice was assessed by measurement of oxygen consumption rate (OCR). We revealed that the level of OCR was significantly reduced in PDK1-deficient Treg cells (Figure 6A, B). This reduction in OCR level was also shown in the Treg cells of PDK1fl/flFoxp3Cre/+ female mice, which ruled out the effect of inflammatory factors on Treg cell metabolism (Figure S6A, B). Treg cells from both PDK1fl/flFoxp3Cre and PDK1fl/flFoxp3Cre/+ mice had lower efficiency of ECAR (Figure 6C, D, and Figure S6C, D). These results suggest that PDK1-deficient Treg cells are at a lower metabolic level and the excessive ROS production may not be caused by Treg cell metabolism.
PDK1 deficiency induces Treg cell apoptosis and iron ion-dependent cell death. (A, B) OCR analysis of Treg sorted form spleen and lymph nodes (LN) of PDK1+/+Foxp3Cre and PDK1fl/flFoxp3Cre mice, statistics of 8-9 duplicates were shown in B. (C, D) ECAR analysis of Treg sorted form spleen and lymph nodes (LN) of PDK1+/+Foxp3Cre and PDK1fl/flFoxp3Cre mice, statistics of 6-8 duplicates were shown in D. (E) Pathways commonly enriched in WT and PDK1-deficient Treg cells based on GSEA analysis of RNA-seq datasets. (F) MFI statistic of Fe2+ level in Treg cells from PDK1+/+Foxp3Cre and PDK1fl/flFoxp3Cre mice (n=4). (G) MFI statistic of Lipid ROS level in Treg cells from PDK1+/+Foxp3Cre and PDK1fl/flFoxp3Cre mice (n=4). (H) Treg cells from PDK1+/+Foxp3Cre and PDK1fl/flFoxp3Cre mice were treated with or without DFO (200 µM) for 24h, total ROS level was analyzed using CellROX, statistics of 5-8 duplicates were shown. (I) Treg cells from PDK1+/+Foxp3Cre and PDK1fl/flFoxp3Cre mice were treated with or without DFO (200 µM) for 24h, cell viability was analyzed using 7-AAD, statistics of 5-8 duplicates were shown. (J) Treg cells from PDK1+/+Foxp3Cre and PDK1fl/flFoxp3Cre mice were treated with or without DFO (200 µM) or/and Z-VAD (20 µM) for 24h, cell viability was analyzed using 7-AAD, statistics of 4-8 duplicates were shown. All results are presented as the mean ± SEM; *P ≤ 0.05; **P ≤ 0.01; ***P ≤ 0.001; unpaired Student's t test. Data represent three independent experiments.
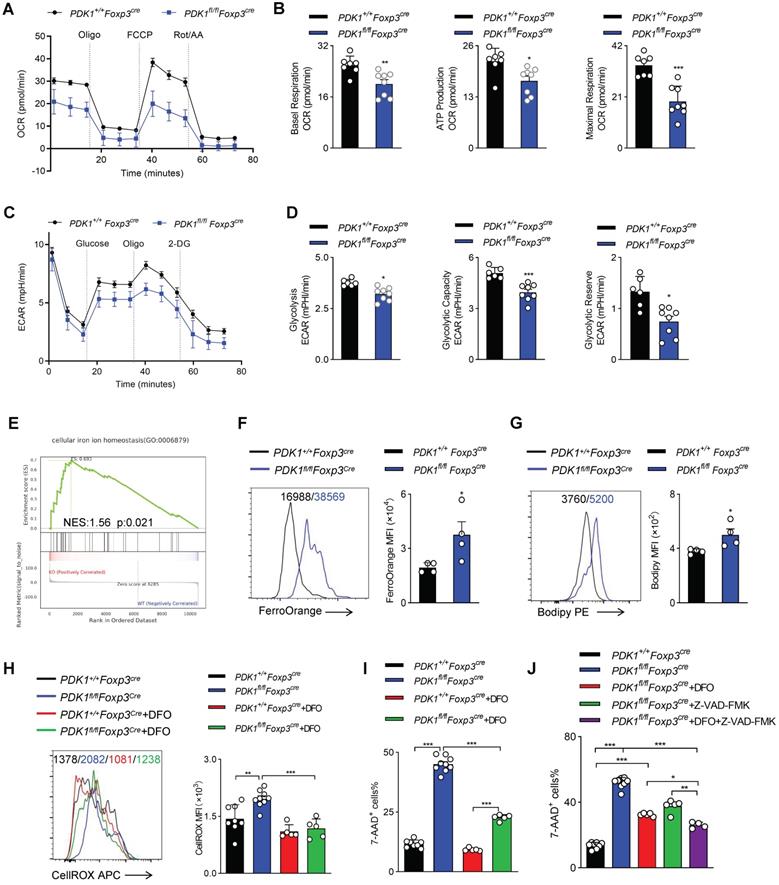
Excess iron ions accelerate lipid catalysis to produce lipid peroxides, which is an important source of cytotoxic ROS in living cells. Interestingly, GSEA analysis suggested an enriched expression of transcript related to “cellular iron ion homeostasis” (Figure 6E). Indeed, the Fe2+ level in PDK1-deficient Treg cells was significantly higher than that in control cells (Figure 6F, Figure S6E). Similarly, PDK1 deficiency resulted in increased lipid ROS in Treg cells (Figure 6G, and Figure S6F). In order to evaluate the correlation between excess ROS and iron ion accumulation in Treg cells of PDK1fl/flFoxp3Cre mice, Treg cells were treated with Deferoxamine (DFO), an iron ion chelator. Intriguingly, DFO treatment significantly reduced total ROS levels and partially rescued the death of PDK1-deficient Treg cells (Figure 6H-I). Therefore, PDK1 deficiency in Treg cells may lead to iron ion homeostasis imbalance, thereby generating excessive lipid ROS. In addition to iron ion-associated cell death, PDK1-deficient Treg cells up-regulated the expression of pro-apoptotic caspase3 (Figure 3E). The apoptosis inhibitor Z-VAD-FMK could partially rescue the death of PDK1-deficient Treg cells (Figure S6G). DFO combined with Z-VAD-FMK could further alleviate the death of PDK1-deficient Treg cells (Figure 6J). However, the cell necrosis inhibitor Nec-1 had no significant effect (Figure S6H). Thus, PDK1 deficiency leads to Treg cell apoptosis and iron ion-dependent cell death, probably ferroptosis.
PDK1 negatively regulates iron ion-dependent Treg cell death via inhibiting MEK-Erk signaling
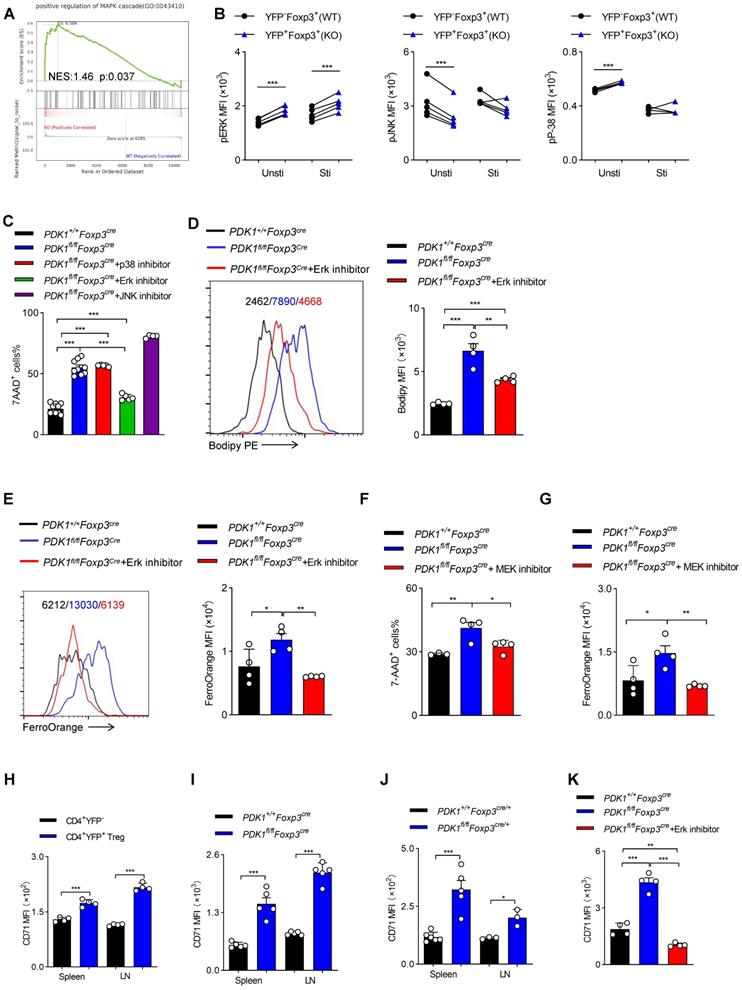
GSEA analysis suggested that transcripts related to “positive regulation of MAPK cascade” were highly enriched in PDK1-deficient Treg cells (Figure 7A). Ferroptotic death, at least in cancer cells, is usually accompanied by activation of the MAPK signaling pathway. MAPKs family mainly includes p38, ERK and c-Jun NH2-terminal kinase (JNK). PDK1-Akt signal can negatively regulate Raf-MEK-Erk pathway [26]. We first verified that in PDK1-deficient Treg cells, only Erk phosphorylation was highly elevated, regardless of resting or activation by TCR stimulation (Figure 7B). The chemical inhibitor for Erk, but not JNK and p38, partially rescued the death of PDK1-deficient Treg cells and reduced lipid peroxides and iron ions accumulation (Figure 7C-E). In the MAPK-Erk pathway, Erk can be activated by MEK [27]. The MEK inhibitor also partially enhanced survival of PDK1-deficient Treg cells (Figure 7F) and reduced iron ion production (Figure 7G). Moreover, compared with conventional CD4+ T cells, transferrin receptor CD71 was highly expressed on Treg cells (Figure 7H). In particular, CD71 expression in PDK1-deficient Treg cells was much higher than that in WT Treg cells (Figure 7I, J). The Erk inhibitor could significantly inhibit the up-regulation of CD71 in PDK1 deficient Treg cells, thereby preventing intracellular transport of iron ions (Figure 7K). Therefore, PDK1 negatively regulates iron ion-dependent Treg cell death likely probably by inhibiting MEK-Erk signaling and CD71 expression.
PDK1 negatively regulates iron ion-dependent Treg cell death via inhibiting MEK-Erk signaling. (A) Pathways commonly enriched in WT and PDK1-deficient Treg cells based on GSEA analysis of RNA-seq datasets. (B) Phosphorylation of Erk1/2 (Thr202/Tyr204), p38 (Thr180/Tyr182) and JNK (Thr183/Tyr185) in CD4+ Foxp3+YFP- T cells (WT) and CD4+ Foxp3+YFP+ T cells (KO) from PDK1fl/flFoxp3Cre/+ mice freshly detected and activated with anti-CD3/CD28 for 5 min. (paired Student's t test) Unsti: unstimulated, Sti: stimulated (n=5). (C) Treg cells from PDK1+/+Foxp3Cre and PDK1fl/flFoxp3Cre mice were treated with or without p38 inhibitor (SB203580,20 µM), Erk inhibitor (SCH772984,10 µM) and JNK inhibitor (SP600125,20μM) for 24h, cell viability was analyzed using 7-AAD, statistics of 4-10 duplicates were shown. (D, E) Treg cells from PDK1+/+Foxp3Cre and PDK1fl/flFoxp3Cre mice were treated with or without Erk inhibitor (SCH772984,1 µM) for 24h, lipid ROS (D) and Fe2+ (E) level were analyzed by Bodipy 665/676 and FerroOrange, statistics of 4 duplicates were shown. (F, G) Treg cells from PDK1+/+Foxp3Cre and PDK1fl/flFoxp3Cre mice were treated with or without MEK inhibitor (U0126,10 µM) for 24h, cell viability was analyzed using 7-AAD, statistics of 3-4 duplicates were shown in figure F, and Fe2+ level was analyzed by FerroOrange, statistics of 4 duplicates were shown in figure G. (H) Comparison of expression of CD71 between CD4+YFP- T cell and CD4+YFP+ Treg cells in spleen and lymph nodes (LN) from wild type mice (n=4). (I) Expression of CD71 in Treg cells from PDK1+/+Foxp3Cre and PDK1fl/flFoxp3Cre mice (n=5). (J) Expression of CD71 in Treg cells in spleen and lymph nodes (LN) from PDK1+/+Foxp3Cre/+ and PDK1fl/flFoxp3Cre/+ mice (n≥3). (K) Treg cells from PDK1+/+Foxp3Cre and PDK1fl/flFoxp3Cre mice were treated with or without Erk inhibitor (SCH772984,1 µM) for 24h and the expression of CD71was analyzed, statistics of 4 duplicates were shown. All results are presented as the mean ± SEM; *P ≤ 0.05; **P ≤ 0.01; ***P ≤ 0.001; unpaired Student's t test. Data represent three independent experiments.
PDK1 is the upstream of the mTOR signaling pathway. Previous studies have demonstrated that the mTOR pathway plays an important role in the activation of Treg cells through metabolic reprogramming [1]. In addition, Treg cells require mTORC1, rather than mTORC2 signaling to maintain their proliferation and upregulation of the suppressive molecules CTLA4 and ICOS to establish their functional competency [28]. We confirmed that mTORC1 signaling was significantly down-regulated in PDK1-deficient Treg cells (Figure S7A). Consistent with previously reports, we showed here that mitochondrial metabolism was inhibited in PDK1-deficient Treg cells. We further found that the ROS level was significantly reduced (Figure S7B), consistent with the results obtained from Raptorfl/flFoxp3Cre mice [28], but the Fe2+ level did not change in mTORC1 (Raptorfl/flCD2Cre)-deficient Treg cells (Figure S7C). These results indicated that the PDK1 maintains iron homeostasis in Treg cells independent of mTORC1 signaling.
Discussion
In this study, we found that Treg-specific deletion of PDK1 in mice led to development of spontaneous fatal systemic autoimmune disorders, accompanied by reduced Treg number. Treg function assay suggested that PDK1-deficient Treg cells are unable to control effector T cell proliferation and intestinal inflammation. These data indicate that PDK1 plays a critical regulatory role in the survival, proliferation, and suppressive activity of Treg cells.
When we prepared our manuscript, Hyunju Oh et al. reported a phenotype similar to ours [29]. Based on the high-throughput gene expression analyses, they believe that PDK1 controls Treg cell signature gene expression by regulating the canonical NF-κB pathway. Therefore, we used flow cytometry to detect the activation of the NF-κB signaling in Treg cells from PDK1fl/flFoxp3Cre/+ mice and found that deletion of PDK1 in Treg cells led to a modest decrease in the expression of pIKKα/β in both physiological state or TCR stimulation condition. In order to explore whether the down-regulation of IKKβ signaling could lead to excessive ROS production, we used SC-514, an IKKβ inhibitor, to treat TCR-stimulated WT Treg cells. We found that both total ROS and mitochondrial ROS in Treg cells of the treatment group were significantly down-regulated (data not shown). These data suggest that the accumulation of ROS in PDK1-deficient Treg cells may not be caused by the down-regulation of pIKKβ. Here, we have elucidated a new mechanism from the perspective of Treg cell redox homeostasis regulation. Specifically, we found that PDK1-deficient Treg cells have enriched expression of two transcripts related to ROS production. Inhibition of excessive ROS could drastically rescue Treg cell survival and alleviate autoimmune diseases, indicating that excessive ROS production was the main reason of PDK1-deficient Treg cell death. As has been known, PDK1 is an important metabolic enzyme that controls cell metabolic fate by regulating mTOR signaling [11]. However, our data showed that PDK1-deficient Treg cells were at a lower metabolic level and so unlikely a cause of excessive ROS production. High-throughput gene expression analysis revealed that there was an enriched expression of transcripts related to “Cellular iron ion homeostasis” in PDK1-deficient Treg cells. Both iron deficiency and iron overload can lead to various pathological conditions [23]. The maintenance of iron homeostasis is crucial for the adaptive immune system [30-32]. The ROS produced by the Fenton reaction of excessive iron is an important source of cytotoxic ROS in living cells. Removing overload of iron ions partially rescued the survival of PDK1-deficient Treg cells, accompanied by downregulation of ROS levels. Therefore, we proved that the activation signals through PDK1 are required for intracellular iron and reactive oxygen species homeostasis in Treg cells.
The increased iron metabolism and lipid peroxidation signaling are recognized as central mediators of ferroptosis [33]. Meanwhile, ferroptotic cancer cell death is often accompanied by activation of MAPK signaling pathway. GSEA analysis demonstrated an enriched expression of transcripts related to “positive regulation of MAPK cascade” in PDK1-deficient Treg cells. PDK1-Akt signal can negatively regulate the Raf-MEK-Erk pathway [26]. Furthermore, both MEK and Erk inhibitors could partially rescue PDK1 deficiency induced Treg cell death, with reduced lipid peroxides and iron ions. Thus, we identify that PDK1 is important for maintaining iron homeostasis in Treg cells, and so in maintaining Treg cells survival. mTOR signaling is the downstream of PDK1 kinase, the impaired proliferation and the down-regulation of suppressive molecules expression of PDK1-deficient Treg cells may be attributed to the attenuation of mTORC1 signaling. However, the accumulation of iron ions, ROS level were down-regulated in mTORC1-deficient Treg cells, these results suggested that the PDK1 was independent of mTORC1 signaling to maintain Treg cell redox balance.
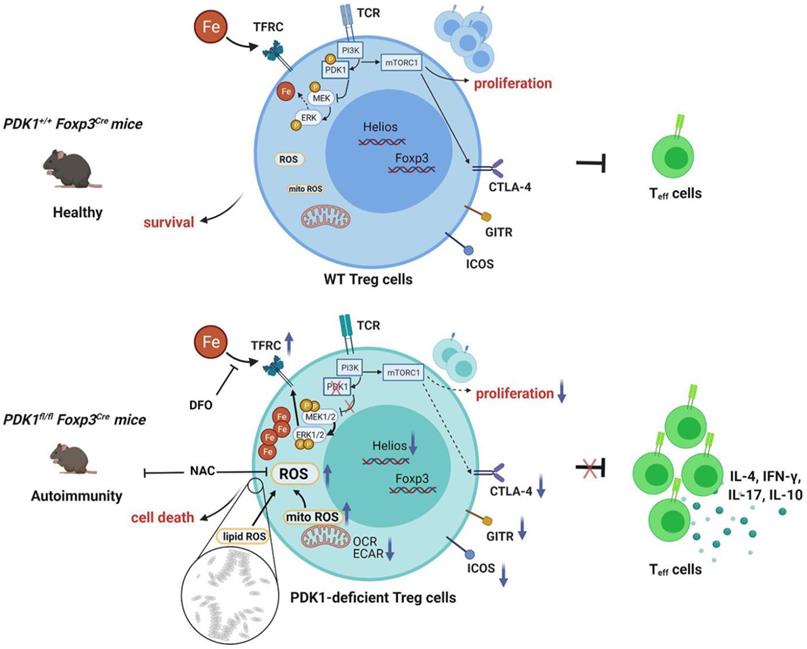
In summary, our study clarifies the effect of PDK1 on the proliferation, survival and function of Treg cells and its potential regulatory mechanism (Figure 8). Additionally, our finding reveals the effect of iron homeostasis on the function and survival of Treg cells, especially the regulatory mechanism of iron homeostasis in Treg cells, which is of great significance to Treg-mediated immune homeostasis and tolerance.
Schematic illustration of PDK1 regulates regulatory T cell survival via controlling redox homeostasis. In Treg cells, TCR stimulates PI3K-PDK1-mTOR signaling pathway to maintain the homeostasis and function of Treg cells. Meanwhile, activated PDK1 inhibited the MAPK signaling pathway and maintained the balance of intracellular iron ions. When PDK1 was deleted, the MAPK signaling activity in Treg cells increased, which promoted the up-regulation of the expression of iron transporter CD71, leading to the increase of iron ions in Treg cells, resulting in the production of excessive lipid ROS and the death of Treg cells. In addition, PDK1 also promotes the activation of mTORC1 signaling, which is critical for maintaining Treg cell proliferation and the suppressive molecules expression.
Materials and methods
Mice
PDK1flox/flox mice were constructed in our laboratory. C57BL/6J (B6), Foxp3YFP-Cre[34], B6/Rag1-/- and B6/CD45.1 mice, B6.Cg-Rptortm1.1Dmsa/J (B6 Raptor-flox), and B6.Cg-Tg(CD2-icre)4Kio/J (hCD2-iCre) were purchased from the Jackson Laboratory. PDK1flox/flox mice were crossed with Foxp3YFP-Cre mice to generate PDK1fl/flFoxp3Cre (male) or PDK1fl/flFoxp3Cre/+ (female) mice. Foxp3Cre (male) or Foxp3Cre/+ (female) mice were used as control. PDK1fl/flFoxp3Cre mice were used at 3-4 weeks old unless otherwise noted, with the age and gender matched Foxp3Cre mice as controls. All mice were housed under the specific pathogen-free animal facilities in the Animal Resource Center at Jinan University. All applicable institutional and/or national guidelines for the care and use of animals were followed.
Flow cytometry
Flow cytometry was performed on BD FACSVerse™ (three-laser flow cytometry analyzer, BD Biosciences). Monoclonal antibodies against mouse CD3 (145-2C11), CD4 (RM4-5), CD44 (1M7), CD62L (MEL-14), Foxp3 (FJK-16s), CD8 (53-6.7), Ki-67 (SolA15), CD98 (RL388), CD71 (R17217), IL-4 (BVD6-24G2), IL-17 (17B7), IL-10 (ES5-16E3), ICOS (7E.17G9), GITR (DTA-1), CTLA-4 (UC10-4B9), Helios (22F6), F(ab) Donkey Anti Rabbit IgG (12-4739-81) and isotype controls were purchased from eBioscience (San Diego, CA). Monoclonal antibodies against mouse anti-GFP (FM264G), IFN-γ (XMG1.2), were purchased Biolegend (San Diego, CA). Monoclonal antibodies against mouse CD25 (7D4), CD45RB (16A), pPDK1 S241 (J66-653.44.17), Caspase-3 (C92-605), 7-AAD (Cat#559925) were purchased BD Biosciences (Mississauga, Ontario, Canada). Anti-phospho-AKT (Thr308) (D25E6), and Anti-phospho-S6 (D57.2.2E), Phospho-p38 MAPK (Thr180/Tyr182) (3D7), Phospho-SAPK/JNK (Thr183/Tyr185) (G9), Phospho-p44/42 MAPK (Erk1/2) (Thr202/Tyr204) (D13.14.4E) were obtained from Cell Signaling Technology (Beverly, MA). Dead cells were excluded from analysis by using LIVE/DEAD fixable Aqua dead cell stain kit (Cat#L34965, Invitrogen) according to the manufacturer's instructions. For analysis of surface markers, cells were stained in PBS containing 2% (w/v) BSA at room temperature. Intracellular staining was performed using Foxp3/transcription factor staining buffer kit (Cat #00-5523-00, eBioscience) according to the manufacturer's instructions. For assessment of cellular and mitochondria ROS in Treg cells, MitoSOX Red (Cat #M36008, Invitrogen) and CellROX Deep Red (Cat #C10422, Invitrogen) were used per the manufacturer's instructions. For assessment of Fe2+ level in Treg cells, FerroOrange (Cat #F374, Dojindo) was used the manufacturer's instructions. Flow cytometry data was analyzed using Flowjo software.
Histology and immunostaining
Tissues were fixed in 4% paraformaldehyde and embedded in paraffin and sliced, followed by hematoxylin and eosin (H&E) staining. The tissue section was scanned by Aperio AT2 (Leica) and analyze with Aperio ImageScope 12.4, a Pathology Slide Viewing Software.
Cell purification and culture
Lymphocytes were isolated from spleen and peripheral lymph nodes. Total CD4+ T cells were bead-isolated used Mouse CD4 T Cell Isolation Kit (Cat#480033, Biolegend). Naïve T cells (CD4+YFP-CD44-CD62L+), Treg cells (CD4+YFP+) cells were sorted on BD FACS AriaII (BD Biosciences). The purified cells were used in the indicated experiments.
pTreg cell in vivo maintenance model
Naïve CD4+ T cells (CD4+CD25-CD44lo) were bead-isolated used Mouse CD4 Naïve T Cell Isolation Kit (Cat#480040,Biolegend) from the spleens and peripheral lymph nodes of wild-type (CD45.1) and PDK1fl/flFoxp3Cre (CD45.2) mice. Then, 5×10⁵ naïve CD4+ T cells were transferred via retroorbital injection into Rag1-/- mice. The presence of Foxp3-YFP+ pTreg was evaluated in the spleen and lymph nodes 2 weeks later.
Treg suppression assays
For in vitro studies, 3×10⁴ Treg cells (CD4+YFP+) cells sorted on BD FACS AriaII (BD Biosciences) from the spleens and peripheral lymph nodes of the respective PDK1+/+Foxp3Cre/+ and PDK1fl/flFoxp3Cre/+ mice were co-cultured with Cell Tracker™ Violet (CTV)-labeled naïve T cells (CD4+YFP-CD44loCD62Lhi) with anti-CD3 (5 μg/ml), anti-CD28 (1 μg/ml) and IL-2 (2 ng/ml) for 3days. After, CTV-labeled T cell proliferation was determined by flow cytometer, and data was analyzed with FlowJo software. For in vivo studies, 1×10⁵ Treg cells (CD4+YFP+) cells of the respective PDK1+/+Foxp3Cre or PDK1fl/flFoxp3Cre mice and 2×10⁵ naïve T cells (CD4+YFP-CD44loCD62Lhi) of the respective PDK1+/+Foxp3Cre sorted on flow cytometer were co-transferred via retroorbital injection into Rag1-/- mice. Two weeks later, spleen, lymph nodes (LN) and mesenteric lymph nodes (mLN) were harvested and the number of CD4+ T cells was determined by flow cytometer and data was analyzed with FlowJo software.
Adoptive transfer model of colitis
A total of 4×10⁵ Teff cells (CD4+CD45RBhiCD25-) from CD45.1+ mice were mixed with 2×10⁵ Treg cells (CD4+YFP+) from PDK1+/+Foxp3cre mice or PDK1fl/flFoxp3cre mice, and transferred via retroorbital injection into Rag1-/- mice. Mice were assessed for clinical signs of colitis weekly and analyzed 4-6 weeks after transfer. Colons were harvested for measurement histology which fixed in 4% paraformaldehyde and embedded in paraffin and sliced, followed by hematoxylin and eosin (H&E) staining. Additional sections were stained by immunoperoxidase using primary antibodies directed against CD3 (Cat#GB11014, Servicebio) and FOXP3 (Cat#12653, CST). Lymphocytes isolated from spleen, lymph nodes (LN), mesenteric lymph nodes (mLN) and colon lamina propria (cLP) were analyzed by flow cytometry.
Metabolic studies
The extracellular acidification rate (ECAR) and oxygen consumption rate (OCR) were measured by the glycolysis stress test kit (Cat#103020-100, Agilent Technology) and mito stress test kit (Cat#103015-100, Agilent Technology), respectively, with a XF96 extracellular flux analyzer (Agilent Technology). Treg cells (CD4+YFP+) were sorted by flow cytometer from the spleens and peripheral lymph nodes of the respective PDK1+/+Foxp3Cre mice, PDK1fl/flFoxp3Cre mice, PDK1+/+Foxp3Cre/+ and PDK1fl/flFoxp3Cre/+ mice. Treg cells were seeding onto a 96-well XF plate coated with Cell-Tak (Cat# 354240; Corning) with 2×10⁵/well at 37 °C incubator for 30 min and analyzed by XF96 extracellular flux analyzer later. For glycolysis stress test, followed by the sequential addition of glucose (10 mM), oligomycin (1 µM) and 2-DG (50 mM). For mito stress test, Treg cells were followed by the sequential addition of oligomycin (1 µM), FCCP (1.5 µM), Rotenone/antimycin A (0.5 µM). The data was analyzed by Seahorse Wave Desktop v2.4 software.
RNA isolation and reverse transcriptase PCR
Total RNA was obtained from purified CD4+YFP+Treg cells from PDK1+/+Foxp3Cre and PDK1fl/flFoxp3Cre mice and reverse-transcribed with a Takara reverse transcription kit. The primers for the mouse genes were: Pdk1-F: CATACAGACCAGGTTGACAT, Pdk1-R: TGGATATACCTGGACACAGT, the primers for internal control gene GAPDH were: Gapdh-F: CCAGCTTAGGTTCATCAGGT, Gapdh-R: TTGATGGCAACAATCTCCAC. Real-time PCR was performed with a BioRad CFX Connect cycler.
RNA-seq
Treg cells were sorted from PDK1+/+Foxp3Cre/+ (WT) and PDK1fl/flFoxp3Cre/+ (KO) mice, total RNA was extracted using the RNeasy Micro Kit (50) (Qiagen 74004) according to the manufacturer's protocol. RNA purity and quantification were evaluated using the NanoDrop 2000 spectrophotometer (Thermo Scientific, USA). RNA integrity was assessed using the Agilent 2100 Bioanalyzer (Agilent Technologies, Santa Clara, CA, USA). Then the libraries were constructed using Single Cell Full Length mRNA-Amplification Kit (Vazyme, N712-03, Nanjing, China) and TruePrep DNA Library Prep Kit V2 for Illumina (Vazyme, TD502-02, Nanjing, China) according to the manufacturer's instructions. The transcriptome sequencing and analysis were conducted by OE Biotech Co., Ltd. (Shanghai, China). The RNAseq data were deposited in the Sequence Read Archive (SRA) repository at NCBI under the accession number PRJNA704505.
Statistics
Statistical significance was calculated by two-tailed unpaired Student t test using GraphPad Prism 8 for Windows (GraphPad). The following terminology is used to show statistical significance: *p < 0.05, **p < 0.01, ***p < 0.001. No samples or animals were excluded from the analysis. Variances are similar between the groups in t test analysis.
Supplementary Material
Supplementary figures.
Acknowledgements
Research reported in this publication was supported by the Natural Science Foundation of China (to MY, 81771666, 81471523 and 82071737; to DZ, 81725007, 31830027, 31821003 and 91942308; to QY, 32000615; to SW, 82101831), National Key Research & Developmental Program of China (to ZD, 2018YFC1003900), Natural Science Foundation of Guangdong Province (to MY, 2019A1515011707) and by 111 Project (B16201). China Postdoctoral Science Foundation (to QY, 2019M663374; to SW, 2021M691236), Guangdong Basic and Applied Basic Research Fund (to QY, 2020A1515111081).
Competing Interests
The authors have declared that no competing interest exists.
References
1. Chapman NM, Zeng H, Nguyen TM, Wang Y, Vogel P, Dhungana Y. et al. mTOR coordinates transcriptional programs and mitochondrial metabolism of activated Treg subsets to protect tissue homeostasis. Nat Commun. 2018;9:2095
2. Li MO, Rudensky AY. T cell receptor signalling in the control of regulatory T cell differentiation and function. Nat Rev Immunol. 2016;16:220-33
3. Dominguez-Villar M, Hafler DA. Regulatory T cells in autoimmune disease. Nat Immunol. 2018;19:665-73
4. Allan SE, Broady R, Gregori S, Himmel ME, Locke N, Roncarolo MG. et al. CD4+ T-regulatory cells: toward therapy for human diseases. Immunol Rev. 2008;223:391-421
5. Lu L, Barbi J, Pan F. The regulation of immune tolerance by FOXP3. Nat Rev Immunol. 2017;17:703-17
6. Stockis J, Roychoudhuri R, Halim TYF. Regulation of regulatory T cells in cancer. Immunology. 2019;157:219-31
7. Lucca LE, Dominguez-Villar M. Modulation of regulatory T cell function and stability by co-inhibitory receptors. Nat Rev Immunol. 2020;20:680-93
8. Chapman NM, Chi H. mTOR signaling, Tregs and immune modulation. Immunotherapy. 2014;6:1295-311
9. He N, Fan W, Henriquez B, Yu RT, Atkins AR, Liddle C. et al. Metabolic control of regulatory T cell (Treg) survival and function by Lkb1. Proc Natl Acad Sci U S A. 2017;114:12542-7
10. Yang K, Blanco DB, Neale G, Vogel P, Avila J, Clish CB. et al. Homeostatic control of metabolic and functional fitness of Treg cells by LKB1 signalling. Nature. 2017;548:602-6
11. Finlay DK, Rosenzweig E, Sinclair LV, Feijoo-Carnero C, Hukelmann JL, Rolf J. et al. PDK1 regulation of mTOR and hypoxia-inducible factor 1 integrate metabolism and migration of CD8+ T cells. J Exp Med. 2012;209:2441-53
12. Park SG, Schulze-Luehrman J, Hayden MS, Hashimoto N, Ogawa W, Kasuga M. et al. The kinase PDK1 integrates T cell antigen receptor and CD28 coreceptor signaling to induce NF-kappaB and activate T cells. Nat Immunol. 2009;10:158-66
13. Hinton HJ, Alessi DR, Cantrell DA. The serine kinase phosphoinositide-dependent kinase 1 (PDK1) regulates T cell development. Nat Immunol. 2004;5:539-45
14. Baracho GV, Cato MH, Zhu Z, Jaren OR, Hobeika E, Reth M. et al. PDK1 regulates B cell differentiation and homeostasis. Proc Natl Acad Sci U S A. 2014;111:9573-8
15. Feng Y, Lin J, Liu Y, Tang Y, Zhou Y, Zhong M. Investigation of expressions of PDK1, PLK1 and c-Myc in diffuse large B-cell lymphoma. Int J Exp Pathol. 2019;100:32-40
16. Yang M, Li D, Chang Z, Yang Z, Tian Z, Dong Z. PDK1 orchestrates early NK cell development through induction of E4BP4 expression and maintenance of IL-15 responsiveness. J Exp Med. 2015;212:253-65
17. He J, Wang Y, Liu T, Liu G, Chen S, Li Q. et al. Stage-specific requirement of kinase PDK1 for NK cells development and activation. Cell Death Differ. 2019;26:1918-28
18. Park SG, Mathur R, Long M, Hosh N, Hao L, Hayden MS. et al. T regulatory cells maintain intestinal homeostasis by suppressing gammadelta T cells. Immunity. 2010;33:791-803
19. Sun Z, Yao Y, You M, Liu J, Guo W, Qi Z. et al. The kinase PDK1 is critical for promoting T follicular helper cell differentiation. Elife. 2021 10
20. Franchina DG, Dostert C, Brenner D. Reactive Oxygen Species: Involvement in T Cell Signaling and Metabolism. Trends Immunol. 2018;39:489-502
21. Zhong J, Yau ACY, Holmdahl R. Regulation of T Cell Function by Reactive Nitrogen and Oxygen Species in Collagen-Induced Arthritis. Antioxid Redox Signal. 2020;32:161-72
22. Guo Z, Wang G, Wu B, Chou WC, Cheng L, Zhou C. et al. DCAF1 regulates Treg senescence via the ROS axis during immunological aging. J Clin Invest. 2020;130:5893-908
23. Gozzelino R, Arosio P. Iron Homeostasis in Health and Disease. Int J Mol Sci. 2016 17
24. Soares MP, Hamza I. Macrophages and Iron Metabolism. Immunity. 2016;44:492-504
25. Kuang F, Liu J, Tang D, Kang R. Oxidative Damage and Antioxidant Defense in Ferroptosis. Front Cell Dev Biol. 2020;8:586578
26. Mendoza MC, Er EE, Blenis J. The Ras-ERK and PI3K-mTOR pathways: cross-talk and compensation. Trends Biochem Sci. 2011;36:320-8
27. Degirmenci U, Wang M, Hu J. Targeting Aberrant RAS/RAF/MEK/ERK Signaling for Cancer Therapy. Cells. 2020 9
28. Zeng H, Yang K, Cloer C, Neale G, Vogel P, Chi H. mTORC1 couples immune signals and metabolic programming to establish T(reg)-cell function. Nature. 2013;499:485-90
29. Oh H, Zhao J, Grinberg-Bleyer Y, Postler TS, Wang P, Park SG. et al. PDK1 Is Required for Maintenance of CD4(+) Foxp3(+) Regulatory T Cell Function. J Immunol. 2021;206:1776-83
30. Mu Q, Chen L, Gao X, Shen S, Sheng W, Min J. et al. The role of iron homeostasis in remodeling immune function and regulating inflammatory disease. Science Bulletin. 2021
31. de Sousa M. Immune cell functions in iron overload. Clin Exp Immunol. 1989;75:1-6
32. Porto G, De Sousa M. Iron overload and immunity. World J Gastroenterol. 2007;13:4707-15
33. Tang S, Gao P, Chen H, Zhou X, Ou Y, He Y. The Role of Iron, Its Metabolism and Ferroptosis in Traumatic Brain Injury. Front Cell Neurosci. 2020;14:590789
34. Rubtsov YP, Rasmussen JP, Chi EY, Fontenot J, Castelli L, Ye X. et al. Regulatory T cell-derived interleukin-10 limits inflammation at environmental interfaces. Immunity. 2008;28:546-58
Author contact
![]() Corresponding authors: Dr. Zhongjun Dong, Medical Blvd. D328, Tsinghua University, Haidian District, Beijing, 100086, China; Phone: +86-10-62798536; dongzjtsinghua.edu.cn. Dr. Meixiang Yang, 601 West Huangpu Avenue, Guangzhou, Guangdong, 510632, China; Phone: +86 13422034040; mxyangedu.cn.
Corresponding authors: Dr. Zhongjun Dong, Medical Blvd. D328, Tsinghua University, Haidian District, Beijing, 100086, China; Phone: +86-10-62798536; dongzjtsinghua.edu.cn. Dr. Meixiang Yang, 601 West Huangpu Avenue, Guangzhou, Guangdong, 510632, China; Phone: +86 13422034040; mxyangedu.cn.