Impact Factor
- Issue 14; 2026
- Issue 13; 2026
- Issue 12; 2026
- Issue 11; 2026
- Issue 10; 2026
- Volume 16; 2026
- Advance Articles
- Past Issues
- Cover Images
- Cover Suggestion
- Index & Coverage
- Special Issues
Introduction
Methods
Results
Discussion
Abbreviations
Supplementary Material
Acknowledgements
References
International Journal of Biological Sciences
International Journal of Medical Sciences
 Global reach, higher impact

Theranostics 2022; 12(9):4221-4236. doi:10.7150/thno.69605 This issue Cite
Research Paper
TGFBI secreted by tumor-associated macrophages promotes glioblastoma stem cell-driven tumor growth via integrin αvβ5-Src-Stat3 signaling
Peng Peng1, Hongtao Zhu1, Dan Liu2, Zirong Chen1, Xiaolin Zhang1, Zhongyin Guo1, Minhai Dong1, Lijun Wan1, Po Zhang1, Guohao Liu1, Suojun Zhang1, Fangyong Dong1, Feng Hu1, Fangling Cheng3, Shijun Huang4, Dongsheng Guo1, Bin Zhang5,6,7 ![]() , Xingjiang Yu8
, Xingjiang Yu8 ![]() , Feng Wan1
, Feng Wan1 ![]()
1. Department of Neurosurgery, Tongji Hospital of Tongji Medical College, Huazhong University of Science and Technology, Wuhan, Hubei, China.
2. Department of Medical Genetics, School of Basic Medicine, Tongji Medical College, Huazhong University of Science and Technology, Wuhan, Hubei, China.
3. Department of Surgery, Hepatic Surgery Center, Tongji Hospital of Tongji Medical College, Huazhong University of Science and Technology, Wuhan, Hubei, China.
4. Department of Neurosurgery, Shayang County People's Hospital, Jingmen, Hubei, China.
5. Department of Physiology, School of Basic Medicine, Tongji Medical College, Huazhong University of Science and Technology, Wuhan, Hubei, China.
6. Hubei Key Laboratory of Drug Target Research and Pharmacodynamic Evaluation, Huazhong University of Science and Technology, Wuhan, Hubei, China.
7. The Institute for Brain Research, Collaborative Innovation Center for Brain Science, Huazhong University of Science and Technology, Wuhan, Hubei, China.
8. Department of Histology and Embryology, School of Basic Medicine, Tongji Medical College, Huazhong University of Science and Technology, Wuhan, Hubei, China.
Received 2021-11-30; Accepted 2022-4-26; Published 2022-5-16
Abstract

Rationale: In the glioblastoma (GBM) microenvironment, tumor-associated macrophages (TAMs) are prominent components and facilitate tumor growth. The exact molecular mechanisms underlying TAMs' function in promoting glioma stem cells (GSCs) maintenance and tumor growth remain largely unknown. We found a candidate molecule, transforming growth factor beta-induced (TGFBI), that was specifically expressed by TAMs and extremely low in GBM and GSC cells, and meanwhile closely related to glioma WHO grades and patient prognosis. The exact mechanism of TGFBI linking TAM functions to GSC-driven tumor growth was explored.
Methods: Western blot, quantitative real-time PCR (qRT-PCR), enzyme-linked immunosorbent assay (ELISA), immunofluorescence (IF), immunohistochemistry staining (IHC) and public datasets were used to evaluate TGFBI origin and level in GBM. The response of GSCs to recombinant human TGFBI was assessed in vitro and orthotopic xenografts were established to investigate the function and mechanism in vivo.
Results: M2-like TAMs infiltration was elevated in high-grade gliomas. TGFBI was preferentially secreted by M2-like TAMs and associated with a poor prognosis for patients with GBM. TGFBI promoted the maintenance of GSCs and GBM malignant growth through integrin αvβ5-Src-Stat3 signaling in vitro and in vivo. Of clinical relevance, TGFBI was enriched in the serum and CSF of GBM patients and significantly decreased after tumor resection.
Conclusion: TAM-derived TGFBI promotes GSC-driven tumor growth through integrin αvβ5-Src-Stat3 signaling. High serum or CSF TGFBI may serve as a potential diagnostic and prognostic bio-index for GBMs.
Keywords: TGFBI, tumor-associated macrophages (TAMs), glioblastoma (GBM), glioblastoma stem cells (GSCs), integrin αvβ5
Introduction
Glioblastoma (GBM) is the most frequent and malignant intracranial neoplasm and remains incurable despite maximal therapy [1, 2]. Failure of GBM treatment is partly attributable to a small population of cells expressing stemness characteristics, namely, glioblastoma stem cells (GSCs). GSCs are capable of self-renewal and differentiation, highly resistant to conventional treatments and therefore implicated in tumor progression and recurrence [3-7]. GSCs dynamically interplay and communicate with multiple noncancerous stromal cells in the tumor microenvironment, among which tumor-associated macrophages (TAMs) in particular are associated with high tumor grade and unfavorable prognosis [8-12]. As one of the main regulatory components in the tumor microenvironment, TAMs comprise as many as 30%-50% of all cells in human GBM [9] and play a critical role in tumor formation and maintenance. Interestingly, TAMs and GSCs are found to be co-enriched in hypoxic and perivascular niches and increased in recurrent GBMs, and functionally have a close relationship in conferring tumorigenesis [13-18]. According to the functional phenotypes, TAMs could be arbitrarily classified into tumor-suppressive M1-like and tumor-supportive M2-like. [16, 19-21]. TAMs in gliomas are commonly skewed toward M2-like TAMs [17].
The close association between TAMs and GSCs suggests reciprocal molecular crosstalk that is crucial for their pro-tumorigenic function. By producing soluble factors such as IL-10 [22, 23], stress inducible protein 1 [24], IL1β [25], and CCL8 [26], TAMs can activate glioma cell-intrinsic signaling responsible for proliferation, invasion and angiogenesis. However, only a few studies report on the molecular mechanism underlying the pro-tumor functions of TAMs on GSCs [18, 27]. Interrupting the molecular link mediating TAMs' effect on GSC maintenance may represent a novel and potent therapeutic target to inhibit GSC-driven tumor growth, especially given the phenotypic plasticity of TAMs and the failure of reducing the number of TAMs in the therapeutic studies based on TAM-depleting strategy [15]. We found such a candidate molecule, transforming growth factor beta-induced (TGFBI) that was specifically expressed in M2-like TAMs and extremely low in GBM and GSC cells, and meanwhile closely related to glioma WHO grades and patient prognosis. TGFBI is composed of 683 amino acids, and the secreted form has a predicted molecular weight of 68 kDa. It has been shown to participate in a broad spectrum of cellular processes, including inflammation, cell growth, tumor progression and metastasis [28-31].
In the current work, we elaborated on the molecular and signaling mechanism of TGFBI mediating TAMs pro-tumor effect on GSCs and tried to explore the potential application of TGFBI as the index of TAM functionality and tumor burden in the clinical background.
Methods
U937 cells and U937-derived M0, M1 and M2 macrophages
U937 cells were grown in Roswell Park Memorial Institute (RPMI) 1640 medium with 10% fetal bovine serum (FBS) in the humidified environment containing 5% CO2 at 37 °C. U937-induced macrophages were utilized to mimic different phenotype TAMs [32-34]. Specifically, U937 cells were induced into M0 macrophages using 5nM PMA (Sigma, Cat# P1585) for 48h firstly. Then the M0 macrophages were stimulated with 20 ng/ml of IFN-γ (Peprotech, Cat# AF300-02) and 100 ng/ml of LPS (Sigma, Cat# L4516) for an additional 48 h or a combination of IL-4 (Peprotech, Cat# AF200-04, 20 ng/ml), IL-10 (Peprotech, Cat# AF200-10, 20 ng/ml) and TGF-β (Peprotech, Cat# AF100-21C, 20 ng/ml) for an additional 72 h to establish M1-like or M2-like macrophages respectively [12, 27]. The marker genes of M0 (IBA1), M1 (iNOS, CD86), and M2 (CD163, CD206) macrophages were inspected to verify whether U937 cells were effectively polarized. The detailed information about these chemicals was listed in Table S1.
GBM tumor specimens
Six human GBM specimens were collected with informed consent. Their associated clinical information was summarized in Table S2. The tissue microarray (TMA) containing 78 representative tissue samples (Table S3) was prepared at Tongji Hospital, Huazhong University of Science and Technology. All procedures were performed following the principles of the Helsinki Declaration and approved by the institutional ethics committees.
GSCs culture and differentiation
GSCs were dissociated and functionally characterized from freshly resected GBM specimens or patient-derived GBM orthotopic xenografts [4, 35, 36]. Specifically, cells were isolated from freshly collected tumor specimens or patient-derived GBM xenografts with the Papain Dissociation System as per manufacturer instructions (Worthington Biochemical, Cat# LK003150). The isolated cells were cultured in Neurobasal medium with B27 supplement (BasalMedia, Cat# S441J7), 10 ng/ml EGF (R&D, Cat# 236-EG), 10 ng/ml FGF (R&D, Cat# 4114-TC), 10% penicillin/streptomycin (BasalMedia, Cat# S110JV), 1mM sodium pyruvate (BasalMedia, Cat# 11360070), and 2mM L-glutamine (BasalMedia, Cat# 35050061). To obtain CD133-positive cells, we used magnetically labeled CD133 microbeads (Miltenyi Biotec, Cat# 130-100-857) to separate GSC by magnetically activated cell sorting assay. These CD133-positive cells were cultured in the stem cell medium as depicted above and tested for expression of SOX2, Olig2, Nestin and absence of GFAP expression. After that, functional assays, including the sphere-forming ability, multipotent differentiation, and glioma-initiation in immunodeficient mice, were carried out to validate the cancer stem cell characteristics of the CD133+ cells. Specifically, 456 GSCs were derived from a primary GBM patient (60-year-old, sex not available); 3691 GSCs were derived from a primary GBM patient (59-year-old, female). GSCs were differentiated by culturing GSCs in the serum-containing medium (DMEM with 10% FBS) without growth factors.
Orthotopic mouse xenografts
The animal experiments were performed under the Institutional Animal Care and Use Committee guidelines and were approved by the Institutional Animal Care and Use Committee (IACUC) of Huazhong University of Science and Technology. Mice utilized in these researches were 4-week-old NU/NU nude mice purchased from Beijing Vital River Laboratory Animal Technology Co., Ltd. All mice were reared in peculiar pathogen-free cages and monitored daily by the veterinary personnel. Five mice were housed per cage, with ad libitum access to water and food. 2 × 10⁴ GSCs and 2 × 10⁴ M2 macrophages were co-injected into the right cerebral cortex of the mouse at a depth of 3.5 mm. Mice were euthanized when neurological symptoms were observed. All surgical procedures were conducted under anesthesia by intraperitoneal injection of a ketamine and xylazine cocktail. The brain samples were fixed in 4% paraformaldehyde for 24 hours, then dehydrated in 30% sucrose for an extra 48 hours, embedded in OCT at -80 °C overnight, and with cryosection thickness of 10 µm [4].
Immunofluorescence (IF) and immunohistochemistry staining (IHC)
For the Immunofluorescent staining experiments, the prepared cells and frozen tumor sections were fixed in 4% PFA for thirty minutes, washed three times with PBS, and then permeabilized in PBS containing 0.5% Triton X-100 (Solarbio, Cat# T8200) for twenty minutes. Samples were blocked with 5% albumin from bovine serum with 0.5% Triton X-100 in PBS for sixty minutes at room temperature and then incubated with primary antibodies overnight at 4 °C, followed by the corresponding secondary fluorescently labeled antibodies for one hour at room temperature [4]. The nuclei were counterstained with DAPI (Invitrogen). Images were acquired via a laser confocal microscope (OLYMPUS, FV1000) and processed utilizing ImageJ software 1.8.0.
The immunohistochemical staining of tissue sections (4 μm) was performed under standard procedures utilizing polymer detection kits and 3,30-diaminobenzene (DAB) detection (Zhongshan Jinqiao). The stained sections were digitally scanned. The immunohistochemical score (IHC-score) was employed to evaluate the expression of target proteins [37].
Immunoblotting assay (IB)
Collected cells were lysed in RIPA buffer with the addition of phosphatase and protease inhibitors (Thermo Scientific, Cat# 78442). The protein samples were resolved by SDS-PAGE and transferred onto PVDF membranes. Blots were incubated with primary antibodies overnight at 4 °C, followed by HRP-conjugated species-specific antibodies (Santa-Cruz, 1:5000). All immunoblots were carried out no less than three times.
The following antibodies were used: TGFBI (Proteintech for IB, 1:1000; for IHC, 1:100; for IF, 1:100), CD133 (Affinity for IF, 1:100), SOX2 (Proteintech for IB, 1:1000), SOX2 (Abcam for IF, 1:100), Olig2 (Proteintech for IF, 1:200), Ki67 (Proteintech for IF, 1:200), CD163 (Santa cruz for IF, 1:50; for IHC, 1:50), CD163 (Proteintech for IB, 1:1000; for IF, 1:100), CD206 (Proteintech for IB, 1:1000), IBA1 (Cell Signaling for IF, 1:50), CD86 (Proteintech for IB, 1:1000; for IF, 1:50), iNOS (Proteintech for IB, 1:1000), GFAP (Cell Signaling for IF, 1:200; for IB, 1:1000), ITGAV (Abclone for IB, 1:1000; for IF, 1:50), ITGB5(Cell Signaling for IF, 1:1600; for IB, 1:1000), Stat3 (Cell Signaling for IB, 1:1000), phospho-Stat3 (Tyr705) (Cell Signaling for IF, 1:200; for IB, 1:1000), Src (Cell Signaling for IB, 1:1000), phospho- Src (Tyr527) (Cell Signaling for IB, 1:1000; for IF, 1:100), P53 (Santa cruz for IF, 1:100; for IB, 1:500), CCND1 (Cell Signaling for IB, 1:1000; for IF, 1:50). The detailed source of these antibodies was listed in Table S4.
Lentiviral vector construction
The human TGFBI, ITGAV-specific shRNA sequences were cloned into the pLKO.1 TRC vectors (Addgene, Cat# SHC002), with the shRNA sequences listed in Table S5. The lentivirus packaging and transduction were performed as described previously [4].
Cell viability assays
One thousand cells were seeded into each well of 96-well plates with 100 μl culture medium [4]. Cell viability was assayed utilizing Cell Titer-Glo (Promega, Cat# G7572) at the indicated time. The experiment was performed in triplicate. All data were conducted in triplicate and normalized to day 0 and presented as mean ± standard deviation.
Tumorsphere formation assays and in vitro limiting dilution assay
For tumorsphere formation, GSCs were implanted into 24-well plates with a density of 1,000 cells per well for four days and tumorsphere numbers were assayed. For in vitro limiting dilution assay, increasing numbers of GSCs per well (1, 5, 10, 20, 40) were seeded into a 96-well plate with six replicates for each gradient. The sphere formation efficiency of each gradient was calculated [27].
5-Ethynyl-2′-deoxyuridine (EdU) incorporation assay
EdU assays were performed with the Cell-Light EdU Apollo567 in vitro Kit (RiboBio, Cat# C10310-1) according to the manufacturer's instructions. Cells were seeded into a 24-well plate with three replicates for each group. After incubation with 50 μM EdU for two hours, the cells were fixed in 4% paraformaldehyde and stained with Apollo Dye Solution. DAPI was used to stain the nucleic acids within the cells. Images were acquired via a laser confocal microscope (OLYMPUS, FV1000), and the number of EdU-positive cells was counted.
RNA isolation and quantitative real-time PCR (qRT-PCR)
Total RNA was extracted using TRIZOL (Invitrogen), then reversely transcribed to cDNA with HiScript II Q RT SuperMix (Vazyme, R223-01) according to the manufacturer's instructions. PCR amplifications were conducted by using ChamQ SYBR Master Mix (Vazyme, Q311-02/03). The housekeeping genes Actin or GAPDH were used for normalization. The primer pairs for qRT-PCR were listed in Table S6. Data are displayed as means ± SD from three independent experiments.
Enzyme-linked immunosorbent assay (ELISA)
Human TGFBI ELISA kits were purchased from Abcam (ab155426). Assays were performed following the manufacturer's instructions. All samples were conducted in duplicate, and data are presented as medians or means.
Data availability
The Cancer Genome Atlas (TCGA) and Chinese Glioma Genome Atlas (CGGA) glioma datasets, including RNA-seq and clinical information, were downloaded from GlioVis (http://gliovis.bioinfo.cnio.es/). GSE37475 dataset was downloaded from Gene Expression Omnibus (GEO) (https://www.ncbi.nlm.nih.gov/geo/).
Bioinformatics analysis
Single-cell RNA-sequencing (scRNA-seq) data of GSE89567 and GSE84465 were analyzed using publicly available platforms TISCH (http://tisch.comp-genomics.org/home/) and EMBL-EBI (https://www.ebi.ac.uk/gxa/sc/home). Gene set Enrichment Analysis was conducted employing an available online application (http:// software.broadinstitute.org/gsea/index.jsp). The ssGSEA (single-sample Gene set enrichment analysis) was implemented to calculate the M2-like TAMs signature score of TCGA and CGGA glioma patients.
Statistical analysis
Statistical tests, including Student's t-test, one-way ANOVA, Pearson correlation test, and log-rank test were performed using GraphPad Prism software 7.0 (GraphPad Software, Inc.) or R 3.5.3. Data in the barplot or curve are presented as mean±SD as denoted in each analysis. P < 0.05 was taken to indicate statistical significance unless otherwise stated.
Results
M2-like TAMs are elevated in high-grade gliomas
To investigate the population of TAMs in gliomas, we first analyzed a single-cell RNA-seq from the GEO database for gliomas (GSE131928) [38] with TISCH. The results showed that TAMs accounted for 29.3% of total cells (Figure 1A). To further elucidate M2-like TAMs infiltration populations, we then evaluated the score of M2-like TAMs signature, which was constructed with eight M2-like TAMs representative genes including CD163, CD206, CD68, CCL18, VEGFA, Fizz1, Arg1, IL10 in gliomas with different grades in TCGA and CGGA glioma cohort with ssGSEA. The result revealed that the M2-like TAMs infiltration was elevated as the tumor grade increased (Figure 1B, Figure S1A) and more M2-like TAMs infiltration in IDH-wildtype (WT) gliomas compared with IDH-mutant gliomas (Figure 1C, Figure S1B). We further investigated the relationship between M2-like TAMs signature and clinic prognosis of gliomas with the Kaplan-Meier analysis. The results demonstrated that M2-like TAMs infiltration was negatively associated with survival for glioma patients (Figure 1D, Figure S1C).
M2-like TAMs infiltrate more in high-grade gliomas. (A) t-SNE analysis of 13553 cells of nine glioma patients (GSE131928) showed TAMs accounted for 29.3% of total cells [38]. (B) ssGSEA of M2-like TAMs signature genes in TCGA-glioma dataset showed M2-like TAMs signature score increased with higher grade gliomas. ****P ˂ 0.0001, ANOVA, analysis of variance. (C) Violin plot of M2-like TAMs signature score in IDH-WT and IDH-mutant gliomas from the TCGA database. ****P < 0.0001, Student's t-test. (D) Kaplan-Meier survival plots of M2-like TAMs signature score showed a higher score indicated a poorer prognosis. P ˂ 0.001, log-rank test. (E) Representative IHC staining of CD163 in glioma microarray. Scale bar represents 20 µm. (F) Quantification of the IHC images demonstrated that the score of CD163 increased with increasing WHO grade. **P < 0.01, ANOVA, analysis of variance. (G) Kaplan-Meier survival plot of CD163 expression of glioma patients from the glioma microarray. P = 0.025, log-rank test.
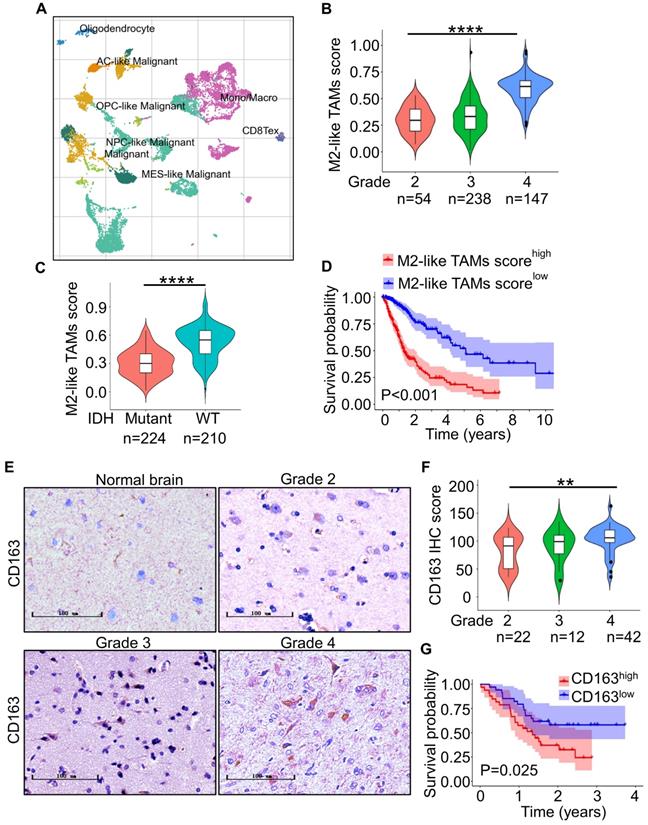
To confirm the above results at the protein level, we performed IHC staining of CD163 in 76 glioma specimens from TMA. The result showed CD163 expression was higher in high-grade gliomas (Grade 3 and 4) in comparison to low-grade gliomas (Grade 2) (Figure 1D and 1E). Importantly, higher CD163 expression informed poorer overall survival in glioma patients (Figure 1F). Together, these data suggest that M2-like TAMs infiltration is increased in high-grade gliomas.
TGFBI is preferentially secreted by M2-like TAMs and associated with poor prognosis for patients with GBM
M2-like TAMs, constituting the majority of macrophages in GBM [12, 39], fostered GSCs phenotype to mediate pro-tumor function via secreted mediators. To identify potential critical proteins secreted by M2-like TAMs, we screened three datasets, including GSE37475 (with 258 differentially expressed genes between M2high TAMs and M2low TAMs, Figure S2A) [15], genes encoding for secreted proteins and macrophage cell enhanced genes from the Human Protein Atlas (http://www.proteinatlas.org). The intersection of the three datasets comprised three genes (Figure 2A): AOAH, TGFBI, TIMP1. Additional survival analyses of GBM patients in TCGA database revealed that only TGFBI and TIMP1 expression were negatively associated with overall survival (Figure S2B), indicating their potential clinical significance in GBM progress. Next, glioma scRNA-seq datasets (GSE84465 [40] and GSE148842 [41]) were analyzed to validate the relationship between TGFBI, TIMP1 and M2-like TAMs. T-distributed stochastic neighbor embedding (t-SNE) plots of GSE148842 and GSE84465 demonstrated that TGFBI was mainly expressed in TAMs (Figure 2B, Figure S2C), while TIMP1 was evenly expressed in almost all cell types (Figure S2C). We further explored their co-distribution with CD163, CD206 (markers of M2-like TAMs) in the two datasets. The t-NSE plots revealed that the co-distribution of TGFBI with CD163 and CD206 was much better than TIMP1 (Figure 2B right, Figure S2C). Meanwhile, the correlation analyses of TGFBI and CD163 in TCGA-GBM, CGGA-GBM, Rembrandt-GBM, Gravendeel-GBM databases suggested a strong positive correlation (Figure S2D). These bioinformatics analyses suggested that TGFBI was the potential molecular preferentially secreted by M2-like TAMs in the glioma microenvironment.
TGFBI is preferentially secreted by M2-like TAMs and indicates poor prognosis in GBM patients. (A) Venn diagram demonstrating the overlapping of three datasets, GSE37475 (207 genes upregulated in M2-like TAMs) [15], macrophage cell enhanced genes and genes encoding for secreted proteins from the Human Protein Atlas (http://www.proteinatlas.org), comprised three genes: AOAH, TGFBI, TIMP1. (B) t-SNE analysis of 111397 cells of seven glioma patients (GSE148842) [72]. Differential coloring in cell clusters was annotated according to the dominant cell type (left). Expression of cell-type-specific TGFBI, TIMP1, CD163 and CD206 overlaid on the t-SNE space (right). (C) qRT-PCR analyses of TGFBI expression in M0, M1 and M2 macrophages. N = 3, ****P < 0.0001, Student's t-test. (D) Immunoblot analysis of TGFBI, the M1 macrophage marker (CD86, iNOS) and M2 macrophage marker (CD163, CD206) expression in U937-derived M1 (M1) or M2 macrophages (M2). (E) The concentration of TGFBI in cells (M0, M1, M2) culture supernatants were assayed by ELISA. N = 3, **P < 0.01, ***P < 0.001, Student's t-test. (F) Representative immunofluorescent (IF) staining of TGFBI and the M2-like TAMs marker (CD163) in human GBM tissues. Areas indicated with solid and dashed square lines respectively represented the CD163 high and low expression groups. Scale bar represents 20 µm. (G) Quantification of the IF images (F) demonstrating abundant TGFBI expression in the CD163-enriched areas in human GBMs. N = 3, ****P < 0.0001, Student's t-test. (H) Representative IHC staining of TGFBI and CD163 in glioma microarray. Scale bar represents 100 µm. (I) Correlation analysis of TGFBI and CD163 expressions in glioma microarray (H), Pearson's r test. (J) Kaplan-Meier survival plot of TGFBI expression of glioma patients from the glioma microarray. P < 0.001, log-rank test. (K) Kaplan-Meier survival plot of TGFBI expression of GBM patients from CGGA cohort. P < 0.05, log-rank test.
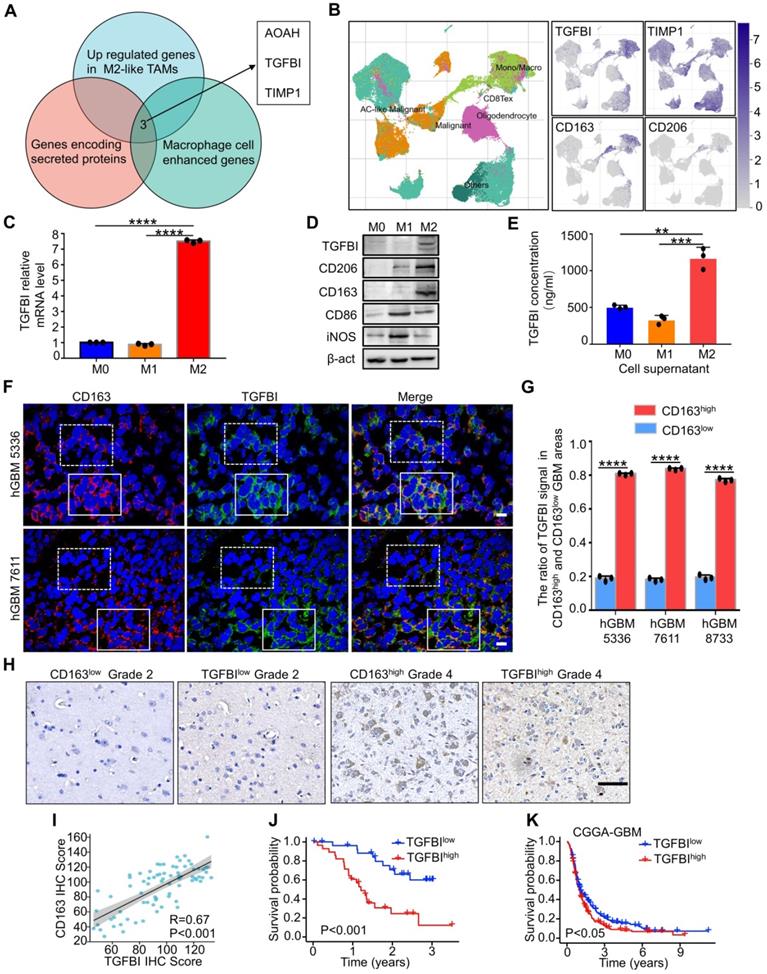
To validate the results from bioinformatics analysis, we investigated TGFBI expression in primed M0, M1, and M2 macrophages in vitro in polarized U937 monocytic cells to mimic TAMs as described [27, 33]. Representative genes of M1 (iNOS, CD86) and M2 (CD163, CD206) macrophages were detected and polarization of U937 cells was validated (Figure S2E). The results indicated that TGFBI level was higher in M2 than M0 and M1 macrophages at RNA and protein levels (Figure 2C, 2D, and Figure S2E-S2H) and in cell culture supernatants as indicated by ELISA (Figure 2E). To further investigate if TGFBI was associated with M2-like TAMs in vivo, frozen human GBM sections were co-immunostained with CD163. The results showed that CD163 co-distributed with TGFBI, and high levels of CD163+ TAMs expressed more TGFBI (Figure 2F, 2G, and Figure S2I). TGFBI expression was markedly decreased in tumor regions lacking M2-like TAMs. Similarly, IHC analysis revealed a strong positive correlation between TGFBI and CD163 in glioma patients (Figure 2H and 2I). The Kaplan-Meier analysis of TGFBI expression in 76 gliomas indicated that higher expression denoted shorter survival time (Figure 2J). Significantly, higher TGFBI expression also informed poorer survival in CGGA-GBM patients (Figure 2K), indicating a potential pro-tumorigenic effect of TGFBI in promoting GBM malignancy. Collectively, these data demonstrated that TGFBI was preferentially secreted by M2-like TAMs and indicated poor prognoses in GBM patients.
TGFBI is distributed around GSCs and mediates the pro-tumorigenic effect of M2-like TAMs
Peripheral blood mononuclear cells could be recruited and re-educated into M2-like TAMs by GSCs to promote tumor enlargement [32]. To determine whether TGFBI can mediate the tumor-promoting effect of M2-like TAMs, we studied the potential co-distribution between TGFBI and GSCs in human GBM frozen sections. Immunofluorescent staining of TGFBI and the GSC marker CD133, Olig2 demonstrated CD133+, Olig2+ cells were surrounded by abundant TGFBI (Figure 3A), indicating their co-distribution. To further validate the function of TGFBI in GSC maintenance, we examined whether the exogenous recombinant human TGFBI (rhTGFBI) protein could promote GSC self-renewal and tumor growth. The addition of rhTGFBI increased the GSCs sphere number (Figure 3B-C), the cell viability (Figure 3D) and the fraction of GSCs able to form spheres (Figure 3E). EdU incorporation demonstrated rhTGFBI increased GSCs proliferation (Figure 3F-G).
TGFBI mediates the tumor-promoting effect of M2-like TAMs. (A) Representative immunofluorescence (IF) staining of TGFBI and stem cell markers (CD133, Olig2) in human GBM were shown. Nuclei were counterstained with DAPI (blue). Scale bar represents 20 µm. (B) Representative tumorsphere images of GSCs (456 and 3691) cultured with rhTGFBI or control for 48 hours. Scale Bar: 400 µm. (C) Quantification of tumorspheres in (B). N = 3, **p < 0.01, Student's t-test. (D, E) Cell viability (D) and in vitro limiting dilution (E) assay of GSCs (456 and 3691) cultured with rhTGFBI or control. N = 6 biological independent samples. Data were represented as means ± SD, ****p < 0.0001, Student's t-test (D); *p < 0.05, likelihood ratio test (E). (F) Representative IF images of EdU incorporation. Scale bar represents 20 µm. (G) The quantification of the percentage of EdU+ cells. N = 3, *p < 0.05, **p < 0.01, Student's t-test. (H) IB analysis showed the extent of TGFBI knockdown in M2 macrophages. GAPDH was used as a loading control. (I) Representative HE staining of mouse brain (cross-section) 25 days after transplantation. Scale bar represents one cm. (J) Representative IF images of Ki67 in mouse models. Scale bar represents 200 µm. (K) Kaplan-Meier survival plot of mice co-implanted with GSCs (456) and shTGFBI M2 macrophages or shNT M2 macrophages. N = 9 for each group, **p < 0.01, ***p < 0.001, log-rank test.
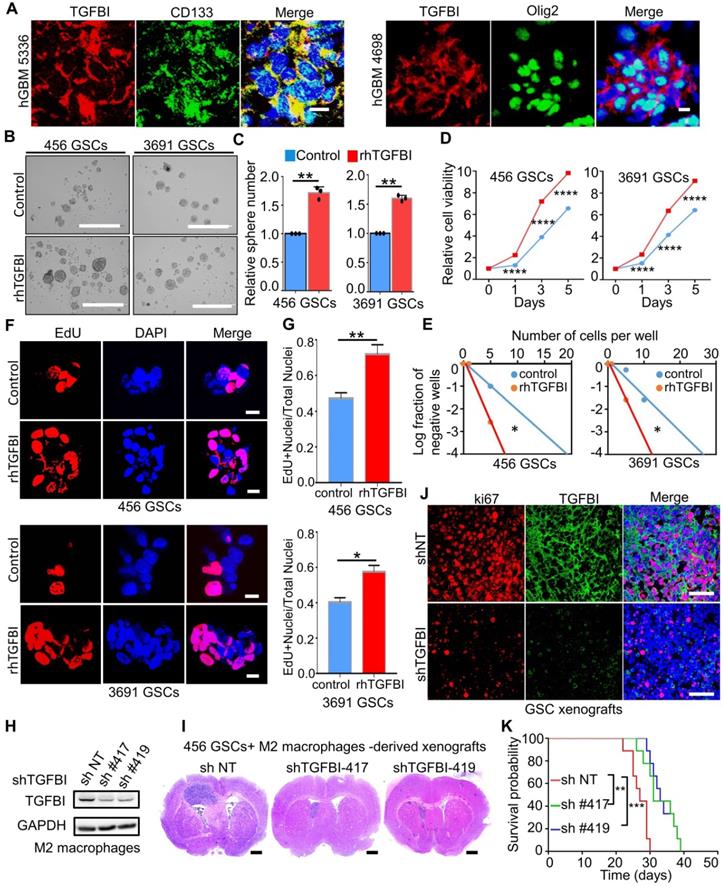
Next, we investigated whether the knockdown of TGFBI could reduce the pro-tumorigenic effect of M2-like TAMs in GSC xenografts. Two distinct sets of non-overlapping small hairpin RNA (shRNA) were introduced to silence TGFBI in M2 macrophages, and its expression level was essentially lower than the non-targeting scramble shRNA (shNT, Figure 3H). We performed orthotopic GBM xenografts with co-injection of M2-macrophages expressing shTGFBI or shNT with the GSCs. When the first mouse of shNT showed neurologic signs, one mouse of each shTGFBI group was sacrificed for histological analysis. Haematoxylin and eosin staining demonstrated that shTGFBI mice harbored smaller tumor engraftments compared to shNT (Figure 3I). We then examined the proliferation of tumor cells from shNT and shTGFBI mice. Tumors from shTGFBI mice exhibited lower levels of proliferation (Ki67) (Figure 3J and Figure S3A-3B). IF staining with CD163 antibodies recognizes different species-derived antigens indicated the recruited macrophages (murine-derived TAMs) account for about 10% of the total macrophages (Figure 3J and Figure S3C-3D). Consequently, mice co-implanted with GSCs and shTGFBI M2-macrophages had significantly longer survival than those control mice (Figure 3K). Taken together, these data suggested that the M2-like TAMs-secreted TGFBI played an essential role in mediating the pro-tumorigenic effect of M2-like TAMs in GBMs.
TGFBI could induce the reversion of differentiated GSCs
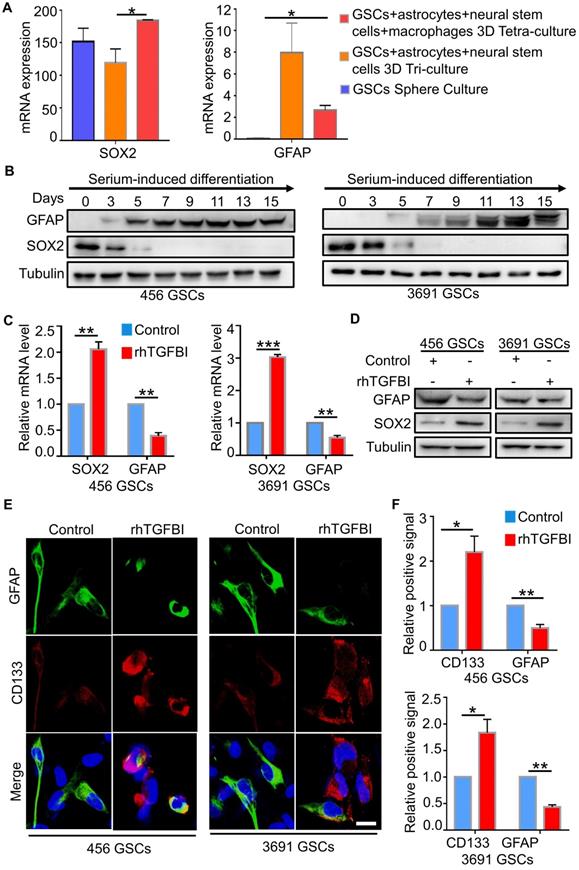
GSCs exhibit cellular plasticity, displaying that differentiated GSCs can acquire GSCs stemness due to the microenvironment alteration [42-44]. The tetra-culture model, including macrophages, demonstrated an upregulated GSC signature and a downregulated differentiated glioblastoma cells (DGCs) signature compared to the tri-culture model without macrophages (Figure 4A) [45]. To investigate whether M2-like TAMs-secreted TGFBI could induce the reversion of differentiated GSCs, we induced in vitro differentiation of GSCs by withdrawing growth factors and adding serum-containing medium (DMEM with 10% FBS) [32]. After five days of serum induce, these cells displayed the differentiation marker GFAP with disappeared stemness marker SOX2, indicating successful differentiation (Figure 4B). Next, we applied rhTGFBI (10 ug/ml) into the medium of differentiated GSCs for 48 hours. Analysis of the corresponding markers showed that the cells with rhTGFBI stimulation re-expressed SOX2, CD133 and decreased in GFAP content (Figure 4C-F). Collectively, these data revealed M2-like TAMs-derived TGFBI could induce differentiated GSCs back to GSC-like cells.
TGFBI can de-differentiate differentiated GSCs. (A) The mRNA level of GFAP and SOX2 in three different culture systems [45]. *p < 0.05, Student's t-test for SOX2, ANOVA, analysis of variance for GFAP. (B) IB analysis of GFAP, SOX2 in GSCs (456 and 3691) cultured in serum-induced differentiation medium over a 15-day span. (C, D, E) qRT-PCR analyses (C), IB analyses (D), Representative IF images (E) of the GSC markers (CD133), the differentiation markers (GFAP) in GSCs (456 and 3691) cultured with rhTGFBI or control. Scale bar represents 20 µm. N = 3, **P < 0.01, ***p < 0.001, Student's t-test. (F) The quantification of IF images (E) showed DGCs with rhTGFBI stimulation re-expressed of CD133 and decreased in GFAP content. N = 3, *p < 0.05, **P < 0.01, Student's t-test.
Integrin αvβ5 is a receptor for TGFBI on GSCs
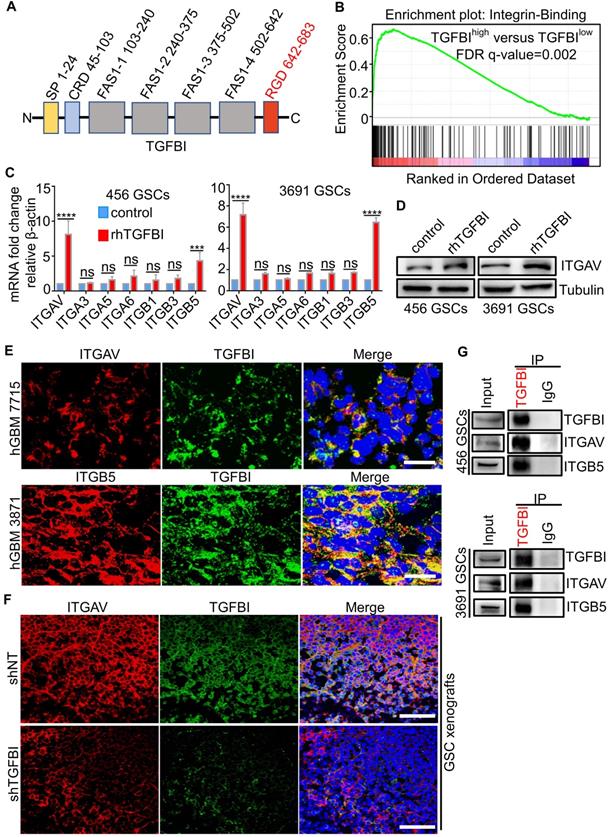
To investigate the molecular mechanisms that mediate the pro-tumorigenic effect of TGFBI on GSCs, we attempt to determine the receptor for TGFBI. The protein structure of TGFBI includes Arg-Gly-Asp (RGD) motifs in the C-terminus, known as integrin-binding motifs (Figure 5A) [28, 29]. Previous reports indicated TGFBI exerted biological function via binding the integrins located on the cellular surface in other cancers [46-48]. We performed GSEA of the TGFBIhigh expression versus TGFBIlow expression in TCGA-GBM RNA-seq and found the integrin-binding pathway was significantly upregulated in the TGFBIhigh group (Figure 5B). Integrins containing two subunits of α and β, αv [49], α3 [50], α5 [51], α6 [52], β1 [53], β3 [51], and β5 [49] were known to be expressed explicitly in GSCs and maintained the GSCs stemness and tumor growth. To explore the specific subunits mediating the signal of TGFBI on GSCs, we examined changes in RNA expression of the above integrins using qRT-PCR after GSCs stimulated with rhTGFBI. Integrin αv (ITGAV) and β5 (ITGB5) were the most significantly upregulated in GSCs (456 and 3691) (Figure 5C), of which ITGAV was validated by immunoblot (Figure 5D). IF staining demonstrated TGFBI and ITGAV, ITGB5 co-located on GSCs membrane in human GBM samples (Figure 5E) and mouse xenografts samples (Figure 5F). Compared to shTGFBI tumors, the fluorescence signal of ITGAV and TGFBI in shNT group was much stronger (Figure 5F). Furthermore, we verified the interaction between TGFBI and ITGAV, ITGB5 by co-immunoprecipitation with the anti-TGFBI antibody (Figure 5G). The correlation between TGFBI and ITGAV, ITGB5 were strongly positive in mRNA level in TCGA-GBM (Figure S4A) and CGGA-GBM cohorts (Figure S4B). Meanwhile, integrin αv, β5 were significantly overexpressed in the TCGA-GBM sample compared to the normal brain (Figure S4C). GBM patients with a high level of both ITGAV and ITGB5 indicated a shorter survival time (Figure S4D). Taken together, these data suggest that integrin αvβ5 is the receptor mediating the signal of TGFBI on GSCs.
TGFBI functions via binding to integrin αvβ5 on GSCs. (A) Schematic diagram of TGFBI protein structure. It contained a secretory signal (SP) in the N-terminal cysteine-rich domain (CRD), followed by four fasciclin-1 domains (FAS1 1-4) and Arg-Gly-Asp (RGD) in the C-terminal. The RGD motif could bind the integrins. (B) GSEA of the TGFBI high expression versus low expression in TCGA GBM RNA-seq indicated the integrin-binding pathway was significantly upregulated in the TGFBI high expression group. (C) qRT-PCR analyses of the expression of the αv, α3, α5, α6, β1, β3, and β5 in GSCs (456 and 3691) cultured with rhTGFBI or control. N = 3, ***P < 0.001, ****P < 0.0001, ANOVA, analysis of variance. (D) IB analysis of ITGAV in GSCs (456 and 3691) cultured with rhTGFBI or control. (E) Representative immunofluorescence (IF) staining of TGFBI and the potential receptors (ITGAV and ITGB5) in human GBM were shown. Scale bar represents 20 µm. (F) Representative IF images of ITGAV and TGFBI in mouse models. Scale bar represents 200 µm. (G) Co-immunoprecipitation of ITGAV and ITGB5 with the TGFBI-specific antibody from 456 and 3691 GSC cell lysates. Immunoglobulin G (IgG) was used as a control antibody for IP.
TGFBI signals via integrin αvβ5-Src-Stat3 to function the pro-tumorigenic effect
To further delineate the downstream pathways mediating the TGFBI- integrin αvβ5 signaling in GSCs, we performed Kyoto Encyclopedia of Genes and Genomes (KEGG) pathway enrichment analysis of upregulated genes (fold change ≥ 2.0) in the rhTGFBI stimulation group versus the control group (Figure 6A). The results indicated that the focal adhesion pathway was one of the two most clearly affected with rhTGFBI stimulation. Consistently, the focal adhesion and JAK-STAT signaling pathways were also enriched in TGFBIhigh-ITGAVhigh-ITGB5high group in the TCGA-GBM cohort (Figure S5A). TGFBI had been found to promote metastasis via integrin αvβ5-Src axis in human colon cancer cells [54]. Phosphorylation of Stat3 in human hepatocellular carcinoma stem cells mediated the promote self-renewal effect of TAMs [55]. Simultaneously, the protein-protein interaction (PPI) network built using STRING (http://string-db.org/) indicated that the TGFBI-integrin αvβ5-Src-Stat3 axis might be a functional protein association network in GSCs (Figure S5B). We then validated P-Src and P-Stat3 were upregulated in GSCs after rhTGFBI stimulation via immunoblotting assay, whereas knockdown of ITGAV attenuated their activation (Figure 6B-6C). The downstream targets of P-Stat3, CCND1 and P53, changed correspondingly (Figure 6B-6C). When the inhibitor of ITGAV and ITGB5 (SB273005) was applied in GSCs, the activation of P-Src and P-Stat3 by rhTGFBI was inhibited compared to the control group (Figure S5C).
TGFBI mediates the pro-tumorigenic effect via the integrin αvβ5-Src-Stat3 axis. (A) KEGG pathway enrichment analysis of upregulated genes (fold change ≥ 2.0) in the rhTGFBI stimulation group versus the control group (456 GSCs). (B, C) Immunoblot analyses of phospho-Src (P-Src-Y527), total Src, phospho-Stat3 (P-Stat3-Y705), total Stat3, P53 and CCND1, indicated that rhTGFBI stimulation significantly increased Src and Stat3-activating phosphorylation (B), while the knockdown ITGAV treatment compromised rhTGFBI-stimulated Src and Stat3 activation in GSCs (C). (D) IF stainings of TGFBI and P-Src (upper left), P-Stat3 (upper right), P53 (bottom left), CCND1 (bottom right) in human GBMs. The scale bars measure 10 µm. Nuclei were counterstained with DAPI (blue). (E) IF stainings of TGFBI and P-Src (upper left), P-Stat3 (upper right), P53 (bottom left), CCND1 (bottom right) in GBM xenografts with shNT or shTGFBI. Nuclei were counterstained with DAPI (blue). The scale bars measure 200 µm.
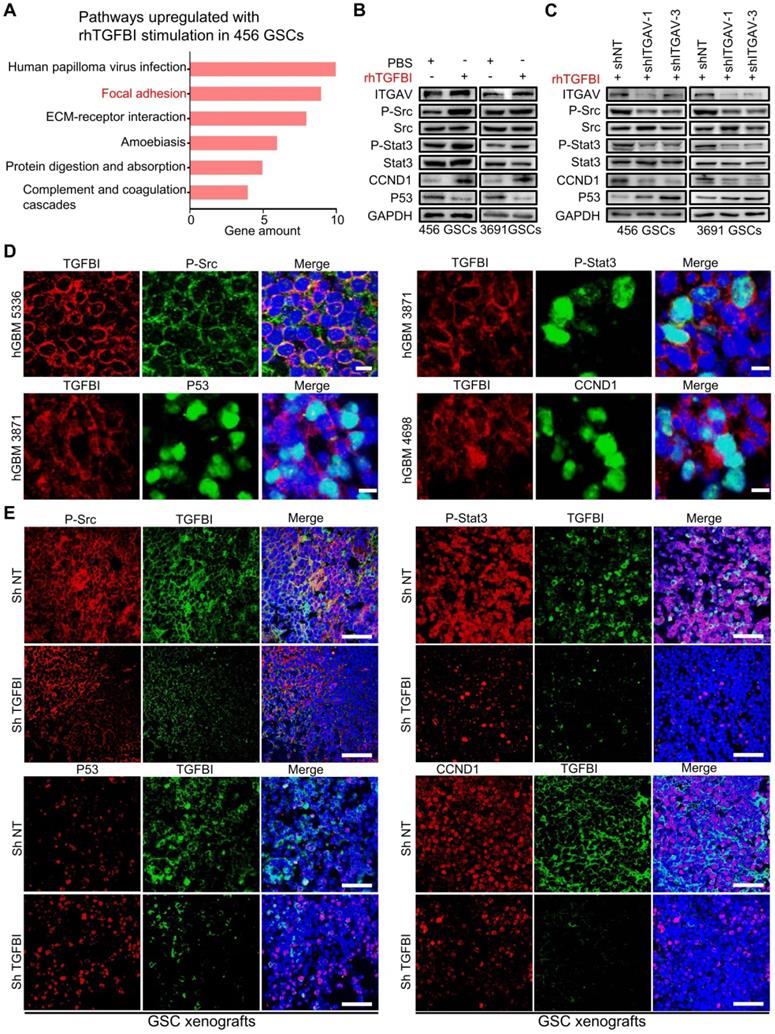
We next evaluated the expression of TGFBI and P-Src, P-Stat3, CCND1, and P53 in three different human GBM specimens. By IF co-staining, TGFBI co-expressed with P-Src and P-Stat3 (Figure 6D) and also co-expressed with the P-Stat3 downstream targets CCND1 and P53 (Figure 6D). We further assessed their expression in orthotopic models. Compared to shNT tumors, the fluorescence signal of P-Src and P-Stat3 in tumors with TGFBI knockdown was much weaker (Figure 6E). As expected, the fluorescence signal of CCND1 and P53 changed correspondingly (Figure 6E). Collectively, these data showed that the TGFBI-integrin αvβ5 binding activated Src phosphorylation, thus upregulating the Stat3 pathway for the pro-tumorigenic effect.
TGFBI could be used as a potential bio-index in the assessment of GBM diagnosis and progression
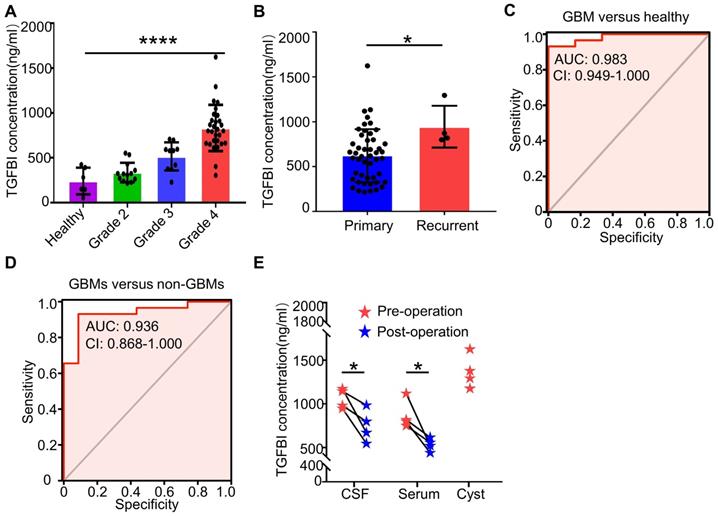
TGFBI had been reported to exhibit higher serum levels in brain tumor patients compared to non-tumor patients [46]. To investigate its serum range in glioma patients and the healthy cohort, we assayed serum TGFBI levels in 6 healthy controls and 52 glioma patients. Of which four cystic GBM patients, the preoperative serum and cerebrospinal fluid (CSF), intraoperative sac fluid, serum and CSF TGFBI concentrations on the seventh day after surgery were also assayed. Identical collection and preservation procedures were utilized for all samples. The results showed serum TGFBI concentrations of GBMs were much higher than healthy controls, WHO grade 2 and grade 3 gliomas (Figure 7A). In recurrent gliomas, the mean protein level of TGFBI was higher than in primary gliomas (Figure 7B). Receiver-operator characteristic (ROC) analyses of TGFBI concentrations between GBM patients and healthy controls exhibited an area under the curve (AUC) of 0.983 (Figure 7C). And the AUC of GBMs versus non-GBMs (WHO grade 2 and WHO grade 3) was 0.936 (Figure 7D). Furthermore, of the four cystic GBM patients, sac fluid contained more TGFBI than preoperative-serum and CSF (Figure 7E). Interestingly, the postoperative TGFBI concentration in serum and CSF decreased significantly (Figure 7E). Taken together, these data suggested TGFBI could be used to assess the diagnosis and progression of GBM.
TGFBI could be used as a potential bio-index in the assessment of GBM diagnosis and progression. (A) Serum TGFBI concentrations in six healthy controls and 52 glioma patients (grade 2 (n = 13), grade 3 (n = 10), grade 4 (n = 29)). ****p < 0.0001, ANOVA, analysis of variance. (B) Serum TGFBI concentrations in 48 primary gliomas and four recurrent gliomas. *p < 0.05, Student's t-test. (C, D) Receiver-operator characteristic (ROC) analyses of TGFBI concentrations between GBM patients and healthy controls (C), non-GBM patients (WHO grade 2 and grade 3) (D) respectively exhibited an AUC of 0.983 and 0.936. (E) The dot plots show the changes in the CSF, serum values for TGFBI before and seven days post-resection for the four cystic GBM patients. The intro-operative sac fluid was also assayed for TGFBI concentration. *P < 0.05, Student's t-test.
Discussion
GBM exhibits striking cellular heterogeneity, with abundant TAMs in the tumor microenvironment [9]. Previous research indicated that high TAMs accumulation in gliomas was associated with an unfavorable prognosis [12]. Consistently, we integrated eight marker genes of M2-like TAMs to construct a gene signature for M2 TAMs and confirmed the signature was positively correlated with WHO grades and indicated dismal survival. However, the exact molecular mechanisms underlying TAMs' functions in promoting GSC maintenance and GSC-driven tumor growth remain largely unknown, except for a few studies reporting molecules, e.g., TGFβ1 [18] and PTN [27] were specifically involved. In this study, we uncovered that M2-like TAMs secreted the extracellular matrix protein TGFBI to enhance GSCs stemness characteristics and GBM progression. Knocking down TGFBI by shRNA largely abrogated the tumor-supportive effect of TAMs compared to shNT. Increased TAM-derived TGFBI has been found in ovarian cancer and is related to tumor growth and dismal prognosis [56, 57]. TGFBI secreted by TAMs in ovarian cancer contributed to an immunosuppressive TME and promoted cell migration, and meanwhile, anti-TGFBI antibody treatment reduced peritoneal tumor size in the orthotopic mouse model [56, 57]. In gastrointestinal tract cancers and urothelial carcinomas, TGFBI also facilitated cell proliferation and migration, although the source of TGFBI in these cancers was found to be tumor cell derived [31, 46, 54, 58]. Our results indicated the critical role of TGFBI secreted by M2-like TAMs in GSC-driven glioma growth, adding credence to the importance of TGFBI across cancers.
By protein domain analysis and co-immunoprecipitation assay, we identified integrin αvβ5 as the membrane receptor mediating TGFBI signaling in GSCs. In pancreatic and colon cancers, tumor cell-derived TGFBI has also been reported to function via binding to integrin αvβ5 [54, 58]. Notably, integrin αvβ5 was deemed as a functional GSC marker essential for GBM maintenance, and specifically mediated infection of oncolytic virus Zika in GSCs. Meanwhile, targeting integrin αvβ5 attenuated GSC viability and self-renewal, reducing GSC-driven tumor growth in mice [59]. Our results suggested TGFBI as an active ligand of integrin αvβ5 mediating M2-like TAMs functions on GSCs, and binding of TGFBI to integrin αvβ5 on GSCs increased phosphorylation of the tyrosine kinase Src, with elevated phosphorylation of Stat3. Consistently, the integrin-Src-Stat3 pathway has been reported to be involved in maintaining stemness and promoting the proliferation of cancer stem cells in various tumors [60-66]. Noteworthy, although Src-Stat3 is the main downstream pathway activated, integrin αvβ5 also functions as a cellular membrane receptor on a wide range of substrates that activate multiple signaling and influence additional cellular activities.
Targeting the molecular link mediating TAMs pro-tumor effect on glioma cells represents an attractive therapeutic strategy. By secreting various factors and affecting other immune cells, TAMs have been demonstrated to be involved directly or indirectly in promoting multiple aspects of tumorigenesis [67]. Therapeutic strategies based on or combined with TAMs have the potential to improve the treatment efficacy of cancer therapies, and the strategies can be broadly divided into reducing the number of TAMs or altering their functionality within the tumor microenvironment [68]. Notably, Pyonteck SM et al. found CSF1/CSF1R blockade, the most widely studied axis for TAM depletion and reducing tumor volume in several xenograft models [15], blocked glioma growth and progression through a mechanism in which TAMs were not depleted but were instead 're-educated' within the glioma microenvironment [15]. Given the dynamics and plasticity of TAMs phenotypes during tumor progress and recurrence [15, 67], targeting the paracrine factors secreted by TAMs, instead of TAMs themselves, may be a more actionable strategy. TGFBI, specifically secreted by TAMs and presented very low in GBM cells as analyzed using the single-cell sequencing data (Figure 2B and Figure S2C), constitutes such an ideal target, and significantly its expression remains high from the primary to recurrent tumors (Figure 7B).
Identifying diagnostic and prognostic markers for GBM in more accessible specimens such as blood and/or CSF would help clinical treatment decision-making and monitoring. A few proteins of parenchymal glioma origin have been reported to be detected in patient blood and are of clinical relevance [69-71]. The proteins include GFAP, YKL‑40 and IGFBP-2, which are either cytoskeletal proteins in astroglial tumors, or overexpressed genes of the tumor cells that may be involved in tumorigenesis. Among these proteins of glioma cell origin, only YKL-40 is found to be also secreted by TAMs [71]. Different from these markers, TGFBI is secreted by TAMs and very low in GBM cells. Together with its critical role in enhancing glioma growth, TGFBI level in patient serum/CSF may distinctly index TAM abundance and its functionality in glioma progress. Our clinical data accordingly demonstrates a positive correlation of the serum and CSF TGFBI levels with tumor malignancy and tumor burden of glioma patients. Therefore, we are about to further confirm whether serum TGFBI is an early warning index for GBM recurrence. Expanded longitudinal studies of the serum and CSF TGFBI level measured prospectively in glioma patients are warranted for its potential application as a glioma circulating marker.
In summary, our data demonstrated that TGFBI was secreted by M2-like TAMs, promoting the maintenance of GSCs and glioma growth through integrin αvβ5-Src-Stat3 signaling. Disruption of TGFBI-integrin αvβ5 signaling attenuated the tumor-promoting effect of TAMs and extended mice survival time, indicating this pathway as an attractive therapeutic target for GBM. In addition, high serum or CSF TGFBI may serve as a potential diagnostic and prognostic bio-index for GBMs.
Abbreviations
GBM: glioblastoma; GSCs: glioblastoma stem cells; TAMs: tumor-associated macrophages; TGFBI: transforming growth factor beta-induced; FBS: fetal bovine serum; IF: immunofluorescence; IHC: immunohistochemistry staining; EdU: 5-Ethynyl-2′-deoxyuridine; qRT-PCR: quantitative real-time PCR; ELISA: enzyme-linked immunosorbent assay; TCGA: The Cancer Genome Atlas; CGGA: Chinese Glioma Genome Atlas; GEO: Gene Expression Omnibus; TMA: Tissue microarray; scRNA-seq: single-cell RNA-sequencing; ssGSEA: single-sample Gene set enrichment analysis; DGCs: differentiated glioblastoma cells; ITGAV: Integrin αv; ITGB5: Integrin β5; KEGG: Kyoto Encyclopedia of Genes and Genomes; ROC: Receiver-operator characteristic; AUC: area under the curve.
Supplementary Material
Supplementary figures and tables.
Acknowledgements
We thank Professor Shideng Bao and Jeremy N. Rich for providing GSCs. We thank Dr. Pingfan Lu for providing U937 cells. We thank all of Yu Laboratory members for their kind help. Thanks to Professor Guifa Xi for reading the manuscript carefully and putting forward helpful comments. This research was supported by: the National Natural Science Foundation of China, NO. 82072795 (Feng Wan); the program for HUST Academic Frontier Youth Team (Xingjiang Yu); Huazhong University of Science and Technology Independent Innovation Research Fund Project, NO.2019kfyXJJS187 (Xingjiang Yu).
Author Contributions
Bin Zhang, Xingjiang Yu and Feng Wan designed this study; Peng Peng, Hongtao Zhu, Dan Liu, Zirong Chen, Minhai Dong, Po Zhang, and Guohao Liu performed experiments; Zhongyin Guo, Minhai Dong, Lijun Wan, Suojun Zhang, Fangyong Dong, Feng Hu, Fangling Cheng, Shijun Huang, and Dongsheng Guo prepared samples; Peng Peng, Xiaolin Zhang, Po Zhang, and Guohao Liu analyzed data; Peng Peng, Bin Zhang, Xingjiang Yu and Feng Wan wrote the manuscript. All authors read and approved the final manuscript.
Competing Interests
The authors have declared that no competing interest exists.
References
1. Tan AC, Ashley DM, López GY, Malinzak M, Friedman HS, Khasraw M. Management of glioblastoma: State of the art and future directions. CA Cancer J Clin. 2020;70:299-312
2. Louis DN, Perry A, Wesseling P, Brat DJ, Cree IA, Figarella-Branger D. et al. The 2021 WHO Classification of Tumors of the Central Nervous System: a summary. Neuro Oncol. 2021;23:1231-51
3. Bao S, Wu Q, McLendon RE, Hao Y, Shi Q, Hjelmeland AB. et al. Glioma stem cells promote radioresistance by preferential activation of the DNA damage response. Nature. 2006;444:756-60
4. Man J, Yu X, Huang H, Zhou W, Xiang C, Huang H. et al. Hypoxic Induction of Vasorin Regulates Notch1 Turnover to Maintain Glioma Stem-like Cells. Cell stem cell. 2018;22:104-118.e6
5. Wan F, Zhang S, Xie R, Gao B, Campos B, Herold-Mende C. et al. The utility and limitations of neurosphere assay, CD133 immunophenotyping and side population assay in glioma stem cell research. Brain Pathol. 2010;20:877-89
6. Jung E, Osswald M, Ratliff M, Dogan H, Xie R, Weil S. et al. Tumor cell plasticity, heterogeneity, and resistance in crucial microenvironmental niches in glioma. Nat Commun. 2021;12:1014
7. Chen J, Li Y, Yu TS, McKay RM, Burns DK, Kernie SG. et al. A restricted cell population propagates glioblastoma growth after chemotherapy. Nature. 2012;488:522-6
8. Prosniak M, Harshyne LA, Andrews DW, Kenyon LC, Bedelbaeva K, Apanasovich TV. et al. Glioma grade is associated with the accumulation and activity of cells bearing M2 monocyte markers. Clin Cancer Res. 2013;19:3776-86
9. Charles NA, Holland EC, Gilbertson R, Glass R, Kettenmann H. The brain tumor microenvironment. Glia. 2012;60:502-14
10. Bingle L, Brown NJ, Lewis CE. The role of tumour-associated macrophages in tumour progression: implications for new anticancer therapies. J Pathol. 2002;196:254-65
11. Hussain SF, Yang D, Suki D, Aldape K, Grimm E, Heimberger AB. The role of human glioma-infiltrating microglia/macrophages in mediating antitumor immune responses. Neuro Oncol. 2006;8:261-79
12. Komohara Y, Ohnishi K, Kuratsu J, Takeya M. Possible involvement of the M2 anti-inflammatory macrophage phenotype in growth of human gliomas. J Pathol. 2008;216:15-24
13. Deininger MH, Pater S, Strik H, Meyermann R. Macrophage/microglial cell subpopulations in glioblastoma multiforme relapses are differentially altered by radiochemotherapy. J Neurooncol. 2001;55:141-7
14. Yin J, Kim SS, Choi E, Oh YT, Lin W, Kim TH. et al. ARS2/MAGL signaling in glioblastoma stem cells promotes self-renewal and M2-like polarization of tumor-associated macrophages. Nat Commun. 2020;11:2978
15. Pyonteck SM, Akkari L, Schuhmacher AJ, Bowman RL, Sevenich L, Quail DF. et al. CSF-1R inhibition alters macrophage polarization and blocks glioma progression. Nat Med. 2013;19:1264-72
16. Shi Y, Ping YF, Zhou W, He ZC, Chen C, Bian BS. et al. Tumour-associated macrophages secrete pleiotrophin to promote PTPRZ1 signalling in glioblastoma stem cells for tumour growth. Nat Commun. 2017;8:15080
17. Hambardzumyan D, Gutmann DH, Kettenmann H. The role of microglia and macrophages in glioma maintenance and progression. Nat Neurosci. 2016;19:20-7
18. Ye X-z, Xu S-l, Xin Y-h, Yu S-c, Ping Y-f, Chen L. et al. Tumor-associated microglia/macrophages enhance the invasion of glioma stem-like cells via TGF-β1 signaling pathway. Journal of immunology (Baltimore, Md: 1950). 2012;189:444-53
19. Ma J, Chen CC, Li M. Macrophages/Microglia in the Glioblastoma Tumor Microenvironment. Int J Mol Sci. 2021;22:5775
20. Buonfiglioli A, Hambardzumyan D. Macrophages and microglia: the cerberus of glioblastoma. Acta Neuropathol Commun. 2021;9:54
21. Zhail K, Huang Z, Huang Q, Tao W, Fang X, Zhang A. et al. Pharmacological inhibition of BACE1 suppresses glioblastoma growth by stimulating macrophage phagocytosis of tumor cells. Nature Cancer. 2021;2:1136-1151
22. Wu A, Wei J, Kong LY, Wang Y, Priebe W, Qiao W. et al. Glioma cancer stem cells induce immunosuppressive macrophages/microglia. Neuro Oncol. 2010;12:1113-25
23. Qi L, Yu H, Zhang Y, Zhao D, Lv P, Zhong Y. et al. IL-10 secreted by M2 macrophage promoted tumorigenesis through interaction with JAK2 in glioma. Oncotarget. 2016;7:71673-85
24. Fonseca AC, Romão L, Amaral RF, Assad Kahn S, Lobo D, Martins S. et al. Microglial stress inducible protein 1 promotes proliferation and migration in human glioblastoma cells. Neuroscience. 2012;200:130-41
25. Lu J, Xu Z, Duan H, Ji H, Zhen Z, Li B. et al. Tumor-associated macrophage interleukin-β promotes glycerol-3-phosphate dehydrogenase activation, glycolysis and tumorigenesis in glioma cells. Cancer Sci. 2020;111:1979-90
26. Zhang X, Chen L, Dang W-Q, Cao M-F, Xiao J-F, Lv S-Q. et al. CCL8 secreted by tumor-associated macrophages promotes invasion and stemness of glioblastoma cells via ERK1/2 signaling. Laboratory investigation; a journal of technical methods and pathology. 2020;100:619-29
27. Shi Y, Ping Y-F, Zhou W, He Z-C, Chen C, Bian B-S-J. et al. Tumour-associated macrophages secrete pleiotrophin to promote PTPRZ1 signalling in glioblastoma stem cells for tumour growth. Nature communications. 2017;8:15080
28. Thapa N, Lee B-H, Kim I-S. TGFBIp/betaig-h3 protein: a versatile matrix molecule induced by TGF-beta. The international journal of biochemistry & cell biology. 2007;39:2183-94
29. Ween MP, Oehler MK, Ricciardelli C. Transforming growth Factor-Beta-Induced Protein (TGFBI)/(βig-H3): a matrix protein with dual functions in ovarian cancer. Int J Mol Sci. 2012;13:10461-77
30. Lauden L, Siewiera J, Boukouaci W, Ramgolam K, Mourah S, Lebbe C. et al. TGF-β-induced (TGFBI) protein in melanoma: a signature of high metastatic potential. The Journal of investigative dermatology. 2014;134:1675-85
31. Lang K, Kahveci S, Bonberg N, Wichert K, Behrens T, Hovanec J. et al. TGFBI Protein Is Increased in the Urine of Patients with High-Grade Urothelial Carcinomas, and Promotes Cell Proliferation and Migration. Int J Mol Sci. 2019;20:4483
32. Zhou W, Ke SQ, Huang Z, Flavahan W, Fang X, Paul J. et al. Periostin secreted by glioblastoma stem cells recruits M2 tumour-associated macrophages and promotes malignant growth. Nat Cell Biol. 2015;17:170-82
33. Tao W, Chu C, Zhou W, Huang Z, Zhai K, Fang X. et al. Dual Role of WISP1 in maintaining glioma stem cells and tumor-supportive macrophages in glioblastoma. Nature communications. 2020;11:3015
34. Koren HS, Anderson SJ, Larrick JW. In vitro activation of a human macrophage-like cell line. Nature. 1979;279:328-31
35. Liu G, Yuan X, Zeng Z, Tunici P, Ng H, Abdulkadir IR. et al. Analysis of gene expression and chemoresistance of CD133+ cancer stem cells in glioblastoma. Mol Cancer. 2006;5:67
36. Hopkins BD, Fine B, Steinbach N, Dendy M, Rapp Z, Shaw J. et al. A secreted PTEN phosphatase that enters cells to alter signaling and survival. Science. 2013;341:399-402
37. Verma N, Vinik Y, Saroha A, Nair NU, Ruppin E, Mills G. et al. Synthetic lethal combination targeting BET uncovered intrinsic susceptibility of TNBC to ferroptosis. Sci Adv. 2020;6:eaba8968
38. Neftel C, Laffy J, Filbin MG, Hara T, Shore ME, Rahme GJ. et al. An Integrative Model of Cellular States, Plasticity, and Genetics for Glioblastoma. Cell. 2019;178:835-49 e21
39. Pine AR, Cirigliano SM, Nicholson JG, Hu Y, Linkous A, Miyaguchi K. et al. Tumor Microenvironment Is Critical for the Maintenance of Cellular States Found in Primary Glioblastomas. Cancer Discov. 2020;10:964-79
40. Darmanis S, Sloan SA, Croote D, Mignardi M, Chernikova S, Samghababi P. et al. Single-Cell RNA-Seq Analysis of Infiltrating Neoplastic Cells at the Migrating Front of Human Glioblastoma. Cell reports. 2017;21:1399-410
41. Venteicher AS, Tirosh I, Hebert C, Yizhak K, Neftel C, Filbin MG. et al. Decoupling genetics, lineages, and microenvironment in IDH-mutant gliomas by single-cell RNA-seq. Science. 2017;355:eaai8478
42. Fessler E, Borovski T, Medema JP. Endothelial cells induce cancer stem cell features in differentiated glioblastoma cells via bFGF. Mol Cancer. 2015;14:157
43. Dahan P, Martinez Gala J, Delmas C, Monferran S, Malric L, Zentkowski D. et al. Ionizing radiations sustain glioblastoma cell dedifferentiation to a stem-like phenotype through survivin: possible involvement in radioresistance. Cell Death Dis. 2014;5:e1543
44. Auffinger B, Tobias AL, Han Y, Lee G, Guo D, Dey M. et al. Conversion of differentiated cancer cells into cancer stem-like cells in a glioblastoma model after primary chemotherapy. Cell Death Differ. 2014;21:1119-31
45. Tang M, Xie Q, Gimple RC, Zhong Z, Tam T, Tian J. et al. Three-dimensional bioprinted glioblastoma microenvironments model cellular dependencies and immune interactions. Cell Res. 2020;30:833-53
46. Han B, Cai H, Chen Y, Hu B, Luo H, Wu Y. et al. The role of TGFBI (βig-H3) in gastrointestinal tract tumorigenesis. Mol Cancer. 2015;14:64
47. Tumbarello DA, Temple J, Brenton JD. ß3 integrin modulates transforming growth factor beta induced (TGFBI) function and paclitaxel response in ovarian cancer cells. Mol Cancer. 2012;11:36
48. Ahmed AA, Mills AD, Ibrahim AE, Temple J, Blenkiron C, Vias M. et al. The extracellular matrix protein TGFBI induces microtubule stabilization and sensitizes ovarian cancers to paclitaxel. Cancer Cell. 2007;12:514-27
49. Zhu Z, Mesci P, Bernatchez JA, Gimple RC, Wang X, Schafer ST. et al. Zika Virus Targets Glioblastoma Stem Cells through a SOX2-Integrin α(v)β(5) Axis. Cell stem cell. 2020;26:187-204.e10
50. Nakada M, Nambu E, Furuyama N, Yoshida Y, Takino T, Hayashi Y. et al. Integrin alpha3 is overexpressed in glioma stem-like cells and promotes invasion. Br J Cancer. 2013;108:2516-24
51. Shevchenko V, Arnotskaya N, Pak O, Sharma A, Sharma HS, Khotimchenko Y. et al. Molecular determinants of the interaction between glioblastoma CD133(+) cancer stem cells and the extracellular matrix. Int Rev Neurobiol. 2020;151:155-69
52. Lathia JD, Gallagher J, Heddleston JM, Wang J, Eyler CE, Macswords J. et al. Integrin alpha 6 regulates glioblastoma stem cells. Cell stem cell. 2010;6:421-32
53. M S, S D, EJ B, J K, SI S, JA K. Nanofiber-mediated inhibition of focal adhesion kinase sensitizes glioma stemlike cells to epidermal growth factor receptor inhibition. Neuro Oncol. 2013;15:319-29
54. Ma C, Rong Y, Radiloff DR, Datto MB, Centeno B, Bao S. et al. Extracellular matrix protein betaig-h3/TGFBI promotes metastasis of colon cancer by enhancing cell extravasation. Genes Dev. 2008;22:308-21
55. Wan S, Zhao E, Kryczek I, Vatan L, Sadovskaya A, Ludema G. et al. Tumor-associated macrophages produce interleukin 6 and signal via STAT3 to promote expansion of human hepatocellular carcinoma stem cells. Gastroenterology. 2014;147:1393-404
56. Steitz AM, Steffes A, Finkernagel F, Unger A, Sommerfeld L, Jansen JM. et al. Tumor-associated macrophages promote ovarian cancer cell migration by secreting transforming growth factor beta induced (TGFBI) and tenascin C. Cell Death Dis. 2020;11:249
57. Lecker LS, Berlato C, Maniati E, Delaine-Smith R, Pearce OMT, Heath O. et al. TGFBI production by macrophages contributes to an immunosuppressive microenvironment in ovarian cancer. Cancer Res. 2021;81:5706-5719
58. Costanza B, Rademaker G, Tiamiou A, De Tullio P, Leenders J, Blomme A. et al. Transforming growth factor beta-induced, an extracellular matrix interacting protein, enhances glycolysis and promotes pancreatic cancer cell migration. Int J Cancer. 2019;145:1570-84
59. Zhu Z, Mesci P, Bernatchez JA, Gimple RC, Wang X, Schafer ST. et al. Zika Virus Targets Glioblastoma Stem Cells through a SOX2-Integrin alphavbeta5 Axis. Cell Stem Cell. 2020;26:187-204 e10
60. Thakur R, Trivedi R, Rastogi N, Singh M, Mishra DP. Inhibition of STAT3, FAK and Src mediated signaling reduces cancer stem cell load, tumorigenic potential and metastasis in breast cancer. Sci Rep. 2015;5:10194
61. Chorzalska A, Morgan J, Ahsan N, Treaba DO, Olszewski AJ, Petersen M. et al. Bone marrow-specific loss of ABI1 induces myeloproliferative neoplasm with features resembling human myelofibrosis. Blood. 2018;132:2053-66
62. Su YJ, Lai HM, Chang YW, Chen GY, Lee JL. Direct reprogramming of stem cell properties in colon cancer cells by CD44. EMBO J. 2011;30:3186-99
63. Iliopoulos D, Hirsch HA, Struhl K. An epigenetic switch involving NF-kappaB, Lin28, Let-7 MicroRNA, and IL6 links inflammation to cell transformation. Cell. 2009;139:693-706
64. Desgrosellier JS, Lesperance J, Seguin L, Gozo M, Kato S, Franovic A. et al. Integrin alphavbeta3 drives slug activation and stemness in the pregnant and neoplastic mammary gland. Dev Cell. 2014;30:295-308
65. Sun Q, Lesperance J, Wettersten H, Luterstein E, DeRose YS, Welm A. et al. Proapoptotic PUMA targets stem-like breast cancer cells to suppress metastasis. J Clin Invest. 2018;128:531-44
66. Kaneko S, Nakatani Y, Takezaki T, Hide T, Yamashita D, Ohtsu N. et al. Ceacam1L Modulates STAT3 Signaling to Control the Proliferation of Glioblastoma-Initiating Cells. Cancer Res. 2015;75:4224-34
67. Duan Z, Luo Y. Targeting macrophages in cancer immunotherapy. Signal Transduct Target Ther. 2021;6:127
68. Anderson NR, Minutolo NG, Gill S, Klichinsky M. Macrophage-Based Approaches for Cancer Immunotherapy. Cancer Res. 2021;81:1201-8
69. Preusser M. Neuro-oncology: a step towards clinical blood biomarkers of glioblastoma. Nat Rev Neurol. 2014;10:681-2
70. Gállego Pérez-Larraya J, Paris S, Idbaih A, Dehais C, Laigle-Donadey F, Navarro S. et al. Diagnostic and prognostic value of preoperative combined GFAP, IGFBP-2, and YKL-40 plasma levels in patients with glioblastoma. Cancer. 2014;120:3972-80
71. Hormigo A, Gu B, Karimi S, Riedel E, Panageas KS, Edgar MA. et al. YKL-40 and matrix metalloproteinase-9 as potential serum biomarkers for patients with high-grade gliomas. Clin Cancer Res. 2006;12:5698-704
72. Zhao W, Dovas A, Spinazzi EF, Levitin HM, Banu MA, Upadhyayula P. et al. Deconvolution of cell type-specific drug responses in human tumor tissue with single-cell RNA-seq. Genome Med. 2021;13:82
Author contact
![]() Corresponding authors: Bin Zhang, E-mail: binzhangedu.cn, Tel.: +86-27-83692608; Xingjiang Yu, E-mail: yuxingjiangedu.cn, Tel.: +86-13146677984; Feng Wan, E-mail: wanfengtjmu.edu.cn, Tel.: +86-27-83665222.
Corresponding authors: Bin Zhang, E-mail: binzhangedu.cn, Tel.: +86-27-83692608; Xingjiang Yu, E-mail: yuxingjiangedu.cn, Tel.: +86-13146677984; Feng Wan, E-mail: wanfengtjmu.edu.cn, Tel.: +86-27-83665222.