Impact Factor
- Issue 14; 2026
- Issue 13; 2026
- Issue 12; 2026
- Issue 11; 2026
- Issue 10; 2026
- Volume 16; 2026
- Advance Articles
- Past Issues
- Cover Images
- Cover Suggestion
- Index & Coverage
- Special Issues
Introduction
Materials and Methods
Results
Discussion
Abbreviations
Supplementary Material
Acknowledgements
References
International Journal of Biological Sciences
International Journal of Medical Sciences
 Global reach, higher impact

Theranostics 2023; 13(2):458-471. doi:10.7150/thno.78395 This issue Cite
Research Paper
EBV latent membrane protein 1 augments γδ T cell cytotoxicity against nasopharyngeal carcinoma by induction of butyrophilin molecules
Yue Liu1, Ka Sin Lui1, Zuodong Ye1, Tsz Yan Fung1, Luo Chen2, Ping Yiu Sit1, Chin Yu Leung1, Nai Ki Mak1, Ka-Leung Wong2, Hong Lok Lung2, Yoshimasa Tanaka3, Allen Ka Loon Cheung1 ![]()
1. Department of Biology, Faculty of Science, Hong Kong Baptist University, Hong Kong SAR, China.
2. Department of Chemistry, Faculty of Science, Hong Kong Baptist University, Hong Kong SAR, China.
3. Center for Medical Innovation, Nagasaki University, Nagasaki, Japan.
Received 2022-8-26; Accepted 2022-12-6; Published 2023-1-1
Abstract

Nasopharyngeal carcinoma (NPC) is a diverse cancer with no well-defined tumor antigen, associated with oncogenic Epstein-Barr Virus (EBV), and with usually late-stage diagnosis and survival <40%. Current radiotherapy and chemotherapy have low effectiveness and cause adverse effects, which calls for the need of new therapy. In this regard, adoptive immunotherapy using γδ T cells has potential, but needs to be coupled with butyrophilin 2A1 and 3A1 protein expression to achieve tumoricidal effect.
Methods: Human γδ T cells were expanded (with Zol or PTA) and used for cytotoxicity assay against NPC cells, which were treated with the EBV EBNA1-targeting peptide (L2)P4. Effect of (L2)P4 on BTN2A1/BTN3A1 expression in NPC cells was examined by flow cytometry and Western blot. An NPC-bearing NSG mice model was established to test the effectiveness of P4 and adoptive γδ T cells. Immunofluorescence was performed on NPC tissue sections to examine the presence of γδ T cells and expression of BTN2A1 and BTN3A1. EBV gene expression post-(L2)P4 treatment was assessed by qRT-PCR, and the relationship of LMP1, NLRC5 and BTN2A1/BTN3A1 was examined by transfection, reporter assay, Western blot, and inhibition experiments.
Results: Zol- or PTA-expanded the Vδ2 subset of γδ T cells that exerted killing against certain NPC cells. (L2)P4 reactivates latent EBV, which increased BTN2A1 and BTN3A1 expression and conferred higher susceptibility towards Vδ2 T cells cytotoxicity in vitro, as well as enhanced tumor regression in vivo by adoptive transfer of Vδ2 T cells. Mechanistically, (L2)P4 induced EBV LMP1, leading to IFN-γ/p-JNK and NLRC5 activation, and subsequently stimulated the expression of BTN2A1 and BTN3A1.
Conclusions: This study demonstrated the effectiveness of using the EBV-targeting probe (L2)P4 and adoptive γδ T cells as a promising combinatorial immunotherapy against NPC. The identification of the LMP1-IFN-γ/p-JNK-NLRC5-BTN2A1/BTN3A1 axis may lead to new insight and therapeutic targets against NPC and other EBV+ tumors.
Keywords: Nasopharyngeal carcinoma, γδ T cells, butyrophilin, NLRC5, EBV latent membrane protein 1 (LMP1)
Introduction
Nasopharyngeal carcinoma (NPC) is a malignancy of the nasopharynx tissues. It is more common found in southern China and Southeast Asian regions that represents 80% of globally new cases [1]. The exact cause of NPC remains to be defined but it has been associated with alcohol intake, diet, and smoking [2]. However, symptoms are not apparent until late stages of NPC, where combinations of chemotherapy, radiotherapy (e.g. intensity-modulated radiotherapy) and surgery are unable to rectify the tumor [3-7]. Alternative therapy such as adoptive immunotherapy was developed in recent years for NPC patients, but the effectiveness of transferred cells is dampened due to the immunosuppressive tumor microenvironment (TME) [8]. Moreover, the association of the Epstein-Barr Virus (EBV) in the development of NPC worsens the matter. Recent genomic studies have defined the relationship between Epstein-Barr Virus (EBV) latent genes and genetic mutation of MAPK/PI3K, HLA class I, and aberrant NF-κB that govern the onset and progression of NPC [9, 10].
EBV is a ubiquitous gammaherpesvirus that can undergo lifelong latent infection in the human host. The virus initially infects both B cells and oropharyngeal epithelial cells, and eventually establishes latency and express a limited subset of viral genes known as latent genes [11]. In B cells, they usually express type III latent genes such as non-coding RNAs (EBERs), nuclear proteins (EBNA-LA, EBNA1, EBNA2), and membrane proteins (LMP1, LMP2A) [12]. On the other hand, EBV can undergo latency in nasopharynx epithelium, where type II latency genes are expressed, such as oncogenic EBNA1, LMP1, LMP2A and EBERs [13]. These EBV-encoded latent genes can interact with host oncogenes resulting in disturbed host cell cycle and promoting the development of EBV-associated epithelial neoplasms. For example, latent membrane protein 1 (LMP1) is a transmembrane protein that structurally contains a short N-terminal cytoplasmic domain, six transmembrane loops, and a long cytoplasmic tail consisting of three C-terminal activation regions (CTAR) in the positional order of CTAR -1, -3 and -2 [14]. Functionally, CTAR-1 and CTAR-2 domains of LMP1 can activate a number of signaling cascades, including the PI3K-AKT, NF-κB, MAPK, JNK, JAK-STAT and p38/MAPK pathways [15], which confers to tumor transformation, immune suppression and inflammatory responses. There are fewer functional studies on CTAR3 where it was shown to bind JAK3 to facilitate DNA binding of STAT; or it binds Ubc9 to trigger migration of tumor cells [16, 17]. Thus, EBV maintains latency by modulating the cellular environment that could result in malignant nasopharyngeal epithelial cells [18]. Attempts have been made to reactivate EBV for oncolytic activities but the subsequent collateral cell damage, immunological cell death (ICD), and inflammation may allow residual cancer cells to grow [14]. More recently, a peptide inhibitor (L2P4 or P4) that blocks EBNA1 dimerization in the nuclei of NPC cells was shown to inhibit tumor growth, which may have implications in assisting immune cell mediated killing [19].
The Vδ2 subset of human γδ T cells has been used as immunotherapeutic cells against different types of cancer. Clinical trials have shown, to a certain extent, the effectiveness of these cells in limiting tumor growth especially in hematological malignancies but less so in solid tumors [20-22]. Although Vδ2 T cells consists of 1-5% of peripheral blood lymphocytes, they can be expanded robustly using zoledronic acid (Zol) or tetrakis-pivaloxloxymethyl 2-(thiazole-2-ylamino) ethylidene-1,1-bisphosphonate (PTA) for anti-tumor cytotoxic activities [20, 23-25]. Vδ2 T cells are activated by recognition of phosphoantigens (pAgs) presented by BTN2A1/BTN3A1 on the tumor cells [26-28]. However, the expression of BTN2A1 and BTN3A1 on NPC cells, and whether Vδ2 T cells are effective against EBV-bearing NPC, have not been characterized to date. We, therefore, hypothesized that Vδ2 T cells has potent cytotoxic activity against NPC when BTN2A1/BTN3A1 expression are increased.
In this study, we investigated the effectiveness of expanded Vδ2 T cells against NPC in combination of the EBV-reactivating agent (L2)P4 and the potential mechanism in in vitro and in vivo experiments. First, we showed that there is a differential Vδ2 T cell killing activity against NPC cell lines that is related to the expression of BTN2A1 and BTN3A1. Second, (L2)P4 increased the protein expression of BTN2A1/BTN3A1 in NPC cells and conferred greater susceptibility towards Vδ2 T cell cytotoxicity. Third, (L2)P4 induced EBV LMP1 gene stimulates IFN-γ and JNK pathway to upregulate the expression of BTN2A1/BTN3A1 via NLRC5 (NOD-like receptor family CARD domain containing 5). Finally, using an immunodeficient mice model to bear NPC tumors, adoptive transfer of Vδ2 T cells combined with P4 led to tumor regression. Taken together, these findings present a potentially effective combinatorial immunotherapy by using a EBV reactivation stimulant and Vδ2 T cell adoptive transfer.
Materials and Methods
Cells
HK1, HK1-EBV, HONE1, HONE1-EBV cells were maintained with Dulbecco's modified Eagle's medium (DMEM; GIBCO) supplemented with 10% fetal bovine serum (FBS; GIBCO) and 1% Pencillin/Streptomycin (GIBCO). C666-1 and NPC43 cells were maintained in Roswell Park Memorial Institute (RPMI)1640 medium supplemented with 10% FBS and 1% Pencillin/Streptomycin. 4 μM ROCK inhibitor Y27632 (Cat. No. S1049, Selleckchem) was added to NPC43 culture medium. Gastric tumor cells SNU719 and NCC224 (Korean Cell Line Bank) were cultured in RPMI1640 supplemented with 10% FBS. AGS (Korean Cell Line Bank) were cultured in Ham's F-12K (Kaighn's) Medium (GIBCO) supplemented with 10% FBS. Peripheral blood mononuclear cells (PBMCs) were isolated from healthy human buffy coats (Hong Kong Red Cross) using Lymphoprep (Stem Cell Technologies) with the approval of the institutional review board. All cells were maintained at 37°C and 5% CO2 incubator.
In vitro expansion and purification of γδ T cells
PBMCs (2 x 10⁶/well/ml) were stimulated with zoledronic acid (Zol, 1 μM; Cat. No. 1724827, United States Pharmacopeia (USP)) or tetrakis-pivaloxloxymethyl 2-(thiazole-2-ylamino) ethylidene-1,1-bisphosphonate (PTA, 1 μM) [25], in RPMI1640 medium with recombinant human interleukin-2 (IL-2 or rhIL-2; Cat. No. 130-097-746, Miltenyi Biotec) at 100 IU/ml and 10% FBS. Negative selection using magnetic beads in TCRγ/δ+ T Cell Isolation Kit (Cat. No. 130-092-892, Miltenyl Biotec) was performed on day 9 of expansion to achieve a purity of >95% CD3+Vδ2+ determined by flow cytometry before used for experiments.
Reactivation of EBV in NPC cells
To induce EBV reactivation in NPC cells, sodium butyrate (NaB, 3 mM; Sigma) and phorbol 12-myristate 13-acetate (PMA, 40 ng/ml; Sigma), L2P4 or P4 (10 μM) were added to the culture medium and incubated at 37 °C for 24 and 48 h [19]. NPC cells were seeded overnight before treatment occurred. Reactivation was confirmed by monitoring EBV DNA copy number by qPCR and viral gene expression by RT-qPCR (see below).
Inhibitor experiment
Inhibitors were used prior to P4 treatment in NPC cells: JSH-23 (10 μM; Cat. No. HY-13982, MedChemExpress) against NF-κB, SB 203580 (50 nM; Cat. No. HY-10256, MedChemExpress) against p38, JNK inhibitor VIII (50 nM/ 160 nM; Cat. No. HY-10526, MedChemExpress) against JNK1 and JNK2 respectively, or DMSO control (Cat. No. D8418, Sigma). The cells were incubated at 37°C for 1 h, followed by P4 (10 μM) treatment and were further incubated at 37°C for 24 h. Cells were seeded overnight to reach 70-80% confluence before treatment occurred.
Gene-silencing experiments
Small interfering RNA (siRNA) duplexes targeting NLRC5 expression (siNLRC5_1 and siNLRC5_2) were purchased from GenePharma and were used to transfect HONE1-EBV cells using Lipofectamine 3000 (Life Technologies) according to the manufacturer's instructions. The sequences of the oligonucleotides for NLRC5 used are as follows: siCtrl, 5'-UUCUCCGAACGIGUCACGU-3'; siNLRC5_1, 5'-CAGGGUUCUCUCCCUGUUAGA-3'; and siNLRC5_2, 5'-GCUGAUCUUUGAUGGGCUA-3'. 24 h post-transfection, the cells were treated with P4 for another 16-24 h where the cells were analyzed for NLRC5, BTN3A1 and BTN2A1 protein expression by Western blotting. For the knockdown of BTN2A1, three duplexes of siBTN2A1 were purchased from Origene and used in C666-1 cells and decreased protein expression was verified by Western blotting. C666-1 cells pre-treated with siBTN2A1 for 24 h before treated with or without P4 for 12 h and then co-cultured with Vδ2 T cells at E:T=10:1 ratio for cytotoxicity assay using the same procedures as described below.
Flow cytometry analysis
2 x 10⁵ cells collected from the cell culture were washed in phosphate buffered saline (PBS) (+1% FBS) and stained with antibodies for 30 minutes at 4°C before analyzed on the BD FACS Caliber II instrument. Antibodies used are shown in Table S1.
Cytotoxicity assay
1 x 10⁶ NPC cells per ml of PBS were labeled with 0.8 mM Calcein-AM (Invitrogen) according to manufacturer's instructions. Co-culture with purified γδ T cells at different (E:T) ratios in triplicates occurred in a U-bottom cell culture plate (Thermo Fisher Scientific), and incubated for 4 hours in a 37°C and 5% CO2 incubator. The plate was centrifuged for 5 min at 400 xg before the supernatant was transferred to a black 96-well plate to measure released fluorescence signals at 495 nm excitation and 515 nm emission wavelengths. Cell lysis percentage was calculated as 100 x [(experimental release - spontaneous release) ÷ (maximum release - spontaneous release)]. Maximum release is determined by lysis of the target cell with a final concentration of 0.1% Triton X-100.
Western blotting analysis
Cells were lysed and protein concentrations were determined using the Pierce BCA protein assay kit (Thermo Fisher Scientific). Equal amounts of protein lysates were loaded onto 4-12% SDS-PAGE gel for electrophoresis and transferred to the PVDF membrane (Millipore) using Bio-Rad Wet/Tank Blotting System. The membrane blot was blocked for an hour in 5% skimmed milk plus 0.5% Bovine Serum Albumin (BSA; Cat. No. A2153, Sigma) in Tris-buffered saline with 0.1% Tween-20 (TBS-T) on a gentle rocking platform. Primary and secondary HRP antibodies used are shown in Table S1. Pierce ECL Western Blotting Substrate was used for chemiluminescence (Cat. No. 32106, Thermo Fisher Scientific) and images taken using ChemiDoc (Bio-Rad). Analysis of band intensities was performed using ImageJ (http://imagej.nih.gov/ij/).
Reverse transcription quantitative real-time PCR (RT-qPCR)
RT-qPCR was performed using total RNA isolated with RNAiso PLUS (Cat. No. 9109, Takara), followed by cDNA synthesis using the PrimeScript RT Reagent Kit (Cat. No. RR047A, Takara). cDNA with specific primers were used with TB Green Premix Ex Taq II (Ti RNase H Plus) (Cat. No. RR820A, Takara) for qPCR analysis. GAPDH gene expression was used for normalization. Gene primer sets used are shown in Table S2.
Clustering and principal component analysis
RT-qPCR data on EBV genes expression and the gene expression of BTN2A1 and BTN3A1 over the time course of 1, 2, 4, 8, 12, 24 h post-infection (P.I.) were analyzed using clustering and principal component analysis (PCA). Relative expression of the genes normalized to housekeeping gene GAPDH for the individual NPC cell lines were inputted into the online clustering software (Clustergrammar; https://maayanlab.cloud/clustergrammer/) [29]. Genes clustered together are indicated by a bracket. PCA were conducted using the same set of data by the PCA analysis component with the standardized method with the “Kaiser rule” in GraphPad Prism version 9.
Cell transfection
LMP1 (wildtype, and mutants 3C, 8A, 3C+8A), BZLF1 and BRLF1 plasmids were kindly provided by Dr. Anna Chi Man Tsang (The Chinese University of Hong Kong) and Dr. Ming Han Tsai (National Yang-Ming University). NPC cells were seeded overnight before culture medium was changed to Opti-MEM (Cat. No. 31985062, GIBCO) 1 h before transfection. Plasmids were transfected into cells using PEI (Cat. No. 23966-1, Polysciences) prepared in Opti-MEM. PEI alone served as vehicle control. Six hours later, the medium was changed to fresh warm DMEM with 10% FBS. Plasmid encoding NLRC5 (#37509) and IFN-γ promoter luciferase (#17599) were purchased from Addgene.
EBV genome copy number assay
Cellular DNA was extracted using the Genomic DNA Purification Kit (Cat. No. K0721, Thermo Scientific) according to the manufacturer's instruction. To determine EBV genome copy number, 20 μl qPCR reactions using specific primers for the BZLF1 gene was performed with the TB Green Premix Ex Taq II as described above. The plasmid for the standard curve, which encodes the BZLF1 gene region of the EBV genome (102, 103, 104, 105, 106, 107 and 108 copies per 2 μL), were used to generate a standard curve by qPCR based on the CT values. The concentration of BZLF1 DNA in the test samples was quantified using this standard curve. To determine the number of cells in the input template, primers for CCR5 were performed with a standard plasmid as described previously [30].
Luciferase reporter assay
Luciferase reporter plasmids were created by inserting the promoter regions of BTN2A1, BTN3A1, IFN-γ and NLRC5 into pGL3 basic plasmid using XhoI-HindlII. Inserts were obtained either by PCR amplification using the Q5® High-Fidelity 2X Master Mix (NEB) or using annealed purchased DNA oligos (IGE bio). The pGL3 plasmid was used as negative control. All constructs were verified by sequencing. For the experiment, HEK293T cells were seeded into a 24-well plate and luciferase reporter plasmids were co-transfected the next day using PEI transfection reagent with plasmids encoding EBV genes. In certain experiments, IFN-γ (Peprotech) were added to the cell culture 24 h post-transfection. An empty backbone was used as control (Ctrl). The pRLTK (Renilla) luciferase reporter was included for normalization. Cells were harvested between 30 and 40 h post-transfection and cell lysates were analyzed using the Dual-Luciferase® Reporter Assay System (Promega) following manufacturer's instruction. Bioluminescence was measured using the GloMAXTM 96 Microplate Luminometer (Promega).
Animal experiments
Four- to six-week-old NOD.Cg-PrkdcscidIl2rgtm1Wjl/SzJ (NSG) mice (at 18-20 g in weight) were obtained from the City University of Hong Kong Laboratory Animal Research Unit. Male and females were equalized between groups, and mice were chosen randomly. All mice experiments were approved by the Research Ethics Committee of Hong Kong Baptist University, and conformed to all relevant regulatory standards. 5 × 10⁶ HONE1-EBV, HK1-EBV, or C666-1 cells (dislodged by trypsin-EDTA (GIBCO)) were resuspended in 0.1 ml RPMI1640 medium and mixed 1:1 with Matrigel basement membrane matrix on ice (LDEV-free; Cat. No. 356232, Corning) before subcutaneously (s.c.) injected into the right flanks of each mouse. Tumor can be detected by day 7. Intratumoral (i.t.) injection of P4 (12 μg/100 μl PBS) occurred for 24 h. Vδ2 T cells were recovered from liquid nitrogen storage, placed in RPMI1640 (10% FBS with 20 IU/ml IL-2) overnight, and passed through a 70-μm cell strainer before adoptively transferred to the mice by intravenous (i.v.) injection at 5 x 10⁶ cells in 100 μl PBS. PBS injection alone served as control. Tumor volume (V) was measured by caliper every 2-4 days and calculated with the formula V = (length × width2)/2. Mice were sacrificed after 3-4 weeks post-treatment. Dissected tumors were fixed with 10% formalin (Cat. No. HT501128, Sigma) at room temperature for 24 h before processed for paraffin embedding (Cat. No. P3808, Sigma).
Immunofluorescence staining on tumor tissue sections
Formalin-fixed paraffin-embedded (FFPE) tissue sections of the tumors from the mice experiments were used for immunofluorescence assays as previous [31]. Antibodies used are shown in Table S1. Nuclei were stained using Hoechst 33258 Staining Dye Solution (Cat. No. ab228550, Abcam). Images were acquired using the SP5 II or Stellaris confocal microscopy system (Leica) and analyzed using the LAS X (Leica) and ImageJ softwares.
Hematoxylin and eosin (H&E) staining
Tissue sections (5 μm thick) of the tumors from the mice experiments were stained with hematoxylin (Cat. No. GHS116, Sigma) and eosin (Cat. No. HT110116, Sigma) (H&E) after deparaffinization with xylene (Cat. No. 1330-20-7, RCI Labscan) and rehydration with ethanol. Images were acquired using the ECLIPSE Ti2 inverted microscope (Nikon).
Statistical analysis
Data shown are the mean ± SEM from at least three independent experiments. Statistical analyses were performed using paired Student's t-test, one-way or two-way analysis of variance (ANOVA), unless otherwise indicated. P < 0.05 is considered statistically significant.
Results
NPC cells are susceptible to γδ T cell killing
Cytotoxicity assay was performed to determine if γδ T cells can kill NPC cells. Expansion of Vδ2 T cells was achieved by stimulating healthy donor PBMCs with PTA or Zol plus IL-2 for 9 days, where cell clusters can be detected under light microscopy (Figure S1A). By the end of culture, up to 40-fold increase in the number of CD3+Vδ2+ T cells was found with a purity of >90% for both Zol or PTA stimulation (Figure S1 B and C). Cells were further purified by negative selection microbeads to ensure a purity of >95% CD3+Vδ2+ cells (hereafter referred to as Vδ2 T cells) for further experiments. These cells were then co-cultured at different effector: target (E:T) ratios with various NPC cell lines - HK1-EBV, HK1, HONE1-EBV, HONE1, NPC43, and C666-1. HONE1-EBV and HK1-EBV are cell lines latently infected with lab-adapted EBV, whereas C666-1 and NPC43 are clinically relevant cell lines with natural latent EBV [32]. Different degree of cytotoxicity by Vδ2 T cells was observed in the order of C666-1> HONE1-EBV=NPC43> HK1-EBV> HK1=HONE1, and were significantly improved when compared to unstimulated CD3+Vδ2+ T cells (Figure 1A). Moreover, PTA-expanded Vδ2 T cells (PTA-Vδ2) had significantly increased level of cytotoxicity than Zol-Vδ2 against HK1-EBV and HONE1-EBV cells (Figure 1A). These results suggest that EBV-bearing NPC cell lines appear to be more susceptible towards Vδ2 T cell killing.
Vδ2 T cell cytotoxicity towards NPC cell lines. (A) NPC cell lines (HONE1-EBV, HK1-EBV, C666-1, NPC43) were used for Calcein cytotoxicity assay after co-culture with PTA- or Zol- expanded Vδ2 T cells at different effector: target (E:T) ratios for 4 h. (B) NPC cell lines were pre-treated with NaB/PMA or L2P4 for 24 h before co-cultured with PTA-expanded Vδ2 T cells. Calcein release at 4 h post co-culture were measured to calculate % cell lysis based on maximum cell death. Data represents mean ± SEM from 5 independent experiments. One-way ANOVA statistical test was performed. *P < 0.05, **P < 0.01, ***P < 0.001.
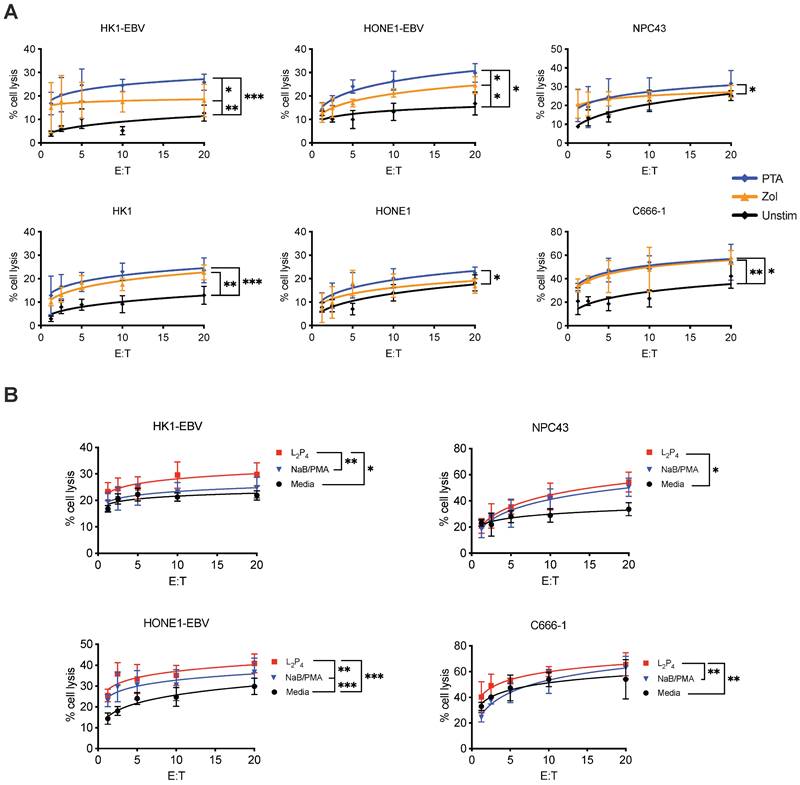
Reactivation of EBV in NPC cells increased Vδ2 T cell killing
To understand the role of EBV in the NPC cells that contributes to increased Vδ2 T cell cytotoxicity, we treated HK1-EBV, HONE1-EBV, NPC43 and C666-1 overnight with a EBNA1-targeting peptide inhibitor in a fluorescent-labeled form (L2P4) or unlabeled form (P4) [33], or sodium butyrate/phorbol 12-myristate 13-acetate (NaB/PMA) [34, 35], prior to cytotoxicity experiments. P4 can induce EBV reactivation as measured by qPCR for viral DNA copy number (Figure S2) and gene expression (discussed below in Figure S10). As shown in Figure 1B, L2P4 significantly increased the Vδ2 T cell killing of the treated NPC cell lines by up to 3-fold, especially for those that were found to be more resistant to Vδ2 T cells in the data above. L2P4 was more effective than NaB/PMA in enhancing Vδ2 T cell cytotoxicity for HK1-EBV, HONE1-EBV and C666-1, but was similar for NPC43 (Figure 1B). The effect was not due to the L2P4 induced cell death that remained minimal in these experiments (Figure S3). No significant difference was observed for cytotoxicity against EBV-negative HK1 and HONE1 cells (Figure S4A). P4 treatment for EBV-positive gastric tumor cells SNU719 and NCC224 still had an improved cytotoxic effect for PTA-Vδ2 cells but not for the EBV-negative AGS cells (Figure S4B).
Adoptive transfer of Vδ2 T cells reduced P4-treated NPC tumor growth in vivo
Next, we sought to test whether Vδ2 T cells combined with (L2)P4 can effectively target NPC tumors in vivo. We used the immunodeficient NOD.Cg-PrkdcscidIl2rgtm1Wjl/SzJ (NSG) mice to establish an NPC tumor mice model. Subcutaneous (s.c.) injection of HONE1-EBV resulted in the formation of solid tumors by day 7. On the same day, intratumoral (i.t.) injection of P4 or PBS was performed [33]. 24 h later, Zol- or PTA-Vδ2 cells were adoptively transferred by intravenous (i.v.) injection (Figure 2A). PBS injections served as control. For HONE1-EBV, decreased tumor growth by ~40% was achieved for Zol-Vδ2 cells and ~55% for PTA-Vδ2 cells compared to control (Figure 2 B and C). Interestingly, combining P4 treatment with Vδ2 T cell adoptive transfer led to further reduction in tumor size by an average of 52% for Zol-Vδ2 cells and 73% for PTA-Vδ2 cells with statistical significance, respectively (Figure 2 B and C). P4 alone reduced tumor size modestly by ~19% at the endpoint. Individual tumor photos can be found in Figure S5A. Consistent to the in vitro data, PTA-Vδ2 cells had a higher anti-NPC activity in these mice experiments compared to Zol-Vδ2 cells, especially when combined with P4.
P4 + Vδ2 T cells inhibited NPC tumor growth in vivo. (A) Timeline of HONE1-EBV-bearing NSG mice experiment. (B) Tumor volume of mice receiving PBS (n = 9), P4 (n = 9), Zol-Vδ2 (n = 5), P4 + Zol-Vδ2 (n = 5), PTA-Vδ2 (n = 9), and P4 + PTA-Vδ2 (n = 9) over a period of 18 days. (C) Representative HONE1-EBV tumors from each group at experimental endpoint. (D) Timeline of HK1-EBV-bearing NSG mice experiment. (E) Tumor volume of mice receiving PBS (n = 4), P4 (2 doses, n = 4), PTA-Vδ2 (1 dose, n = 4), P4 + PTA-Vδ2 (1 dose, n = 4), PTA-Vδ2 (2 doses, n = 4), and P4 + PTA-Vδ2 (2 doses, n = 4) over a period of 25 days. (F) Representative HK1-EBV tumors from each group at experimental endpoint. (G) Tile scan of HK1-EBV H&E tumor sections with insets to show infiltration of small nuclei cells among the different groups receiving two doses of treatment. Counts per mm2 is shown as column graph. (H) Tumor volume of C666-1-bearing mice receiving two-dose treatments of PBS (n = 5), P4 (n = 5), PTA-Vδ2 (n = 5), and P4 + PTA-Vδ2 (n = 5), with representative tumor photos (I). Data represents mean ± SEM. Two-way ANOVA statistical test was used for B and E, Student's t-test was used for G. *P < 0.05, **P < 0.01, ***P < 0.001.
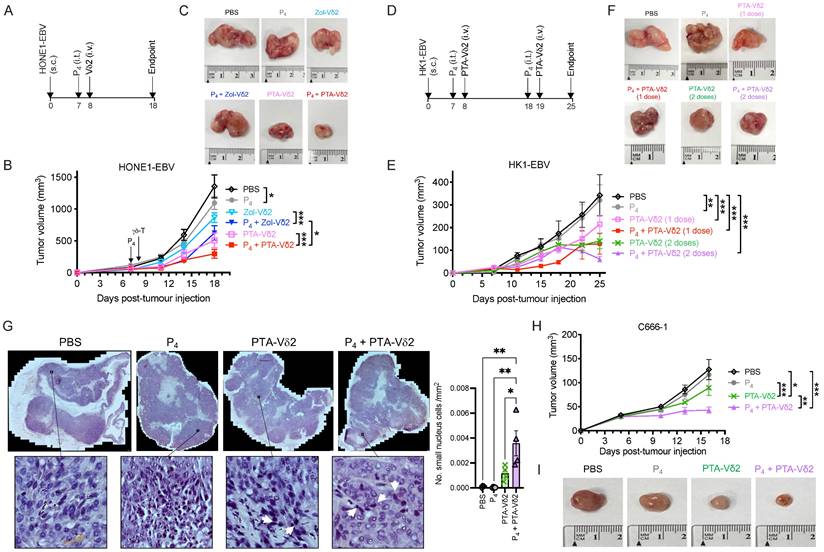
In another set of experiment, two doses of P4 plus PTA-Vδ2 treatment were attempted. HK1-EBV tumors detectable by day 7 were (i.t.) injected with P4 followed by PTA-Vδ2 cells adoptive transfer on day 8. The second treatment occurred on day 18 (P4) and day 19 (PTA-Vδ2 cells) (Figure 2D). PTA-Vδ2 cells alone reduced tumor growth by ~54%, while P4 plus PTA-Vδ2 cells decreased tumor growth by ~63% compared to control (Figure 2 E and F). Two doses of PTA-Vδ2 cells or P4 plus PTA-Vδ2 cells resulted in a further 8% and 17% tumor size reduction, respectively (Figure 2 E and F, Figure S5B).
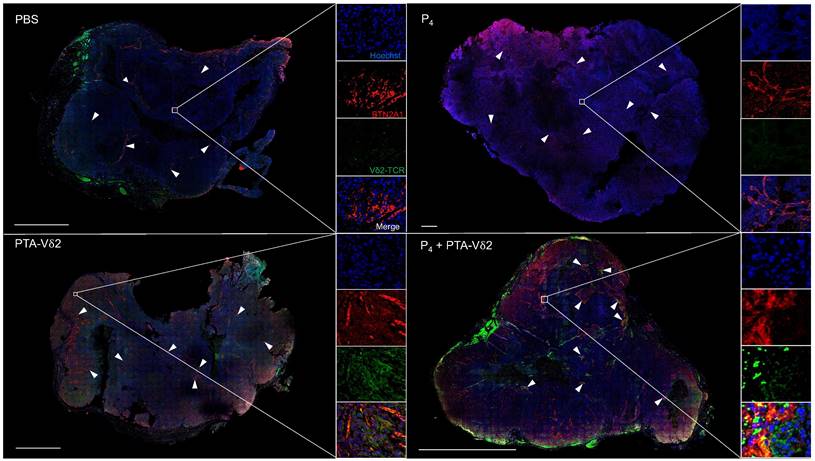
To examine if P4 leads to increased Vδ2 T cell infiltration into the NPC tumor, H&E staining of the HK1-EBV tumor tissue sections was performed. Cells with smaller nuclei (likely Vδ2 T cells) can be found within the HK1-EBV tumors in mice that received PTA-Vδ2 cells (Figure 2G). P4 injection resulted in the formation of lesions in certain regions of the tile scanned tumor structure where increased number of small-nucleated cells per mm2 could be observed following administration of PTA-Vδ2 cells (Figure 2G, white arrows). Consistently, the presence of Vδ2-TCR+ cells (green) in the tumors were observed from mice with adoptively transferred PTA-Vδ2 cells, which seems to have increased in P4-treated tumors and were found in close proximity to regions with BTN2A1-expressing cells (Figure 3, red signals and indicated by white arrows, and Figure S6), which are relatively more abundant in the areas surrounding the lesion (Figure S6). In comparison, non-P4 treated tumor had considerably less BTN2A1 expression and Vδ2-TCR+ cells appear to be more randomly distributed in the tumor (Figure 3). Since two doses of P4 + PTA-Vδ2 cells appear to be more effective, we next tested this in the more clinically relevant C666-1 tumor bearing mice. Compared to two doses of P4 or PTA-Vδ2 cells, P4 + PTA-Vδ2 cells resulted in significantly decreased tumor size (Figure 2 H and I). No significant weight loss or death was found for any of the NPC tumor-bearing mice in the treatment groups prior to ethical sacrifice because of tumor size (Figure S7). Taken together, the in vivo experiments demonstrated that P4 combined with adoptive transferred PTA-Vδ2 cells can successfully reduce NPC tumor growth likely due to the increased cytotoxic activity of the tumor-infiltrated PTA-Vδ2 cells to the BTN2A1-expressing cells.
P4 treatment results in increased co-localization of Vδ2 T cells and BTN2A1-expressing cells in NPC tumor in vivo. HK1-EBV tumor tissue sections from PBS, P4, PTA-Vδ2, and P4 + PTA-Vδ2 mice were immunostained for Vδ2-TCR+ cells (green), BTN2A1 (red) and nucleus (blue) with Hoechst 33258. Scale bar represents 800 μm. Representative tile scan images assessed by confocal microscopy are shown. Insets are expanded views of the squared regions. Arrows point to regions of BTN2A1 expressing cells.
P4 upregulates expression of BTN3A1 and BTN2A1 on NPC cells
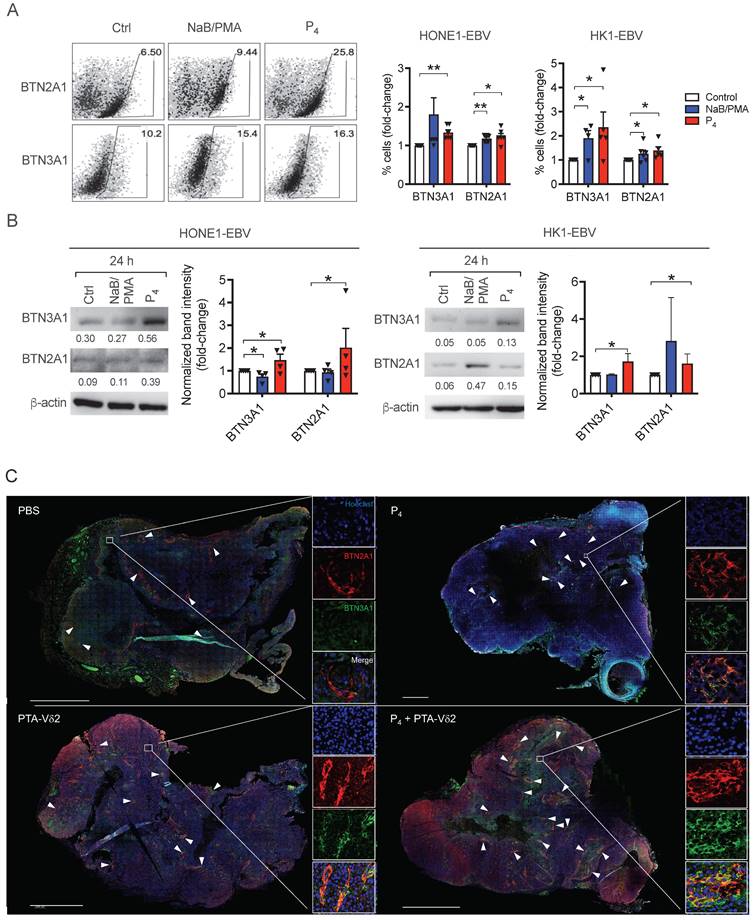
To understand if the increased tumoricidal activity of P4 plus PTA-Vδ2 cells is due to increased BTN2A1/BTN3A1 expression, we next analyzed their protein expression on various NPC cells. As shown in Figure S8, the expression of both proteins was consistently high in C666-1 and NPC43 cells compared to HK1-EBV, HONE1-EBV, HK1 and HONE1, which in part, correlate with the differences in the in vitro cytotoxicity results above (Figure 1A). By flow cytometry, 24 h of P4 treatment resulted in a consistent increase in the frequency of HONE1-EBV and HK1-EBV cells expressing BTN2A1 and BTN3A1 (Figure 4A), which was verified by Western blot analysis (Figure 4B). Moreover, we observed an increased expression and co-localization of BTN3A1 and BTN2A1 in P4-treated mice tumor tissue sections (i.e. from P4 and P4 + PTA-Vδ2 group) compared to the non-P4-treated mice tumors (i.e. from PBS and PTA-Vδ2 group) (Figure 4C and Figure S9). Overall, (L2)P4 stimulated expression of BTN2A1 and BTN3A1, which increased susceptibility for NPC cells towards Vδ2 T cell cytotoxicity. However, how P4 induced the expression of BTN3A1 and BTN2A1 in NPC tumors has not been shown to date.
(A-B) P4 treatment results induced increased protein expression of BTN2A1 and BTN3A1 co- expression in EBV+ NPC cells in vitro and in vivo. Analysis of BTN3A1 and BTN2A1 expression induced by NaB/PMA or P4 24 h treatment of HONE1-EBV and HK1-EBV cells and normalized to control based on: (A) flow cytometric analysis of frequencies of cells (%) normalized to control. Representative dot plots are shown on the left; and (B) Western blot analysis of band intensities compared to β-actin (shown as numbers). Representative immunoblots are shown. Column graphs represent data as mean ± SEM from ≥ 3 independent experiments. Student's t-test was performed. *P < 0.05, **P < 0.01, ***P < 0.001. (C) HK1- EBV tumor tissue sections from PBS, P4, PTA-Vδ2, and P4 + PTA-Vδ2 mice were immunostained for BTN3A1 (green), BTN2A1 (red) and nucleus (blue) with Hoechst 33258. Scale bar represents 800 μm. Representative tile scan images assessed by confocal microscopy are shown. Insets are expanded views of the squared regions. Arrows indicate regions of BTN2A1 expression.
EBV-encoded LMP1 induces BTN2A1 and BTN3A1 expression via NLRC5
To identify the EBV genes that may be involved in the induction of BTN2A1 and BTN3A1 expression, we first induced EBV reactivation using L2P4 treatment and traced the gene expression of BTN2A1 and BTN3A1, as well as EBV genes from different classes by RT-qPCR for 1, 2, 4, 6, 12, 24 h post-L2P4 treatment. Latent EBV gene LMP1; immediate-early genes BRLF1 and BZLF1; early genes BXLF1, BMRF1, BRRF1 and BARF1; and late gene BCRF1 were chosen for analysis due their possibility to modulate host cell immunological responses that may relate to BTN2A1 and BTN3A1 expression (Table S3). By cluster analysis, the expression profile of BTN2A1 and BTN3A1 were grouped with LMP1 from HONE1-EBV, HK1-EBV and C666-1 and NPC43 cells over time (Figure S10A). Principal component analysis (PCA) of the data from the four cell lines showed that LMP1, BZLF1 and BRLF1 are in the closest distance to BTN2A1 and BTN3A1 (Figure S10B), suggesting their relationship to BTN2A1 and BTN3A1 expression.
To determine if the viral genes can directly trigger the transcription of BTN2A1 and BTN3A1 genes, we performed a luciferase reporter experiment using their specific promoters. Previous study demonstrated that BTN3A1 expression can be induced by the immune regulator NLRC5 through direct binding to its promoter [36], and this was included as a control. As shown in Figure 5A, BZLF1 and BRLF1 did not have any induction effect on luciferase activity of the BTN2A1 and BTN3A1 promoters. However, LMP1 appears to trigger BTN2A1 promoter transcription but not for BTN3A1. Moreover, NLRC5 could induce BTN3A1 as well as BTN2A1 promoter activities (Figure 5A), where the latter has not been shown before. Since LMP1 exists as a membrane-bound protein, we suspect that there is an indirect effect to induce NLRC5 to promote BTN2A1 and BTN3A1 expression, such as IFN-γ. Indeed, LMP1 (but not BZLF1 and BRLF1) can activate the IFN-γ promoter (Figure 5B), and when combined with IFN-γ (250 IU/ml) the NLRC5 promoter can become activated (Figure 5C). Additionally, overexpressed LMP1 in HONE1 cells or P4 treatment of HONE1-EBV cells can induce the gene expression of IFN-γ (Figure S11).
Mechanistic study of the P4-induced LMP1 in stimulating BTN3A1 and BTN2A1 expression via NLRC5. Luciferase reporter assay using the promoters of (A) BTN3A1, BTN2A1, (B) IFN-γ and (C) NLRC5. HONE1 cells were co-transfected with plasmids encoding LMP1, BZLF1, BRLF1 and NLRC5 for 1 day before results assessed. For C, IFN-γ (25 or 250 IU/ml) were used in conjunction. (D) Reporter assay using LMP1, LMP1-3A, LMP1-8C or LMP1-3A+8C encoded plasmids for the BTN2A1 promoter. (E) HONE1 cells were transfected with LMP1 and assessed for BTN3A1, BTN2A1 and NLRC5 gene expression by qRT-PCR. (F) Two siRNA against NLRC5 or scrambled control were transfected into HONE1-EBV cells for 24 h before treated with P4 for another 16 h. Protein expression of NLRC5, BTN3A1 and BTN2A1 were assessed by Western blot and the band intensity compared to control are shown in the column graph. (G) Plasmids encoding LMP1 were transfected in HONE1 cells for 5 h before analyzed for NLRC5, p-JNK, JNK, p-IKKα/β and IKKα protein expression by Western blot. Arrows indicate the correct sized band/s. (H) Western blot analysis of BTN2A1 expression following transfection of C666-1 cells by siRNA against BTN2A1 with or without P4 treatment. These cells were used for cytotoxicity assay co-cultured with Vδ2 cells at 10:1 E:T ratio (I). Numbers under immunoblots indicate relative band intensity to GAPDH. Data from 3 independent experiments are shown as mean ± SEM for the column graphs. One-way ANOVA or Student's t statistical test was performed. *P < 0.05, **P < 0.01, ***P < 0.001.
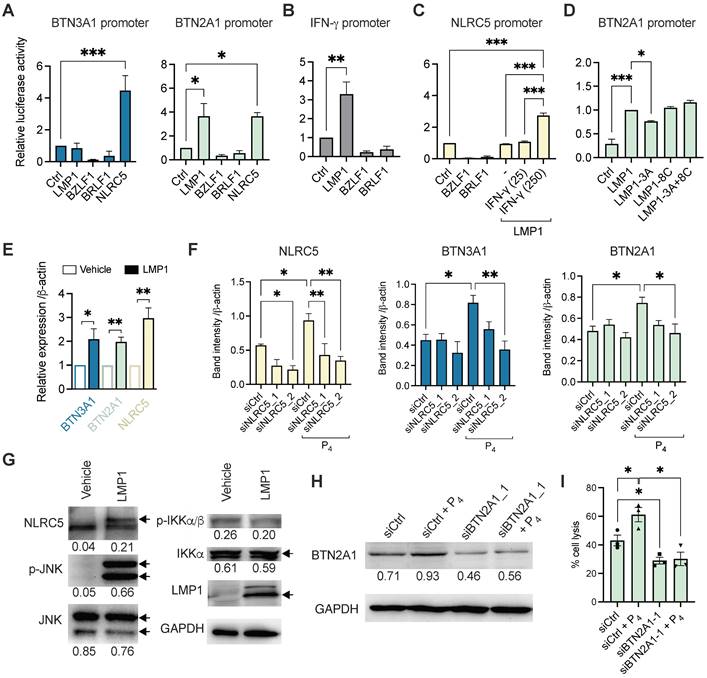
To further examine how LMP1 stimulates BTN3A1 and BTN2A1 expression, we performed the luciferase reporter experiments using plasmids encoding mutant LMP1 for the functional domains CTAR1 (3A) and CTAR2 (8C) or both (3A+8C). As shown in Figure 5D, only LMP1-3A had a modest but significantly reduced the induction of BTN2A1 promoter activity, suggesting that CTAR1 and downstream pathways may be associated with LMP1 function on regulating BTN2A1 expression. To corroborate the findings, we overexpressed LMP1 in HONE1 cells and found that BTN3A1, BTN2A1 and NLRC5 gene expression were significantly upregulated by 3 h post-transfection when compared to vehicle (Figure 5E). Further, siRNA was used to confirm if NLRC5 mediated BTN3A1 and BTN2A1 expression following P4 treatment. HONE1-EBV cells were transfected with two siRNAs against NLRC5 (siNLRC5_1 and siNLRC5_2) for 24 h prior to P4 stimulation for another 16-24 h. P4 treatment significantly increased NLRC5 protein expression but decreased when either siRNAs against NLRC5 were used (Figure 5F and Figure S12). P4-induced BTN3A1 and BTN2A1 protein levels were also decreased but statistical significance was only reached with siNLRC5_2 (Figure 5F). Importantly, P4 treatment induced NLRC5 and BTN3A1 co-expression in tumor tissue in our mice experiments compared to those without P4 treatment (Figure S13 A and B).
LMP1 can activate c-Jun N-terminal kinase (JNK) and NF-κB signaling cascades, we next sought to determine if LMP1 has any effect on these proteins by Western blotting. Overexpression of LMP1 in HONE1 cells after 24 h lead to increased NLRC5 and p-JNK protein levels, suggesting that the NLRC5 pathway was activated (Figure 5G). However, p-IKKα/β or IKKα/β had no significant difference, indicating that NF-κB is not induced by LMP1 in HONE1 or it could be inhibited by NLRC5 as reported previously [37]. From the results so far, P4 treatment of EBV+ NPC cells leads to the expression of LMP1, which in turn triggered the expression of IFN-γ and p-JNK to drive NLRC5 induction of BTN3A1 and BTN2A1. Inhibitors against NF-κB and JNK1 slightly decreased the protein expression level of P4-induced BTN3A1, BTN2A1, and NLRC5 (Figure S14). While inhibition of JNK1 is consistent to the LMP1 transfection results, inhibition of NF-κB led to decreased expression is unexpected. Besides LMP1, other factors arising from P4 treatment could trigger IFN-γ more potently (Figure S11B) and activate the NF-κB-NLRC5 pathway to induce the expression of BTN3A1 and BTN2A1.
To confirm the significance of P4-induced BTN2A1 expression in promoting Vδ2 T cell cytotoxicity, we next downregulated BTN2A1 by siRNA (siBTN2A1_1) prior to P4 treatment in C666-1 cells, as it has a more dominant role in the activation of Vδ2 T cells [27]. BTN2A1 protein expression was found inhibited by siBTN2A1_1 compared to control (siCtrl) with or without P4 treatment (Figure 5H and Figure S15). When these cells were co-cultured with PTA-Vδ2 cells, a significantly decreased level of cytotoxicity was found compared to control siRNA pre-transfected cells (Figure 5I). Therefore, P4-induced BTN2A1 expression allows greater activation of PTA-Vδ2 cells for cytotoxicity. Overall, the P4-LMP1-IFN-γ/p-JNK-BTN2A1/BTN3A1 axis identified by these experiments likely underlie the effectiveness of the P4 plus PTA-Vδ2 T cell therapy against NPC.
Discussion
NPC is a diverse and heterogenous tumor with no defined antigens or therapeutic targets that render difficulty for the development of an effective treatment [38-40]. Here, we demonstrated a new anti-NPC therapy to inhibit NPC tumor growth by using the combination of an EBV-targeting peptide (L2P4 or P4) synergized with adoptive transfer of Vδ2 T cells. The underlying mechanism is associated with (L2)P4-induced EBV LMP1 triggers NLRC5 to promote BTN2A1/BTN3A1 expression on NPC. To our knowledge, this is the first report to show the linkage between LMP1, NLRC5, BTN2A1/BTN3A1 expression and higher susceptibility towards Vδ2 T cell cytotoxicity.
The anti-tumor characteristics of Vδ2 T cells are well established and have been used in clinical trials against various cancers besides NPC [20]. Our data shows that Vδ2 T cells have cytotoxic effects on NPC cell lines to different extent (Figure 1). Moreover, we confirmed that PTA has an advantage in promoting the cytotoxic function of Vδ2 T cells compared to Zol in these settings. It has also been suggested by other studies that PTA expanded cells acquired antigen presentation, cytokine capabilities and memory phenotype [25, 41, 42]. When EBV reactivation was induced by NaB/PMA or (L2)P4, there was an increase in the cytotoxic function of Vδ2 T cells. This is due to the upregulated expression of BTN2A1/BTN3A1 for pAg recognition by TCR of Vδ2 T cells [43]. Indeed, P4-treated NPC tumors from the mice experiments confirmed the increased co-expression of BTN2A1/BTN3A1 (Figure 4C). Therefore, it is likely that NPC tumor cells with dysregulated metabolic pathways accumulate pAgs (such as IPP), which has been reported in cancers in the liver, lung, or colon [21]. The possible consequence is the presentation of pAg by BTN2A1/BTN3A1. However, whether the (L2)P4-stimulated pAgs are presented on BTN2A1/BTN3A1 and recognized by Vδ2 T cells in the NPCs remain to be examined.
The effectiveness of Vδ2 T cells as adoptive immunotherapy against solid tumors relies on successful tumor infiltration while retaining cytotoxic function in the TME [20]. In this regard, our mice experiments showed that adoptive transfer of Vδ2 T cells can infiltrate into the NPC tumors that is enhanced by P4 treatment (Figure 3 and Figure S6). Previous study reported oncolytic activity of (L2)P4 against NPC tumors when injected twice a week for 4 weeks but provided no information on the mechanism related to EBV genes or Vδ2 T cells [19]. In our hands, P4 led to deformation of the tumor structure with areas void of cells (lesions) where the transferred Vδ2 T cells appear to accumulate more efficiently when compared to non-P4 controls (Figure 2F and Figure 3). The increased P4-induced BTN2A1/BTN3A1 expression possibly triggered higher activation of the infiltrated Vδ2 T cells for cytotoxicity that lead to tumor regression as observed. In this sense, it is understandable that the poor effectiveness of adoptive Vδ2 T cells in clinical trials may be associated with naturally low BTN2A1/BTN3A1 expression in solid tumors. On the other hand, whether the immune-inhibitory molecules such as Galectin-9, PD-L1/L2, Tim-3, Lag-3, and CTLA4 are affected by P4 treatment warrants investigation. Besides, whether the increased BTN2A1/BTN3A1 activation signals allow Vδ2 T cells to overcome inhibitory cells such as myeloid-derived suppressor cells (MDSCs), tumor-associated macrophages (TAMs) and regulatory T cells (Tregs) in the TME of NPC remain to be investigated [44].
NLRC5 is a key regulator of MHC class I expression and CD8+ T cell responses [45, 46], where the reduced expression in cancers correlates with decreased anti-tumor cytotoxicity [47]. NLRC5 could be induced following NF-κB activation via innate immune pathway, but NF-κB can also be inhibited by NLRC5 [37]. Moreover, blocking of JNK decreased BTN2A1/BTN3A1 expression in P4 treated cells, which may be related to LMP1-induced JNK activation as shown in our experiments (Figure 5G) [48]. One recent study reported that NLRC5 also regulates BTN3A1-3 expression [36], which implies that the lowered NLRC5 expression in solid tumors could also result in the loss of Vδ2 T cell cytotoxic functions. In addition, our reporter assay results found that NLRC5 can also trigger BTN2A1 expression which was not shown before. NLRC5 has been suggested as a form of cancer immunotherapy that complements effective immune checkpoint inhibitor treatment [49]. As previous work also identified somatic mutations of NLRC5 in 4.8% of EBV-positive NPCs [40], but whether these mutations affect BTN2A1 and BTN3A1 expression remains to be investigated in clinical NPC cancers. The use of P4 treatment in EBV+ NPCs to upregulate NLRC5 may provide an advantage to enhance anti-tumor immune responses. The relevance of LMP1 to NLRC5 may reinforce the importance of the EBV gene in anti-tumor immunity.
LMP1 is an oncogene that regulates multiple cellular processes for tumor transformation, including activation of fibroblast growth factor receptor 1 (FGFR1) [50], increased aerobic glycolysis through mTORC1 [51], and promotion of epithelial-mesenchymal transition (EMT) [52-54]. However, LMP1 has not been shown to induce NLRC5-triggered butyrophilins expression related to Vδ2 T cell cytotoxic functions. In our hands, LMP1 CTAR1 appeared to influence BTN2A1 expression likely through IFN-γ and p-JNK mediated NLRC5. However, CTAR1 can activate other signaling cascades that may have the potential to influence the expression of BTN2A1 and BTN3A1 [15]. Here, not only did we confirm that NLRC5 can stimulate BTN3A1 expression [36], but it also induces BTN2A1 in NPC cells. Moreover, LMP1 can elevate p-JNK and IFN-γ that may lead to the upregulation of NLRC5. We also postulate that LMP1 induced NLRC5 may also upregulate MHC-I for anti-tumor CD8+ T cell responses, which should be examined. Therefore, there is potential for LMP1 as a therapeutic tool to stimulate NLRC5 for enhancing anti-tumor T cell responses in the TME.
Overall, this study demonstrated that Vδ2 T cells can successfully inhibit NPC tumor growth when the hurdle of sufficient BTN2A1/BTN3A1 expression are overcame by use of the EBV-reactivating agent (L2)P4. The mechanism that P4-induced LMP1 can trigger the IFN-γ/p-JNK-NLRC5-BTN2A1/BTN3A1 axis has the potential for future development as a combinatorial immunotherapy with adoptive Vδ2 T cells in treating NPCs as well as other tumors.
Abbreviations
BCRF1: BamHI-C fragment rightward reading frame 1; BSA: bovine serum albumin; BTN: butyrophilin; BZLF1: BamHI Z fragment leftward open reading frame 1; cDNA: complementary DNA; CTAR: C-terminal activation region; CTLA4: cytotoxic T-lymphocyte-associated protein 4; DMEM: Dulbecco's modified Eagle's medium; E:T: effector: target; EBERs: epstein-barr virus encoded small RNAs; EBNA: epstein-barr nuclear antigen; EBV: epstein-barr virus; EMT: epithelial-mesenchymal transition; FBS: fetal bovine serum; FFPE: formalin-fixed paraffin-embedded; FGFR1: fibroblast growth factor receptor 1; HLA: human leukocyte antigen; HRP: horseradish peroxidase; i.t.: intratumoral; i.v.: intravenous; ICD: immunological cell death; IFN: interferon; IKKα: IκB Kinase α; IPP: isopentenyl pyrophosphate; JNK: c-Jun N-terminal kinases; Lag-3: lymphocyte-activation gene 3; LMP1: latent membrane protein 1; MAPK: mitogen-activated protein kinase; MDSC: myeloid-derived suppressor cell; MFI: mean fluorescence intensity; mTORC1: mammalian target of rapamycin complex 1; NaB: sodium butyrate; NF-κB: nuclear factor kappa-light-chain-enhancer of activated B cells; NLRC5: NOD-like receptor family CARD domain containing 5; NPC: nasopharyngeal carcinoma; NSG: NOD.Cg-PrkdcscidIl2rgtm1Wjl/SzJ; P.I.: post-infection; pAg: phosphoantigen; PBMC: peripheral blood mononuclear cell; PBS: phosphate buffered saline; PCA: principal component analysis; PD-L1: programmed death-ligand 1; PD-L2: programmed death-ligand 2; PI3K: phosphoinositide 3-kinase; PMA: phorbol 12-myristate 13-acetate; PPFE: formalin-fixed paraffin-embedded; PTA: tetrakis-pivaloxloxymethyl 2-(thiazole-2-ylamino) ethylidene-1,1-bisphosphonate; PTA-Vδ2: PTA-expanded Vδ2 T cells; rhIL-2 or IL-2: recombinant human interleukin-2; RPMI: Roswell Park Memorial Institute; RT-qPCR: reverse transcription real-time quantitative PCR; s.c.: subcutaneous; siRNA: small interfering RNA; TAM: tumor-associated macrophages; TCR: T-cell receptor; Tim-3: T-cell immunoglobulin and mucin-domain containing-3; TME: tumor microenvironment; TPA: 12-O-tetradecanoylphorbol-13-acetate; Treg: regulatory T cells; V: tumor volume; Zol: zoledronic acid; Zol-Vδ2: zoledronic acid-expanded Vδ2 T cells.
Supplementary Material
Supplementary figures and tables.
Acknowledgements
We thank Dr Anna Chi Man Tsang (The Chinese University of Hong Kong) and Dr Ming Han Tsai (National Yang-Ming University) for providing EBV gene expression plasmids. We thank Hong Kong Red Cross for providing the buffy coats. Illustration in the graphical abstract was created with Biorender.com.
Ethics approval
The in vitro experiments and animal experiments in this study was approved by the Institutional Review Board of the Hong Kong Baptist University (#REC/20-21/0217).
Funding
This study was supported by Health and Medical Research Fund (HMRF) (18170032), Research Grant Council (RGC) Theme-based Research Scheme (TBRS) (T12-712/21-R), Pneumoconiosis Compensation Fund Board Research Grant (2022), Interdisciplinary Research Matching Scheme (RC-IRCs-1718-03), Faculty Research Grant (FRG2/17-18/066), Faculty Start-up Fund (SCI-17-18-01), Tier 2 Start-up Grant (RC-SGT2/18-19/SCI/007), and Research Council Start-up Grant of Hong Kong Baptist University (to A.K.L.C.).
Author contributions
AKLC conceptualized the study. YL, KSL, TYF, PYS, CYL, AKLC performed the experiments. YL, LC, HLL, AKLC designed the experiments. NKM, KW, HLL, YT provided key reagents. YL, KSL, TYF, PYS, CYL, AKLC analyzed data. AKLC wrote the manuscript. YL, KSL, TYF, AKLC revised the manuscript. NKM, HLL, YT provided critical comments.
Competing Interests
The authors have declared that no competing interest exists.
References
1. Zhang L, Chen QY, Liu H, Tang LQ, Mai HQ. Emerging treatment options for nasopharyngeal carcinoma. Drug Des Devel Ther. 2013;7:37-52
2. Abdulamir AS, Hafidh RR, Abdulmuhaimen N, Abubakar F, Abbas KA. The distinctive profile of risk factors of nasopharyngeal carcinoma in comparison with other head and neck cancer types. BMC Public Health. 2008;8:400
3. Chan AT, Gregoire V, Lefebvre JL, Licitra L, Hui EP, Leung SF. et al. Nasopharyngeal cancer: Ehns-esmo-estro clinical practice guidelines for diagnosis, treatment and follow-up. Ann Oncol. 2012;23(Suppl 7):vii83-5
4. Du T, Xiao J, Qiu Z, Wu K. The effectiveness of intensity-modulated radiation therapy versus 2d-rt for the treatment of nasopharyngeal carcinoma: A systematic review and meta-analysis. PLoS One. 2019;14:e0219611
5. Kong F, Zhou J, Du C, He X, Kong L, Hu C. et al. Long-term survival and late complications of intensity-modulated radiotherapy for recurrent nasopharyngeal carcinoma. BMC Cancer. 2018;18:1139
6. Su SF, Han F, Zhao C, Huang Y, Chen CY, Xiao WW. et al. Treatment outcomes for different subgroups of nasopharyngeal carcinoma patients treated with intensity-modulated radiation therapy. Chin J Cancer. 2011;30:565-73
7. Wei Q, Li L, Zhu XD, Qin L, Mo YL, Liang ZY. et al. Effects of intensity-modulated radiotherapy and chemoradiotherapy on attention in patients with nasopharyngeal cancer. Oncotarget. 2017;8:60390-60400
8. Peipp M, Wesch D, Oberg HH, Lutz S, Muskulus A, van de Winkel JGJ. et al. Cd20-specific immunoligands engaging nkg2d enhance gammadelta t cell-mediated lysis of lymphoma cells. Scand J Immunol. 2017;86:196-206
9. Tsao SW, Tsang CM, Lo KW. Epstein-barr virus infection and nasopharyngeal carcinoma. Philos Trans R Soc Lond B Biol Sci. 2017 372
10. Tsang CM, Lui VWY, Bruce JP, Pugh TJ, Lo KW. Translational genomics of nasopharyngeal cancer. Semin Cancer Biol. 2020;61:84-100
11. Brooks L, Yao QY, Rickinson AB, Young LS. Epstein-barr virus latent gene transcription in nasopharyngeal carcinoma cells: Coexpression of ebna1, lmp1, and lmp2 transcripts. J Virol. 1992;66:2689-97
12. Kang MS, Kieff E. Epstein-barr virus latent genes. Exp Mol Med. 2015;47:e131
13. Lo AK, Lo KW, Tsao SW, Wong HL, Hui JW, To KF. et al. Epstein-barr virus infection alters cellular signal cascades in human nasopharyngeal epithelial cells. Neoplasia. 2006;8:173-80
14. Dawson CW, Port RJ, Young LS. The role of the ebv-encoded latent membrane proteins lmp1 and lmp2 in the pathogenesis of nasopharyngeal carcinoma (npc). Semin Cancer Biol. 2012;22:144-53
15. Lo AK, Dawson CW, Lung HL, Wong KL, Young LS. The role of ebv-encoded lmp1 in the npc tumor microenvironment: From function to therapy. Front Oncol. 2021;11:640207
16. Gires O, Kohlhuber F, Kilger E, Baumann M, Kieser A, Kaiser C. et al. Latent membrane protein 1 of epstein-barr virus interacts with jak3 and activates stat proteins. EMBO J. 1999;18:3064-73
17. Bentz GL, Whitehurst CB, Pagano JS. Epstein-barr virus latent membrane protein 1 (lmp1) c-terminal-activating region 3 contributes to lmp1-mediated cellular migration via its interaction with ubc9. J Virol. 2011;85:10144-53
18. Hutt-Fletcher LM. Epstein-barr virus replicating in epithelial cells. Proc Natl Acad Sci U S A. 2014;111:16242-3
19. Jiang L, Lan R, Huang T, Chan C, Hongguang L, Lear S. et al. Ebna1-targeted probe for the imaging and growth inhibition of tumours associated with the epstein-barr virus. . Nat Biomed Eng. 2017 1
20. Kabelitz D, Serrano R, Kouakanou L, Peters C, Kalyan S. Cancer immunotherapy with gammadelta t cells: Many paths ahead of us. Cell Mol Immunol. 2020;17:925-939
21. Hoeres T, Smetak M, Pretscher D, Wilhelm M. Improving the efficiency of vgamma9vdelta2 t-cell immunotherapy in cancer. Front Immunol. 2018;9:800
22. Paul S, Lal G. Regulatory and effector functions of gamma-delta (gammadelta) t cells and their therapeutic potential in adoptive cellular therapy for cancer. Int J Cancer. 2016;139:976-85
23. Matsumoto K, Hayashi K, Murata-Hirai K, Iwasaki M, Okamura H, Minato N. et al. Targeting cancer cells with a bisphosphonate prodrug. ChemMedChem. 2016;11:2656-2663
24. Tanaka Y, Iwasaki M, Murata-Hirai K, Matsumoto K, Hayashi K, Okamura H. et al. Anti-tumor activity and immunotherapeutic potential of a bisphosphonate prodrug. Sci Rep. 2017;7:5987
25. Tanaka Y, Murata-Hirai K, Iwasaki M, Matsumoto K, Hayashi K, Kumagai A. et al. Expansion of human gammadelta t cells for adoptive immunotherapy using a bisphosphonate prodrug. Cancer Sci. 2018;109:587-599
26. Rhodes DA, Chen HC, Williamson JC, Hill A, Yuan J, Smith S. et al. Regulation of human gammadelta t cells by btn3a1 protein stability and atp-binding cassette transporters. Front Immunol. 2018;9:662
27. Karunakaran MM, Willcox CR, Salim M, Paletta D, Fichtner AS, Noll A. et al. Butyrophilin-2a1 directly binds germline-encoded regions of the vgamma9vdelta2 tcr and is essential for phosphoantigen sensing. Immunity. 2020;52:487-498 e6
28. Rigau M, Ostrouska S, Fulford TS, Johnson DN, Woods K, Ruan Z. et al. Butyrophilin 2a1 is essential for phosphoantigen reactivity by gammadelta t cells. Science. 2020 367
29. Fernandez NF, Gundersen GW, Rahman A, Grimes ML, Rikova K, Hornbeck P. et al. Clustergrammer, a web-based heatmap visualization and analysis tool for high-dimensional biological data. Sci Data. 2017;4:170151
30. Cheung AKL, Huang Y, Kwok HY, Chen M, Chen Z. Latent human cytomegalovirus enhances hiv-1 infection in cd34(+) progenitor cells. Blood Adv. 2017;1:306-318
31. Wu X, Liu L, Cheung KW, Wang H, Lu X, Cheung AK. et al. Brain invasion by cd4(+) t cells infected with a transmitted/founder hiv-1bjzs7 during acute stage in humanized mice. J Neuroimmune Pharmacol. 2016;11:572-83
32. Lin W, Yip YL, Jia L, Deng W, Zheng H, Dai W. et al. Establishment and characterization of new tumor xenografts and cancer cell lines from ebv-positive nasopharyngeal carcinoma. Nat Commun. 2018;9:4663
33. Jiang L, Lung HL, Huang T, Lan R, Zha S, Chan LS. et al. Reactivation of epstein-barr virus by a dual-responsive fluorescent ebna1-targeting agent with zn(2+)-chelating function. Proc Natl Acad Sci U S A. 2019;116:26614-26624
34. Sivachandran N, Wang X, Frappier L. Functions of the epstein-barr virus ebna1 protein in viral reactivation and lytic infection. J Virol. 2012;86:6146-58
35. Huang SY, Fang CY, Tsai CH, Chang Y, Takada K, Hsu TY. et al. N-methyl-n'-nitro-n-nitrosoguanidine induces and cooperates with 12-o-tetradecanoylphorbol-1,3-acetate/sodium butyrate to enhance epstein-barr virus reactivation and genome instability in nasopharyngeal carcinoma cells. Chem Biol Interact. 2010;188:623-34
36. Dang AT, Strietz J, Zenobi A, Khameneh HJ, Brandl SM, Lozza L. et al. Nlrc5 promotes transcription of btn3a1-3 genes and vgamma9vdelta2 t cell-mediated killing. iScience. 2021;24:101900
37. Cui J, Zhu L, Xia X, Wang HY, Legras X, Hong J. et al. Nlrc5 negatively regulates the nf-kappab and type i interferon signaling pathways. Cell. 2010;141:483-96
38. Liu Y, He S, Wang XL, Peng W, Chen QY, Chi DM. et al. Tumour heterogeneity and intercellular networks of nasopharyngeal carcinoma at single cell resolution. Nat Commun. 2021;12:741
39. Lin DC, Meng X, Hazawa M, Nagata Y, Varela AM, Xu L. et al. The genomic landscape of nasopharyngeal carcinoma. Nat Genet. 2014;46:866-71
40. Li YY, Chung GT, Lui VW, To KF, Ma BB, Chow C. et al. Exome and genome sequencing of nasopharynx cancer identifies nf-kappab pathway activating mutations. Nat Commun. 2017;8:14121
41. Okuno D, Sugiura Y, Sakamoto N, Tagod MSO, Iwasaki M, Noda S. et al. Comparison of a novel bisphosphonate prodrug and zoledronic acid in the induction of cytotoxicity in human vgamma2vdelta2 t cells. Front Immunol. 2020;11:1405
42. Odaira K, Kimura SN, Fujieda N, Kobayashi Y, Kambara K, Takahashi T. et al. Cd27(-)cd45(+) gammadelta t cells can be divided into two populations, cd27(-)cd45(int) and cd27(-)cd45(hi) with little proliferation potential. Biochem Biophys Res Commun. 2016;478:1298-303
43. Laplagne C, Ligat L, Foote J, Lopez F, Fournie JJ, Laurent C. et al. Self-activation of vgamma9vdelta2 t cells by exogenous phosphoantigens involves tcr and butyrophilins. Cell Mol Immunol. 2021;18:1861-1870
44. Haist M, Stege H, Grabbe S, Bros M. The functional crosstalk between myeloid-derived suppressor cells and regulatory t cells within the immunosuppressive tumor microenvironment. Cancers (Basel). 2021 13
45. Meissner TB, Li A, Biswas A, Lee KH, Liu YJ, Bayir E. et al. Nlr family member nlrc5 is a transcriptional regulator of mhc class i genes. Proc Natl Acad Sci U S A. 2010;107:13794-9
46. Kobayashi KS, van den Elsen PJ. Nlrc5: A key regulator of mhc class i-dependent immune responses. Nat Rev Immunol. 2012;12:813-20
47. Yoshihama S, Roszik J, Downs I, Meissner TB, Vijayan S, Chapuy B. et al. Nlrc5/mhc class i transactivator is a target for immune evasion in cancer. Proc Natl Acad Sci U S A. 2016;113:5999-6004
48. Eliopoulos AG, Blake SM, Floettmann JE, Rowe M, Young LS. Epstein-barr virus-encoded latent membrane protein 1 activates the jnk pathway through its extreme c terminus via a mechanism involving tradd and traf2. J Virol. 1999;73:1023-35
49. Yoshihama S, Cho SX, Yeung J, Pan X, Lizee G, Konganti K. et al. Nlrc5/cita expression correlates with efficient response to checkpoint blockade immunotherapy. Sci Rep. 2021;11:3258
50. Lo AK, Dawson CW, Young LS, Ko CW, Hau PM, Lo KW. Activation of the fgfr1 signalling pathway by the epstein-barr virus-encoded lmp1 promotes aerobic glycolysis and transformation of human nasopharyngeal epithelial cells. J Pathol. 2015;237:238-48
51. Zhang J, Jia L, Lin W, Yip YL, Lo KW, Lau VMY. et al. Epstein-barr virus-encoded latent membrane protein 1 upregulates glucose transporter 1 transcription via the mtorc1/nf-kappab signaling pathways. J Virol. 2017;91:e02168-16
52. Horikawa T, Yoshizaki T, Kondo S, Furukawa M, Kaizaki Y, Pagano JS. Epstein-barr virus latent membrane protein 1 induces snail and epithelial-mesenchymal transition in metastatic nasopharyngeal carcinoma. Br J Cancer. 2011;104:1160-7
53. O'Connor JW, Gomez EW. Biomechanics of tgfbeta-induced epithelial-mesenchymal transition: Implications for fibrosis and cancer. Clin Transl Med. 2014;3:23
54. Zhang J, Jia L, Liu T, Yip YL, Tang WC, Lin W. et al. Mtorc2-mediated pdhe1alpha nuclear translocation links ebv-lmp1 reprogrammed glucose metabolism to cancer metastasis in nasopharyngeal carcinoma. Oncogene. 2019;38:4669-4684
Author contact
![]() Corresponding author: Allen KL Cheung; Address: Rm 833, Run Run Shaw Building, Ho Sin-hang campus, Hong Kong Baptist University, 224 Waterloo Road, Kowloon Tong, Hong Kong SAR, China. E-mail: akcheungedu.hk; Tel: (852) 34117745; Fax: (852) 34117095.
Corresponding author: Allen KL Cheung; Address: Rm 833, Run Run Shaw Building, Ho Sin-hang campus, Hong Kong Baptist University, 224 Waterloo Road, Kowloon Tong, Hong Kong SAR, China. E-mail: akcheungedu.hk; Tel: (852) 34117745; Fax: (852) 34117095.