Impact Factor
- Issue 14; 2026
- Issue 13; 2026
- Issue 12; 2026
- Issue 11; 2026
- Issue 10; 2026
- Volume 16; 2026
- Advance Articles
- Past Issues
- Cover Images
- Cover Suggestion
- Index & Coverage
- Special Issues
Introduction
Materials and methods
Results
Discussion
Conclusion
Abbreviations
Acknowledgements
Supplementary Material
References
International Journal of Biological Sciences
International Journal of Medical Sciences
 Global reach, higher impact

Theranostics 2023; 13(10):3290-3309. doi:10.7150/thno.84978 This issue Cite
Research Paper
Comprehensive machine learning-generated classifier identifies pro-metastatic characteristics and predicts individual treatment in pancreatic cancer: A multicenter cohort study based on super-enhancer profiling
Dongjie Chen1,2,3†, Yizhi Cao1,2,3†, Haoyu Tang1,2,3†, Longjun Zang4, Na Yao1,2,3, Youwei Zhu1,2,3, Yongsheng Jiang1,2,3, Shuyu Zhai1,2,3, Yihao Liu1,2,3, Minmin Shi1,2,3, Shulin Zhao1,2,3, Weishen Wang1,2,3, Chenlei Wen1,2,3, Chenghong Peng1,2,3, Hao Chen1,2,3, Xiaxing Deng1,2,3 ![]() , Lingxi Jiang1,2,3
, Lingxi Jiang1,2,3 ![]() , Baiyong Shen1,2,3
, Baiyong Shen1,2,3 ![]()
1. Department of General Surgery, Pancreatic Disease Center, Ruijin Hospital, Shanghai Jiao Tong University School of Medicine, Shanghai, P.R. China.
2. Research Institute of Pancreatic Diseases, Shanghai Key Laboratory of Translational Research for Pancreatic Neoplasms, Shanghai Jiao Tong University School of Medicine, Shanghai, P.R. China.
3. State Key Laboratory of Oncogenes and Related Genes, Institute of Translational Medicine, Shanghai Jiao Tong University, Shanghai, P.R. China.
4. Department of General Surgery, Taiyuan Central Hospital, Shanxi, P.R. China.
† These authors have contributed equally to this work and share the first authorship.
Received 2023-4-5; Accepted 2023-5-13; Published 2023-5-27
Abstract

Rationale: Accumulating evidence illustrated that the reprogramming of the super-enhancers (SEs) landscape could promote the acquisition of metastatic features in pancreatic cancer (PC). Given the anatomy-based TNM staging is limited by the heterogeneous clinical outcomes in treatment, it is of great clinical significance to tailor individual stratification and to develop alternative therapeutic strategies for metastatic PC patients based on SEs.
Methods: In our study, ChIP-Seq analysis for H3K27ac was performed in primary pancreatic tumors (PTs) and hepatic metastases (HMs). Bootstrapping and univariate Cox analysis were implemented to screen prognostic HM-acquired, SE-associated genes (HM-SE genes). Then, based on 1705 PC patients from 14 multicenter cohorts, 188 machine-learning (ML) algorithm integrations were utilized to develop a comprehensive super-enhancer-related metastatic (SEMet) classifier.
Results: We established a novel SEMet classifier based on 38 prognostic HM-SE genes. Compared to other clinical traits and 33 published signatures, the SEMet classifier possessed robust and powerful performance in predicting prognosis. In addition, patients in the SEMetlow subgroup owned dismal survival rates, more frequent genomic alterations, and more activated cancer immunity cycle as well as better benefits in immunotherapy. Remarkably, there existed a tight correlation between the SEMetlow subgroup and metastatic phenotypes of PC. Among 18 SEMet genes, we demonstrated that E2F7 may promote PC metastasis through the upregulation of TGM2 and DKK1. Finally, after in silico screening of potential compounds targeted SEMet classifier, results revealed that flumethasone could enhance the sensitivity of metastatic PC to routine gemcitabine chemotherapy.
Conclusion: Overall, our study provided new insights into personalized treatment approaches in the clinical management of metastatic PC patients.
Keywords: super-enhancer, machine-learning algorithm, personalized treatment, multicenter study, metastatic pancreatic cancer
Introduction
Metastasis is a major cause of mortality and morbidity, which poses a great threat to the clinical management of cancer, especially in pancreatic cancer (PC). Most PC patients followed with the systemic disease at the time of diagnosis, and only 8% of patients survived more than five years after diagnosis [1]. Moreover, 50% of newly identified PC patients tend to be diagnosed with metastasis, of which liver metastasis ranks first as the leading cause of death [2]. Although surgical resection of the primary tumor remains the most effective strategy for prolonging patient survival, 85-90% of patients are incurable due to the systemic nature of the disease and the failure to detect the disease at an early stage [3, 4]. Over the past decades, immunotherapy and molecular target therapy have revolutionized the therapeutic outcomes in most solid tumors. Unfortunately, due to the high heterogeneity and complicated immune microenvironment, few metastatic PC patients could benefit from these novel therapies [5, 6]. Thus, in the era of personalized treatment, early intervention of “pro-metastatic” PC patients and identification of sensitive drugs is imperative.
Super-enhancers (SEs) are exceptionally huge clusters of enhancers that have been reported in multiple cell types [7, 8]. Compared to typical enhancers, SEs collectively bind a larger number of transcription factors to facilitate the transcription of many target genes. H3K27ac (acetylation of the lysine residue at N-terminal position 27 of the histone H3 protein) is correlated with higher transcription activation and is therefore characterized as one of the frequently-used indicators for SEs [9]. Research on super-enhancers has provided insights into the mechanisms that regulate gene expression and cell identity, and therefore the screening and identification of hub genes driven by SEs have suggested new strategies for the exploration of underlying biological processes [10, 11]. Otherwise, elevated SE activities are reported to be involved in the metastasis of multiple cancers. SE was found to recruit transcription factors FOXA2 and HNF1A and upregulated the liver-specific gene transcription, thereby driving colorectal cancer (CRC) liver metastasis [12]. By hijacking super-enhancers and subverting anti-tumor immunity, BAF155 methylation drives metastasis in triple-negative breast cancer [13]. Dong J [14] also revealed that disrupting SEs by BET inhibitors is an effective approach to suppress the growth and metastasis of human head and neck squamous cell carcinoma (HNSCC) by eliminating cancer stem cells. Through SEs of ENO2 and SRC, METTL14 was demonstrated to drive metastasis and glycolytic reprogramming in the renal cell carcinoma (RCC) [15]. Notably, reprogramming of the enhancer landscape was also proved to promote the acquisition of metastatic traits in PC [16, 17], but solid evidence validating the association between PC metastasis and SEs is lacking. With the help of multiple powerful machine-learning (ML) algorithms and multicenter cohorts, we can accurately characterize cancer metastasis and identify pro-metastasis modules at the resolution of SE level to better investigate the impacts of metastasis on PC.
In this study, based on 38 prognostic hepatic metastasis-acquired, super-enhancer-related (HM-SE) genes derived from SE profilings through ChIP-Seq analysis of primary pancreatic tumors (PTs) and hepatic metastases (HMs), we developed a super-enhancer-related metastatic (SEMet) classifier via 188 ML algorithm integrations in multicenter datasets. The prognostic and predictive value of the SEMet classifier was further explored and validated through a comprehensive analysis of 1 training cohort, 10 testing cohorts and 3 validation cohorts. Subgroup analysis demonstrated that the SEMetlow subgroup characterized the “pro-metastasis” status in PC. Additionally, the functional analysis demonstrated the correlation among 3 hub SEMet genes (DKK1, TGM2 and E2F7). At last, we screened out and confirmed that flumethasone might enhance the efficacy of gemcitabine in the treatment of metastatic PC, which would shed light on the novel personalized strategies for PC patients with metastasis. The overall workflow of our study is shown in Graphical Abstract.
Materials and methods
Sampling preparation and organoid establishment
For identifying the HM-SE genes, 2 patients with PT and 2 patients with HM were enrolled for H3K27ac ChIP-Seq analysis (Table S1). The samples were obtained from Ruijin Hospital, Shanghai Jiaotong University School of Medicine. The study protocol was approved by the Research Ethics Committee of Ruijin Hospital, School of Medicine, Shanghai Jiao Tong University. All enrolled participants consented to attend this cohort study and signed written informed consent. To create the metastatic patient-derived organoids (MDO), the fresh ccPDAC tissues were enzymatically digested and then treated for 1 hour at 37°C with 200 U/ml of deoxyribonuclease I (Roche) and collagenase type IV (SigmaAldrich) (Table S1). The cells plated in Basement Membrane (OuMel, #WM-MG-01) were filtered using a 70-m nylon mesh and and cultured by DMEM/F12 media containing 2% B27, N-acetyl-l-cysteine (SigmaAldrich, 1.25 mM), EGF (Gibco, 50 ng/mL), A83-01 (SigmaAldrich, 200 nM), Noggin (SigmaAldrich, 100 ng/mL), R-spondin 1 (SigmaAldrich, 500 ng/mL), Y-27632 (MedChemExpress, 10 mM), and dihydrotestosterone (SigmaAldrich, 1 nM).
Cell culture and transfection
Pan02 cells (a murine pancreatic adenocarcinoma cell line) and human PC cell lines (Capan-2, CFPAC, Patu 8988t) were purchased from American Type Culture Collection (ATCC). The cells were cultured at 37°C in an atmosphere of 5% CO2 and respectively maintained in IMDM or DMEM medium supplemented with 10-15% FBS with 100 U/mL penicillin and 100 μg/mL streptomycin. Transient transfections were performed using lipofectamine 3000 (Invitrogen) following the instructions from ATCC guidelines.
Chromatin immunoprecipitation (ChIP) and ChIP-qPCR experiments
The following three antibodies were used for ChIP experiments: H3K27ac (Abcam, #AB4729), E2F7 Polyclonal Antibody (ThermoFisher Scientific, #A303-037A-T) and Rabbit Control IgG (Abclonal, #AC005). ChIP assay was performed with 2 × 10⁷ adherent cells lysed to prepare nuclear extracts. Firstly, cells were treated with 1% formaldehyde to crosslink DNA. After chromatin shearing by sonication, the nuclear lysates were treated at 4°C overnight with protein A Dynabeads (Invitrogen, USA) combined with 3-5 g of antibody to prepare each sample. The beads were then retrieved with a magnet and cleaned. The DNA was then decrosslinked for 4 hours at 55°C, and purified by QIAquick PCR Purification Kit (QIAGEN, USA). 5-10 ng of pure ChIP DNA was utilized as input material for subsequent detection in each sample. At last, DNA collected from the experiments was examined by qRT-PCR assays.
SE analysis
ROSE (Rank Ordering of Super-Enhancers) [18] was utilized to define the calling of SE with parameters (stitching distance=12.5 kb, TSS exclusive zone= +/- 2 kb) based on the ChIP-Seq peaks for H3K27ac according to a proximity rule as described in [10, 11]. Then, we implemented GREAT (version 3.0.0) online tool to assign regulatory elements identified in ChIP-Seq to their putative target genes based on the association rule: basal plus extension, proximal 1kb upstream and 1kb downstream, plus distal up to 1000kb.
RNA-seq data collection and processing
Totally, 1711 PC patients from 15 independent public cohorts were retracted from The Cancer Genome Atlas (TCGA, http://portal.gdc.cancer.gov/), International Cancer Genome Consortium (ICGC, http://dcc.icgc.org/), ArrayExpress (https://www.ebi.ac.uk/arrayexpress/), Clinical Proteomic Tumor Analysis Consortium (CPTAC, https://cptac-data-portal.georgetown.edu/) and Gene Expression Omnibus (GEO, https://www.ncbi.nlm.nih.gov/geo/). Among them, ICGC-AU-Array (n=267), TCGA-PAAD (n=176), ICGC-AU-Seq (n=81), ICGC-CA-Seq (n=182), E-MTAB-6134 (n=288), GSE62452 (n=65), GSE28735 (n=42), GSE78229 (n=49), GSE79668 (n=51), GSE85916 (n=79) and CPTAC-PDAC (n=135) with complete survival data were obtained for the establishment and validation of our classifier. Three cohorts, GSE21501 (n=102), GSE57495 (n=63) and GSE71729 (n=125) comprising entire OS information were selected as external validation cohorts. In addition, GSE151580, containing 6 paired PTs, HMs and tumor-adjacent normal pancreatic tissues (Ns), was also collected. The Fragments Per Kilobase of exon model per Million mapped fragments (FPKM) data of RNA-Seq in TCGA was downloaded from the UCSC Xena portal (https://xenabrowser.net/datapages/) and transformed into log2(TPM+1) format. The normalized expression profile of ICGC, ArrayExpress, CPTAC and GEO were downloaded from their portal. Otherwise, by removing the batch effects via the sva R package, Meta-cohort (n=1295) was combined from ICGC-AU-Array, TCGA-PAAD, ICGC-AU-Seq, ICGC-CA-Seq, E-MTAB-6134, GSE62452, GSE28735, GSE78229, GSE79668, GSE85916 and CPTAC-PDAC datasets. The z-score normalization of the expression matrix was applied across all datasets. The detailed clinical information of the enrolled 15 datasets was listed in Table S2.
SEMet classifier generated from integrative machine learning algorithms
To establish a comprehensive prognosis classifier in PC, we combined 10 ML algorithms and generated 188 integrations based on those prognostic HM-SE genes. These enrolled algorithms incorporated random survival forest (RSF), elastic network (Enet), Lasso (Enet alpha=1), Ridge (Enet alpha=0), stepwise Cox, CoxBoost, partial least squares regression for Cox (plsRcox), supervised principal components (SuperPC), generalized boosted regression modeling (GBM), and survival support vector machine (survival-SVM). Then, 188 algorithm integrations were implemented to fit prediction classifiers based on 10-fold cross-validation in the ICGC-AU-Array training cohort. Finally, 10 testing cohorts (TCGA-PAAD, ICGC-AU-Seq, ICGC-CA-Seq, E-MTAB-6134, GSE62452, GSE28735, GSE78229, GSE79668, GSE85916 and CPTAC-PDAC) were applied to calculate the concordance index (C-index) value and the classifier possessed highest average C-index was deemed as optimal SEMet classifier. Detailed information is provided in Supplementary Methods.
To validate the prognostic and predictive value of the SEMet classifier, we categorized PC patients into SEMethigh and SEMetlow subgroups according to the median scores which were calculated by the optimal algorithm integration mentioned above. Kaplan-Meier curve and multivariate Cox regression analysis were performed to evaluate the prognostic value of the SEMet classifier. Otherwise, we utilized the calibration plot and receiver-operator characteristic (ROC) to appraise the predictive performance of the SEMet classifier.
Tumor immune microenvironment (TIME) evaluation and response to immunotherapy
Gene set variation analysis (GSVA) score was calculated based on TIME signatures established by Kobayashi [19] and Bagaev [20] to assess the differences in TIME between SEMethigh and SEMetlow subgroups. The cancer immunity cycle was also measured by GSVA analysis [21, 22]. Several immunotherapy predictors, including the interferon γ (IFN-γ) [23], immunophenoscore (IPS) and the Tumor Immune Dysfunction and Exclusion (TIDE) [24] score were obtained to predict response to immune checkpoint blockages (ICBs). On the other hand, the subclass mapping algorithm was performed to evaluate the expression similarity between SEMethigh and SEMetlow subgroups, and speculate the immunotherapy efficacy of anti-PD-1 and anti-CTLA-4 [25].
Genomic alteration landscape
To delve into the genomic characteristics between SEMethigh and SEMetlow subgroups, we implemented an extensive investigation in somatic mutation and copy number alteration (CNA) data in the TCGA-PAAD cohort. The maftools R package was employed to exhibit the mutation frequencies of the top 15 genes and we evaluated the mutational signatures through the R package deconstructSigs with parameters by default. Four mutational signatures showed a significant correlation with PC were inferred, namely, mutational signature 1 (age-related), mutational signature 2 (APOBEC activity-related), mutational signature 6 (DNA MMR-related) and mutational signature 15 [26]. Additionally, recurrent focal somatic CNAs were detected and localized by GISTIC2.0 through GenePattern (https://www.genepattern.org/), with the thresholds of copy number amplifications/deletions being equal to ±0.3 (q-value < 0.05). Regions with CNA frequency > 20% were acquired for visualization. For detecting the methylation-driven events, we adhered to the pipeline launched by Liu Z [27] and screened out key methylation-driven genes (MDGs) for PC patients. Then, we analyzed the discrepancies in methylation level and mRNA expression level between SEMethigh and SEMetlow subgroups, and further assessed the correlation between distinct methylation status and prognosis in the two subgroups.
Annotation of metastasis-related characteristics for SEMet
To explore the association between biological characteristics and our SEMet score, we first determined significant metastatic and metabolic pathways from literature [28, 29]. Then, we calculated the NES values (GSVA) of those vital pathways, and Spearman coefficients were computed to measure the similarity between those pathways and the SEMet score. Human Cancer Metastasis Database (HCMDB, http://hcmdb.i-sanger.com/index), a database developed to archive metastatic data in pan-cancer, was applied to explore the difference in expression of metastasis-related genes of PC between SEMethigh and SEMetlow subgroups. The ROC curve was plotted to validate the predictive performance of the SEMet score in distinguishing advanced tumors from early-stage tumors.
Identification of the potential compounds
Drug sensitivity data of human cancer cell lines (CCLs) were extracted from the Cancer Therapeutics Response Portal (CTRP v.2.0, https://portals.broadinstitute.org/ctrp) and PRISM Repurposing dataset (19Q4, https://depmap.org/portal/prism/). The area under the curve (AUC) value represents the drug sensitivity in those two datasets, and lower AUC levels indicate escalated sensitivity to the treatment of distinct compounds. After imputing missing values via the K-nearest neighbor (k-NN) algorithm, compounds with more than 20% of missing data were omitted. Then, we identified the potential therapeutic compounds following the pipeline in Supplementary Methods.
Statistical analysis
All statistical tests were performed in R software (v 4.2.2). A chi-square test was performed to compare the count data. For the measurement data that conformed to the normal distribution, the Student-t test was applied; the Wilcox test was applied for non-normal distribution data between independent subgroups. Spearman analysis was applied to estimate the correlations between two variables that are not linearly related. The Kaplan-Meier test was utilized to validate the fraction of PC patients living for a certain survival time via the survival package and the log-rank test was conducted to compare the significance of the difference. The timeROC package was used to plot the ROC curve and calibration curve. DESeq2 package was used to call differentially expressed genes (DEGs) between two groups. Unless specifically stated, a two-tailed p-value of less than 0.05 was deemed statistically significant. See Supplementary Methods for fully detailed methods of other experiments included in our study.
Results
Genome-wide screening of SE and identification of HM-SE genes in PC
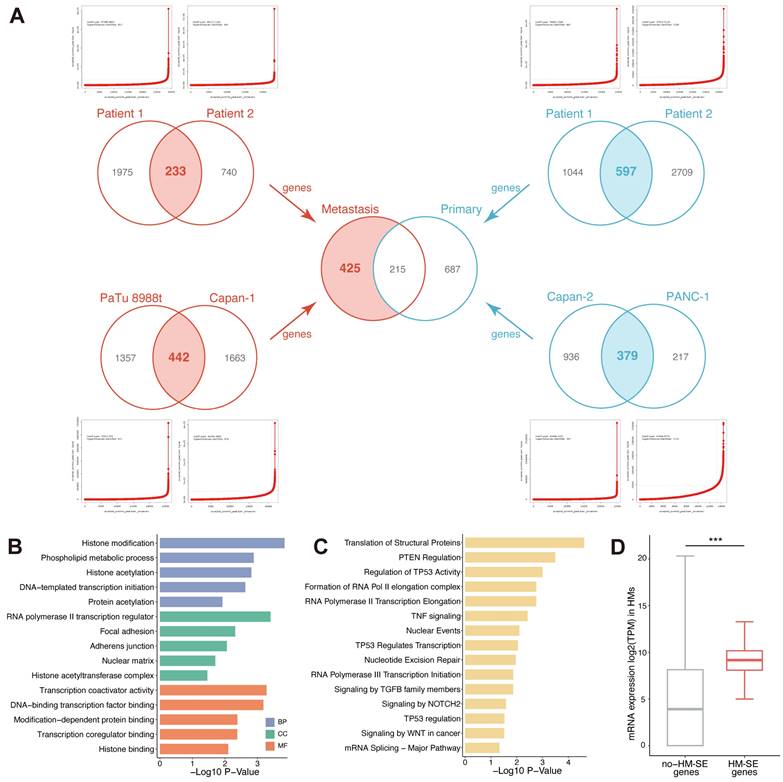
To explore the implications of SE alteration in metastatic pancreatic cancer, we compared the SE landscapes among 2 PT samples, 2 PT cell lines (Capan-2 and PANC-1), 2 HM samples and 2 HM cell lines (Capan-1 and PaTu 8988t) based on H3K27ac ChIP-Seq data. For cell lines, H3K27ac ChIP-Seq data of PANC-1 and Capan-1 were obtained from public datasets (GSE149103). According to the H3K27ac signal, enhancers localized within 12.5kb were stitched and ranked. Specific enhancers that occurred above the inflection point of the H3K27ac signal were determined as SEs, and those were then annotated with genes (SE-associated genes) across all enrolled samples and cell lines (Figure 1A, Table S4-11). As is shown in Figure 1A, we converged the SE-associated genes in 2 PT samples, 2 PT cell lines, 2 HM samples and 2 HM cell lines and acquired 233, 442, 597 and 379 SE-associated genes, respectively. To systematically investigate the alterations of SE landscape during metastasis in PC, we compared the common SE-associated genes between PT and HM by merging the SE-associated genes obtained from 2 PT samples/cell lines and 2 HM samples/cell lines separately. A total of 425 HM-SE genes were identified. Then, we first characterized the functions of these HM-SE genes. Pathway enrichment analysis revealed significant enrichment in transcriptional regulation (Figure 1B) and multiple biological mechanisms that are vital for cancer sustainability (Figure 1C). We further inspected the expression of the 425 HM-SE genes in HMs, the result showed that the expression level of these genes was considerably higher than those of other genes (Figure 1D). Our results revealed that the HM-SE genes not only correlated with the regulation of SE but also related to the oncogenesis of PC.
Identification of HM-SE genes in PC. (A) A total of 425 HM-SE genes were acquired from PT cell lines/samples and HM cell lines/samples in PC. (B) The Gene Ontology (GO) enrichment analysis demonstrated that 425 HM-SE genes were significantly associated with transcriptional regulations. (C) The Kyoto Encyclopedia of Genes and Genomes (KEGG) enrichment analysis illustrated that HM-SE genes were correlated with cancer sustainability. (D) RNA-seq results of 6 HMs suggested that the expression of the 425 HM-SE genes was higher than other genes.
Integrative construction of SEMet classifier
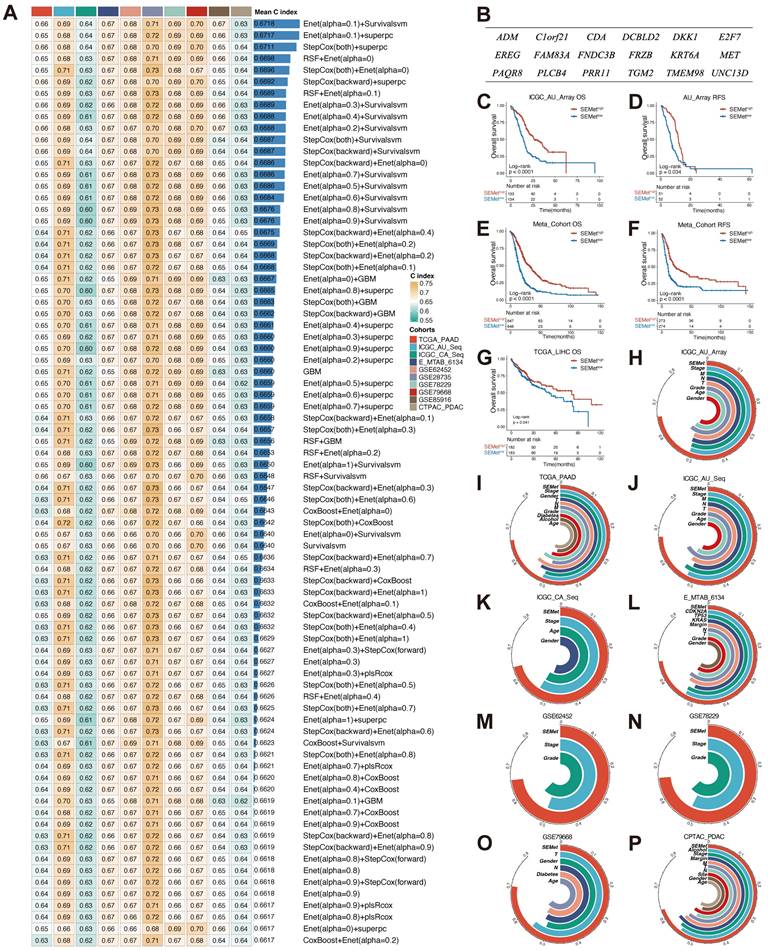
Based on the expression profile of 425 HM-SE genes, univariate Cox analysis combined with the bootstrapping method determined 38 prognostic HM-SE genes that were validated in most of the datasets in our study (Figure S1A). Next, these 38 prognostic HM-SE genes were subjected to integrative ML models to construct the SEMet classifier. ICGC-AU-Array dataset, which served as the training set, was applied to fit the 188 algorithm integrations based on 10-fold cross-validation and computed the average C-index in 10 testing datasets. The integration of Enet and survival-SVM which achieved the highest average C-index (0.6718) was identified as the optimal classifier (Figure 2A, Table S12). Moreover, the SEMet score of each sample was calculated in all 14 training and testing cohorts on the basis of 18 SEMet genes incorporated in the SEMet classifier (Figure 2B, Table S13).
Establishment and testing of the SEMet classifier. (A) The C-indexes of the top 80 ML algorithm integrations in 10 testing cohorts. (B) The 18 SEMet genes. Survival analysis for OS (C) and RSF (D) between SEMethigh and SEMetlow subgroup in the ICGC-AU-Array. Survival analysis for OS (E) and RSF (F) between SEMethigh and SEMetlow subgroup in the Meta-cohort. (G) Kaplan-Meier curve for OS in the TCGA-LIHC. The predictive value of the SEMet classifier compared with clinical features in ICGC-AU-Array (H), TCGA-PAAD (I), ICGC-AU-Seq (J), ICGC-CA-Seq (K), E-MTAB-6134 (L), GSE62452 (M), GSE78229 (N), GSE79668 (O) and CPTAC-PDAC (P).
Prognostic performance of SEMet classifier
In order to assess the prognostic efficiency of the SEMet classifier, all enrolled patients were categorized into SEMethigh and SEMetlow subgroups according to the median value of the SEMet score. As is shown in Figure 2C-F, the SEMetlow subgroup had considerably miserable overall survival (OS) and relapse-free survival (RFS) compared with the SEMethigh subgroup in ICGC-AU-Array and Meta-cohort. Interestingly, in the TCGA-LIHC dataset, Kaplan-Meier curves demonstrated a similar tendency in the survival rate of HCCs (Figure 2G), suggesting that the SEMet classifier constructed in PC also has comprehensive prospects in HCC. Additionally, multivariate Cox analysis based on clinicopathological characteristics demonstrated that the SEMet classifier was an independent prognostic factor in PACA-AU-Array and Meta-cohort (all p < 0.05, Figure S2).
In the other 10 testing cohorts, the survival analysis consistently revealed a markedly prolonged OS time in the SEMethigh subgroup than those in the SEMetlow subgroup (all p < 0.05, Figure S3). Likewise, the Kaplan-Meier analysis also demonstrated that patients in the SEMetlow subgroup had an unfavorable RFS in TCGA-PAAD, ICGC-CA-Seq and E-MTAB-6134 datasets (all p < 0.05, Figure S3). Similarly, after adapting for obtained clinicopathologic information, multivariate Cox analysis confirmed that the SEMet classifier was a protective factor for OS (all p < 0.05, Figure S2). Consistently, the SEMet classifier remained statistically significant for RSF in TCGA-PAAD, ICGC-CA-Seq and E-MTAB-613 cohorts (all p < 0.05, Figure S2). Given the results mentioned above, our SEMet classifier holds a robust level of prognostic performance and was an independent prognostic factor in PC.
Predictive value of SEMet classifier
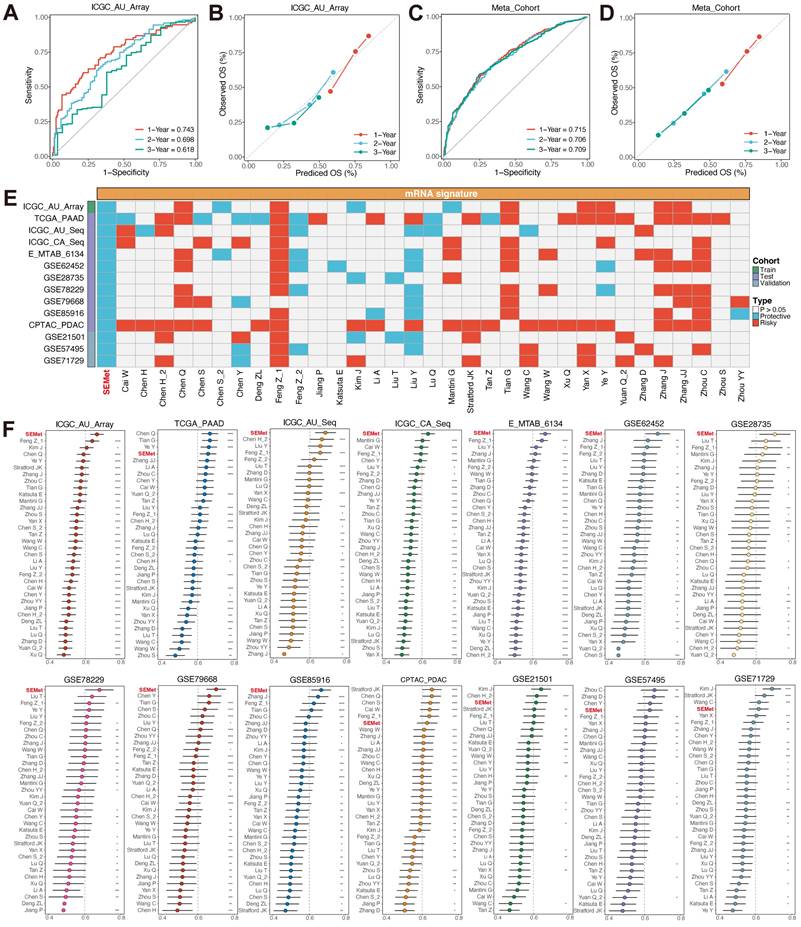
ROC curves were plotted to evaluate the sensitivity in the prediction of the SEMet classifier (Figure 3A, C and Figure S4). The calibration plots of the ICGC-AU-Array training set, Meta-cohort and 10 testing cohorts also confirmed that the SEMet classifier obtained an excellent value of prediction (Figure 3B, D and Figure S5). All these proofs exhibited that the SEMet classifier had a certain efficiency in multicenter cohorts. Numerous studies have confirmed that clinical traits and genetic alterations predict the prognosis of PC. Hence, we compared the predicted efficacy of the SEMet classifier with other clinical variables in 9 cohorts with completed clinical information. As is shown in Figure 2H-P, the C-index of the SEMet classifier had superior accuracy than other variables. Additionally, to further validate the classifier more scrupulously, we assessed the predictive capacity of the SEMet classifier in 3 validation datasets. Patients in the SEMetlow subgroup owned decreased survival rates in GSE21501, GSE57495 and GSE71729 cohorts (all p < 0.05, Figure S3). The AUC and calibration curve also determined the consistent predictive performance of the SEMet classifier (Figure S4-5). In summary, according to survival analysis, multivariate Cox analysis, ROC curve, calibration plot and C-index comparison, our SEMet classifier achieved sufficient to excellent performance in 1 training cohort, 10 testing cohorts and 3 validation cohorts. These results led us to deduce that the SEMet classifier may stress its potential as a predictive tool in the clinical management of PC.
Predictive performance of SEMet classifier. Calibration plot for predicting 1-, 2- and 3-year OS in ICGC-AU-Array (A) and Meta-cohort (C). ROC curve for predicting 1-, 2- and 3-year OS in ICGC-AU-Array (B) and Meta-cohort (D). (E) Univariate Cox analysis of SEMet classifier and 33 published signatures of PC. (F) Comparison of C-index and 33 published signatures in ICGC-AU-Array, TCGA-PAAD, ICGC-AU-Seq, ICGC-CA-Seq, E-MTAB-6134, GSE62452, GSE28735, GSE78229, GSE79668, GSE85916, CPTAC-PDAC, GSE21501, GSE57495 and GSE71729.
Comparison of multiple prognostic signatures in PC
The development of next-generation sequencing witnessed the construction of extensive prognostic signatures and classifiers based on various ML algorithms. We compared the performance of the SEMet classifier with 33 previous well-established predictive gene signatures related to a variety of biological characteristics such as immune microenvironment, ferroptosis, hypoxia, etc (Table S14). First of all, we conducted the univariate Cox analysis, and only our SEMet classifier had consistent significance across 14 independent cohorts (Figure 3E). Then, the C-index was also calculated to compare with all enrolled signatures. SEMet classifier revealed superior efficiency in each dataset than almost all signatures (ranked first in 9/14 datasets, Figure 3F). Notably, most of the signatures achieved higher stability in their training dataset but performed far from satisfactory in other external cohorts, which may be thanks to the poor generalisability and overfitting. Via integration and permutations of ML algorithms, our final optimal classifier was proved to reduce redundancy significantly and performed well.
Immune characteristics and immune response prediction of SEMet classifier
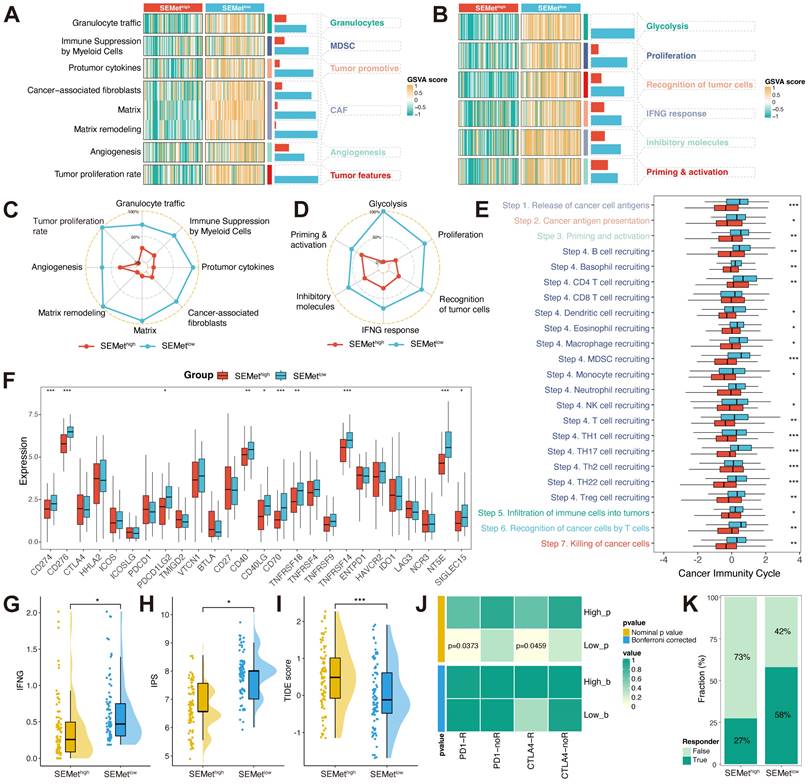
TIME is confirmed to play an indispensable role in metastatic PC by molding pre-metastatic sites into an immunosuppressive environment. According to two TIME signatures, the SEMetlow subgroup was associated with higher levels of MDSCs, CAFs, granulocytes, angiogenesis, tumor-related features by Bagaev (Figure 4A, C) and glycolysis, proliferation, recognition of tumor cells, INF-γ response, inhibitory molecules, priming & activation by Kobayashi (Figure 4B, D) in TCGA-PAAD dataset. To further detect the character of the SEMet classifier in response to immunotherapy, we first calculated the cancer immunity cycle which represents the state of checkpoints and inhibitors in the immune response. Extraordinary, most steps of the cancer immunity cycle were more activated in the SEMetlow subgroup in the TCGA-PAAD dataset (Figure 4E). In addition, the SEMetlow subgroup had higher expression levels of ICBs (Figure 4F). Furthermore, the association between the SEMet classifier and immunotherapy indicators was explored. A lower SEMet score was more correlated with a higher IFN-γ level (Figure 4G), a higher IPS score (Figure 4H) and a lower TIDE score (Figure 4I), all of which were predictors of superior immunotherapy response. Besides, the Submap algorithm confirmed that the SEMetlow subgroup tended to benefit from immunotherapy responses (Figure 4J-K).
The immune landscape between SEMethigh and SEMetlow subgroup. Heatmap of GSVA score based on Kobayashi (A) and Bagaev (B) TIME signatures. The radar chart revealed the differences in TIME signatures developed by Kobayashi (C) and Bagaev (D) between SEMethigh and SEMetlow subgroups. (E) Boxplot displayed the cancer immunity cycle differences between SEMethigh and SEMetlow subgroups. (F) Boxplot of expression of 27 ICBs between SEMethigh and SEMetlow subgroups. Boxplot illustrated the IFN-γ (G), IPS (H) and TIDE score (I) between SEMethigh and SEMetlow subgroups. (J) Contingency table between immunotherapy responses (anti-PD-1 and anti-CTLA-4) and SEMet groups based on SubMap analysis. (K) Percentage of immune responses between SEMethigh and SEMetlow subgroups.
Genomic landscape of SEMet classifier
To inspect the genomic landscape between SEMethigh and SEMetlow subgroups, we implemented a broad analysis of somatic mutations and CNA. As is shown in Figure 5A, the SEMetlow subgroup exhibited a higher tumor mutation burden (TMB) level than the SEMethigh subgroup. In the analysis of mutation signatures in PC, we found that mutation signature 1 (age-related) was abundant in the SEMetlow subgroup. In contrast, mutation signature 6 (DNA MMR-related) was enriched in the SEMethigh subgroup. Accumulating evidence has demonstrated that the tumor oncogene/suppressor gene mutation plays a critical role in initiating and maintaining PC and its related signaling network. Herein, we further assessed the mutation rate of genes in 10 classical oncogenic pathways in TCGA [30]. Of note, the SEMetlow subgroup possessed significant mutation of tumor suppressor genes (TP53 and CDKN2A) and oncogene (KRAS), while the SEMethigh subgroup did the opposite (Figure 5B). Additionally, we explored the CNV characteristics between two subgroups. Compared to the SEMethigh subgroup, the SEMetlow subgroup obtained higher amplification of 8q24.21 (oncogene MYC located), 8q24.22, 8q24.12 and deletion of 18q21.2 (suppressor gene CDKN2A/B located), 9p21.3 (suppressor gene SMAD4 located), 17p12. Overall, we could hypothesize that the alterations of tumor oncogene/suppressor gene in the genomic landscape lead to the distinct features between SEMethigh and SEMetlow subgroups.
Muti-omics analysis based on mutation, CNV and methylation. (A) Comparison of somatic mutation and CNV between SEMethigh and SEMetlow subgroups. (B) Mutation landscape in 10 canonical oncogenic pathways between SEMethigh and SEMetlow subgroups. Boxplot of methylation level (C) and expression of 4 MDGs (D). (E) Survival analysis between high and low methylation groups in 4 MDGs.
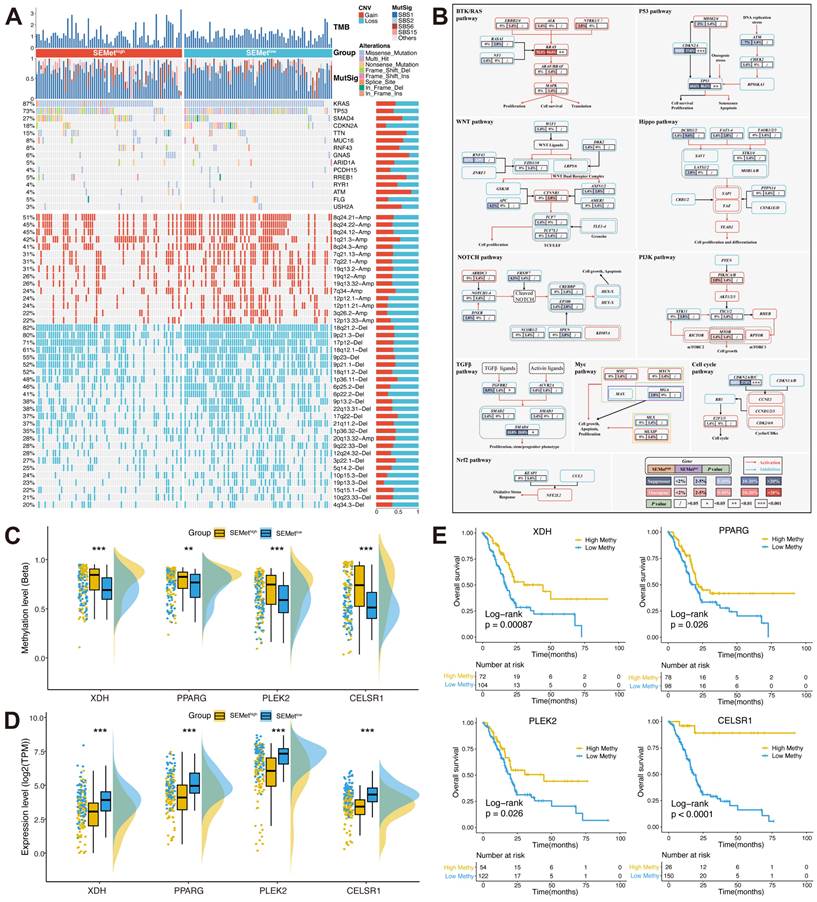
Furthermore, we investigated the MDGs to unveil the methylation-driven events in PC based on our SEMet classifier. Results showed that four MDGs (XDH, PPARG, PLEK2 and CELSR1) gained lower methylation levels and higher mRNA expression levels in the SEMetlow subgroup compared to the SEMethigh subgroup (Figure 5C-D). In survival analysis, we concluded that the lower methylation level group achieved significantly shorter overall survival in four identified MDGs (Figure 5E), which implies methylation also plays an essential part in the SEMet classifier.
Correlation between the SEMet classifier and published PC classifications
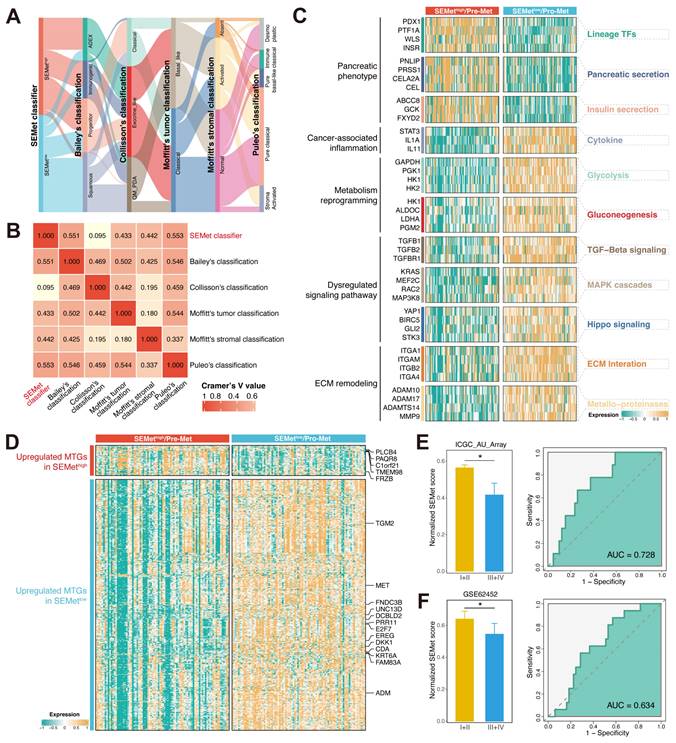
Next, we compared the SEMet classifier with reported molecular subtypes in PC. The signature genes of Bailey's classification, Collisson's classification, Moffitt's tumor classification and Moffitt's stromal classification were utilized to cluster PC patients in the TCGA-PAAD cohort (Figure S6A-D, Table S15), and Puleo's classification was predicted followed the pipeline in Supplementary Methods (Table S15). Results illustrated that there was no significant difference between Collisson's classification and SEMet classifier (p = 0.45, Table S16), while Bailey's classification (p < 0.0001), Moffitt's tumor classification (p < 0.0001), Moffitt's stromal classification (p < 0.0001) and Puleo's classification (p < 0.0001) exhibited considerable correlations (Table S16). For the combination of Bailey's classification, we found that the proportion of squamous subtype was higher and the percentage of other subtypes was lower in SEMetlow subgroup versus SEMethigh subgroup (55.68% vs 5.68%, 21.59% vs 34.09%, 11.36% vs 27.27%, 11.36% vs 32.95%, p < 0.0001). With regard to Moffitt's tumor classification, we observed that SEMetlow subgroup was composed of a more basal-like subtype and a less classical subtype compared to SEMethigh subgroup (68.18% vs 25.00%, 31.82% vs 75.00%, p < 0.0001). For Moffitt's stromal classification, results demonstrated that the SEMetlow subgroup possessed a more activated subtype and less normal subtype than SEMethigh subgroup (57.95% vs 15.91%, 37.50% vs 68.18%, p < 0.0001). With respect to Puleo's classification, the frequency of desmoplastic and immune classical was lower within SEMetlow subgroup (6.82% vs 26.14%, 18.18% vs 1.14%, p < 0.0001). On the contrary, we also found a higher frequency of pure basal-like and stroma activated subtypes in SEMetlow subgroup versus SEMethigh subgroup (19.32% vs 0.00%, 23.86% vs 3.41%, p < 0.0001). The alluvial plot exhibited that the SEMet classifier had a robust relationship with other molecular classifications (Figure 6A). Furthermore, the similarity between the SEMet classifier and other published classifications was quantified by Cramer's V (Figure 6B). We observed that the SEMet classifier had the highest correlation with Puleo's classification (Cramer's V value = 0.553) and the lowest relationship with Collisson's classification (Cramer's V value = 0.095). In conclusion, it was demonstrated that the SEMet classifier was significantly correlated with other PC classifications and the prognosis of PC patients.
The biological function of the SEMetlow subgroup. (A) The alluvial plot displayed the relationship between the SEMet classifier and other molecular classifications. (B) Heatmap of Cramer's V statistic reflected the corrections between six PC molecular classifications. (C) The dynamic regulation pattern of gene expression across SEMethigh and SEMetlow subgroups based on basic molecular hallmarks. (D) The expression of metastasis-related genes of PC in HCMDB. ROC curve for predicting advanced tumors of SEMet classifier in ICGC-AU-Array (E) and GSE62452 (F).
SEMetlow subgroup is associated with pro-metastasis functions
Since the development of the SEMet classifier is based on the SE profile of HMs, we assumed that there were differences in biological functions related to metastasis at different levels of SEMet scores. Hence, based on basic molecular hallmarks, we studied the dynamic regulation pattern of gene expression across SEMethigh and SEMetlow subgroups. As is shown in Figure 6C, the SEMetlow subgroup was significantly enriched in biological processes such as cancer-associated inflammation, metabolism reprogramming, dysregulated signaling pathway and ECM remodeling, while the SEMethigh subgroup possessed more pancreatic phenotype. In consistency, GSEA further validated that the SEMetlow subgroup owned a more malignant phenotype (Figure S7A). Interestingly, we also observed that the SEMet score had a significant negative correlation with the glycolysis pathway and metabolic activity of metabolites, such as glycogen and retinoids (Figure S7B), suggesting that the SEMetlow subgroup adopts a distinct metabolism fashion as those in the SEMethigh subgroup. To further explore the metastatic features between two subgroups, we found that all of the SEMet genes were enrolled in the HCMDB dataset and most of the SEMet genes (13/18, 72%) were upregulated in the SEMetlow subgroup, implying that the SEMetlow subgroup possessed more metastatic characteristics in PC (Figure 6D). Thus, based on the above results, we deduced that the SEMetlow subgroup might represent the “pro-metastasis” status, and the SEMethigh subgroup might stand for the “pre-metastasis” environment in PC. To validate this hypothesis, subgroup analysis was performed in ICGC-AU-Array and GSE62452 datasets, and we observed that patients in the SEMetlow subgroup gained more advanced stages, which might result in dismal OS (Figure 6E-F). Regarding the metastasis prediction of SEMet score, AUC reached 0.728 in ICGC-AU-Array cohorts and 0.634 in GSE62452 cohorts (Figure 6E-F). While the AUC of GSE62452 was not satisfactory, it is probably due to the limited sample size.
Prognostic performance of 18 SEMet genes
To examine the prognostic performance of 18 SEMet genes, we performed the univariate Cox analysis based on the SEMet classifier and its 18 SEMet genes in comprehensive multicenter cohorts (1 training set, 10 testing sets and 3 validation sets). As illustrated in Figure S8, the SEMet classifier was an independent protective factor across all 14 cohorts, while SEMet genes performed hardly well in several datasets. Besides, we established 19 classifiers by 10 ML algorithms based on the expression of 18 SEMet genes in ICGC-AU-Seq cohorts. Then, the classifier constructed by survival-SVM, namely our SEMet classifier, ranked first across 19 classifiers among the average C-index of 13 cohorts (Figure S1B). In other words, our SEMet classifier, which was developed by combining Enet in dimensionality reduction and survival-SVM in feature selection, was the optimal integration and performed the best prognostic value.
DDK1 and TGM2 act in PC as a pro-metastasis factor targeted by E2F7
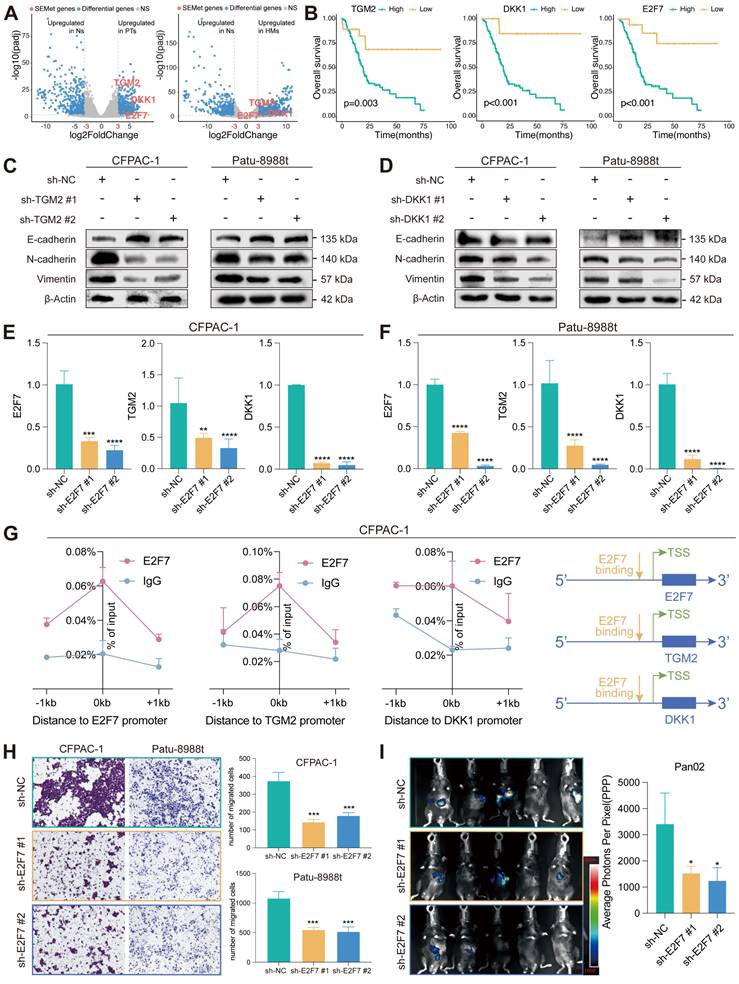
Differential analysis revealed that three SEMet genes (TGM2, DKK1 and E2F7) were significantly upregulated in HMs and PTs compared to Ns by criteria of logFC > 3 and FDR < 0.01 (Figure 7A). In the meantime, survival analysis demonstrated that the expression of TGM2, DKK1 and E2F7 were negatively correlated with the survival rate (Figure 7B). To further confirm the efficacy of SEMet genes in pancreatic cancer metastasis, we examined the protein expression of EMT markers after TGM2 or DKK1 knockdown in two metastasis lesion-originated cell lines, CFPAC-1 and Patu 8988t. The epithelial marker, E-cadherin, was overexpressed after the knockdown of TGM2 or DKK1. On the contrary, mesenchymal markers including N-cadherin and Vimentin were down-regulated (Figure 7C-D, Figure S9). Among these three SEMet genes, E2F7 was reported to function as a transcriptional regulator that promotes cell proliferation and metastasis in multiple cancers [31-33]. Therefore, we speculated that E2F7 binds to the promoter region of TGM2 and DKK1, and actively promoted them which was then demonstrated by RT-qPCR (Figure 7E-F) and E2F7 targeted ChIP-qPCR experiments (Figure 7G). Besides, in vitro and in vivo experiments were conducted to assess the impacts of E2F7 on the metastasis of PC. Transwell assays validated the pro-metastatic efficacy of E2F7 in CFAPC-1 and Patu 8988t cell lines (Figure 7H). Also, stable luciferase-labeled Pan02 PC cells, with or without E2F7 knockdown were established. Then, we injected them into the spleen vein of C57 mice. After 21 days, we observed that E2F7 knockdown remarkably decreased the metastatic capacity of PC cells into the liver compared to the control group, as measured by bioluminescence imaging (BLI) of HMs (Figure 7I). In collaboration, all results implied that E2F7 may contribute to PC metastasis by upregulating TGM2 and DKK1.
E2F7 targets TGM2 and DKK1 to promote the proliferation of PC. (A) Volcano plot illustrated that TGM2, DKK1 and E2F7 were the top 3 genes upregulated in PTs and HMs compared to Ns. (B) Survival analysis demonstrated that the higher expression of TGM2, DKK1 and E2F7 led to a dismal survival rate in the TCGA-PAAD dataset. The protein expression of EMT markers in CFPAC-1 and Patu 8988t after knockdown of TGM2 (C) and DKK1 (D). Expression of TGM2 and DKK1 in control and sh-E2F7 CFPAC-1 (E) and Patu 8988t (F). (G) Binding of E2F7 at the promoter regions of TGM2 and DKK1 in CFPAC-1 based on ChIP-qPCR. (H) Transwell assays validated the pro-metastatic efficacy of E2F7 in CFAPC-1 and Patu 8988t. (I) BLI demonstrated that E2F7 knockdown remarkably decreased the metastatic ability of PDAC cells into the liver compared to that of the control group.
Identification and validation of potential therapeutic compounds for metastatic PCs based on SEMet classifier
Now that the SEMetlow subgroup could effectively symbolize the “pro-metastasis” status in PC, comprehensive approaches were adopted to screen out candidate therapeutic compounds targeting SEMetlow subgroup patients. Based on the drug sensitivity data in CTRP and PRISM, the oncopredict R package was utilized to predict the drug response data of patients in the TCGA-PAAD cohort. Before processing further, we demonstrated that the result of predicted drug response data was reliable. PTBP3, PTB protein 3, was first identified as an essential RNA-binding protein in 1999. A recent study revealed that PTBP3 increases PC proliferation in response to hypoxic stress, contributing to gemcitabine resistance [34]. We thus categorized patients into two groups according to the median expression of BTBP3. The result revealed that patients in the PTBP3_high group showed significantly higher estimated AUC values of gemcitabine, which is consistent with the previous experiment data (Figure S10A).
Then two methods were conducted to identify the potential compounds via CTRP and PRISM databases (Supplementary Methods). As is shown in Figure 8A-B, we generated 6 CTRP-derived compounds (Neratinib, RITA, BRD8899, ML203, Alisertib and ML210) and 6 PRISM-derived compounds (EMD53998, Paclitaxel, Temocapril, Flumethasone, Butamben and Canertinib). Although these 12 compounds possessed a higher drug sensitivity in the SEMetlow subgroup, the above analyses could hardly support the conclusion that these compounds had an effective clinical application on metastatic PCs. Hence, we first search the literature in PubMed (https://www.ncbi.nlm.nih.gov/pubmed/) to discover the clinical and experimental proofs of these candidate compounds. Secondly, differences in mRNA expression of candidates' drug targets were measured by fold changes between HMs and PTs. The higher value of fold-change represented a considerable potential of candidates in treating metastatic PCs. Thirdly, the CMap analysis was performed to explore the sensitive compounds based on the differential genes between HMs and PTs (Table S17). Taking all the results into consideration, Flumethasone, which has robust evidence, may hold the most promising and novel potential in the treatment of metastatic PCs, although other routine candidates have already been in clinical trials (Figure 8C-D).
FLM served as an adjuvant sensitizer to increase the efficacy of gemcitabine in metastatic PC. The results of Spearman's correlation analysis and differential drug response of six CTRP-derived (A) and six PRISM-derived (B) candidate compounds. (C-D) Identification of the most reliable compound based on evidence from multiple sources. (E) Establishment of a PC MDO (scale bars, 100 µm). (F) The growth rate of tumors in response to the treatment of saline, gemcitabine (6mg/kg) , flumethasone (0.1mg/kg) and combined administration (n=5/group). (G) Representative images of subcutaneous PC tumors (scale bars, 5 mm) and Ki-67 staining (scale bars, 200 µm) of tumor tissues of mice treated with saline, gemcitabine (6mg/kg), flumethasone (0.1mg/kg) and combined administration (n=5/group).
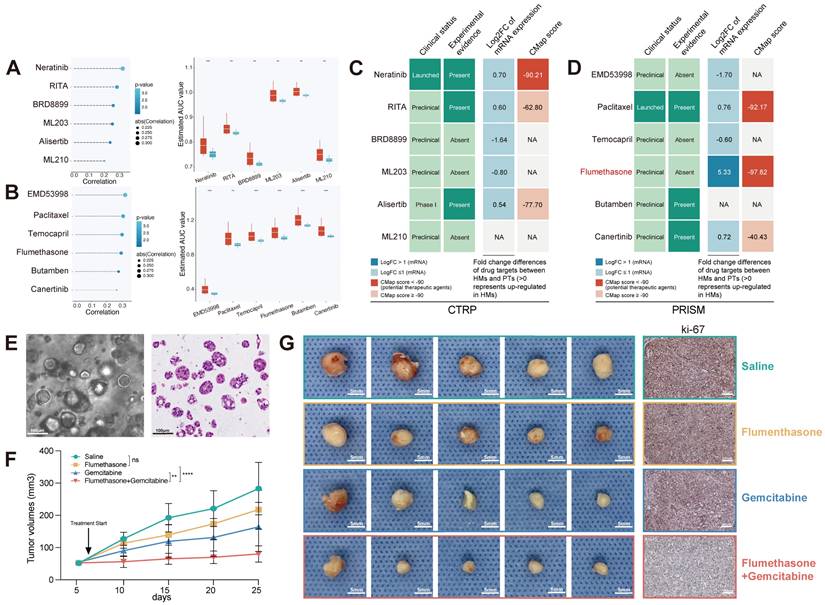
Flumethasone (FLM), a glucocorticoid with anti-inflammatory, vasoconstrictive and anti-hyperplasia properties, was merely confirmed to enhance the efficacy of chemotherapeutic management in lung cancer [35]. Since the chemoresistance of gemcitabine still leads to poor clinical outcomes in metastatic PCs [36], which was also demonstrated based on our estimated drug sensitivity (Figure S10B), we hypothesized that FLM might be served as an adjuvant sensitizer to increase the efficacy of gemcitabine in metastatic PCs. Currently, patient-derived organoids are considered one of the most suitable pre-clinical models to exhibit similarity to original tumors. Thus, we established a PC MDO model (Figure 8E) to further demonstrate the efficacy of Flumethasone combined with gemcitabine in metastatic PC treatment. Firstly, the subcutaneous xenograft model was generated using MDO in Balb/c nude mice, with 2*10^6 organoid crypts for each injected tumor. Mouse were divided into four groups and were treated with saline, gemcitabine (6mg/kg), flumethasone (0.1mg/kg) [35] or combined administration (n=5/group). After 14 days, it was found that combined administration of gemcitabine and flumethasone remarkably suppressed in vivo MDO tumor size and ki-67 expression (Figure 8F-G, Figure S11). These data suggested the potential clinical usage of flumethasone combined with routine gemcitabine chemotherapy in metastatic or progressive PC patients.
Discussion
Pancreatic cancer is one of the most devastating malignancies and is predicted to surpass prostate, breast, and colorectal cancers to become the second leading cause of cancer death by 2030 [37]. Identifying novel biomarkers and establishing stratified treatment is essential for improving the prognosis of PC, especially in metastatic disease. Over the past decades, a vast number of studies have demonstrated that dysregulated epigenetic control of cancer cells is strictly correlated with malignant transformation and metastasis [38, 39]. The super-enhancer concept is significantly critical in cancer research, and the acquisition of SEs around oncogene drivers is widely observed during the process of tumorigenesis in PC [40-42]. However, the biological meaning of SE in metastatic PC remains unclear, and it is useful to screen out critical SEs and associated genes that are required for the metastasis of PC.
In our study, a total of 425 HM-SE genes were identified based on the ChIP-Seq profiling among PTs and HMs. Strikingly, these genes were acquired for the formation of SE and PC progression. Based on the expression of these genes, we constructed a comprehensive guideline to establish the SEMet classifier. To sum up, 188 integrations of models were fitted to the training set via the 10-fold cross-validation. Then, based on 10 independent testing cohorts, the integration of Enet (α = 0.1) and survival-SVM was determined as the optimal model. After minimizing redundant noise by Enet, we finally obtained an 18-gene classifier termed SEMet classifier via survival-SVM. This novel computational framework to develop a consensus SEMet classifier could effectively reduce the overfitting encountered by ML algorithms.
Among the 18 SEMet genes identified for the SEMet classifier, 12 have been reported. CDA regulates the metabolism of epigenetic nucleosides revealing a therapeutic window in cancer, especially in pancreatic cancer, that has CDA overexpression and is resistant to treatment with other cytidine analogs [43, 44]. Based on bioinformatics analyses, DCBLD2 was confirmed to be a considerably oncogenic factor in PC with diagnostic, prognostic and therapeutic potential [45]. DKK1 could be served as an excellent target for cancer immunotherapy, and DKK1-CKAP4-PI3K/AKT signal pathway also plays a pivotal role in the proliferation of PC [46]. By targeting E2F7, miR-26a inhibited the malignant behaviors of PC cells [47]. In pancreatic adenosquamous carcinoma, EGFR-associated ligand-receptor pairs are activated in cell communications at a single-cell transcriptomics level [48]. FAM83A regulates Wnt/β-catenin signaling by directly binding to β-catenin and suppressing TCF4-mediated transcriptional activity, leading to pancreatic tumorigenesis [49]. FRZB, coding for modulators of the non-canonical WNT signaling pathway, could be sustained by adipocytes to maintain the PC progression [50]. KRT6A alters the tumor-associated macrophage subtypes and indicates an undesirable prognosis in PC [51]. MET is regarded as a pancreatic cancer-specific RTK, which is significantly related to prognosis in PC [52]. PLCB4 correlates with the p53 status and prognosis of PC patients [53]. Via inhibiting the PRR11, USP34 could promote the proliferation and migration in PANC-1 cells [54]. ROS-dependent apoptosis could be induced by kaempferol via TGM2-mediated Akt/mTOR signaling in PC [55].
The prognosis and predictive value of the SEMet classifier were validated in multicenter cohorts via survival analysis, univariate Cox analysis, ROC and calibration plot. Results revealed that the SEMet classifier was a stable factor of OS and RSF in PC patients. Otherwise, 33 established signatures of vital functional gene sets were screened out for comparison based on C-index. The SEMet classifier exhibited significantly excellent performance across almost all datasets. We noticed several signatures (e.g. Stratford JK, Chen Q, etc.) performed better than the SEMet classifier in certain cohorts, but they performed weakly in most other validation cohorts, revealing their poor universality and generalizability. Our classifier was reduced redundant and selected via combing two ML algorithms and obtained an advanced predictive effect.
The TIME induced by the interaction between PC cells and stromal cells is essential for PC metastasis [56]. Dense desmoplasia and extensive immunosuppression are two major factors that facilitate PC cell proliferation and evasion of immune surveillance. Hence, we investigated the immune landscape between SEMethigh and SEMetlow subtypes. According to two popular TIME signatures, we found that SEMetlow subtypes possessed a higher correlation with MDSCs and CAFs. MDSCs play an important role in the immunosuppression of PC, and PC could consistently induce the proliferation and mobility of MDSCs within the bone marrow to TIME [57]. In the consistent, the contribution of CAFs to the biology of PC has generally been held to be tumor-promoting [58]. Otherwise, several oncogenic biological processes were also enriched in SEMetlow subtypes, which suggested that the SEMetlow subtype was related to a malignant phenotype and therefore obtained a dismal prognosis in PC. Cancer immunotherapy implemented by ICBs has revolutionized the clinical management of solid tumors, including PC. Our results revealed that the expression of common ICBs (e.g, CD274 and PDCD1LG2) was upregulated in the SEMetlow subtype, implying that patients in the SEMetlow subtype may be more likely to benefit from ICBs therapy. The following TIDE algorithm and Submap analysis consistently confirmed the above-mentioned results. In general, our SEMet classifier is also a candidate biomarker for selecting PC patients who may be sensitive to immunotherapy.
Also, the genetic characteristics of the SEMet classifier were explored in our study. We found that the SEMetlow subtype tends to gain more TMB and higher mutation frequency of TP53, CDKN2A and KRAS. The mutations of all these three genes were widely studied and deemed as a contributor to the progression and metastasis of PC [59]. The exploration of differences in CNA indicated that the amplification of 8q24.21, 8q24.22, 8q24.12 and deletion of 18q21.2, 9p21.3, 17p12 were significantly enriched in the SEMetlow subtype. 8q24.21 is reported to involve numerous cancer vulnerability loci and physically interact with oncogene MYC [60, 61]. 18q21.2 harbors SMAD4, one of the most recurrently inactivated tumor suppressor genes in PC [62]. Most notably, the deletion of 9p21.3 could promote metastasis by evading adaptive immunity in PC [63]. All this evidence demonstrated that the genetic alteration between SEMethigh and SEMetlow subtypes, and the SEMetlow subtypes were significantly related to the proliferation and metastasis of PC.
For further exploring the underlying biological relationship between the SEMetlow subtypes and metastasis in PC, the difference in expression of marker genes related to biological functions and GSEA analysis was investigated. The results indicated that the SEMetlow subtype enriched in multiple metastasis-related pathways. Of which, metabolic reprogramming is an important component in the abnormal survival and growth of cancer cells [64], and the most common example is enhanced glycolysis. Glycolysis in PC cultures the vigorous growth of tumor cells by providing large amounts of substrates and promoting invasion and migration via the interaction of glycolytic enzymes and actin [65]. ECM is known as a vital part composed of desmoplasia in PC. Continuous ECM remodeling and overexpression of matrix components promoted the recruitment of bone marrow cells, which are lately polarized to support tumor proliferation and invasion [66]. Additionally, dysregulation of various tumor-related signaling pathways was found in the SEMetlow subtype. The predictive value of the SEMet classifier in metastatic PC was also validated in ICGC-AU-Array and GSE62452. Given the above, the SEMetlow subtype possessed metastatic features and therefore has been regarded as having “pro-metastasis” status in PC.
The prognostic value of 18 SEMet genes was also been investigated, and our SEMet classifier was demonstrated to the optimal model with outstanding prognostic performance. To be noted, we further observed that DKK1, TGM2 and E2F7 obtained significantly differential expression in PTs and HMs compared to Ns, and they have been reported to be related to the invasion and proliferation of PC [46, 47, 55]. These SEMet genes were retrieved from HM-SE genes, while cancer cells have been shown to acquire SEs at oncogenes through the involvement of transcription factors (TFs). Interestingly, we demonstrated that E2F7 served as a TF and may mediate the transcriptional reprogramming of DKK1 and TGM2, which in turn contributes to the metastasis of PC.
As one of the main purposes of disease stratification, exploring tailored treatment strategies for a distinct subgroup is of great significance to maximize the therapeutic effect. Except for being informative regarding prognosis, the SEMet classifier could also be utilized for precise oncology as a potential biomarker to guide the treatment of metastatic PC. While a few patients benefit from targeted strategies and immunotherapy, gemcitabine remains the first-line drug for PC treatment. However, gemcitabine resistance is common and compromises long-term survival. After a comprehensive selection, FLM was screened out as the optimal compound which could enhance the efficacy of gemcitabine in metastatic PC. Until now, few research studies have concentrated on the therapeutic effect of FLM on cancer, especially PC [35]. Our experiments demonstrated that FLM could significantly sensitize the metastatic PC to gemcitabine, highlighting the critical role of the SEMet classifier in drug screening.
SEMet classifier is superior to other methods in risk stratification and personalized treatment prediction as a classifier particularly developed for metastatic PC based on SE profiling. However, several limitations should be mentioned in our study. First, although the multi-center cohorts have been included in our study to construct and validate the SEMet classifier, the in-house data should be further added. Second, the deeper exploration of mechanisms in E2F7 targeting TGM2 and DKK1 was warranted. Finally, clinical validations of the SEMet classifier are necessary for promoting the translational value of our findings.
Conclusion
In conclusion, based on HM-SE genes generated from H3K27ac ChIP-Seq data, the current study developed a consensus classifier (SEMet classifier) via 188 ML algorithm integrations in multicenter cohorts. This classifier not only exhibited robust predictive and prognostic performance but also stratified patients into distinct statuses at the immune and genomic levels. Among 18 SEMet genes in the SEMet classifier, DDK1 and TGM2 act in PC as a pro-metastasis factor targeted by E2F7. More importantly, we demonstrated that the SEMetlow subgroup was significantly correlated with more metastatic characteristics and further confirmed that FLM might significantly sensitize the metastatic PC to gemcitabine, throwing light on integrating tailored prognosis prediction with personalized treatment.
Abbreviations
ATCC: American Type Culture Collection; AUC: area under the curve; CCLs: cancer cell lines; C-index: concordance index; CAN: copy number alteration; CPTAC: Clinical Proteomic Tumor Analysis Consortium; CRC: colorectal cancer; CTRP: Cancer Therapeutics Response Portal; DEGs: differentially expressed genes; Enet: elastic network; FLM: Flumethasone; FPKM: Fragments Per Kilobase of exon model per Million mapped fragments; GBM: generalized boosted regression modeling; GEO: Gene Expression Omnibus; GSVA: Gene set variation analysis; HCMDB: Human Cancer Metastasis Database; HMs: hepatic metastases; HNSCC: neck squamous cell carcinoma; ICBs: immune checkpoint blockages; ICGC: International Cancer Genome Consortium; IPS: immunophenoscore; k-NN: K-nearest neighbor; MDGs: methylation-driven genes; MDO: metastatic patient-derived organoids; ML: machine-learning; PC: pancreatic cancer; plsRcox: partial least squares regression for Cox; PTs: primary pancreatic tumors; RCC: renal cell carcinoma; ROC: receiver-operator characteristic; RSF: random survival forest; SE: super-enhancers; SEMet: super-enhancer-related metastatic; SuperPC: supervised principal components; survival-SVM: survival support vector machine; TCGA: The Cancer Genome Atlas; TFs: transcription factors; TIDE: The Tumor Immune Dysfunction and Exclusion; TMB: tumor mutation burden.
Acknowledgements
We would like to exert compelling appreciation to the Standardized Clinical Biobank (National Facility for Translational Medicine (Shanghai), Ruijin Hospital, Shanghai Jiao Tong University School of Medicine) for providing the surgical specimens. In addition, this project was also funded by the Translational Medicine Program of Major National Science and Technology Infrastructure (TMSK-2021-507, TMSK-2021-502), National Nature Science Foundation of China (Grant No. 81802358 and 81871906), Medical- Engineering Cross Foundation of Shanghai Jiao Tong University (Grant No. ZH2018ZDA01). Shanghai 2021 “Science and Technology Innovation Action Plan” International Science and Technology Cooperation Project (No. 214307119000). The graphical abstract was created with BioRender.com. Otherwise, we would like to express our great appreciation to Dr. Zaoqu Liu (Department of Interventional Radiology, The First Affiliated Hospital of Zhengzhou University, Zhengzhou, P.R. China.) for his selfless support throughout the course of this study.
Author contributions
XD, LJ and BS conceived and supervised the study. DC performed the bioinformatics analysis. DC and YC analyzed the data. YC and HT conducted the experiments. DC and YC wrote the draft. DC, YC, LZ, NY, YZ, YJ, SZ, YL, MS, SZ, WW, CW, CP, HC and XD revised and validated the manuscript. All authors read and approved the final manuscript.
Availability of data and materials
Data are available in a public, open-access repository. ChIP-Seq data generated in this study are deposited at the National Omics Data Encyclopedia (NODE) with the accession code OEP004076. Essential scripts for integrating multiple ML algorithms and model construction are available on the GitHub website (https://github.com/Dongjie-orange/SEMet).
Ethics approval and consent to participate
The study was approved by the Research Ethics Committee of Ruijin Hospital, School of Medicine, Shanghai Jiao Tong University (2021-161), and complied with Helsinki Declaration. All samples were collected with documented informed consent from the enrolled patients. Cell lines used in this study were authenticated by short tandem repeat analysis.
Supplementary Material
Supplementary methods, figures and tables.
Competing Interests
The authors have declared that no competing interest exists.
References
1. Siegel RL, Miller KD, Fuchs HE, Jemal A. Cancer statistics, 2022. CA Cancer J Clin. 2022;72:7-33
2. Yachida S, Iacobuzio-Donahue CA. The pathology and genetics of metastatic pancreatic cancer. Arch Pathol Lab Med. 2009;133:413-22
3. Neoptolemos JP, Kleeff J, Michl P, Costello E, Greenhalf W, Palmer DH. Therapeutic developments in pancreatic cancer: current and future perspectives. Nat Rev Gastroenterol Hepatol. 2018;15:333-48
4. Mizrahi JD, Surana R, Valle JW, Shroff RT. Pancreatic cancer. Lancet. 2020;395:2008-20
5. Bear AS, Vonderheide RH, O'Hara MH. Challenges and Opportunities for Pancreatic Cancer Immunotherapy. Cancer Cell. 2020;38:788-802
6. Golan T, Hammel P, Reni M, Van Cutsem E, Macarulla T, Hall MJ. et al. Maintenance Olaparib for Germline BRCA-Mutated Metastatic Pancreatic Cancer. N Engl J Med. 2019;381:317-27
7. Chapuy B, McKeown MR, Lin CY, Monti S, Roemer MG, Qi J. et al. Discovery and characterization of super-enhancer-associated dependencies in diffuse large B cell lymphoma. Cancer Cell. 2013;24:777-90
8. Pott S, Lieb JD. What are super-enhancers? Nat Genet. 2015;47:8-12
9. Creyghton MP, Cheng AW, Welstead GG, Kooistra T, Carey BW, Steine EJ. et al. Histone H3K27ac separates active from poised enhancers and predicts developmental state. Proc Natl Acad Sci U S A. 2010;107:21931-6
10. Hnisz D, Abraham BJ, Lee TI, Lau A, Saint-André V, Sigova AA. et al. Super-enhancers in the control of cell identity and disease. Cell. 2013;155:934-47
11. Whyte WA, Orlando DA, Hnisz D, Abraham BJ, Lin CY, Kagey MH. et al. Master transcription factors and mediator establish super-enhancers at key cell identity genes. Cell. 2013;153:307-19
12. Teng S, Li YE, Yang M, Qi R, Huang Y, Wang Q. et al. Tissue-specific transcription reprogramming promotes liver metastasis of colorectal cancer. Cell Res. 2020;30:34-49
13. Kim EJ, Liu P, Zhang S, Donahue K, Wang Y, Schehr JL. et al. BAF155 methylation drives metastasis by hijacking super-enhancers and subverting anti-tumor immunity. Nucleic Acids Res. 2021;49:12211-33
14. Dong J, Li J, Li Y, Ma Z, Yu Y, Wang CY. Transcriptional super-enhancers control cancer stemness and metastasis genes in squamous cell carcinoma. Nat Commun. 2021;12:3974
15. Zhang C, Chen L, Liu Y, Huang J, Liu A, Xu Y. et al. Downregulated METTL14 accumulates BPTF that reinforces super-enhancers and distal lung metastasis via glycolytic reprogramming in renal cell carcinoma. Theranostics. 2021;11:3676-93
16. Roe JS, Hwang CI, Somerville TDD, Milazzo JP, Lee EJ, Da Silva B. et al. Enhancer Reprogramming Promotes Pancreatic Cancer Metastasis. Cell. 2017;170:875-88.e20
17. Zhu X, Zhang T, Zhang Y, Chen H, Shen J, Jin X. et al. A super-enhancer controls TGF- β signaling in pancreatic cancer through downregulation of TGFBR2. Cell Signal. 2020;66:109470
18. Lovén J, Hoke HA, Lin CY, Lau A, Orlando DA, Vakoc CR. et al. Selective inhibition of tumor oncogenes by disruption of super-enhancers. Cell. 2013;153:320-34
19. Kobayashi Y, Kushihara Y, Saito N, Yamaguchi S, Kakimi K. A novel scoring method based on RNA-Seq immunograms describing individual cancer-immunity interactions. Cancer Sci. 2020;111:4031-40
20. Bagaev A, Kotlov N, Nomie K, Svekolkin V, Gafurov A, Isaeva O. et al. Conserved pan-cancer microenvironment subtypes predict response to immunotherapy. Cancer Cell. 2021;39:845-65.e7
21. Chen DS, Mellman I. Oncology meets immunology: the cancer-immunity cycle. Immunity. 2013;39:1-10
22. Xu L, Deng C, Pang B, Zhang X, Liu W, Liao G. et al. TIP: A Web Server for Resolving Tumor Immunophenotype Profiling. Cancer Res. 2018;78:6575-80
23. Ayers M, Lunceford J, Nebozhyn M, Murphy E, Loboda A, Kaufman DR. et al. IFN-γ-related mRNA profile predicts clinical response to PD-1 blockade. J Clin Invest. 2017;127:2930-40
24. Jiang P, Gu S, Pan D, Fu J, Sahu A, Hu X. et al. Signatures of T cell dysfunction and exclusion predict cancer immunotherapy response. Nat Med. 2018;24:1550-8
25. Hoshida Y, Brunet JP, Tamayo P, Golub TR, Mesirov JP. Subclass mapping: identifying common subtypes in independent disease data sets. PLoS One. 2007;2:e1195
26. Alexandrov LB, Nik-Zainal S, Wedge DC, Aparicio SA, Behjati S, Biankin AV. et al. Signatures of mutational processes in human cancer. Nature. 2013;500:415-21
27. Liu Z, Liu L, Lu T, Wang L, Li Z, Jiao D. et al. Hypoxia Molecular Characterization in Hepatocellular Carcinoma Identifies One Risk Signature and Two Nomograms for Clinical Management. J Oncol. 2021;2021:6664386
28. Rosario SR, Long MD, Affronti HC, Rowsam AM, Eng KH, Smiraglia DJ. Pan-cancer analysis of transcriptional metabolic dysregulation using The Cancer Genome Atlas. Nat Commun. 2018;9:5330
29. Houg DS, Bijlsma MF. The hepatic pre-metastatic niche in pancreatic ductal adenocarcinoma. Mol Cancer. 2018;17:95
30. Sanchez-Vega F, Mina M, Armenia J, Chatila WK, Luna A, La KC. et al. Oncogenic Signaling Pathways in The Cancer Genome Atlas. Cell. 2018;173:321-37.e10
31. Liang R, Xiao G, Wang M, Li X, Li Y, Hui Z. et al. SNHG6 functions as a competing endogenous RNA to regulate E2F7 expression by sponging miR-26a-5p in lung adenocarcinoma. Biomed Pharmacother. 2018;107:1434-46
32. Ma YS, Lv ZW, Yu F, Chang ZY, Cong XL, Zhong XM. et al. MicroRNA-302a/d inhibits the self-renewal capability and cell cycle entry of liver cancer stem cells by targeting the E2F7/AKT axis. J Exp Clin Cancer Res. 2018;37:252
33. Saleh AD, Cheng H, Martin SE, Si H, Ormanoglu P, Carlson S. et al. Integrated Genomic and Functional microRNA Analysis Identifies miR-30-5p as a Tumor Suppressor and Potential Therapeutic Nanomedicine in Head and Neck Cancer. Clin Cancer Res. 2019;25:2860-73
34. Ma J, Weng L, Jia Y, Liu B, Wu S, Xue L. et al. PTBP3 promotes malignancy and hypoxia-induced chemoresistance in pancreatic cancer cells by ATG12 up-regulation. J Cell Mol Med. 2020;24:2917-30
35. Zhou Y, Zhou Y, Wang K, Li T, Yang M, Wang R. et al. Flumethasone enhances the efficacy of chemotherapeutic drugs in lung cancer by inhibiting Nrf2 signaling pathway. Cancer Lett. 2020;474:94-105
36. Zeng S, Pöttler M, Lan B, Grützmann R, Pilarsky C, Yang H. Chemoresistance in Pancreatic Cancer. Int J Mol Sci. 2019 20
37. Rahib L, Smith BD, Aizenberg R, Rosenzweig AB, Fleshman JM, Matrisian LM. Projecting cancer incidence and deaths to 2030: the unexpected burden of thyroid, liver, and pancreas cancers in the United States. Cancer Res. 2014;74:2913-21
38. Klutstein M, Nejman D, Greenfield R, Cedar H. DNA Methylation in Cancer and Aging. Cancer Res. 2016;76:3446-50
39. Zhao Z, Shilatifard A. Epigenetic modifications of histones in cancer. Genome Biol. 2019;20:245
40. Andricovich J, Perkail S, Kai Y, Casasanta N, Peng W, Tzatsos A. Loss of KDM6A Activates Super-Enhancers to Induce Gender-Specific Squamous-like Pancreatic Cancer and Confers Sensitivity to BET Inhibitors. Cancer Cell. 2018;33:512-26.e8
41. Hamdan FH, Johnsen SA. DeltaNp63-dependent super enhancers define molecular identity in pancreatic cancer by an interconnected transcription factor network. Proc Natl Acad Sci U S A. 2018;115:E12343-e52
42. Huang CS, You X, Dai C, Xu QC, Li F, Wang L. et al. Targeting Super-Enhancers via Nanoparticle-Facilitated BRD4 and CDK7 Inhibitors Synergistically Suppresses Pancreatic Ductal Adenocarcinoma. Adv Sci (Weinh). 2020;7:1902926
43. Zauri M, Berridge G, Thézénas ML, Pugh KM, Goldin R, Kessler BM. et al. CDA directs metabolism of epigenetic nucleosides revealing a therapeutic window in cancer. Nature. 2015;524:114-8
44. Frese KK, Neesse A, Cook N, Bapiro TE, Lolkema MP, Jodrell DI. et al. nab-Paclitaxel potentiates gemcitabine activity by reducing cytidine deaminase levels in a mouse model of pancreatic cancer. Cancer Discov. 2012;2:260-9
45. Feng Z, Li K, Wu Y, Peng C. Transcriptomic Profiling Identifies DCBLD2 as a Diagnostic and Prognostic Biomarker in Pancreatic Ductal Adenocarcinoma. Front Mol Biosci. 2021;8:659168
46. Igbinigie E, Guo F, Jiang SW, Kelley C, Li J. Dkk1 involvement and its potential as a biomarker in pancreatic ductal adenocarcinoma. Clin Chim Acta. 2019;488:226-34
47. Wang L, Li M, Chen F. microRNA-26a represses pancreatic cancer cell malignant behaviors by targeting E2F7. Discov Oncol. 2021;12:55
48. Zhao X, Li H, Lyu S, Zhai J, Ji Z, Zhang Z. et al. Single-cell transcriptomics reveals heterogeneous progression and EGFR activation in pancreatic adenosquamous carcinoma. Int J Biol Sci. 2021;17:2590-605
49. Zhou C, Zhu X, Liu N, Dong X, Zhang X, Huang H. et al. B-lymphoid tyrosine kinase-mediated FAM83A phosphorylation elevates pancreatic tumorigenesis through interacting with β-catenin. Signal Transduct Target Ther. 2023;8:66
50. Carbone C, Piro G, Gaianigo N, Ligorio F, Santoro R, Merz V. et al. Adipocytes sustain pancreatic cancer progression through a non-canonical WNT paracrine network inducing ROR2 nuclear shuttling. Int J Obes (Lond). 2018;42:334-43
51. Zhang J, Sun H, Liu S, Huang W, Gu J, Zhao Z. et al. Alteration of tumor-associated macrophage subtypes mediated by KRT6A in pancreatic ductal adenocarcinoma. Aging (Albany NY). 2020;12:23217-32
52. Li E, Huang X, Zhang G, Liang T. Combinational blockade of MET and PD-L1 improves pancreatic cancer immunotherapeutic efficacy. J Exp Clin Cancer Res. 2021;40:279
53. Butera A, Roy M, Zampieri C, Mammarella E, Panatta E, Melino G. et al. p53-driven lipidome influences non-cell-autonomous lysophospholipids in pancreatic cancer. Biol Direct. 2022;17:6
54. Lin C, Xia J, Gu Z, Meng Y, Gao D, Wei S. Downregulation of USP34 Inhibits the Growth and Migration of Pancreatic Cancer Cells via Inhibiting the PRR11. Onco Targets Ther. 2020;13:1471-80
55. Wang F, Wang L, Qu C, Chen L, Geng Y, Cheng C. et al. Kaempferol induces ROS-dependent apoptosis in pancreatic cancer cells via TGM2-mediated Akt/mTOR signaling. BMC Cancer. 2021;21:396
56. Chronopoulos A, Robinson B, Sarper M, Cortes E, Auernheimer V, Lachowski D. et al. ATRA mechanically reprograms pancreatic stellate cells to suppress matrix remodelling and inhibit cancer cell invasion. Nat Commun. 2016;7:12630
57. Porembka MR, Mitchem JB, Belt BA, Hsieh CS, Lee HM, Herndon J. et al. Pancreatic adenocarcinoma induces bone marrow mobilization of myeloid-derived suppressor cells which promote primary tumor growth. Cancer Immunol Immunother. 2012;61:1373-85
58. Hwang RF, Moore T, Arumugam T, Ramachandran V, Amos KD, Rivera A. et al. Cancer-associated stromal fibroblasts promote pancreatic tumor progression. Cancer Res. 2008;68:918-26
59. Hu C, Hart SN, Polley EC, Gnanaolivu R, Shimelis H, Lee KY. et al. Association Between Inherited Germline Mutations in Cancer Predisposition Genes and Risk of Pancreatic Cancer. Jama. 2018;319:2401-9
60. Grisanzio C, Freedman ML. Chromosome 8q24-Associated Cancers and MYC. Genes Cancer. 2010;1:555-9
61. Ahmadiyeh N, Pomerantz MM, Grisanzio C, Herman P, Jia L, Almendro V. et al. 8q24 prostate, breast, and colon cancer risk loci show tissue-specific long-range interaction with MYC. Proc Natl Acad Sci U S A. 2010;107:9742-6
62. Harada T, Baril P, Gangeswaran R, Kelly G, Chelala C, Bhakta V. et al. Identification of genetic alterations in pancreatic cancer by the combined use of tissue microdissection and array-based comparative genomic hybridisation. Br J Cancer. 2007;96:373-82
63. Barriga FM, Tsanov KM, Ho YJ, Sohail N, Zhang A, Baslan T. et al. MACHETE identifies interferon-encompassing chromosome 9p21.3 deletions as mediators of immune evasion and metastasis. Nat Cancer. 2022;3:1367-85
64. DeBerardinis RJ, Lum JJ, Hatzivassiliou G, Thompson CB. The biology of cancer: metabolic reprogramming fuels cell growth and proliferation. Cell Metab. 2008;7:11-20
65. McDonald OG, Li X, Saunders T, Tryggvadottir R, Mentch SJ, Warmoes MO. et al. Epigenomic reprogramming during pancreatic cancer progression links anabolic glucose metabolism to distant metastasis. Nat Genet. 2017;49:367-76
66. Gabrilovich DI, Ostrand-Rosenberg S, Bronte V. Coordinated regulation of myeloid cells by tumours. Nat Rev Immunol. 2012;12:253-68
Author contact
![]() Corresponding authors: Baiyong Shen, Department of General Surgery, Pancreatic Disease Center, Ruijin Hospital, Shanghai Jiao Tong University School of Medicine, Shanghai, P.R. China. shenbyedu.cn. Lingxi Jiang, Department of General Surgery, Pancreatic Disease Center, Ruijin Hospital, Shanghai Jiao Tong University School of Medicine, Shanghai, P.R. China. jlx12120com.cn. Xiaxing Deng, Department of General Surgery, Pancreatic Disease Center, Ruijin Hospital, Shanghai Jiao Tong University School of Medicine, Shanghai, P.R. China. dxx10716com.cn.
Corresponding authors: Baiyong Shen, Department of General Surgery, Pancreatic Disease Center, Ruijin Hospital, Shanghai Jiao Tong University School of Medicine, Shanghai, P.R. China. shenbyedu.cn. Lingxi Jiang, Department of General Surgery, Pancreatic Disease Center, Ruijin Hospital, Shanghai Jiao Tong University School of Medicine, Shanghai, P.R. China. jlx12120com.cn. Xiaxing Deng, Department of General Surgery, Pancreatic Disease Center, Ruijin Hospital, Shanghai Jiao Tong University School of Medicine, Shanghai, P.R. China. dxx10716com.cn.