Impact Factor
- Issue 14; 2026
- Issue 13; 2026
- Issue 12; 2026
- Issue 11; 2026
- Issue 10; 2026
- Volume 16; 2026
- Advance Articles
- Past Issues
- Cover Images
- Cover Suggestion
- Index & Coverage
- Special Issues
Introduction
Materials and methods
Results
Discussion
Conclusions
Abbreviations
Supplementary Material
Acknowledgements
References
International Journal of Biological Sciences
International Journal of Medical Sciences
 Global reach, higher impact

Theranostics 2023; 13(10):3310-3329. doi:10.7150/thno.82590 This issue Cite
Research Paper
SPI1-mediated MIR222HG transcription promotes proneural-to-mesenchymal transition of glioma stem cells and immunosuppressive polarization of macrophages
Yang Fan1,2#, Zijie Gao1,2#, Jianye Xu1,2,3#, Huizhi Wang1,2, Qindong Guo1,2, Boyan Li1,2, Ming Li2,4, Hao Xu2,5, Yanhua Qi1,2, Shulin Zhao1,2, Wei Qiu1,2, Ziwen Pan1,2, Qingtong Wang1,2, Hao Xue1,2, Rongrong Zhao1,2, Xing Guo1,2 ![]() , Gang Li1,2
, Gang Li1,2 ![]()
1. Department of Neurosurgery, Qilu Hospital, Cheeloo College of Medicine and Institute of Brain and Brain-Inspired Science, Shandong University, Jinan 250012, Shandong, China.
2. Shandong Key Laboratory of Brain Function Remodeling, Jinan 250012, Shandong, China.
3. Tianjin Neurological Institute, Key Laboratory of Post-Neuroinjury Neuro-repair and Regeneration in Central Nervous System, Ministry of Education and Tianjin City, Tianjin Medical University General Hospital, Tianjin 300052, China.
4. Department of Neurosurgery, The Affiliated Taian City Central Hospital of Qingdao University, Taian 271000, Shandong, China.
5. Department of Neurosurgery, The Affiliated Yantai Yuhuangding Hospital of Qingdao University, Yantai 264000, Shandong, China.
#These authors contributed equally: Yang Fan, Zijie Gao, Jianye Xu
Received 2023-1-12; Accepted 2023-5-7; Published 2023-5-27
Abstract

Background: Glioma stem cells (GSCs) are a key factor in glioblastoma (GBM) development and treatment resistance. GSCs can be divided into the mesenchymal (MES) and proneural (PN) subtypes, and these two subtypes of GSCs can undergo interconversion under certain conditions. MES GSCs have higher malignancy and radioresistance and are closely associated with an immunosuppressive microenvironment. Long noncoding RNAs (lncRNAs) play a broad role in GBM, while the role of GSCs subtype remains unknown.
Methods: We performed RNA sequencing to explore the lncRNA expression profile in MES- and PN-subtype GBM tissues. The biological function of a host gene—MIR222HG—in GBM development was confirmed in vitro and in vivo. Specifically, RNA sequencing, RNA pulldown, mass spectrometry, RIP, ChIP, luciferase reporter assays and Co-IP were performed.
Results: MIR222HG, the expression of which can be induced by SPI1, has high levels in MES GBM tissues. Functionally, we demonstrated that MIR222HG promotes the MES transition and radioresistance in GSCs in vivo and in vitro. Mechanistically, MIR222HG can bind to the YWHAE/HDAC5 complex to promote the MES transition of GSCs through H4 deacetylation. Moreover, cotranscribed miR221 and miR222 can be delivered to macrophages via exosomes to target SOCS3, causing immunosuppressive polarization. Finally, PLX-4720 sensitivity is associated with SPI1 expression and acts on MES GSCs to enhance radiosensitivity.
Conclusions: This study demonstrates that targeting SPI1 to block transcription of the MIR222HG cluster helps to reduce radioresistance and combat the immunosuppressive microenvironment in GBM. PLX-4720 is a potential GBM drug and radiosensitizer.
Keywords: Glioma stem cell, HDAC, Mesenchymal transition, Radiation, Immunosuppressive
Introduction
Glioblastoma (GBM) is the most common intracranial primary malignant tumor, with high therapeutic resistance and a poor prognosis [1-3]. The high degrees of intratumoral cellular heterogeneity and plasticity are the main reasons for the poor prognosis of GBM patients [4]. Currently, according to the characteristics of GBM gene expression profiles in The Cancer Genome Atlas (TCGA), GBM is divided into three tumor-intrinsic transcriptional subtypes: classical (CL), proneural (PN) and mesenchymal (MES) [5]. Among them, MES GBM has higher radioresistance and poorer prognosis and is associated with recurrence after treatment [6, 7]. GSCs are stem cell-like tumor-initiating cells with self-renewal ability and multilineage differentiation potential [8, 9]. At the extremes of the axis of genetic variation in GBM are stem-like cells that express canonical markers of MES GSCs (mGSCs) and those that express canonical markers of PN GSCs (pGSCs) [10]. mGSCs and pGSCs are stable in vitro, representing the heterogeneous and plastic characteristics of GBM. mGSCs have a higher proliferative capacity, greater tumorigenicity, and higher resistance to radiotherapy and harsh microenvironments than pGSCs [7, 11, 12]. Proneural-to-mesenchymal transition (PMT) in GSCs is a main cause of radioresistance and tumor recurrence during the malignant progression of GBM [13]. Our previous study indicated that macrophage-derived small extracellular vesicles (sEVs) are key regulators of PMT in GSCs and that upregulation of cell surface GRP78 in mGSCs plays a critical role in maintaining the MES subtype [14, 15]. Although numerous studies have explored the evolution of PMT, the molecular mechanisms underlying PMT in GSCs remain unknown.
The tumor microenvironment (TME) is the foundation for tumor growth and is composed of immune cells, stromal cells, the extracellular matrix (ECM), secreted molecules and other components [16]. The TME is closely related to the molecular phenotypic heterogeneity of GBM and affects the regulation of the mechanism underlying the molecular phenotypic plasticity of GBM [17, 18]. In the TME of GBM, tumor-associated macrophages (TAMs) are the most abundant cell population, accounting for 50% of the total cells in the GBM TME, and play an important role in the interactive ecology of the immunosuppressive TME and malignant progression of GBM [19]. Exosomes are extracellular secretory vesicles with a diameter of 50-100 nm that can encapsulate proteins, RNAs and other substances for transfer between cells [20]. Tumor cells and macrophages can interact with each other via exosome delivery [21, 22]. Our previous study demonstrated that sEVs, including exosomes, can be transferred from immunosuppressive macrophages into GSCs to induce PMT; however, whether mGSCs can also act in reverse to induce macrophage immunosuppression remains to be explored [14].
Noncoding RNAs, including microRNAs (miRNAs) and long noncoding RNAs (lncRNAs), are a class of RNAs that cannot encode proteins and play important roles in tumors [23]. An increasing number of studies have shown that lncRNA expression profiles can reflect the intrinsic PN and MES subtype characteristics of GSCs, but whether lncRNAs are involved in PMT in GSCs has not been explored [24, 25].
In this study, we identified the highly expression of MIR222HG in the MES subtype by comparing the differentially expressed lncRNAs between the PN and MES subtypes of GBMs and GSCs. MIR222HG, a lncRNA produced from a miRNA host gene (Lnc-MIRHG), can generate multiple different lncRNA transcripts as well as miRNA-221/222 (miR221/222) through cotranscriptional splicing. Among these products, the most abundant lncRNA transcript, MIR222HG-201, recruits the histone deacetylase 5 (HDAC5)/YWHAE complex by anchoring histone H4 in the nucleus of GSCs, mediates the deacetylation of H4K16, leads to PMT in GSCs, and then enhances radioresistance. The cotranscribed miR221 and miR222 can be transferred from GSCs to macrophages via exosomes, mediating a decrease in SOCS3 expression and leading to immunosuppressive polarization of macrophages. As a transcription factor for the MIR222HG gene, SPI1 mediates the cotranscription of lncRNAs and miRNAs, resulting in PMT in GSCs and immunosuppressive polarization of macrophages. Finally, we used PLX-4720 to screen for GBM cell sensitivity associated with SPI1 expression. These experiments confirmed that mGSCs are sensitive to PLX-4720 and that its combined use with radiotherapy can significantly enhance the therapeutic efficacy.
Materials and methods
Patient specimens and data acquisition
Twelve human GBM tissues were obtained for RNA sequencing (RNA-seq) from patients admitted to Qilu Hospital between November 2017 and October 2019. All participants provided written informed consent, and the study was approved by the Ethics Committee on Scientific Research of Shandong University Qilu Hospital (approval number: KYLL-2018-324).
The RNA-seq transcriptome data for the GBM dataset in The Cancer Genome Atlas (TCGA) were obtained from the TCGA database (http://cancergenome.nih.gov/). The Chinese Glioma Genome Atlas (CGGA) RNA-seq dataset was obtained from the CGGA database (http://www.cgga.org.cn/). The European Nucleotide Archive (ENA) RNA-seq dataset was obtained from the ENA database (PRJEB27943; http://www.ebi.ac.uk/ena). The RNA-seq data of our local samples have been deposited in the Gene Expression Omnibus (GEO) under accession number GSE211554. The RNA-seq data of GSC267 have been deposited in GEO under accession number GSE213310.
Cell lines and culture
The patient-derived GSC cell lines (GSC11, GSC8-11, GSC20, GSC28, and GSC267) and neural progenitor cells (NPCs) were a kind gift from Dr. Frederick F. Lang and Dr. Krishna P.L. Bhat (M.D. Anderson Cancer Center, University of Texas, Houston, TX). The subtypes of GSCs in this study were identified according to the genetic signatures of Philips and Verhaak, which are widely accepted and applied [7, 11]. GSCs and NPCs were digested into single cells with Accutase solution (Sigma‒Aldrich, USA) and were then cultured in DMEM/F12 (Gibco, USA) supplemented with B-27 (Gibco, USA), 20 ng/mL recombinant human (rh) epidermal growth factor (R&D Systems, USA) and 20 ng/mL rh basic fibroblast growth factor (R&D Systems, USA). Cells were cultured at 37 °C in a humidified chamber with 5% carbon dioxide and 5% oxygen.
Antisense oligonucleotide (ASO), small interfering RNA (siRNA), miRNA mimic (miRNAm) and miRNA inhibitor (miRNAi) transfection and lentiviral transduction
The ASO, siRNA, miRNAm, miRNAi and corresponding negative controls were purchased from GenePharma (China). The knockdown and overexpression lentiviruses and corresponding negative control lentiviruses were synthesized by GeneChem (Shanghai, China). All sequence information is provided in Table S8. Cells were transfected using a Lipofectamine 3000 kit (Invitrogen, Carlsbad, CA, USA) according to the manufacturer's instructions.
Ionizing radiation (IR) treatment
In vitro, GSCs were treated with IR (6 Gy) for subsequent experiments. In vivo, tumor-bearing mice were administered 4 doses of IR (2.5 Gy each) within 8 to 12 days after GSC implantation.
Real-time quantitative PCR (qRT‒PCR)
Total RNA was extracted with TRIzol (Invitrogen, USA) following the manufacturer's protocol. We performed reverse transcription using a High-Capacity-cDNA Reverse Transcription Kit (Toyobo, China) according to the manufacturer's protocol. The PCR primer pair sequences are listed in the supplementary materials and methods, and an Mx-3000P Quantitative PCR System (Applied Biosystems, USA) was used for qRT‒PCR. The detailed sequences of the primers are listed in Table S7.
Fluorescence in situ hybridization (FISH)
The FISH assay was performed as previously described [26]. The RNA FISH probe was designed and synthesized by GenePharma (Shanghai, China). The probe sequences are listed in Table S7.
Nuclear-cytoplasmic fractionation
A PARIS™ kit (Thermo Fisher Scientific, USA) was used according to the manufacturer's instructions to perform nuclear-cytoplasmic fractionation. RNA was extracted from the nuclear and cytoplasmic fractions of cells (1 × 10⁷) and was then analyzed by qRT‒PCR.
Neurosphere formation assay
GSCs were dispersed with Accutase into single cells and seeded into 6-well plates at a density of 1000 cells per well. After 2 weeks of culture in GSC culture medium, cells were observed using a Leica microscope, and the relative diameters of spheres were recorded for analysis.
Extreme limiting dilution assay (ELDA)
GSCs were seeded into 96-well plates in a concentration gradient of 0, 2, 4, 8, 16, 32 and 64 cells. Ten replicates per well were established. The numbers of wells with tumor sphere formation were recorded after one week, and the data were analyzed with ELDA software (http://bioinf.wehi.edu.au/software/elda/).
Western blot analysis
Precipitated cells were washed with cold PBS and lysed with RIPA buffer containing 1% protease and phosphate inhibitor cocktail (P8340; Sigma‒Aldrich, USA). After sodium dodecyl sulfate-polyacrylamide gel electrophoresis (SDS‒PAGE), proteins were transferred to polyvinylidene fluoride (PVDF) membranes. Then, the membranes were cut into strips and incubated with primary antibodies at 4 °C overnight and were then incubated with secondary antibodies. We examined protein expression using an Odyssey fluorescence scanner (ChemiDoc XRSþ, Bio-Rad). All antibody information is provided in Table S9.
Apoptosis assay
We used a FITC-Annexin V apoptosis detection kit (556, 547; BD Biosciences, USA) according to the manufacturer's protocol to determine the proportion of apoptotic cells. The data were generated with a BD Accuri C6 flow cytometer and further processed with FlowJo V10.
Cell cycle analysis
After treatment, GSC neurospheres were collected by centrifugation and dissociated with Accutase solution. Then, we resuspended and stained the GSCs with propidium iodide (PI) staining solution (BD Pharmingen). Finally, we conducted cell cycle analysis using a BD Accuri C6 flow cytometer (BD Biosciences).
Alkaline comet assay
We performed an alkaline comet assay (4250-050-K; R&D Systems, USA) following the manufacturer's instructions to evaluate DNA damage levels. In brief, GSCs subjected to different treatments were collected and harvested in PBS at a density of 1 × 10⁵ cells/mL. We then mixed the GSCs with low-melting-point (LM) agarose at a ratio of 1:10 (V/V) and immediately added 50 µL of the mixture onto a comet slide. The cells were further lysed with alkaline lysis buffer for 12 h at 4 °C, and the slides were soaked in alkaline electrophoresis solution for 20 min before electrophoresis at 25 V for 30 min. Finally, we stained the slides with SYBR Green DNA Dye and acquired images with a fluorescence microscope.
Terminal deoxynucleotidyl transferase dUTP nick end labeling (TUNEL) assay
The TUNEL assay was conducted using a TUNEL apoptosis assay kit (C1090; Beyotime, China) according to the manufacturer's instructions. DAPI solution was required for nuclear staining (C1006; Beyotime, China). The proportion of apoptotic cells (red fluorescence) was determined and images were acquired using a Lecia microscope.
Biotin-labeled RNA pulldown assay and mass spectrometry
Lnc-MIR222HG-201 and its antisense sequence were synthesized by RiboBio (GenePharma, Shanghai, China). The assays were performed as previously described [26]. Finally, the interacting proteins extracted from GSC267 cells were identified by western blotting and mass spectrometry.
Coimmunoprecipitation (Co-IP)
We conducted a Co-IP assay using a Pierce Classic Magnetic IP/Co-IP Kit (Thermo Fisher, USA) according to the manufacturer's protocol. In brief, we incubated antibodies with protein A/G magnetic beads. Then, we obtained GSC267 lysates and mixed them with antibody-coupled beads overnight at 4 °C. After washing and denaturation, proteins interacting with the beads were collected for western blotting. All antibody information is provided in Table S9.
RNA immunoprecipitation (RIP)
RIP assays were performed according to the instructions of an EZ-Magna RIP RNA-binding Protein Immunoprecipitation Kit (Merck Millipore). The extracted RNA was analyzed by qRT-PCR. For the YWHAE RIP assay, wild-type (WT) cDNA and mutant (mut) cDNA were subcloned into the pcDNA3.1 vector (BioSune, China). All antibody information is provided in Table S9.
Exosome isolation and identification
Exosomes were isolated from GSC culture supernatant using several centrifugation and ultracentrifugation steps as previously described and were stored at -80 °C [27, 28]. Transmission electron microscopy (TEM) was used to photograph exosome morphology, and a ZetaView system (Particle Metrix, Germany) was used to measure the exosome particle size and concentration as previously described [28, 29]. Western blot analysis was used to detect markers to distinguish between exosomes and cells. Purified exosomes were labeled with the green fluorescent linker PKH67 (Sigma‒Aldrich, USA) and used for uptake experiments as previously described [28, 29].
Flow cytometry
Anti-CD163-PE and anti-CD11b-APC antibodies were used for staining to detect CD11b+CD163+ macrophages. Isotype controls were run in parallel. Flow cytometry was performed by using a BD Accuri C6 flow cytometer (BD Biosciences). Antibody information is provided in Table S9.
Luciferase reporter assay
The reporter plasmids PmirGLO-SOCS3-3'UTR-WT and PmirGLO-SOCS3-3'UTR-mut were cotransfected with the miR221 mimic or miR222 mimic into THP1 differentiated macrophages. The reporter plasmids pGL3-MIR222HG-WT and pGL3-MIR222HG-mut were cotransfected with siSPI1#1 or siSPI1#2 into GSC267 cells. Two days later, a dual luciferase reporter assay kit (Promega, USA) was used to measure reporter activity according to the manufacturer's instructions. All reporter plasmids were synthesized by BioSune (Shanghai, China).
Chromatin immunoprecipitation (ChIP)
ChIP was performed with an EZ-Magna ChIP A/G Chromatin Immunoprecipitation Kit (17-10086, Millipore, USA). Immunoprecipitated DNA fragments were quantified with qRT‒PCR. The primers and antibodies used are listed in Tables S7 and S9.
Cell counting kit-8 (CCK-8) assay
We purchased PLX-4720 from MedChemExpress (MCE; https://www.medchemexpress.cn/). PLX-4720 dissolved in dimethyl sulfoxide (DMSO) was stored at -20 °C and used within one month. GSC20 and GSC267 cells were seeded into 96-well plates at a density of 5000 cells per well, treated with different concentrations of PLX-4720, and cultured at 37 °C for 48 h. Then, we added 10 μL of CCK-8 solution (Beyotime, China) to each well, and the absorbance, reflecting cell proliferation, was measured 1 h later.
In vivo experiments
We generated GSC267 and GSC8-11 cells labeled with luciferase (GSC267-luciferase, GSC8-11-luciferase) via lentiviral transduction. All animal experiments were performed with approval according to the guidelines of the Institutional Animal Care and Use Committee of Qilu Hospital of Shandong University. Four-week-old male BALB/c nude mice (SLAC Laboratory Animal Center; Shanghai, China) were bred under specific pathogen-free conditions at 24 °C on a 12-h day-night cycle in preparation for the establishment of an intracranial GSC in situ growth model. We randomly divided animals housed under similar conditions into the control and experimental groups. A total of 1 × 10⁶ GSC267-luciferase or GSC8-11-luciferase cells were injected intracranially into each mouse. When irradiation was necessary in animal studies, tumor-bearing mice were administered 4 doses of IR (2.5 Gy each) within 8 to 12 days after GSC implantation. Mice in the dosing group were injected daily with PBS or an equal volume of PLX-4720 (15 mg/kg) via the tail vein beginning 7 days after GSC implantation. Tumor progression in vivo was measured by bioluminescence imaging after intraperitoneal injection of 150 mg/kg luciferin; signals were detected and images were acquired with an IVIS Lumina series III ex vivo imaging system (PerkinElmer, USA).
Hematoxylin and eosin (HE) staining and immunohistochemical (IHC) staining
HE and IHC staining were performed as previously described [29]. All information about the primary antibodies used for IHC staining is provided in Table S9.
Gene set enrichment analysis (GSEA)
The Phillips/Verhaak glioblastoma mesenchymal and Phillips/Verhaak glioblastoma proneural gene signatures were obtained from the Molecular Signatures Database (MSigDB; http://www.gsea-msigdb.org/gsea/login.jsp). GSEA_4.1.0 software was used for GSEA.
Single-cell RNA-seq analysis
We downloaded single-cell RNA-seq data from the GEO (https://www.ncbi.nlm.nih.gov/geo/, GSE138794). We further performed t-distributed stochastic neighbor embedding (tSNE) to identify different cell clusters using the R package “Seurat 4.1.0” and evaluated the enrichment scores of the Verhaak_GBM_MES signature based on the R package “irGSEA”.
Association of SPI1 expression with drug sensitivity
The drug sensitivity data and RNA transcriptome data for GBM cell lines were downloaded from the Genomics of Drug Sensitivity in Cancer (GDSC) database (www.cancerRxgene.org) and the Cancer Cell Line Encyclopedia (CCLE; https://portals.broadinstitute.org/ccle/), respectively. Then, we performed Spearman correlation analysis to identify the drugs that were significantly associated with SPI1 expression.
Statistical analysis
We used GraphPad Prism 8.0 software and R 4.0.1 to perform all statistical analyses. Student's t test and one-way ANOVA were performed to compare differences between two groups and among more than two groups, respectively. We performed Pearson correlation analysis to evaluate correlations between different groups. For survival analysis, Kaplan‒Meier (KM) curves were generated and the log-rank test was performed to visualize and compare survival between different groups, respectively. P values of < 0.05 were accepted as statistically significant (*P value < 0.05; **P value < 0.01; ***P value < 0.001).
Results
MIR222HG enhances GSC self-renewal and mediates the PMT process
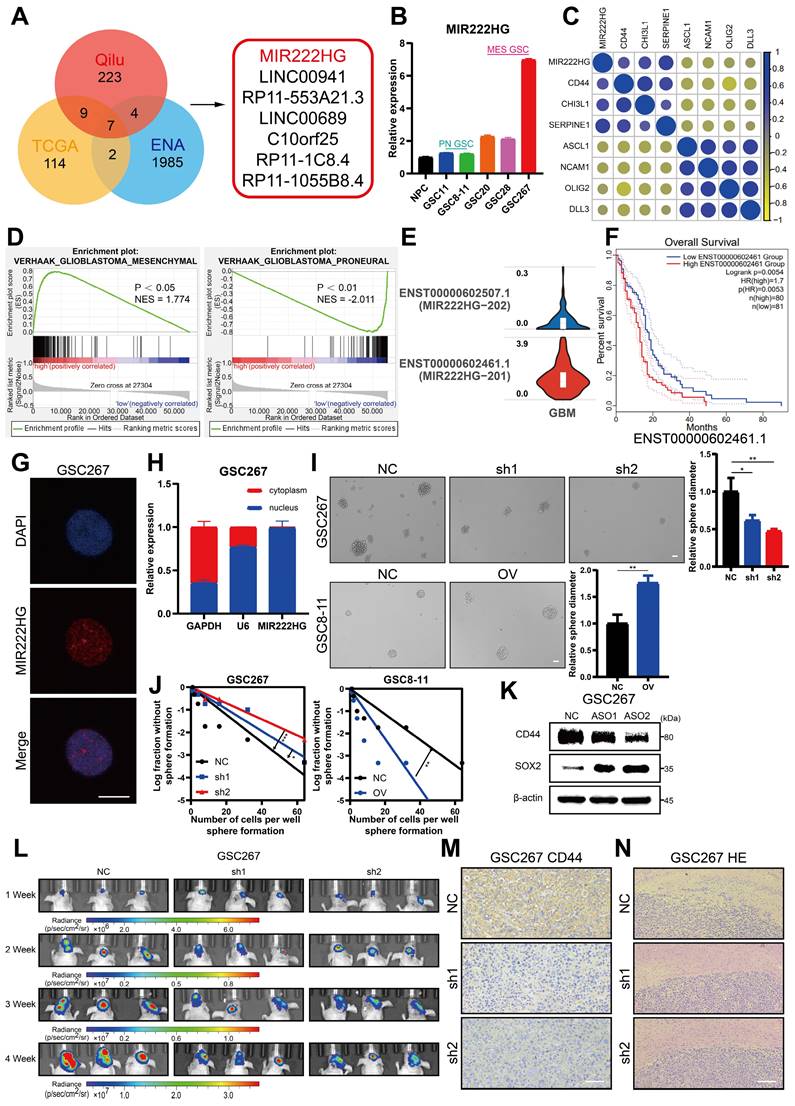
To explore the lncRNAs potentially regulating PMT, we used ssGSEA to calculate MES and PN scores using the Phillips gene set in sequencing data of 12 GBM samples from the neurosurgery department of Qilu Hospital (GEO: GSE211554) and divided the samples into two groups—namely, High-Score and Low-Score—for difference analysis. The differentially expressed genes were then intersected with the differentially expressed genes in MES GBM and PN GBM in TCGA and the differentially expressed lncRNAs in MES GSCs and PN GSCs in the ENA (PRJEB27943). Seven lncRNAs with high expression in the MES subtype were identified (Figure 1A and Figure S1A). We applied qRT‒PCR to measure the expression of these 7 lncRNAs in NPCs and GSC cell lines (pGSC: GSC11, GSC8-11; mGSC: GSC20, GSC28, GSC267) from the MD Anderson Cancer Center (Figure 1B and Figure S1C). MIR222HG was the most consistent with the expectations, with higher expression in MES GSCs than in PN GSCs and higher expression in GSCs than in NPCs. Subsequently, we performed a preliminary bioinformatic analysis of MIR222HG. Correlation analysis based on TCGA data revealed that the expression of MIR222HG was positively correlated with that of MES subtype marker genes (CD44, CHI3L1 and SERPINE1) and negatively correlated with that of PN subtype marker genes (DLL3, OLIG2, ASCL1, NCAM1) (Figure 1C and Table S1). Single-cell RNA-seq analysis showed that the clusters of cells with high MIR222HG expression had higher MES scores (Figure S1B). GSEA based on the Verhaak and Phillips gene sets showed that high expression of MIR222HG was more prevalent in the MES subtype, and low expression of MIR222HG was more prevalent in the PN subtype (Figure 1D and Figure S1D). In further studies, we found that MIR222HG was expressed in GBM mainly as two transcripts, MIR222HG-201 and MIR222HG-202; the MIR222HG-201 transcript was the most highly expressed, and we thus concluded that it was the MIR222HG-201 transcript representing the role of MIR222HG (Figure 1E). Survival analysis indicated poor prognosis for patients with high expression of MIR222HG-201 and good prognosis for those with low expression (Figure 1F). We confirmed by FISH and nuclear-cytoplasmic fractionation that MIR222HG is a lncRNA localized in the nucleus (Figure 1G, H). We first used an ASO to knock down MIR222HG in mGSCs and found a significant reduction in the expression of the MES marker CD44 and a significant increase in that of the PN marker SOX2 by western blot analysis. pGSCs with overexpression of MIR222HG in exhibited a significant reduction in SOX2 expression. We did not detect CD44 in GSC8-11 cells, which is consistent with the lack of CD44 expression in GSC8-11 cells (Figure 1K and Figure S1I). We subsequently generated lentivirally transduced cell lines. The neurosphere formation assay and ELDA showed that knockdown of MIR222HG in mGSCs significantly reduced their self-renewal capacity, whereas overexpression of MIR222HG in pGSCs enhanced their self-renewal capacity (Figure 1I, J and Figure S1E, F). This pattern provides evidence that MIR222HG promotes the malignant progression of GBM by enhancing the self-renewal capacity of GSCs. In vivo, through a xenograft model, knockdown of MIR222HG was demonstrated to significantly reduce the tumorigenesis of GSC267 cells and prolong the survival of mice (Figure 1L and Figure S1G, H). IHC staining of tumor sections showed a significant decrease in CD44 expression, while HE staining showed a significant decrease in tumor aggressiveness (Figure 1M, N). In contrast, overexpression of MIR222HG enhanced the tumorigenesis and aggressiveness of GSC8-11 cells and reduced survival and SOX2 expression in mice (Figure S1J, K, L, M, N). In summary, we found that the nuclear transcript MIR222HG-201 is highly expressed in the MES subtype, mediates the PMT process, and enhances the self-renewal capacity and tumorigenicity of GSCs.
MIR222HG enhances GSC self-renewal and mediates the PMT process. A Venn diagram showing the overlap of lncRNAs upregulated in the MES subtype identified in the TCGA dataset, ENA dataset and Qilu dataset. B qRT‒PCR showing the relative expression of MIR222HG in NPCs, pGSCs (GSC11 and GSC8-11) and mGSCs (GSC20, GSC28, and GSC267). C Correlations of MIR222HG expression with the expression of PN subtype marker genes (DLL3, OLIG2, ASCL1, NCAM1) and MES subtype marker genes (CD44, CHI3L1 and SERPINE1). D GSEA based on the Verhaak gene set showed that MIR222HG expression was positively correlated with the MES subtype and negatively correlated with the PN subtype. E Relative expression of the two transcripts of MIR222HG in GBM. F Kaplan-Meier curves revealing the overall survival of GBM patients stratified according to MIR222HG expression. G RNA FISH assays showing the subcellular localization of MIR222HG (Cy3) in GSC267 cells. Nuclei were stained with DAPI (blue). Scale bar, 15 μm. H Nuclear-cytoplasmic fractionation assays showing the relative expression of MIR222HG in the cytoplasmic (GAPDH) and nuclear (U6) fractions. I Representative images and quantification of tumor sphere formation in GSC8-11 cells with MIR222HG overexpression and in GSC267 cells with MIR222HG knockdown. Scale bar, 50 μm. J ELDA of GSC267 cells expressing lentiviral shNC or shMIR222HG and GSC8-11 cells expressing lentiviral vector or MIR222HG. K western blot analysis of CD44 and SOX2 protein expression after knockdown of MIR222HG in GSC267 cells. β-Actin served as the negative control. L Bioluminescence imaging to measure tumor sizes in shNC, sh1 and sh2 GSC267 xenograft-bearing mice. M Representative images of IHC staining for CD44 in sections of GSC267 xenografts from each group. Scale bar, 25 μm. N Representative images of HE staining of tissue from a subgroup of animals in each group sacrificed simultaneously. Scale bar, 200 μm. All data are presented as the means ± SDs. ns, P > 0.05; *P < 0.05; **P < 0.01; ***P < 0.001.
MIR222HG expression correlates with radioresistance in mGSCs
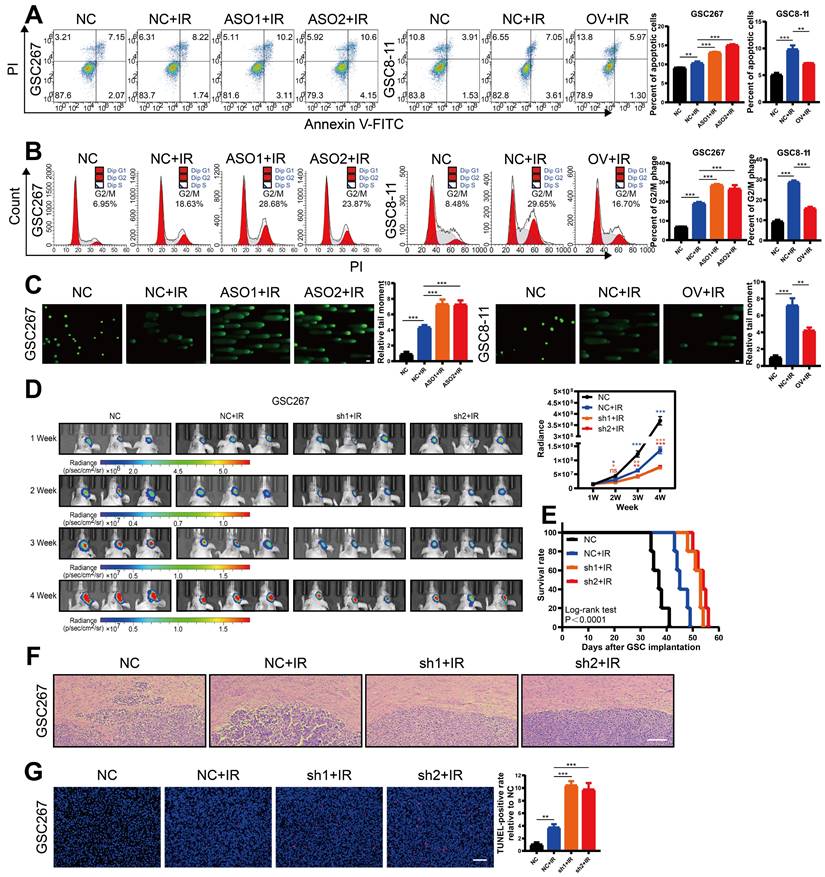
GBM patients derive little benefit from radiotherapy, mainly owing to the radioresistance of mGSCs [7]. Here, we further investigated whether the MIR222HG-mediated MES subtype orchestrates the acquisition of radioresistance in GSCs. GSCs exhibit DNA damage, G2/M arrest and apoptosis after radiation treatment. Here, mGSCs exhibited less apoptosis, G2/M arrest and DNA damage after radiation treatment than pGSCs. Furthermore, knockdown of MIR222HG in mGSCs enhanced the response to radiotherapy. In contrast, overexpression of MIR222HG in pGSCs attenuated the response to radiotherapy (Figure 2A, B, C and Figure S2A, B, C). In vivo, knockdown of MIR222HG in mGSCs enhanced the radiotherapy response, attenuated tumorigenesis, and prolonged survival in mGSC-bearing mice (Figure 2D, E). HE staining of mouse brain sections revealed that knockdown of MIR222HG combined with radiotherapy significantly reduced tumor aggressiveness (Figure 2F). TUNEL assays on tissue sections demonstrated that knockdown of MIR222HG enhanced apoptosis in mGSCs in vivo (Figure 2G). In contrast, mice implanted with pGSCs overexpressing MIR222HG showed reduced responsiveness to radiotherapy, faster tumor growth and shorter survival after radiotherapy (Figure S2D, E). HE staining revealed a significant increase in tumor aggressiveness in the group implanted with pGSCs overexpressing MIR222HG and treated with radiotherapy (Figure S2F). The TUNEL assay demonstrated that overexpression of MIR222HG reduced the apoptosis level in tumors in vivo (Figure S2G). In summary, MIR222HG enhanced the radioresistance of mGSCs both in vivo and in vitro.
MIR222HG expression correlates with radioresistance in mGSCs. A, B, C The effects of knocking down MIR222HG in GSC267 cells and overexpressing MIR222HG in GSC8-11 cells on the outcomes of IR (6 Gy) treatment were evaluated by apoptosis (A), cell cycle (B) and alkaline comet (C) assays. The corresponding quantifications are shown on the right. Scale bar, 25 μm. D Bioluminescence images (left) and quantification (right) of tumor size in shNC, sh1 and sh2 GSC267 xenograft-bearing nude mice receiving IR treatment. E Kaplan-Meier curves showing the survival of GSC267 xenograft-bearing mice in the different groups. F Representative images of HE staining of tissues from a subgroup of animals in each group sacrificed simultaneously. Scale bar, 200 μm. G Representative images and quantification of TUNEL staining in sections of IR-treated GSC267 xenografts. Scale bar, 200 μm. All data are presented as the means ± SDs. ns, P > 0.05; *P < 0.05; **P < 0.01; ***P < 0.001.
MIR222HG induces PMT by mediating H4K16 deacetylation
To investigate the mechanism by which nuclear-localized MIR222HG is specifically involved in PMT, we performed RNA-seq of GSC267 cells with MIR222HG knockdown and isolated the proteins bound to MIR222HG by RNA pulldown for analysis by mass spectrometry. GSEA of the RNA-seq data (GEO: GSE213310) indicated that MIR222HG mediates PMT in GSCs at the transcriptome level (Figure 3A and Figure S3A). Intranuclear lncRNAs can be involved in regulating the level of transcription, for example, through histone modifications [30]. We screened the mass spectrometry data for nuclear proteins and found that MIR222HG could bind to histone H4 (Figure 3B and Table S2).
MIR222HG induces PMT by mediating H4K16 deacetylation. A GSEA based on the Verhaak gene set showed that knockdown of MIR222HG expression in GSC267 cells was negatively correlated with the MES subtype and positively correlated with the PN subtype. B Silver staining assay showing the proteins that interacted with MIR222HG, which were identified by RNA pulldown/mass spectrometry (left). Western blot analysis showing the interaction between MIR222HG and YWHAE or H4 in GSC267 cells (right). C The binding of YWHAE to HDAC5 was predicted by STRING. D The secondary structure of MIR222HG was predicted with the RNAfold WebServer. An RNA pulldown assay was performed with in vitro transcribed biotinylated RNAs corresponding to different fragments of MIR222HG in GSC267 cells. E RIP-qPCR assay showing the relative enrichment of MIR222HG in GSC267 cells as detected by anti-YWHAE and anti-H4 antibodies (bottom). Specific immunoprecipitation of YWHAE and H4 was confirmed by western blot analysis (top). F, G The interactions of YWHAE with HDAC5 and H4 with HDAC5 in GSC267 cells were detected by Co-IP with anti-YWHAE (F) and anti-H4 (G) antibodies, respectively. H western blot showing the extent of acetylation of each H4 site in GSC267 cells after knockdown of MIR222HG with an ASO. I The interactions of HDAC5 with YWHAE and H4 in GSC267 cells were detected by Co-IP with an anti-HDAC5 antibody. J western blot was performed to detect changes in the expression of YWHAE and HDAC5 in GSC267 cells after knockdown of MIR222HG using an ASO. β-Actin served as the negative control. K, L Co-IP was performed to detect the interaction between H4 and HDAC5 after knockdown (left) or overexpression (right) of MIR222HG in GSC267 cells using anti-H4 (K) and anti-HDAC5 (L) antibodies, respectively. M, N Co-IP was performed to detect the interaction between YWHAE and HDAC5 after knockdown (left) or overexpression (right) of MIR222HG in GSC267 cells using anti-YWHAE (M) and anti-HDAC5 (N) antibodies, respectively. All data are presented as the means ± SDs. ns, P > 0.05; *P < 0.05; **P < 0.01; ***P < 0.001.
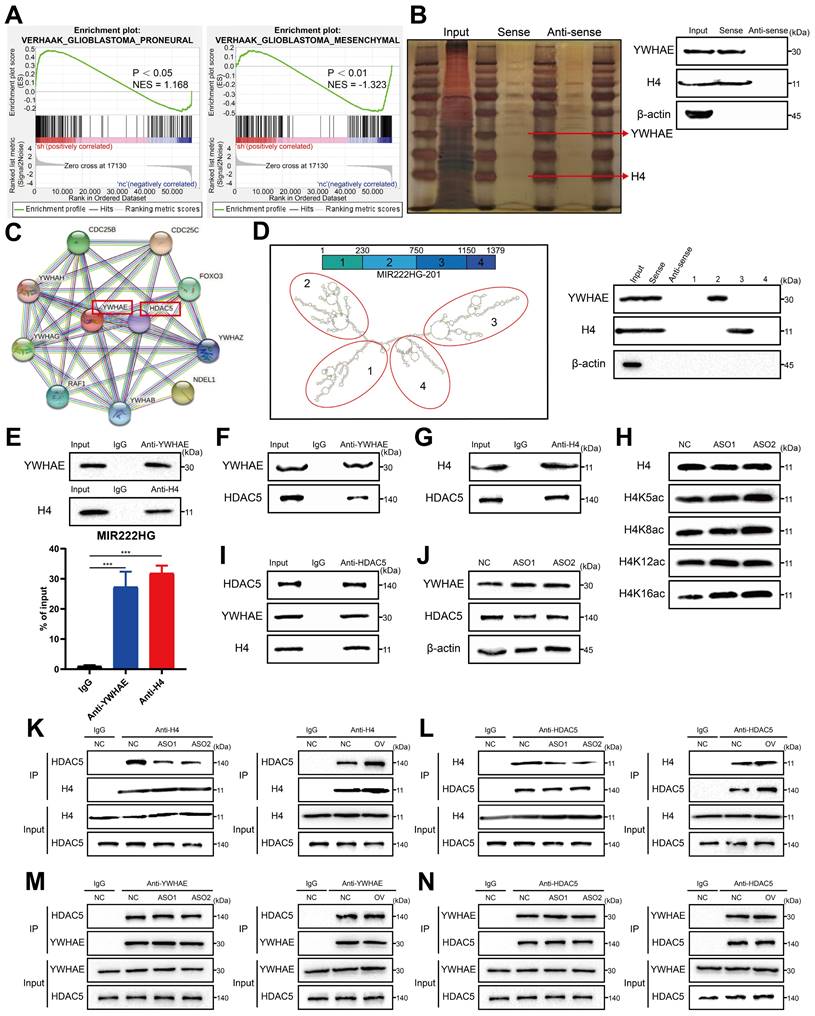
However, no histone-modifying enzymes corresponding to histones were identified in the data. We therefore speculated that there may be intermediary proteins involved in histone modifications in the mass spectrometry data. We then predicted interactions with all remaining intranuclear proteins with the STRING database (https://cn.string-db.org/) and found that only YWHAE could bind to the histone-modifying enzyme HDAC5 (Figure 3C). We therefore speculated that MIR222HG may participate in PMT by modifying H4 through the binding of YWHAE to HDAC5. Numerous studies have shown that histone deacetylation is an important factor in promoting tumor development [31, 32]. In addition, histone deacetylation has been shown to promote GSC growth and enhance the MES subtype33, 34. HDAC5 is an enzyme responsible for histone deacetylation and has not been studied in GSCs. Next, we used GSC267 cells to conduct a series of validations of the putative downstream mechanism. First, we visualized the secondary structures of MIR222HG interacting with YWHAE and H4. We used the RNAfold WebServer (http://rna.tbi.univie.ac.at//cgi-bin/RNAWebSuite/RNAfold.cgi) to predict the secondary structure of MIR222HG and divided it into four main substructures, each containing a base-pairing structure and a hairpin structure. The RNA pulldown assay demonstrated that YWHAE binds to secondary structure 2 (nucleotides 230-750) of MIR222HG and that H4 binds to secondary structure 3 (nucleotides 750-1150) of MIR222HG (Figure 3D). We again validated the binding of MIR222HG to YWHAE and H4 using a RIP assay (Figure 3E). Based on the YWHAE binding site identified in the mass spectrometry results, a plasmid with a deletion mutation was constructed and validated by the RIP assay (Figure S3B). Co-IP confirmed the binding of YWHAE to HDAC5 and the binding of H4 to HDAC5 (Figure 3F, G, I). Western blotting showed no change in YWHAE and HDAC5 expression after knockdown of MIR222HG, and no alteration of YWHAE and HDAC5 expression at the transcriptional level was observed in the RNA-seq results, suggesting that MIR222HG does not affect the intracellular content of YWHAE and HDAC5 (Figure 3J). To determine the specific site where MIR222HG, YWHAE, and HDAC5 cooperate to act on H4, we found that the acetylation level of H4K16 was significantly increased based on Western blotting after knockdown of MIR222HG, indicating that the combined effects of MIR222HG, YWHAE, and HDAC5 mainly led to the deacetylation of H4K16 (Figure 3H). Furthermore, we examined the binding affinity between YWHAE, HDAC5, and H4 by knocking down and overexpressing MIR222HG. The Co-IP results showed that the binding affinity of H4 for HDAC5 was reduced after knockdown of MIR222HG and increased after overexpression of MIR222HG (Figure 3K, L). The binding affinity of YWHAE for HDAC5 did not change significantly after either knockdown or overexpression of MIR222HG, indicating that MIR222HG did not affect the binding of YWHAE and HDAC5 (Figure 3M, N). Taken together, these results suggest that MIR222HG anchors to H4 via secondary structure 3 and then binds to the YWHAE/HDAC5 complex via secondary structure 2, leading to deacetylation of H4K16.
MIR222HG induces PMT through H4K16 deacetylation, leading to activation of the STAT3 and MAPK pathways
Next, we further explored the changes in the downstream pathways following MIR222HG-mediated H4K16 deacetylation via the YWHAE/HDAC5 complex. Enrichment analysis based on previous sequencing results showed that knockdown of MIR222HG resulted in changes in the MAPK and JAK-STAT pathways (Figure 4A and Table S3). The STAT3 pathway has been extensively documented as a classical pathway associated with the MES subtype, and the ERK-MAPK pathway has been previously demonstrated to be a key factor contributing to the MES-like subtype state of GSCs [35, 36]. We validated the changes in the downstream pathways by interfering with two key proteins, YWHAE and HDAC5, in the MIR222HG complex. First, we selected the most efficient interference sequence for subsequent experiments (Figure S3E, F). Western blot analysis confirmed that the P-ERK1/2 and P-STAT3 levels were significantly elevated after overexpression of MIR222HG, while knockdown of YWHAE or HDAC5 attenuated these increases in P-ERK1/2 and P-STAT3, and combined knockdown of YWHAE and HDAC5 further reduced the P-ERK1/2 and P-STAT3 levels (Figure 4B and Figure S3C). In addition, overexpression of MIR222HG resulted in enhanced acetylation of H4K16, elevated expression of CD44, and decreased expression of SOX2. Knockdown of YWHAE or HDAC5 partially reversed these changes, and combined knockdown of YWHAE and HDAC5 further reversed the changes in the H4K16ac, CD44, and SOX2 levels (Figure 4B and Figure S3C). GSC self-renewal was enhanced by overexpression of MIR222HG, knockdown of YWHAE or HDAC5 partially reversed this change, and combined knockdown of YWHAE and HDAC5 further reversed this change, as shown by the neurosphere formation assay and ELDA (Figure 4C and Figure S3D, G).
MIR222HG induces PMT through H4K16 deacetylation, leading to activation of the STAT3 and MAPK pathways. A The RNA-seq results were used to identify the enriched pathways after interference with MIR222HG expression in GSC267 cells. B western blot analysis of the protein levels of H4K16ac, ERK1/2, p-ERK1/2, STAT3, p-STAT3, CD44, SOX2, YWHAE and HDAC5 in GSC267 cells subjected to the indicated interventions. H4 served as the negative control. C Tumor sphere formation assays of GSC267 cells subjected to the indicated interventions. The quantification of the relative sphere diameter is shown on the right. Scale bar, 50 μm. D Apoptosis assays of GSC267 cells subjected to the indicated interventions. The quantification of apoptosis rates is shown on the right. E Cell cycle analysis of GSC267 cells subjected to the indicated interventions. The quantification of the G2/M-phase population is shown on the right. All data are presented as the means ± SDs. ns, P > 0.05; *P < 0.05; **P < 0.01; ***P < 0.001.
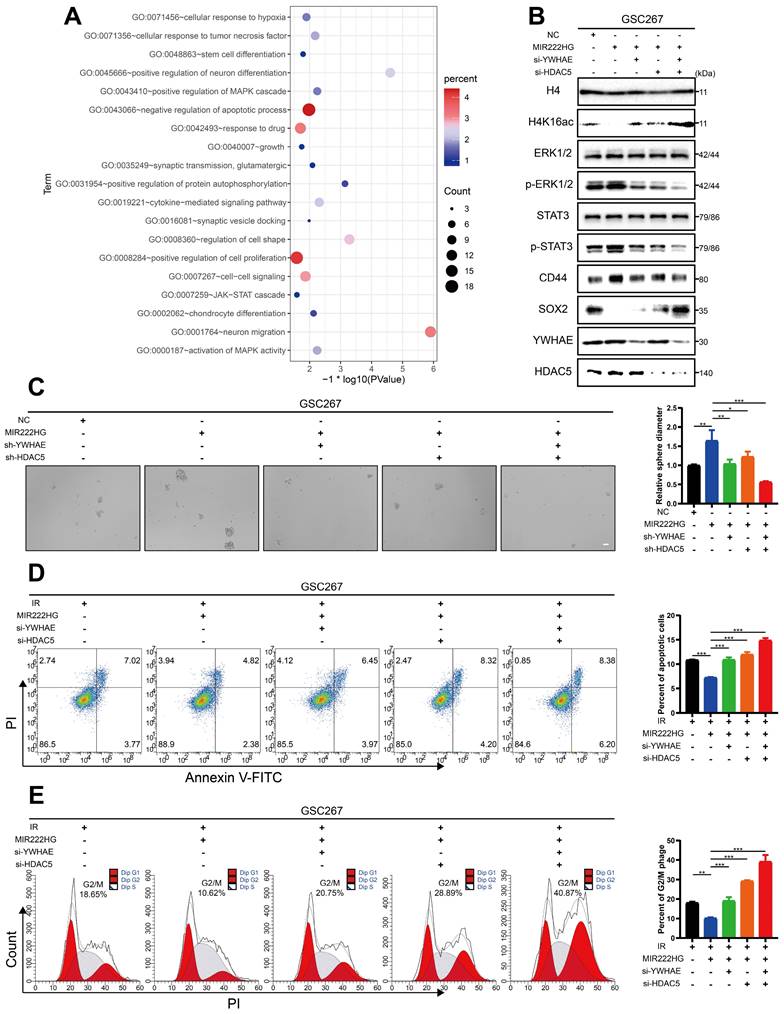
The apoptosis and cell cycle assays demonstrated that the increased resistance of GSCs to radiotherapy after overexpression of MIR222HG was partially reversed by knockdown of YWHAE or HDAC5 and that combined knockdown of YWHAE and HDAC5 further reversed the increase in radioresistance in GSCs (Figure 4D, E and Figure S3H, I). Finally, we performed western blotting on all GSC and NPC cell lines and found that the deacetylation levels in GSCs were higher than those in NPCs, while in GSCs, the deacetylation levels were generally higher in the MES subtype than in the PN subtype (Figure S3J). In summary, MIR222HG mediates the deacetylation of H4K16 via YWHAE/HDAC5, activating the STAT3 and ERK-MAPK pathways, in turn leading to PMT and enhancing radioresistance in GSCs.
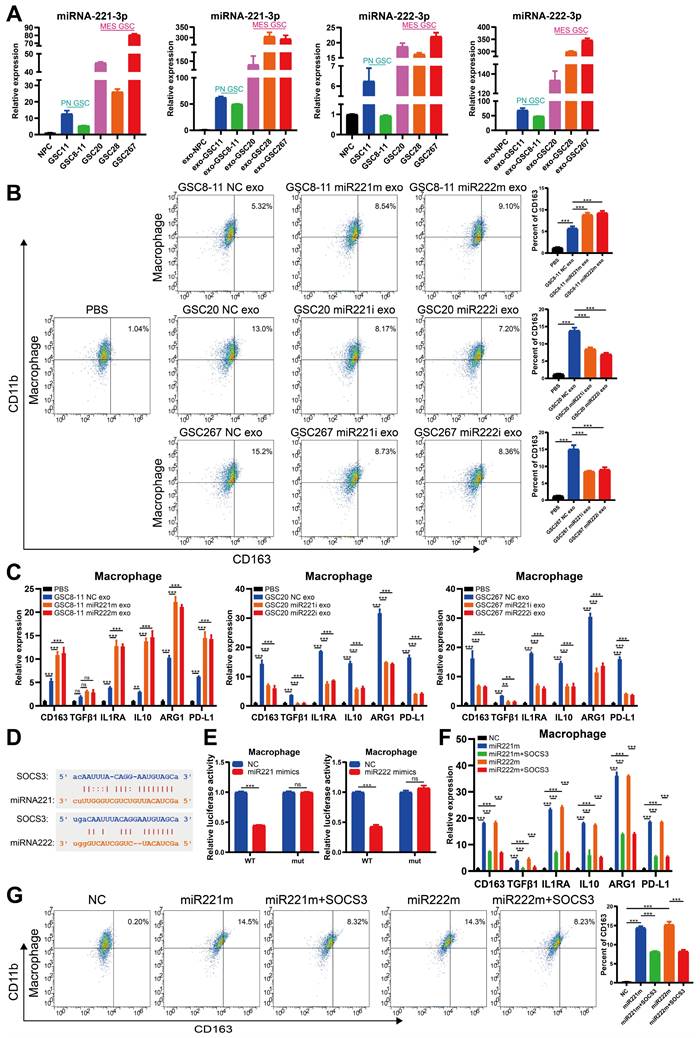
Cotranscription of miR221 and miR222 in GSCs leads to an immunosuppressive state in macrophages via exosomes
It is well documented that TAMs in the microenvironment promote malignant progression of GBM and that GBM in turn promotes immunosuppressive polarization of TAMs [18, 26, 35, 37]. Our previous study demonstrated that immunosuppressive M2 macrophages can deliver miR-221-3p, miR-22-3p, and miR-27a-3p to GSCs to promote PMT in GSCs [14]. qRT‒PCR revealed that miRNA-221-3p and miRNA-222-3p, cotranscribed from the MIR222HG gene, were not only highly expressed in mGSCs but also detected in their exosomes (Figure 5A). We therefore sought to determine whether mGSCs can affect the macrophage status by delivering miRNA-221-3p and miRNA-222-3p to TAMs via exosomes. We used phorbol 12-myristate 13-acetate (PMA)-treated THP1 cells as macrophages for validation in subsequent experiments. First, we identified exosomes isolated from GSCs by TEM, ZetaView analysis and western blot analysis (Figure S4A, B, C). By uptake experiments, we confirmed that exosomes derived from GSCs can be phagocytosed by macrophages (Figure S4D). Flow cytometric analysis showed that exosomes from GSCs induced the expression of the immunosuppressive macrophage marker CD163 and that the release of exosomes was more strongly induced from mGSCs than from pGSCs. In macrophages, treatment with exosomes derived from GSC8-11 cells overexpressing miR221 and miR222 resulted in elevated CD163 expression compared to treatment with exosomes from untreated GSC8-11 cells. In contrast, treatment with exosomes from GSC20 and GSC267 cells with miR221 and miR222 knockdown resulted in decreased CD163 expression in macrophages compared to treatment with exosomes from untreated GSC20 and GSC267 cells (Figure 5B). In addition, we examined a series of macrophage-derived immunosuppressive genes, including CD163, TGFB1, IL1RA, IL10, ARG1 and PD-L1, in the above treated macrophages by qRT‒PCR and found that the changes in the expression of these genes were generally consistent with those identified by flow cytometry (Figure 5C). This finding demonstrates that miR221 and miR222, which are highly expressed in mGSCs, can act on macrophages via exosomes, leading to immunosuppressive polarization of macrophages. Next, we investigated the specific mechanisms by which miR221 and miR222 act on macrophages. It has been shown that miR221 and miR222 can act on SOCS3 to inhibit angiogenesis in GBM [38]. It has also been reported that SOCS3 is associated with central nervous system (CNS) immunity as a tumor suppressor and that inhibition of SOCS3 leads to immunosuppressive M2 polarization of macrophages [39, 40]. We analyzed the miR221 and miR222 sequences with ENCORI (https://starbase.sysu.edu.cn/index.php) and found that they share common binding sites for the SOCS3 3′ untranslated region (UTR) (Figure 5D). We validated the SOCS3 binding sites in miR221 and miR222 by a luciferase reporter assay (Figure 5E). Western blot analysis showed that overexpression of miR221 and miR222 in macrophages reduced SOCS3 expression (Figure S4E). Flow cytometric analysis of macrophages with direct overexpression of miR221 and miR222 followed by further overexpression of SOCS3 showed that overexpression of miR221 and miR222 increased CD163 expression in macrophages and that further overexpression of SOCS3 partially reversed the increase in CD163 expression caused by overexpression of miR221 and miR222 (Figure 5G). qRT‒PCR showed changes in the levels of immunosuppressive genes, including CD163, TGFB1, IL1RA, IL10, ARG1 and PD-L1, in these treated macrophages, in general agreement with the flow cytometry results (Figure 5F). Finally, we validated the downstream pathway through which miR221 and miR222 affect immunosuppressive macrophage polarization via SOCS3. Previous studies have demonstrated that knockdown of SOCS3 leads to STAT3 activation and that NF-κB inhibition causes M2 polarization of macrophages [40]. We found that overexpression of miR221 and miR222 resulted in elevated P-STAT3 and decreased P-P65 levels, while further overexpression of SOCS3 reversed the changes induced by overexpression of miR221 and miR222 (Figure S4E). Taken together, these results demonstrate that miR221 and miR222, which are highly expressed in mGSCs, can act via exosomes on SOCS3 in macrophages, altering the STAT3 and NF-κB pathways and leading to immunosuppressive polarization of macrophages.
Cotranscription of miR221 and miR222 in GSCs leads to an immunosuppressive state in macrophages via exosomes. A qRT‒PCR showing the relative expression of miR221 and miR222 in NPCs, pGSCs (GSC11 and GSC8-11) and mGSCs (GSC20, GSC28, and GSC267) as well as the corresponding exosomes. B Representative flow cytometric analysis showing the proportion of CD11b+CD163+ cells among THP1 differentiated macrophages treated with PBS or exosomes (exo) collected from GSC20 and GSC267 cells transfected with the inhibitor NC, miR221 inhibitor (miR221i) or miR222 inhibitor (miR222i) and GSC8-11 cells transfected with the mimic NC, miR221 mimic (miR221m) or miR222 mimic (miR222m). The histogram shows the proportion of CD11b+CD163+ cells among THP1 differentiated macrophages. C qRT‒PCR assay showing the relative expression of macrophage-derived immunosuppressive genes in THP1 differentiated macrophages treated with PBS or exosomes collected from GSC20 and GSC267 cells transfected with inhibitor NC, miR221i or miR222i and GSC8-11 cells transfected with mimic NC, miR221m or miR222m. D The predicted binding site of miR221 and miR222 in the SOCS3 3'UTR. E Luciferase activity of SOCS3-3'-UTR WT/mut after transfection with miR221m or miR222m. F qRT‒PCR assay showing the relative expression of macrophage-related immunosuppressive genes in THP1 differentiated macrophages cotransfected with the SOCS3 overexpression plasmid (OV-SOCS3) and miR221m or miR222m. G Representative flow cytometric analysis showing the proportion of CD11b+CD163+ cells among THP1 differentiated macrophages cotransfected with OV-SOCS3 and miR221m or miR222m. The histogram shows the proportion of CD11b+CD163+ cells among THP1 differentiated macrophages. All data are presented as the means ± SDs. ns, P > 0.05; *P < 0.05; **P < 0.01; ***P < 0.001.
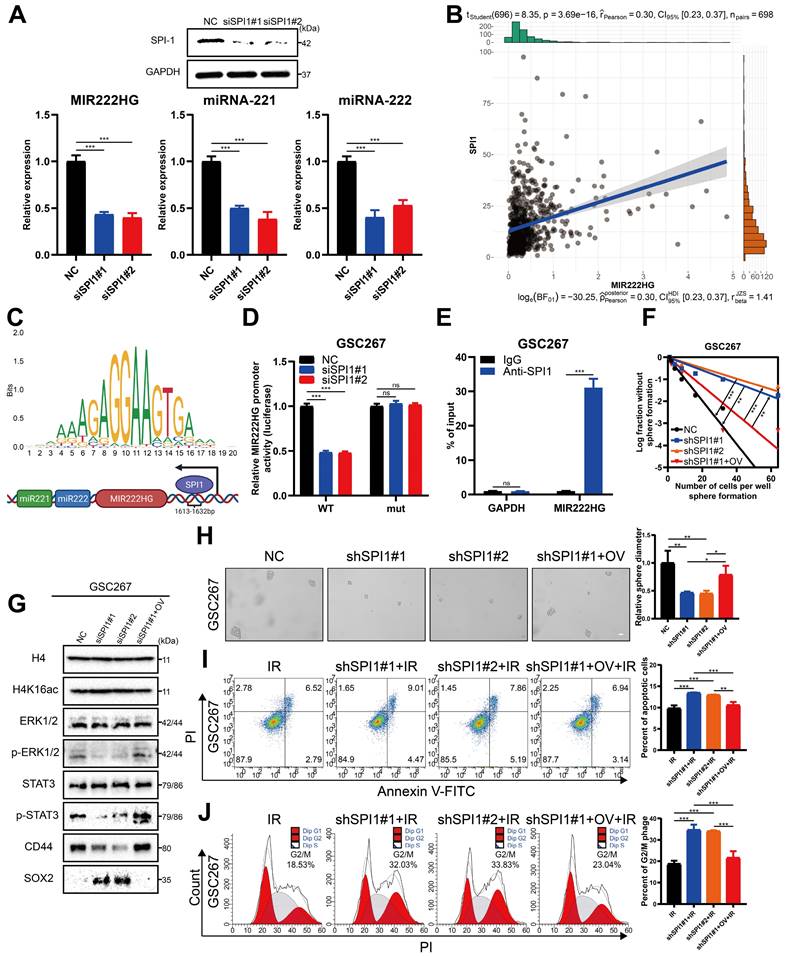
The transcription factor SPI1 regulates cotranscription of the MIR222HG gene
Next, we sought to identify common upstream targets that regulate the expression of MIR222HG, miR221, and miR222. Using JASPAR (https://jaspar.genereg.net/), we predicted transcription factors for the MIR222HG gene and initially identified 11 potential transcription factors. The relationships of these transcription factors with prognosis, subtype and immune characteristics were then analyzed by a bioinformatic approach, and we eventually targeted the transcription factor SPI1. SPI1, an immune-related oncogenic factor, was previously studied mostly in leukaemia [41]. A recent study by our group found that SPI1 acts as a transcription factor that promotes GBM progression and that knocking down SPI reduces CD44 expression [42]. GSEA based on the Verhaak and Phillips gene sets showed that high expression of SPI1 was found to be more prevalent in the MES subtype and low expression of SPI1 was more prevalent in the PN subtype (Figure S5A, B). Based on marker gene correlation analysis, SPI1 expression was positively correlated with the expression of MES subtype marker genes (CD44, CHI3L1 and SERPINE1) and negatively correlated with the expression of PN subtype marker genes (DLL3, OLIG2, ASCL1, NCAM1) (Figure S5C and Table S4). SPI1 was highly expressed in the MES subtype in both the TCGA and CGGA databases, and high expression of SPI1 was associated with a poor prognosis (Figure S5D, E). Single-cell RNA-seq analysis showed that clusters of cells with high SPI1 expression had higher MES scores (Figure S5F). Moreover, high SPI1 expression in GBM was associated with multiple immune features and pathways (Figure S5G, H and Table S5). Sequence analysis of the SPI1, a possible transcription factor for MIR222HG, revealed that it has only one binding site located upstream of the MIR222HG gene from positions 1613-1632 (Figure 6C). Correlation analysis revealed that MIR222HG expression was positively correlated with SPI1 expression (Figure 6B). The luciferase reporter and the ChIP assays demonstrated that SPI1 promotes MIR222HG transcription by binding to positions 1613-1632 upstream of the MIR222HG gene (Figure 6D, E). The expression of MIR222HG, miR221 and miR222 was downregulated after SPI1 knockdown (Figure 6A). Next, we found that knockdown of SPI1 decreased the self-renewal ability of GSC20 and GSC267 cells, while overexpression of MIR222HG reversed this change (Figure 6F, H and Figure S6A, B). The reduction in radioresistance in GSC20 and GSC267 cells after knockdown of SPI1 was reversed after overexpression of MIR222HG (Figure 6I, J and Figure S6D, E). Western blot analysis showed that knockdown of SPI1 increased H4K16 acetylation levels, decreased ERK1/2 and STAT3 phosphorylation levels, increased SOX2 expression and decreased CD44 expression in GSC20 and GSC267 cells, while overexpression of MIR222HG reversed these changes (Figure 6G and Figure S6C). In conclusion, these findings demonstrate that SPI1 acts as a transcription factor that mediates cotranscription of MIR222HG, miR221 and miR222, thereby causing downstream changes.
The transcription factor SPI1 regulates cotranscription of the MIR222HG gene. A Detection of SPI1 expression by western blotting and miR222HG, miR221 and miR222 expression by qRT‒PCR after knockdown of SPI1 in GSC267 cells. B Positive correlation between SPI1 expression and MIR222HG expression. C Predicted SPI1-binding sites in the promoter region of MIR222HG. D Luciferase activity of the MIR222HG promoter after transfection with siSPI1#1 and siSPI1#2. E ChIP assay of the enrichment of SPI1 on the MIR222HG promoter region. F ELDA of GSC267 cells subjected to the indicated interventions. G western blot analysis of the protein levels of H4K16ac, ERK1/2, p-ERK1/2, STAT3, p-STAT3, CD44 and SOX2 in GSC267 cells subjected to the indicated interventions. H4 served as the negative control. H Tumor sphere formation assays of GSC267 cells subjected to the indicated interventions. The quantification of the relative sphere diameter is shown on the right. Scale bar, 50 μm. I Apoptosis assay of GSC267 cells subjected to the indicated interventions. The quantification of apoptosis rates is shown on the right. J Cell cycle analysis of GSC267 cells subjected to the indicated interventions. The quantification of the G2/M-phase population is shown on the right. All data are presented as the means ± SDs. ns, P > 0.05; *P < 0.05; **P < 0.01; ***P < 0.001.
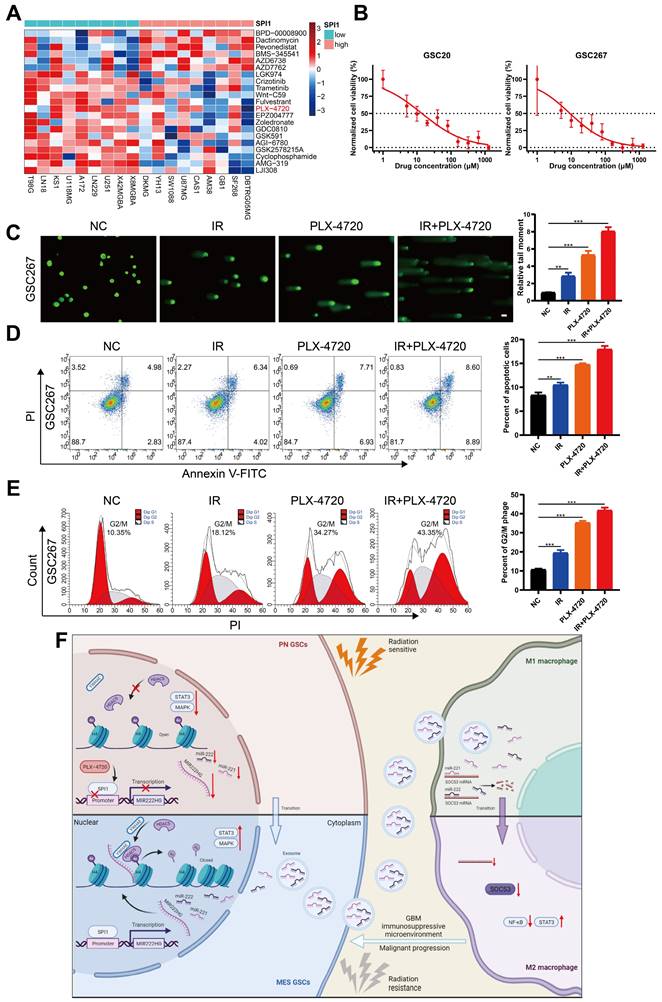
Targeting mGSCs with the SPI1 expression-sensitive drug PLX-4720 in combination with radiotherapy
As SPI1, which mediates MIR222HG transcription, is highly expressed in the MES subtype, we investigated the relationship between SPI1 expression and therapeutic drug sensitivity. By screening for drugs to which GBM cell lines with high SPI1 expression are sensitive and considering factors such as the blood‒brain barrier, PLX-4720 was finally identified (Figure 7A and Table S6). PLX-4720 is a B-Raf inhibitor that has been documented to exert anti-GBM effects in vitro and in vivo in combination with radiotherapy [43]. We determined the IC50 of PLX-4720 in GSC20 and GSC267 cells by a CCK-8 assay (Figure 7B). By treating GSC20 and GSC267 cells with PLX-4720 or radiotherapy, we found that PLX-4720 had better efficacy than radiotherapy alone, resulting in increased DNA damage, increased apoptosis, and significant G2/M arrest. The combination of PLX-4720 and radiotherapy resulted in further increases in DNA damage and apoptosis and further G2/M arrest in GSCs (Figure 7C, D, E and Figure S6F, G, H). These results show that PLX-4720 has a significant therapeutic effect in radioresistant mGSCs.
Targeting mGSCs with the SPI1 expression-sensitive drug PLX-4720 in combination with radiotherapy. A Heatmap visualizing the differences in the sensitivity of cell lines with high and low expression of SPI1 to the indicated drugs. B CCK-8 assay of GSC20 and GSC267 cells treated with different concentrations of PLX-4720 for 48 hours. C Comet assays of GSC267 cells treated with IR (6 Gy) and PLX-4720. The quantification of the relative tail moment is shown on the right. Scale bar, 25 μm. D Apoptosis assay of GSC267 cells treated with IR (6 Gy) and PLX-4720. The quantification of apoptosis rates is shown on the right. E Cell cycle analysis of GSC267 cells treated with IR (6 Gy) and PLX-4720. The quantification of the G2/M-phase population is shown on the right. F Proposed working model of the function of the MIR222HG gene in PMT in GSCs and immunosuppressive polarization of macrophages. All data are presented as the means ± SDs. ns, P > 0.05; *P < 0.05; **P < 0.01; ***P < 0.001.
Discussion
In recent years, as the study of noncoding RNAs has intensified, an increasing number of researchers have discovered that the transcribed sequences of some miRNAs are located in lncRNA host genes, or MIRHGs [44]. Initially, researchers focused on the function of miRNAs transcribed from host genes, but researchers are increasingly turning their attention to the lncRNAs produced from MIRHGs [44-47]. Host genes from which miRNAs and lncRNAs are coexpressed can synergistically influence tumor progression. In this study, we demonstrated the host gene for miR221 and miR222:MIR222HG. MIR222HG, also called Lnc-Ang362, has been studied more frequently in cardiovascular disease than in other processes and can promote smooth muscle cell proliferation [48]. In tumors, MIR222HG has been reported to promote the development of prostate cancer [49]. In this study, the MIR222HG gene was found to function in GBM primarily through the production of the lncRNA transcript MIR222HG-201, which is localized in the nucleus. MIR222HG is regulated by the transcription factor SPI1 and mediates H4K16 deacetylation via YWHAE-bound HDAC5, facilitating PMT and enhancing radioresistance in GSCs. miR221 and miR222 cotranscribed with MIR222HG-201 can act via exosomes on SOCS3 in macrophages and cause immunosuppressive polarization of macrophages. Finally, the SPI1 expression-sensitive drug PLX-4720 can be used in combination with radiotherapy to target mGSCs (Figure 7F). In conclusion, the MIR222HG gene promotes malignant progression and treatment resistance in GBM by affecting both GSCs themselves and macrophages in the microenvironment.
The high inter- and intratumoural heterogeneity of GBM and the inherent plasticity of GBM cells are challenges that lead to therapeutic resistance in GBM and impede progress in clinical treatment [50]. GBM heterogeneity and plasticity arise mainly from the different subtypes of GSCs and their interactions with the complex tumor microenvironment [4]. GBM recurrence and multitreatment resistance are thought to be associated with PMT, and the exploration of PMT mechanisms is a current research focus. Bhat et al suggested that PN GSCs can be induced to transition into the MES state in an NF-κB-dependent manner, with associated enrichment of CD44-expressing cells and an increase in radioresistance [7]. Zhengxin Chen et al. suggested that FOSL1 promotes PMT in GSCs via the UBC9/CYLD/NF-κB axis [51]. HDAC inhibitors, as antitumor agents, have been reported in extensive studies, including studies in GBM [52]. Melissa M Singh et al. combined a pan-HDAC inhibitor and a KDM1A inhibitor for the treatment of GSCs [53]. HDAC1 has also been reported to play an important role in the maintenance and transition of the MES subtype in GSCs via the NF-κB pathway [34]. In this study, we showed that MIR222HG in GSCs can affect the dual STAT3 and MAPK pathway-mediated MES transition through H4K16 deacetylation by YWHAE-bound HDAC5, resulting in malignant progression and radioresistance in GBM. In addition, deacetylation of H4K16 is considered a hallmark in human cancers, and its role in GBM was confirmed in our study [54].
The interaction of the tumor immune microenvironment with GBM cells is an important factor contributing to GBM heterogeneity and the resulting therapeutic resistance. It was previously reported that macrophages can mediate the MES-like state of GBM via OSM/OSMR [35]. Recent studies have shown that PMT in GBM is accompanied by changes in both the intrinsic anatomical location of the tumor and the microenvironment, including immunity [18]. Our previous study demonstrated that M2 macrophages can cause PMT through delivery of miR221, etc., to GSCs [14]. In this study, we explored whether mGSCs can mediate immunosuppressive polarization through the delivery of miR221 and miR222 cotranscribed from MIR222HG to macrophages. We demonstrated that GSCs and macrophages can interact through the delivery of various substances that together promote malignant tumor progression. Xiaomeng Li et al. previously reported that the expression of MIR222HG, an immune-related lncRNA, was positively correlated with B7-H3 and PDL1 expression, as determined by bioinformatics analysis [55]. This corroborates our findings that immune-related lnc-MIR222HG, which is highly expressed in mGSCs, can produce cotranscribed miRNAs for exosomal delivery and in turn cause macrophage immunosuppression and elevated PDL1 expression (Figure 5C). Since we did not detect nuclear lnc-MIR222HG expression in exosomes in our previous study, it is certain that the immunoregulatory function of the MIR222HG gene is performed through miR221 and miR222. Immune checkpoint inhibitors, such as anti-PD1/PDL1 antibodies, have achieved satisfactory results in the treatment of several cancer types, and Hao Zhang et al. showed that the expression of lncRNAs in GBM can be used to assess responsiveness to immune checkpoint therapies [56, 57]. Based on these findings and the findings of this study, we will explore the role of the MIR222HG gene in anti-PD1/PDL1 therapy for GBM in a subsequent study. SOCS3 is considered a tumor suppressor and has been studied in a variety of cancers, and it has been shown to be associated with CNS immunity and to mediate macrophage polarization [39, 40]. Xin-Chao Ji et al. showed that a reduction in SOCS3 expression in intracerebral hemorrhage induced M2 macrophage polarization through activation of STAT3 and inhibition of NF-κB [40]. Chun-Hua Xu et al. demonstrated that SOCS3 expression could be inhibited by miR221 and miR222 to cause angiogenesis in GBM [38]. In this study, we focused on whether miR221 and miR222 cause immunosuppressive polarization of macrophages in GBM through activation of STAT3 and inhibition of NF-κB, which in turn promote malignant progression of GBM.
SPI1, also called PU.1, is an ETS-domain transcription factor that activates gene expression during myeloid and B-lymphoid cell development [58]. In tumors, SPI1 was initially studied more frequently in leukemia, but SPI1 was later reported to play a promoting role in other cancers [59-61]. For example, our previous study demonstrated that SPI1 promotes GBM progression by regulating FTO and that knockdown of SPI1 leads to a decrease in CD44 expression [42]. In this study, we found that the transcription factor SPI1 regulates the expression of the MIR222HG gene, thereby affecting the GSC and macrophage status. Since we detected decreased expression of miR221 and miR222 in GSCs with SPI1 knockdown, we did not further observe the effect of exosomes from SPI1 knockdown GSCs on macrophages (Figure 6A). PLX-4720, a B-Raf inhibitor, has been used in combination with radiotherapy for the treatment of GBM in vivo and in vitro [43]. In the present study, we found that GBM cell lines with high SPI1 expression were more sensitive to PLX-4720, and we validated the combined effect of PLX-4720 and radiotherapy on GSCs by in vitro experiments using mGSCs. However, the relationship between the MES subtype and B-Raf needs to be further investigated.
Conclusions
SPI1-regulated nuclear lnc-MIR222HG-201 in GSCs anchors H4 through the binding of YWHAE to HDAC5 to mediate H4K16 deacetylation in order to activate the STAT3 and MAPK pathways, thereby causing PMT and enhancing radioresistance in GSCs. Cotranscribed miR221 and miR222 act on macrophages via exosomes, leading to downregulation of SOCS3, activation of the STAT3 pathway, and inhibition of the NF-κB pathway, resulting in immunosuppressive polarization of macrophages. The SPI1 expression-sensitive drug PLX-4720 has a significant therapeutic effect on radioresistant mGSCs. Our findings indicate that targeting the MIR222HG gene may be a promising approach to preventing PMT, activating immunity and overcoming treatment resistance in GBM.
Abbreviations
ASO: antisense oligonucleotide; CCK-8: cell counting kit-8; CGGA: chinese glioma genome atlas; ChIP: chromatin immunoprecipitation; CL: classical; CO-IP: co-immunoprecipitation; ECM: extracellular matrix; ELDA: extreme limiting dilution assay; ENA: european nucleotide archive; FISH: fluorescence in situ hybridization; GBM: glioblastoma; GSCs: glioma stem cells; IHC: immunohistochemical; IR: ionizing radiation; LncRNAs: Long non-coding RNAs; MES: mesenchymal; mGSCs: mesenchymal glioblastoma stem cells; MIRHG: micro RNA host gene; miRNA: micro RNA; miR: micro RNA; NPC: neural progenitor cell; pGSCs: proneural glioblastoma stem cells; PMT: proneural-to-mesenchymal transition; PN: proneural; qRT-PCR: real-time quantitative PCR; RIP: RNA immunoprecipitation; sEVs: small extracellular vesicles; TAM: tumor-associated macrophages; TCGA: the cancer genome atlas; TME: tumor microenvironment; TUNEL: transferase dUTP nick end labeling.
Supplementary Material
Supplementary figures.
Supplementary tables.
Acknowledgements
We are grateful to Dr. Frederick F. Lang and Dr. Krishna P.L. Bhat for providing GSC cell lines used in our study. And we thank Dr. Yufeng Cheng and Jianzhen Wang of Department of Radiation Oncology at Qilu Hospital of Shandong University who helped us in radiation.
Funding statement
This work was supported by grants from the National Natural Science Foundation of China (Nos. 82273195; 81874083; 82072776; 82273286; 82072775; 82203419;), Natural Science Foundation of Shandong Province of China (Nos. ZR2019BH057; ZR2020QH174; ZR2021LSW025), the Jinan Science and Technology Bureau of Shandong Province (2021GXRC029), Key Clinical Research Project of Clinical Research Center of Shandong University (2020SDUCRCA011) and Taishan Pandeng Scholar Program of Shandong Province (No. tspd20210322).
Author contributions
YF, ZJG, JYX, XG and GL designed this work. HZW, BYL, ML and HX integrated and analyzed the data. YF, ZJG, JYX and QDG performed experiments. YHQ, SLZ, WQ, ZWP and QTW were responsible for clinical sample collection and sample delivery. YF, ZJG, and JYX wrote this manuscript. HX, RRZ, XG and GL edited and revised the manuscript. All authors read and approved this manuscript. The work reported in the paper has been performed by the authors unless clearly specified in the text.
Data availability statement
The publicly available datasets applied in this research are listed in the manuscript. Our local sequencing data have been deposited in the GEO (GSE211554, GSE213310). Other data that support the findings of this study are available from the corresponding author upon request.
Ethics statement
The research related to human use complied with all the relevant national regulations and institutional policies; the study was performed in accordance with the tenets of the Helsinki Declaration and was approved by the ethical committee of Qilu Hospital. All animal experiments were approved by the Institutional Animal Care and Use Committee (IACUC) of Shandong University (Jinan, China).
Competing Interests
The authors have declared that no competing interest exists.
References
1. Ostrom QT, Gittleman H, Truitt G, Boscia A, Kruchko C, Barnholtz-Sloan JS. CBTRUS Statistical Report: Primary Brain and Other Central Nervous System Tumors Diagnosed in the United States in 2011-2015. Neuro Oncol. 2018;20:iv1-iv86
2. Tan AC, Ashley DM, Lopez GY, Malinzak M, Friedman HS, Khasraw M. Management of glioblastoma: State of the art and future directions. CA Cancer J Clin. 2020;70:299-312
3. Ostrom QT, Cote DJ, Ascha M, Kruchko C, Barnholtz-Sloan JS. Adult Glioma Incidence and Survival by Race or Ethnicity in the United States From 2000 to 2014. JAMA Oncol. 2018;4:1254-1262
4. Gimple RC, Bhargava S, Dixit D, Rich JN. Glioblastoma stem cells: lessons from the tumor hierarchy in a lethal cancer. Genes Dev. 2019;33:591-609
5. Wang Q, Hu B, Hu X, Kim H, Squatrito M, Scarpace L. et al. Tumor Evolution of Glioma-Intrinsic Gene Expression Subtypes Associates with Immunological Changes in the Microenvironment. Cancer Cell. 2018;33:152
6. Phillips HS, Kharbanda S, Chen R, Forrest WF, Soriano RH, Wu TD. et al. Molecular subclasses of high-grade glioma predict prognosis, delineate a pattern of disease progression, and resemble stages in neurogenesis. Cancer Cell. 2006;9:157-173
7. Bhat KPL, Balasubramaniyan V, Vaillant B, Ezhilarasan R, Hummelink K, Hollingsworth F. et al. Mesenchymal differentiation mediated by NF-kappaB promotes radiation resistance in glioblastoma. Cancer Cell. 2013;24:331-346
8. Galli R, Binda E, Orfanelli U, Cipelletti B, Gritti A, De Vitis S. et al. Isolation and characterization of tumorigenic, stem-like neural precursors from human glioblastoma. Cancer Res. 2004;64:7011-7021
9. Lathia JD, Mack SC, Mulkearns-Hubert EE, Valentim CL, Rich JN. Cancer stem cells in glioblastoma. Genes Dev. 2015;29:1203-1217
10. Wang L, Babikir H, Muller S, Yagnik G, Shamardani K, Catalan F. et al. The Phenotypes of Proliferating Glioblastoma Cells Reside on a Single Axis of Variation. Cancer Discov. 2019;9:1708-1719
11. Minata M, Audia A, Shi J, Lu S, Bernstock J, Pavlyukov MS. et al. Phenotypic Plasticity of Invasive Edge Glioma Stem-like Cells in Response to Ionizing Radiation. Cell Rep. 2019;26:1893-1905 e1897
12. Pine AR, Cirigliano SM, Nicholson JG, Hu Y, Linkous A, Miyaguchi K. et al. Tumor Microenvironment Is Critical for the Maintenance of Cellular States Found in Primary Glioblastomas. Cancer Discov. 2020;10:964-979
13. Jin X, Kim LJY, Wu Q, Wallace LC, Prager BC, Sanvoranart T. et al. Targeting glioma stem cells through combined BMI1 and EZH2 inhibition. Nat Med. 2017;23:1352-1361
14. Zhang Z, Xu J, Chen Z, Wang H, Xue H, Yang C. et al. Transfer of MicroRNA via Macrophage-Derived Extracellular Vesicles Promotes Proneural-to-Mesenchymal Transition in Glioma Stem Cells. Cancer Immunol Res. 2020;8:966-981
15. Chen Z, Wang H, Zhang Z, Xu J, Qi Y, Xue H. et al. Cell surface GRP78 regulates BACE2 via lysosome-dependent manner to maintain mesenchymal phenotype of glioma stem cells. J Exp Clin Cancer Res. 2021;40:20
16. Quail DF, Joyce JA. Microenvironmental regulation of tumor progression and metastasis. Nat Med. 2013;19:1423-1437
17. Sottoriva A, Spiteri I, Piccirillo SG, Touloumis A, Collins VP, Marioni JC. et al. Intratumor heterogeneity in human glioblastoma reflects cancer evolutionary dynamics. Proc Natl Acad Sci U S A. 2013;110:4009-4014
18. Varn FS, Johnson KC, Martinek J, Huse JT, Nasrallah MP, Wesseling P. et al. Glioma progression is shaped by genetic evolution and microenvironment interactions. Cell. 2022;185:2184-2199 e2116
19. Xuan W, Lesniak MS, James CD, Heimberger AB, Chen P. Context-Dependent Glioblastoma-Macrophage/Microglia Symbiosis and Associated Mechanisms. Trends Immunol. 2021;42:280-292
20. Kalluri R, LeBleu VS. The biology, function, and biomedical applications of exosomes. Science. 2020 367
21. Morrissey SM, Zhang F, Ding C, Montoya-Durango DE, Hu X, Yang C. et al. Tumor-derived exosomes drive immunosuppressive macrophages in a pre-metastatic niche through glycolytic dominant metabolic reprogramming. Cell Metab. 2021;33:2040-2058 e2010
22. Lan J, Sun L, Xu F, Liu L, Hu F, Song D. et al. M2 Macrophage-Derived Exosomes Promote Cell Migration and Invasion in Colon Cancer. Cancer Res. 2019;79:146-158
23. Slack FJ, Chinnaiyan AM. The Role of Non-coding RNAs in Oncology. Cell. 2019;179:1033-1055
24. Guardia GDA, Correa BR, Araujo PR, Qiao M, Burns S, Penalva LOF. et al. Proneural and mesenchymal glioma stem cells display major differences in splicing and lncRNA profiles. NPJ Genom Med. 2020;5:2
25. Liang Q, Guan G, Li X, Wei C, Wu J, Cheng P. et al. Profiling pro-neural to mesenchymal transition identifies a lncRNA signature in glioma. J Transl Med. 2020;18:378
26. Pan Z, Zhao R, Li B, Qi Y, Qiu W, Guo Q. et al. EWSR1-induced circNEIL3 promotes glioma progression and exosome-mediated macrophage immunosuppressive polarization via stabilizing IGF2BP3. Mol Cancer. 2022;21:16
27. Xu J, Zhang J, Zhang Z, Gao Z, Qi Y, Qiu W. et al. Hypoxic glioma-derived exosomes promote M2-like macrophage polarization by enhancing autophagy induction. Cell Death Dis. 2021;12:373
28. Qiu W, Guo X, Li B, Wang J, Qi Y, Chen Z. et al. Exosomal miR-1246 from glioma patient body fluids drives the differentiation and activation of myeloid-derived suppressor cells. Mol Ther. 2021;29:3449-3464
29. Qian M, Chen Z, Guo X, Wang S, Zhang Z, Qiu W. et al. Exosomes derived from hypoxic glioma deliver miR-1246 and miR-10b-5p to normoxic glioma cells to promote migration and invasion. Lab Invest. 2021;101:612-624
30. Sun Q, Hao Q, Prasanth KV. Nuclear Long Noncoding RNAs: Key Regulators of Gene Expression. Trends Genet. 2018;34:142-157
31. Gallinari P, Di Marco S, Jones P, Pallaoro M, Steinkuhler C. HDACs, histone deacetylation and gene transcription: from molecular biology to cancer therapeutics. Cell Res. 2007;17:195-211
32. Hai R, He L, Shu G, Yin G. Characterization of Histone Deacetylase Mechanisms in Cancer Development. Front Oncol. 2021;11:700947
33. Zhan X, Guo S, Li Y, Ran H, Huang H, Mi L. et al. Glioma stem-like cells evade interferon suppression through MBD3/NuRD complex-mediated STAT1 downregulation. J Exp Med. 2020 217
34. Song Y, Jiang Y, Tao D, Wang Z, Wang R, Wang M. et al. NFAT2-HDAC1 signaling contributes to the malignant phenotype of glioblastoma. Neuro Oncol. 2020;22:46-57
35. Hara T, Chanoch-Myers R, Mathewson ND, Myskiw C, Atta L, Bussema L. et al. Interactions between cancer cells and immune cells drive transitions to mesenchymal-like states in glioblastoma. Cancer Cell. 2021;39:779-792 e711
36. Day BW, Lathia JD, Bruce ZC, D'Souza RCJ, Baumgartner U, Ensbey KS. et al. The dystroglycan receptor maintains glioma stem cells in the vascular niche. Acta Neuropathol. 2019;138:1033-1052
37. Yin J, Kim SS, Choi E, Oh YT, Lin W, Kim TH. et al. ARS2/MAGL signaling in glioblastoma stem cells promotes self-renewal and M2-like polarization of tumor-associated macrophages. Nat Commun. 2020;11:2978
38. Xu CH, Liu Y, Xiao LM, Chen LK, Zheng SY, Zeng EM. et al. Silencing microRNA-221/222 cluster suppresses glioblastoma angiogenesis by suppressor of cytokine signaling-3-dependent JAK/STAT pathway. J Cell Physiol. 2019;234:22272-22284
39. Baker BJ, Akhtar LN, Benveniste EN. SOCS1 and SOCS3 in the control of CNS immunity. Trends Immunol. 2009;30:392-400
40. Ji XC, Shi YJ, Zhang Y, Chang MZ, Zhao G. Reducing Suppressors of Cytokine Signaling-3 (SOCS3) Expression Promotes M2 Macrophage Polarization and Functional Recovery After Intracerebral Hemorrhage. Front Neurol. 2020;11:586905
41. Van Thillo Q, De Bie J, Seneviratne JA, Demeyer S, Omari S, Balachandran A. et al. Oncogenic cooperation between TCF7-SPI1 and NRAS(G12D) requires beta-catenin activity to drive T-cell acute lymphoblastic leukemia. Nat Commun. 2021;12:4164
42. Zhang S, Zhao S, Qi Y, Li B, Wang H, Pan Z. et al. SPI1-induced downregulation of FTO promotes GBM progression by regulating pri-miR-10a processing in an m6A-dependent manner. Mol Ther Nucleic Acids. 2022;27:699-717
43. Zhang J, Yao TW, Hashizume R, Hariono S, Barkovich KJ, Fan QW. et al. Combined BRAF(V600E) and MEK blockade for BRAF(V600E)-mutant gliomas. J Neurooncol. 2017;131:495-505
44. Sun Q, Song YJ, Prasanth KV. One locus with two roles: microRNA-independent functions of microRNA-host-gene locus-encoded long noncoding RNAs. Wiley Interdiscip Rev RNA. 2021;12:e1625
45. Han M, Wang S, Fritah S, Wang X, Zhou W, Yang N. et al. Interfering with long non-coding RNA MIR22HG processing inhibits glioblastoma progression through suppression of Wnt/beta-catenin signalling. Brain. 2020;143:512-530
46. Sun Q, Tripathi V, Yoon JH, Singh DK, Hao Q, Min KW. et al. MIR100 host gene-encoded lncRNAs regulate cell cycle by modulating the interaction between HuR and its target mRNAs. Nucleic Acids Res. 2018;46:10405-10416
47. Xu J, Shao T, Song M, Xie Y, Zhou J, Yin J. et al. MIR22HG acts as a tumor suppressor via TGFbeta/SMAD signaling and facilitates immunotherapy in colorectal cancer. Mol Cancer. 2020;19:51
48. Wang H, Qin R, Cheng Y. LncRNA-Ang362 Promotes Pulmonary Arterial Hypertension by Regulating miR-221 and miR-222. Shock. 2020;53:723-729
49. Sun T, Du SY, Armenia J, Qu F, Fan J, Wang X. et al. Expression of lncRNA MIR222HG co-transcribed from the miR-221/222 gene promoter facilitates the development of castration-resistant prostate cancer. Oncogenesis. 2018;7:30
50. Patel AP, Tirosh I, Trombetta JJ, Shalek AK, Gillespie SM, Wakimoto H. et al. Single-cell RNA-seq highlights intratumoral heterogeneity in primary glioblastoma. Science. 2014;344:1396-1401
51. Chen Z, Wang S, Li HL, Luo H, Wu X, Lu J. et al. FOSL1 promotes proneural-to-mesenchymal transition of glioblastoma stem cells via UBC9/CYLD/NF-kappaB axis. Mol Ther. 2022;30:2568-2583
52. Chen R, Zhang M, Zhou Y, Guo W, Yi M, Zhang Z. et al. The application of histone deacetylases inhibitors in glioblastoma. J Exp Clin Cancer Res. 2020;39:138
53. Singh MM, Johnson B, Venkatarayan A, Flores ER, Zhang J, Su X. et al. Preclinical activity of combined HDAC and KDM1A inhibition in glioblastoma. Neuro Oncol. 2015;17:1463-1473
54. Fraga MF, Ballestar E, Villar-Garea A, Boix-Chornet M, Espada J, Schotta G. et al. Loss of acetylation at Lys16 and trimethylation at Lys20 of histone H4 is a common hallmark of human cancer. Nat Genet. 2005;37:391-400
55. Li X, Sun L, Wang X, Wang N, Xu K, Jiang X. et al. A Five Immune-Related lncRNA Signature as a Prognostic Target for Glioblastoma. Front Mol Biosci. 2021;8:632837
56. Wang Y, Zhang H, Liu C, Wang Z, Wu W, Zhang N. et al. Immune checkpoint modulators in cancer immunotherapy: recent advances and emerging concepts. J Hematol Oncol. 2022;15:111
57. Zhang H, Zhang N, Wu W, Zhou R, Li S, Wang Z. et al. Machine learning-based tumor-infiltrating immune cell-associated lncRNAs for predicting prognosis and immunotherapy response in patients with glioblastoma. Brief Bioinform. 2022 23
58. Fisher RC, Scott EW. Role of PU.1 in hematopoiesis. Stem Cells. 1998;16:25-37
59. Moreau-Gachelin F, Tavitian A, Tambourin P. Spi-1 is a putative oncogene in virally induced murine erythroleukaemias. Nature. 1988;331:277-280
60. Zuo F, Zhang Y, Li J, Yang S, Chen X. Long noncoding RNA NR2F1-AS1 plays a carcinogenic role in gastric cancer by recruiting transcriptional factor SPI1 to upregulate ST8SIA1 expression. Bioengineered. 2021;12:12345-12356
61. Gao N, Ye B. SPI1-induced upregulation of lncRNA SNHG6 promotes non-small cell lung cancer via miR-485-3p/VPS45 axis. Biomed Pharmacother. 2020;129:110239
Author contact
![]() Corresponding authors: Gang Li, e-mail: dr.ligangedu.cn. Xing Guo, e-mail: gxingqlhospitaledu.cn.
Corresponding authors: Gang Li, e-mail: dr.ligangedu.cn. Xing Guo, e-mail: gxingqlhospitaledu.cn.