Impact Factor
 Global reach, higher impact
Theranostics 2024; 14(1):436-450. doi:10.7150/thno.90322 This issue Cite
Research Paper
Vitamin D binding protein (VDBP) hijacks twist1 to inhibit vasculogenic mimicry in hepatocellular carcinoma
Lu-ning Qin1, Heng Zhang1,2, ![]() , Qing-qing Li1, Ting Wu1, Shan-bin Cheng1,2, Kai-wen Wang1,2, Yue Shi1, Hao-ran Ren1, Xue-wu Xing3,
, Qing-qing Li1, Ting Wu1, Shan-bin Cheng1,2, Kai-wen Wang1,2, Yue Shi1, Hao-ran Ren1, Xue-wu Xing3, ![]() , Cheng Yang1,
, Cheng Yang1, ![]() , Tao Sun1,
, Tao Sun1, ![]()
1. State Key Laboratory of Medicinal Chemical Biology and College of Pharmacy, Nankai University, Tianjin, China.
2. Tianjin International Joint Academy of Biomedicine, Tianjin, China.
3. Department of Orthopedics, Tianjin First Central Hospital, Tianjin, China.
Received 2023-9-19; Accepted 2023-11-17; Published 2024-1-1
Abstract

Rationale: Vitamin D (VD) has been suggested to have antitumor effects, however, research on the role of its transporter vitamin D-binding protein (VDBP, gene name as GC) in tumors is limited. In this study, we demonstrated the mechanism underlying the inhibition of vasculogenic mimicry (VM) by VDBP in hepatocellular carcinoma (HCC) and proposed an anti-tumor strategy of combining anti-PD-1 therapy with VD.
Methods: Three-dimensional cell culture models and mice with hepatocyte-specific GC deletion were utilized to study the correlation between VDBP expression and VM. A patient-derived tumor xenograft (PDX) model was further applied to validate the therapeutic efficacy of VD in combination with an anti-PD-1 drug.
Results: The study revealed that VDBP expression is negatively correlated with VM in HCC patients and elevated VDBP expression is associated with a favorable prognosis. The mechanism studies suggested VDBP hindered the binding of Twist1 on the promoter of VE-cadherin by interacting with its helix-loop-helix DNA binding domain, ultimately leading to the inhibition of VM. Furthermore, VD facilitated the translocation of the vitamin D receptor (VDR) into the nucleus where VDR interacts with Yin Yang 1 (YY1), leading to the transcriptional activation of VDBP. We further demonstrated that the combination of VD and anti-PD-1 led to an improvement in the anti-tumor efficacy of an anti-PD-1 drug.
Conclusion: Collectively, we identified VDBP as an important prognostic biomarker in HCC patients and uncovered it as a therapeutic target for enhancing the efficacy of immune therapy.
Keywords: VDBP, HCC, VM, VDR, YY1
Introduction
The vitamin D binding protein (VDBP) is well known for its role in transporting the VD metabolites 25OHD and 1,25OHD in vivo and maintaining their balance during bone metabolism. Over the years, VDBP has been revealed to also be closely associated with malignancies, including breast, prostate, pancreatic, lung, colorectal, and basal cell cancers, as well as cutaneous melanoma [1, 2]. VDBP, a member of the albumin superfamily of binding proteins (albumin, methemoglobin, alpha-albumin/alfamin), is mainly expressed in the liver [3, 4], and can potentially affect the level of vitamin D metabolites, which may result in the development of disease [5]. However, there is limited literature concerning the role of VDBP in hepatocellular carcinoma (HCC), and their correlation is not yet clear. In this work, we found, by immunohistochemical (IHC) analysis of 96 clinical HCC patients combined with TCGA database analysis, that VDBP is lowly expressed in HCC but highly expressed in adjacent normal tissues. Moreover, the expression of VDBP is negatively correlated with a more advanced clinical grade and stage of HCC. The main function of VDBP is related to macrophage activation and neutrophil chemotaxis, which are involved in immune regulation. In addition, its circulating concentration may also be associated with inflammatory regulation [6-8]. VDBP has previously been reported to also have functions unrelated to VD transport, including binding of fatty acids and actin monomers, which is released in large amounts outside the vasculature by cell death and inhibits the occlude of vasculature caused by the F-actin network. Here, we report a novel function of VDBP, which interacts with Twist1, a key epithelial-mesenchymal transition (EMT) transcription factor, to inhibit vasculogenic mimicry (VM), a form of angiogenesis found in many malignancies that is not dependent on vascular endothelial cells in HCC [9]. VM is commonly found in highly aggressive, highly metastatic, and advanced malignancies and usually suggests poor prognosis for patients [10]. Vessels formed during VM consist of an arrangement of tumor cells with endothelial cell characteristics, these tubes deliver nutrients and oxygen-carrying red blood cells to the tumor [11], in which the presence of CD31/CD34-negative and PAS-positive cells and red blood cells are usually used as identification criteria for VM [12, 13]. The expression of the transcription factor Twist1 is upregulated in tumor cells during VM, leading to the downregulation of the tight junction protein E-cadherin between epithelial cells and the significant upregulation of the VM-associated molecule VE-cadherin, which plays an extraordinarily crucial role in VM [14]. Meanwhile, cancer cells produce large amounts of matrix metalloproteinases (MMPs) for the degradation of extracellular matrix components and basement membrane, providing space for VM and reducing resistance to cellular morphological changes during VM thereby promoting the invasiveness of tumor cells [15, 16]. Twist1 has been reported to directly bind to the promoter region of VE-cadherin, a key marker of VM, to activate VE-cadherin expression to promote VM [17]. It was found in the study that VDBP binding to Twist1 inhibits the binding of Twist1 to the VE-cadherin promoter, thus suppressing VM.
There is increasing clinical evidence proving that VD plays an important role in anti-tumor mechanisms [18]; VD supplementation has been associated with reduced cancer mortality [19]. The biological function of VD is mainly achieved by binding to the vitamin D receptor VDR. The VD-VDR complex binds to the vitamin D response element (VDRE) on the promoter of target genes to regulate gene expression [20]. The VD-VDR signaling pathway is associated with the development of liver disease, and is an important factor driving the inflammatory process and liver injury [21], its deficiency is associated with the severity of liver disease [22]. In this study, we revealed a novel anti-tumor mechanism of the VD-VDR axis through the regulation of VDBP levels, providing new insights into the field of oncology research.
Cancer immunotherapy has drawn increasing attention in the field of oncology, and antibodies targeting the PD-1/PD-L1 pathway have been widely recognized [23]. However, PD-1/PD-L1 blockade still has response rates below 40% in most cancer types [24] and is also limited by the lack of known biomarkers, immune-related toxicity, as well as innate and acquired drug resistance. Combination therapies are expected to address these limitations [23], but the occurrence of related serious adverse events (AEs) needs to be mitigated [25]. Finding new drug combinations is currently one of the most promising antitumor approaches. We proposed an anti-tumor strategy of combining anti-PD-1 therapy with VD and validated the anti-cancer effect of VD-boosted PD-1 blockade on a patient-derived xenograft (PDX) model. Our findings provide a new option for developing more effective and less toxic anti-PD-1 immunotherapies.
Results
VDBP expression is correlated with HCC prognosis and VM
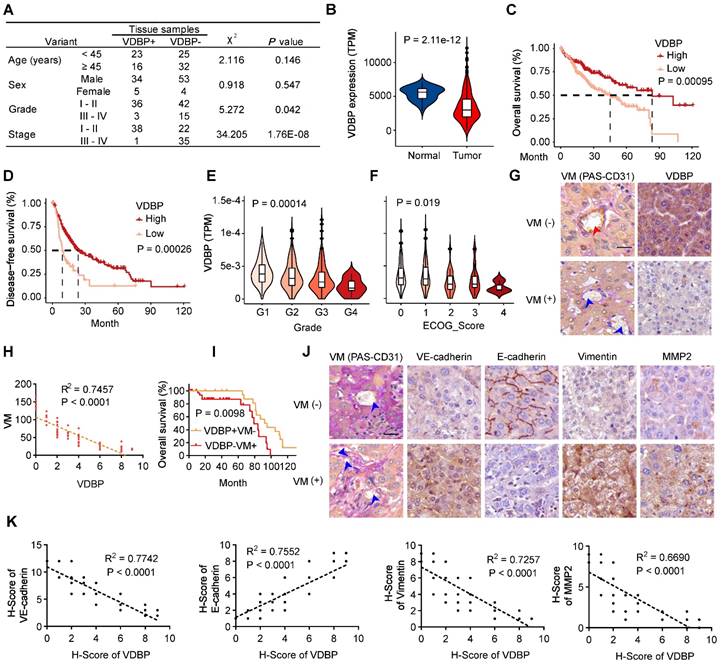
To investigate the role of VDBP in HCC, we first analyzed the correlation between VDBP expression and clinical grade and stage by IHC staining in tumor tissues of 96 HCC patients, as shown in Figure 1A, VDBP was lowly expressed in advanced grades and stages and significantly elevated in the early stage of tumorigenesis. To obtain more clinical information about VDBP, we further analyzed the correlation between VDBP expression and HCC in the TCGA database, consistently, the mRNA expression of VDBP was significantly higher in adjacent normal tissue compared with tumor tissue (Figure 1B). Furthermore, high VDBP expression was positively associated with longer overall and disease-free survival (Figure 1C-D), as well as with earlier clinicopathological grading (Figure 1E), and lower ECOG scores (Figure 1F) in patients with HCC. Next, we classified the tissues of 75 HCC patients into VM (+) and VM (-) groups by CD31-PAS double staining based on the number of VMs in the pathological tissues. Together with the IHC staining analysis of VDBP, we found that the VDBP expression was negatively correlated with the number of VMs (Figure 1G-H). We then further divided the patients into VDBP (-) VM (+) and VDBP (+) VM (-) groups, and survival analysis suggested that patients in the VDBP (+) VM (-) group had a significantly longer survival (Figure 1I). Subsequently, we performed IHC staining analysis of VM-related markers, including VM markers VE-cadherin, Fibronectin 1 (FN1), SERPINE2, tumor microenvironment markers MMP2 and MMP9, epithelial cell marker E-cadherin and mesenchymal cell marker vimentin (Figure 1J-K and Figure S1A-B). The co-expression analysis showed that VDBP expression was negatively correlated with the expression of the VM, tumor microenvironment, and mesenchymal cell markers, whereas it was positively correlated with the epithelial marker. Collectively, the above results suggest that a high VDBP expression is closely associated with a favorable clinical prognosis of HCC and that VDBP is involved in regulating the formation of VM.
VDBP expression is correlated with HCC prognosis and VM. (A) Correlation between VDBP expression and clinicopathologic characteristics of patients with 95 case of HCC patients by chi-square test. (B) mRNA expression level (TPM) of VDBP in normal and tumor tissues of HCC in the TCGA dataset. (C and D) Kaplan-Meier curves showing the percentage of the overall survival (C) and disease-free survival (D) with higher and lower expression of VDBP in HCC from the TCGA dataset. (E) VDBP mRNA expression level (TPM) with different Grade (G1-G4) in the TCGA dataset. One-way ANOVA and Tukey's multiple comparisons test was used (F) VDBP mRNA expression level (TPM) with different ECOG score (0-4) in the TCGA dataset. One-way ANOVA and Tukey's multiple comparisons test was used. (G) IHC staining of VDBP expression in VM (-) (the number of VMs less than 10) and VM (+) (the number of VMs equal to or more than 10) HCC samples. Representative images of CD31-PAS co-staining and VDBP IHC staining are shown on the left and right respectively. The location of the endothelial-dependent vessels (both positive for CD31 and PAS) was indicated with a red arrow and the location of the VM (positive for PAS and negative for CD31) was indicated with a blue arrow. Scale bar, 40 µm. (H) Correlation analysis of VDBP and VM. (n = 75). Statistics were calculated on biological replicates with simple linear regression. (I) Kaplan-Meier curve of the overall survival rate of HCC patients with VDBP/VM (+/-: n = 23; -/+: n = 39). (J) Representative images of CD31-PAS co-staining and IHC staining of VE-cadherin, E-cadherin, Vimentin, MMP2 proteins in VM (-) and VM (+) HCC samples. The location of the VM (positive for PAS and negative for CD31) was indicated with a blue arrow. Scale bar,40 µm. (K) Correlation analysis of VDBP with VE-cadherin, E-cadherin, Vimentin, and MMP2, respectively. n = 75. Statistics were calculated on biological replicates with simple linear regression.
VM is regulated by VDBP in HCC
We aimed to further investigate the correlation between VDBP expression levels and the ability of VM formation in HCC cells. Initially, we examined the expression levels of VDBP in four HCC cell lines, including MHCC-97H, Huh-7, SNU-387, and PLC-PRF-5 through immunofluorescence (IF) staining. We found that the fluorescence intensity of VDBP was significantly stronger in SNU-387 and PLC-PRF-5 cells than in MHCC-97H and Huh-7 cells. Particularly, PLC-PRF-5 cells exhibited the strongest VDBP fluorescence intensity, whereas the weakest was observed in MHCC-97H cells (Figure 2A-B). The immunoblotting results of VDBP in the four cell lines were consistent with the IF results (Figure 2C). Subsequently, we evaluated the VM formation ability of these four cell lines using the classic three-dimensional cell culture model. We recorded the formation process of VM through live cell imaging and counted the number of VMs formed by each cell line using the established VM evaluation method (Figure 2D-E), and also drew the change curves of VM-related features including node and total length for 60 h to further evaluate the VM formation ability based on our new established methodology [26] (Figure 2E). The results showed that MHCC-97H cells formed the most VMs; the VM-related features, number of nodes, and total length continuously increased within 60 h. Huh-7 cells formed fewer VMs than MHCC-97H cells, and the number of nodes increased slowly within 60 h, while the total length reached its peak at 14 h and then sharply decreased. SNU-387 cells formed fewer VMs, and their VM-related features increased slowly within 60 h. PLC-PRF-5 cells formed the least VMs, and neither the number of nodes nor total length showed an increasing trend. Our results suggested that MHCC-97H cells have the strongest ability to form VMs, while SNU-387 cells are less likely to form VMs, and PLC-PRF-5 cells have the weakest ability to form VMs. This was consistent with the expression level of VDBP in these four cell lines, indicating that cell lines with low expression of VDBP have a stronger ability to form VMs. To further investigate the regulation of VM by VDBP in cells, we overexpressed VDBP in the MHCC-97H cell line, which has low VDBP expression and strong VM-forming ability, and knocked out VDBP in SNU-387 cells, which have high VDBP expression and weak VM-forming ability, to evaluate their ability to form VM (Figure 2F-G). The results showed that overexpression of VDBP significantly reduces the ability of MHCC-97H to form VM, while knocking out VDBP remarkably enhances the ability of SNU-387 to form VM. qPCR results also showed a significant downregulation of VM-related markers, including CDH5, MMP2, and MMP9, and a significant upregulation of the epithelial cell marker E-cadherin in cells overexpressing VDBP. Conversely, knocking out VDBP resulted in a remarkable increase in VM marker expression and a notable decrease in E-cadherin expression (Figure 2H). Consistently, Western blot analysis showed similar results (Figure 2I), indicating that VDBP inhibits the formation of VM in cells.
VM is regulated by VDBP in HCC. (A-B) Representative images (A) and quantification of florescence intensity (B) of VDBP immunofluorescence staining in MHCC-97H, Huh-7, SNU-387 and PLC-PRF-5 cells. Scale bar, 5 µm. n = 8, biological replicates. Statistics were calculated on biological replicates with two-tailed unpaired t-tests, **P < 0.01, ***P < 0.001, compared with the MHCC-97H group. Error bars show mean with SD. (C) Western blot analysis of VDBP expression level in MHCC-97H, Huh-7, SNU-387 and PLC-PRF-5 cells. (D and E) Matrigel 3D culture as an in vitro model to study VM formation. Representative plots of VM status of MHCC-97H, HUH-7, SNU-387 and PLC-PRF-5 cells at 0, 30, 120 and 240 min (D) and quantitative plots of the three measured parameters for the four groups of cells (E). The median time point of live cell imaging (30 h) was firstly selected for traditional VM statistics (Tubes), and VM-related parameters (Nodes and Total length) variation curves for 60h were analyzed by AngiogenesisAnalyzer.ijm, AutomaticMeasure.ijm, and VM.R codes. Scale bar, 200 µm. (F and G) Representative plots of VM status of MHCC-97H and SNU-387 treated as indicated at 0, 30, 120 and 240 min (F) and quantitative plots of the three measured parameters for the four groups of cells (G). Scale bar, 200 µm. ***P < 0.001, compared with the oe vector group. ###P < 0.001, compared with the ko vector group. (H) The levels of CDH1, CDH5, MMP2 and MMP9 mRNA were detected by RT-qPCR in MHCC-97H (top) and SNU-387 cells (bottom) with Matrigel 3D culture treated as indicated. n = 3, biological replicates. Statistics were calculated on biological replicates with two-tailed unpaired t-tests, *P < 0.05, **P < 0.01, ***P < 0.001, compared with the oe vector group (top), compared with the ko vector group (bottom). Error bars show mean with SD. (I) The levels of VM related proteins were detected by western blot in MHCC-97H and SNU-387 cells with Matrigel 3D culture treated as indicated. (J and K) Fluorescent gelatin degradation and phalloidin/DAPI staining of MHCC-97H and SNU-387 cells treated as indicated (J) and quantification of degradation area (K). Scale bar, 50 µm. n = 6, biological replicates. Statistics were calculated on biological replicates with two-tailed unpaired t-tests, ***P < 0.001, compared with the vector group. Error bars show mean with SD. (L and M) Representative in vivo images (L) of MHCC-97H/SNU-387-luc-tumor-bearing-BALB/c-nude mice with indicated treatments and quantified values (M) are shown as relative luciferase activity (photons/area). n = 6, biological replicates. Statistics were calculated on biological replicates with two-tailed unpaired t-tests, ***P < 0.001, compared with the oe.vector group. ###P < 0.001, compared with the ko vector group. Error bars show mean with SD. (N) Kaplan-Meier curves showing percentage of survival of MHCC-97H/SNU-387-luc-tumor-bearing-BALB/c-nude mice after indicated treatments. *P < 0.05, compared with the oe vector group. ##P < 0.01, compared with the ko vector group. (O) Quantification of pathological score of IHC staining of E-cadherin, VE-cadherin, MMP2 and MMP9 in liver tissues of MHCC-97H/SNU-387-luc-tumor-bearing-BALB/c-nude mice. Scale bar, 40 µm. n = 6, biological replicates. Statistics were calculated on biological replicates with two-tailed unpaired t-tests, *P < 0.05, **P < 0.01, ***P < 0.001, compared with the oe vector group. #P < 0.05, ##P < 0.01, ###P < 0.001, compared with the ko vector group. Error bars show mean with SD. (P) Representative images of PAS-CD31 co-staining on liver tissues of mice created using Cre-lox technology with a hepatocyte-specific GC deletion by backcrossing GCflox/flox mice to Alb-Cre mice. Scale bar, 40 µm. (Q) Kaplan-Meier curves showing percentage of survival of GCflox/flox mice and GCflox/floxAlbcremice. **P < 0.01, compared with the GCflox/flox group.
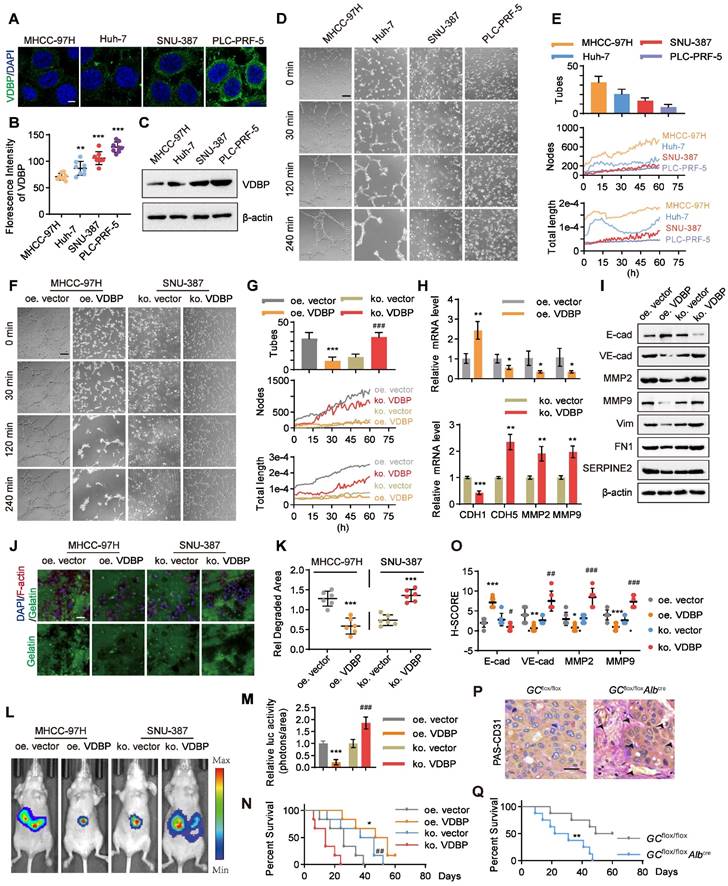
Given that VM is a manifestation of tumor cell evolution and EMT [27], we sought to examine the potential of VDBP to impede migration and invasion of HCC cells. To this end, we conducted fluorescent gelatin degradation assays on MHCC-97H and SNU-387 cells, wherein VDBP was either overexpressed or knocked out, as shown in Figure 2J-K. Our findings indicated that overexpression of VDBP significantly curtails the migration and invasion capacity of HCC cells in degrading gelatin, whereas VDBP knockout promotes these behaviors. To further investigate the matter, we established an in vivo model of liver orthotopic transplantation. The results suggested that overexpression of VDBP effectively suppresses tumor growth and considerably extends the survival of mice. Conversely, the knockout of VDBP resulted in the promotion of tumor growth and a shorter survival time in mice (Figure 2L-N). The IHC staining results of mouse tumor tissues further revealed a noteworthy decrease in VM-related markers and a significant increase in the epithelial marker E-cadherin following VDBP overexpression, with the opposite trend observed after VDBP knockout (Figure 2O and Figure S2). Based on the hepatocyte-specific GC deletion mouse model, we found more VMs in the liver of the GC knockout mice group than in the control group (Figure 2P). Furthermore, a significantly shorter survival was observed in mice with GC deletion (Figure 2Q). In conclusion, VDBP exhibited the potential to impede VM, thereby inhibiting the progression of HCC in vitro and in vivo.
VDBP interacts with Twist1 to inhibit Twist1-activated VE-cadherin transcription
We further used a three-dimensional cell culture model of MHCC-97H cells with overexpression of VDBP to investigate the regulation of VM by VDBP in HCC. Through a pull-down experiment, in conjunction with MS analysis, we identified Twist1, a crucial transcription factor that promotes both VM and EMT processes, as the protein that interacts with VDBP (Figure 3A).
GC interacts with Twist1 to inhibit Twist1-activated VE-cadherin transcription. (A) Silver staining of proteins acquired by FLAG-VDBP pull-down in cell lysis from MHCC-97H cells with Matrigel 3D culture. (B) Co-immunoprecipitation assays in MHCC-97H cells on Matrigel 3D culture with anti-VDBP followed by immunoblotting (IB) with antibodies against Twist1 and VDBP or with anti-Twist1 followed by IB with anti-Twist1 and VDBP. (C) Brightfield pictures (left) and fluorescent pictures of PLA assays with VDBP and Twist1 (right) in Twist1-negative cell (SNU-387) and Twist1-positive cell (SK-HEP-1) with Matrigel 3D culture. Scale bar, 40 µm for black and 5 µm for white. (D) Quantification graph of PLA signal per cell. n = 6, biological replicates. Statistics were calculated on biological replicates with two-tailed unpaired t-tests, ***P < 0.001. Error bars show mean with SD. (E) Visualization result of simulation docking between VDBP and Twist1. (F) Schematic diagram of full-length and truncated VDBP proteins. (G) Western blot analysis of Twist1 expression level in MHCC-97H cells with Matrigel 3D culture treated as indicated. (H) The transcriptional regulation of VE-cadherin by transfection of Twist1 and increasing VDBP plasmids detected with the dual-luciferase reporter assay. n = 6, biological replicates. Statistics were calculated on biological replicates with two-tailed unpaired t-tests, ***P < 0.001, compared with vector group, ##P < 0.01, ###P < 0.001, compared with the transfection of Twist1 alone group. Error bars show mean with SD. (I) Results of qPCR after Twist1 ChIP of CDH5 target gene in MHCC-97H cells with Matrigel 3D culture treated as indicated. n = 3, biological replicates. Statistics were calculated on biological replicates with two-tailed unpaired t-tests, **P < 0.01, ns, not significant, compared with the control group. Error bars show mean with SD. (J) The levels of CDH5 mRNA were detected by RT-qPCR in MHCC-97H cells with Matrigel 3D culture treated as indicated. n = 3, biological replicates. Statistics were calculated on biological replicates with two-tailed unpaired t-tests, ***P < 0.001, ns, not significant, compared with the control group. Error bars show mean with SD. (K) The levels of VM related proteins were detected by western blot in MHCC-97H cells with Matrigel 3D culture treated as indicated.
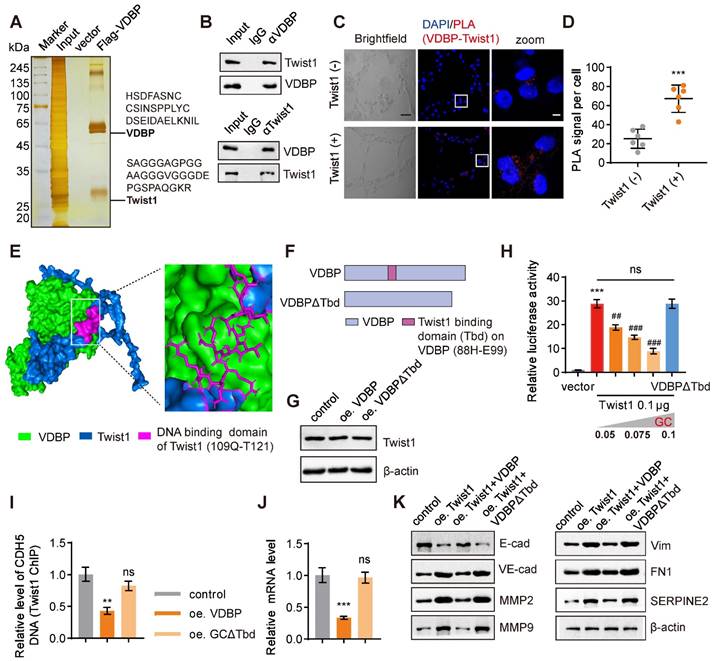
Previous studies have indicated that Twist1 can directly bind to the promoter region of VE-cadherin and activate its expression, hereby promoting VM formation [17]. The interaction between VDBP and Twist1 was further verified by a Co-IP experiment (Figure 3B). Subsequently, we detected the interaction between VDBP and Twist1 in cells exhibiting varying levels of Twist1 expression using a proximity ligation assay (PLA). Our findings indicated a significant increase in the interaction between VDBP and Twist1 in cells with high Twist1 expression (Figure 3C-D). The interaction sites between VDBP and Twist1 were found by computer simulation docking technology; VDBP exhibited binding affinity towards the main domain responsible for DNA binding of Twist1 (109Q-T121) [28] (Figure 3E). It was thus reasoned that the VDBP-Twist1 interaction may have an impact on the gene-regulatory function of Twist1. To investigate the effect of the interaction between VDBP and Twist1, we deleted the 88H-E99 fragment on VDBP that interacts with the Twist1 DNA binding domain and constructed VDBPΔTbd as a negative control (Figure 3F). Subsequently, we overexpressed VDBP or VDBPΔTbd in a three-dimensional cell culture of cells with high expression of Twist1 and detected the changes in Twist1 content through western blot, and found that neither overexpression of VDBP nor VDBPΔTbd affected the expression of Twist1 (Figure 3G). We further studied the role of VDBP in the Twist1-mediated expression of VE-cadherin. As shown in Figure 3H, the presence of VDBP seemed to inhibit the transcription of VE-cadherin, while VDBPΔTbd did not seem to have any repressive influence on Twist1-induced CDH5 luciferase expression. Furthermore, CHIP-qPCR results demonstrated that VDBP inhibited Twist1 binding to the CDH5 promoter (Figure 3I) and suppressed the mRNA expression level of VE-cadherin (Figure 3J). The expression of VM-related markers was upregulated by Twist1, while VDBP overexpression restored this process (Figure 3K). These results suggest that VDBP hijacks Twist1 upon interaction and inhibits the transcriptional activation of Twist1-induced VE-cadherin.
VDBP hijacks Twist1 to inhibit VM and suppresses HCC progression
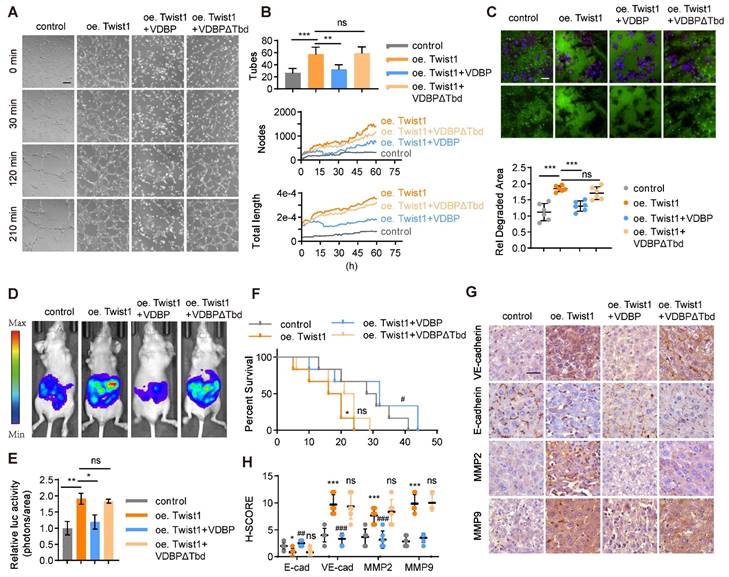
A three-dimensional cell culture of MHCC-97H was conducted to study the impact of VDBP hijacking Twist1 on the function of HCC. Our findings indicated that Twist1 overexpression enhances VM formation and that VDBP supplementation could reverse this process (Figure 4A-B). Additionally, we found that VDBP inhibited Twist1-induced migration and invasion in HCC cells (Figure 4C). Furthermore, we established an in vivo liver orthotopic transplantation model, which showed that Twist1 overexpression promotes tumor growth in mice, and VDBP supplementation significantly inhibited the Twist1-induced effects and prolonged the survival of mice (Figure 4D-F). Moreover, IHC staining analysis of mouse tumor tissues revealed that VDBP inhibits the expression of VM-related markers induced by Twist1 (Figure 4G-H). These results suggest that VDBP inhibits the formation of VM by hijacking Twist1, thereby suppressing the malignant progression of HCC.
VDBP hijacks Twist1 to inhibit VM and suppresses the malignancy of HCC, supplementing VDBP can weaken the promoting effect of Twist1 on VM and malignant progression in HCC. (A and B) Representative plots of VM status of MHCC-97H cells at 0, 30, 120 and 240 min (A) and quantitative plots of the two measured parameters (B). Scale bar, 200 µm. (C) Fluorescent gelatin degradation and phalloidin/DAPI staining of MHCC-97H cells treated as indicated (top) and quantification of degradation area (bottom). Scale bar, 50 µm. n = 6, biological replicates. Statistics were calculated on biological replicates with two-tailed unpaired t-tests, ***P < 0.001, ns, not significant. Error bars show mean with SD. (D and E) Representative in vivo images (D) of MHCC-97H-luc-tumor-bearing-BALB/c-nude mice with indicated treatments and quantified values (E) are shown as relative luciferase activity (photons/area). n = 6, biological replicates. Statistics were calculated on biological replicates with two-tailed unpaired t-tests, *P < 0.05, **P < 0.01, ns, not significant. Error bars show mean with SD. (F) Kaplan-Meier curves showing percentage of survival of MHCC-97H-luc-tumor-bearing-BALB/c-nude mice after indicated treatments. (G and H) Representative images (G) and quantification of pathological score (H) of IHC staining of VE-cadherin, E-cadherin, MMP2 and MMP9 in liver tissues of MHCC-97H-luc-tumor-bearing-BALB/c-nude mice. Scale bar, 40 µm. n = 6, biological replicates. Statistics were calculated on biological replicates with two-tailed unpaired t-tests, *P < 0.05, ***P < 0.001, compared with Control. ##P < 0.01, ###P < 0.001, ns, not significant. compared with oe Twist1. Error bars show mean with SD.
VD promotes VDBP expression dependent on VDR
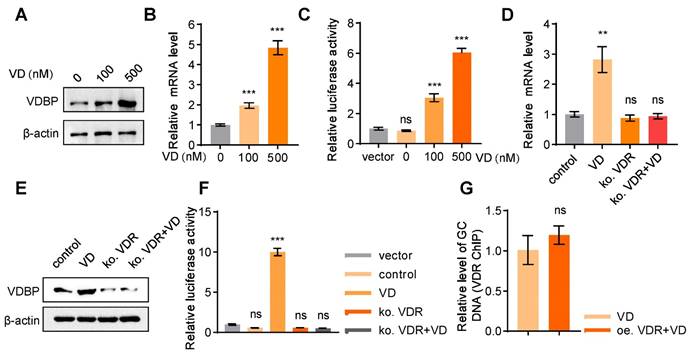
The demonstrated role of VDBP in suppressing HCC prompted further investigation into the regulatory mechanisms of VDBP expression. Treatment with VD resulted in a dose-dependent increase in VDBP protein expression levels in MHCC-97H cells (Figure 5A), which was further supported by consistent findings from the detection of VDBP mRNA expression levels (Figure 5B). Additionally, the activation of GC transcription by VD was observed (Figure 5C). It is well-known that VD functions through the VDR, whereby VD promotes the nuclear translocation of the VDR, which forms a heterodimer with retinoid X receptor (RXR) and binds to the promoter region of target genes to regulate their expressions [29]. Our study revealed that after VDR knockout in MHCC-97H cells, VD has no longer an effect on the protein or mRNA expression levels of VDBP (Figure 5D-E), nor could it activate the transcription of GC (Figure 5F), suggesting that VD exerts its regulatory effects on VDBP through the VDR. As a transcription factor, VDR is capable of binding to vitamin D response elements (VDREs) located in gene promoter regions, thereby regulating gene expression [30]. Nevertheless, the absence of VDREs in the GC promoter region precludes VDR from directly regulating VDBP expression. Moreover, we found that overexpression of VDR could not further promote the binding of VDR to the GC promoter in the presence of VD (Figure 5G), which implied that the VDR may not be a direct factor in VDBP transcriptional activation.
VD promotes VDBP expression dependent on VDR. (A) Western blot analysis of VDBP protein expression level in MHCC-97H cells with Matrigel 3D culture treated with 1,25-hydroxy vitamin D3 for 48 h. (B) The levels of VDBP mRNA were detected by RT-qPCR in MHCC-97H cells with Matrigel 3D culture treated as indicated for 48 h. n = 3, biological replicates. Statistics were calculated on biological replicates with two-tailed unpaired t-tests, ***P < 0.001, compared with Control. Error bars show mean with SD. (C) The transcriptional regulation of VDBP by different concentrations of VD treatment for 48 h detected through the dual-luciferase reporter assay. n = 3, biological replicates. Statistics were calculated on biological replicates with two-tailed unpaired t-tests, ***P < 0.001, ns, not significant. Error bars show mean with SD. (D) The levels of VDBP mRNA were detected by RT-qPCR in MHCC-97H cells with Matrigel 3D culture treated as indicated for 48 h. n = 3, biological replicates. Statistics were calculated on biological replicates with two-tailed unpaired t-tests, **P < 0.01, ns, not significant. Error bars show mean with SD. (E) Western blot analysis of VDBP protein expression level in MHCC-97H cells with Matrigel 3D culture treated as indicated for 48 h. (F) The transcriptional regulation of VDBP by different treatments for 48 h detected through the dual-luciferase reporter assay. n = 3, biological replicates. Statistics were calculated on biological replicates with two-tailed unpaired t-tests, ***P < 0.001, ns, not significant. Error bars show mean with SD. (G) Results of qPCR after VDR ChIP of VDBP target gene in MHCC-97H cells with Matrigel 3D culture treated as indicated for 48 h. n = 3, biological replicates. Statistics were calculated on biological replicates with two-tailed unpaired t-tests, ns, not significant. Error bars show mean with SD.
VDR interacts with YY1 to activate the transcription of VDBP
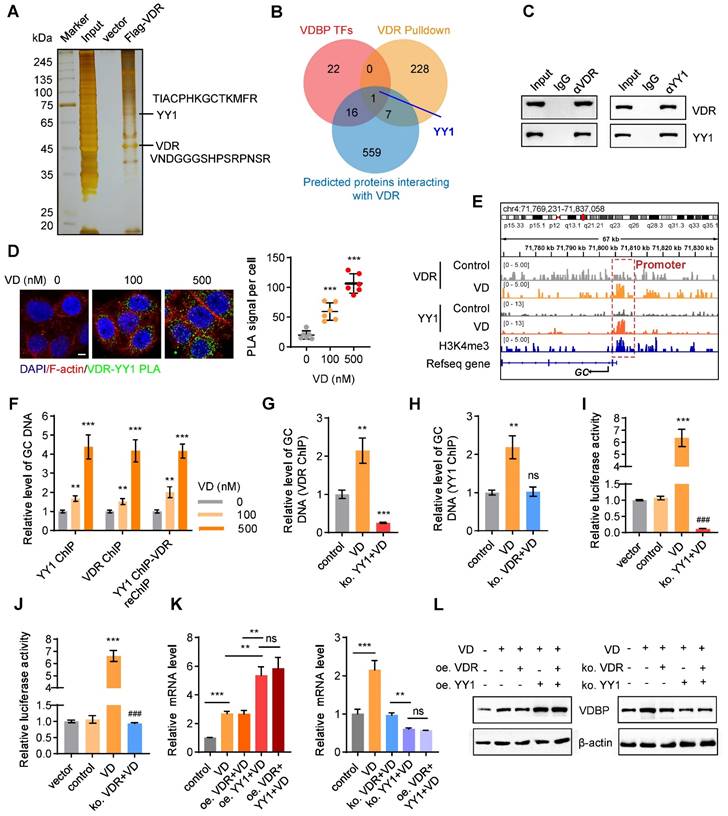
To explore the relevant proteins of the VDR in MHCC-97H cells, we performed pull-down assays followed by MS analysis (Figure 6A). Upon conducting a Venn analysis on the predicted VDBP transcription factors from the Cistrome database, the VDR interacting proteins identified by MS, and the VDR interacting proteins in the FPClass database, the presence of Yin-Yang 1 (YY1) was found (Figure 6B). YY1, belonging to the GLI-Kruppel family of transcription factors, acts as a DNA binding protein and is involved in numerous biological processes, including cell growth, embryonic development, transcriptional regulation, and tumorigenesis [31, 32]. The interaction between the VDR and YY1 was validated through Co-IP and PLA experiments, and an increase in their interaction was observed with an increase in VD dosage (Figure 6C-D). Subsequently, we studied the transcriptional regulation effect of the VDR and YY1 in MHCC-97H cells using CHIP-seq, under DMSO or VD treatment. The results revealed the presence of binding sites upstream of the GC transcriptional starting site (TSS). Enriched YY1 and VDR peaks are displayed in Figure 6E. Notably, following VD treatment, there was a significant increase in YY1 and VDR peak enrichment on the GC promoter, indicating that VD promotes the regulation of VDBP by VDR and YY1. CHIP-qPCR analysis was carried out on MHCC-97H cells treated with different concentrations of VD by using specific antibodies against YY1 or VDR, and the occupancy of YY1 and VDR on the GC promoter was observed which validated the CHIP-seq results (Figure 6F). To study whether YY1 directly binds to the promoter region of GC, we separately knocked out YY1 and VDR in MHCC-97H cells before treatment with VD. CHIP-qPCR was conducted using VDR antibodies in YY1 knockout cells and using YY1 antibodies in VDR knockout cells. YY1 knockout made VD ineffective in promoting the recognition of VDR on the GC promoter which resulted in a significant reduction in its recognition (Figure 6G), and upon VDR knockout, VD was observed to be unsuccessful in promoting the binding of YY1 to the GC promoter, while not affecting its baseline binding level (Figure 6H). These results indicated that YY1 directly binds to the promoter region of GC. To assess the impact of YY1 and VDR on VDBP transcription, we performed a dual-luciferase reporter assay. MHCC-97H cells were transfected with the PGL3-promoter plasmid, which includes the YY1 and VDR binding motifs, either alone or co-transfected with the pcDNA3.1-3× Flag-YY1 plasmid. The results indicated that the activation of transcription of GC by YY1 is facilitated by VD through the VDR (Figure 6I-J). Subsequently, overexpression and knockout of VDR and YY1 were respectively performed in MHCC-97H and SNU-387 cells, and qPCR and western blot analyses were carried out to detect changes in the expression levels of VDBP. It was revealed that in the presence of VD, YY1 overexpression facilitated the transcription and translation of VDBP, whereas the expression levels of VDR did not. Following YY1 knockout, VDBP expression was not enhanced by VD, and simultaneous knockout of VDR and YY1 resulted in VDBP expression levels comparable to those observed in the YY1 knockout group (Figure 6K-L). In conclusion, VD promotes YY1-mediated transcriptional activation of VDBP by promoting the interaction between VDR and YY1.
VDR interacts with YY1 to activate the transcription of VDBP. (A) Silver staining of proteins acquired by Flag-VDR pull-down in nuclear lysis from MHCC-97H cells. (B) Venn diagram for screening YY1. (C) Co-immunoprecipitation assays in MHCC-97H cells with anti-VDR followed by immunoblotting (IB) with antibodies against VDR and YY1 or with anti-YY1 followed by IB with anti- VDR and YY1. (D) Fluorescent pictures (left) and quantification graph (right) of PLA assays with VDR and YY1 in MHCC-97H cells with Matrigel 3D culture with different concentrations of VD. Scale bar, 5 µm. Quantification graph of PLA signal per cell. n = 6, biological replicates. Statistics were calculated on biological replicates with two-tailed unpaired t-tests, ***P < 0.001, compared with the 0 group. Error bars show mean with SD. (E) ChIP-seq peaks at the GC gene after VD treatment in MHCC-97H cells. (F) Results of qPCR after YY1 ChIP / VDR ChIP / YY1 ChIP - VDR re-ChIP of GC target gene in MHCC-97H cells treated as indicated. n = 3, biological replicates. Statistics were calculated on biological replicates with two-tailed unpaired t-tests, **P < 0.01, ***P < 0.001, compared with the 0 group. Error bars show mean with SD. (G) Results of qPCR after VDR ChIP of GC target gene in MHCC-97H cells treated as indicated. n = 3, biological replicates. Statistics were calculated on biological replicates with two-tailed unpaired t-tests, **P < 0.01, ***P < 0.001, compared with the control group. Error bars show mean with SD. (H) Results of qPCR after YY1 ChIP of GC target gene in MHCC-97H cells treated as indicated. n = 3, biological replicates. Statistics were calculated on biological replicates with two-tailed unpaired t-tests, **P < 0.01, ns, not significant, compared with the 0 group. Error bars show mean with SD. (I and J) Detection of transcriptional activation of the GC by different treatment conditions using the dual luciferase reporter assay. n = 3, biological replicates. Statistics were calculated on biological replicates with two-tailed unpaired t-tests, ***P < 0.001, compared with the control group. ###P < 0.001, compared with the VD group. Error bars show mean with SD. (K) The levels of VDBP mRNA were detected by RT-qPCR in MHCC-97H cells treated as indicated. (L) Western blot analysis of VDBP expression level in MHCC-97H cells treated as indicated. n = 3, biological replicates. Statistics were calculated on biological replicates with two-tailed unpaired t-tests, **P < 0.01, ***P < 0.001, ns, not significant. Error bars show mean with SD.
Materials
| Reagents | Company | CAT# | ||
|---|---|---|---|---|
| Dual-Lumi™ Luciferase Reporter Gene Assay Kit | Beyotime | CAT#RG088s | ||
| Fast Silver Stain Kit | Beyotime | CAT#P0017S | ||
| CHIP Assay Kit | Beyotime | CAT#P2078 | ||
| Hieff NGS® G-Type In-situ DNA Binding Profiling Library Prep Kit for Illumina®(BOXⅠ) | Yeasen | CAT#12598ES12 | ||
| Hieff NGS® G-Type In-situ DNA Binding Profiling Library Prep Kit for Illumina®(BOXⅡ) | Yeasen | CAT#12598ES12 | ||
| Color prestained protein molecular weight markers (10-245kD) | UE landy | CAT#P8028M | ||
| D-luciferin potassium>98% | meilunbio | CAT#115144-35-9 | ||
| Duolink In Situ Detection Reagents Orange | Sigma Aldrich | CAT#DUO92007 | ||
| Duolink In Situ PLA Probe Anti-Rabbit MINUS | Sigma Aldrich | CAT#DUO92005 | ||
| Duolink In Situ PLA Probe Anti-Mouse PLUS | Sigma Aldrich | CAT#DUO92001 | ||
| 1,25-hydroxy vitamin D3 | Med Chem Express | CAT#HY-10002 | ||
| VD3 | Med Chem Express | CAT#HY-15398 | ||
| pork skin gelatin | Thermo Fisher | CAT#G13187 | ||
| Matrigel® Matrix Basement Membrane HC Phenol-Red Free | CORNING | CAT#354262 | ||
| BeyoMag™ Anti-Flag Magnetic Beads | Beyotime | CAT#P2115 | ||
| Lipo8000™ Transfection Reagent | Beyotime | CAT#C0533 | ||
| Protein A+G Agarose | Beyotime | CAT#P2012 | ||
| Modified Hematoxylin-Eosin (HE) Stain Kit | Solarbio | CAT#G1121 | ||
| DAB Kit | MXB biotechnologies | CAT#DAB-0031 | ||
| ElivisionTM plus Polyer HRP (Mouse/Rabbit) IHC Kit | MXB biotechnologies | CAT#Kit-9902 | ||
| Ready-to-use normal goat serum | BOSTER | CAT#AR0009 | ||
| Glycogen Periodic Acid Schiff (PAS/Hematoxylin) Stain Kit | Solarbio | CAT#G1281 | ||
| MolPure Cell RNA Kit | Yeasen | CAT#19231ES50 | ||
| Hifair® Ⅲ 1st Strand cDNA Synthesis SuperMix for qPCR (gDNA digester plus) | Yeasen | CAT#11141ES60 | ||
| Hieff UNICON® Universal Blue qPCR SYBR Green Master Mix | Yeasen | CAT#11184ES25 | ||
| Mounting Medium, antifading (with DAPI) | Solarbio | CAT#S2110 | ||
| MycoAlert mycoplasma detection kit | Lonza | CAT#LT07-218 | ||
| Pierce(tm) BCA Protein Assay Kit | Thermo Fisher | CAT#23227 | ||
| Antibodies | Company | CAT# | RRID | |
| Rabbit polyclonal anti-beta Actin | Affinity | CAT#AF7018 | RRID: AB_2839420 | |
| Mouse monoclonal anti-VDR (D-6) | Santa Cruz | CAT#sc-13133 | RRID: AB_628040 | |
| Mouse monoclonal anti-YY1(H-10) | Santa cruz | CAT#sc-7341 | RRID: AB_2257497 | |
| Mouse monoclonal anti-Vitamin D binding protein (DBP) | Proteintech | CAT#66175-1-Ig | RRID: AB_2881570 | |
| Mouse monoclonal anti-E-cadherin | Proteintech | CAT#60335-1-Ig | RRID: AB_2881444 | |
| Rabbit polyclonal anti-VE-Cadherin | Affinity | CAT#AF6265 | RRID: AB_2835123 | |
| Mouse monoclonal anti-Vimentin | Proteintech | CAT#60330-1-Ig | RRID: AB_2881439 | |
| Rabbit polyclonal anti-Twist1 | Proteintech | CAT#25465-1-AP | RRID: AB_2880093 | |
| Rabbit polyclonal anti-MMP2 | Affinity | CAT#AF0577 | RRID: AB_2834154 | |
| Rabbit polyclonal anti-MMP9 | Affinity | CAT#AF0220 | RRID: AB_2833350 | |
| Rabbit polyclonal anti-CD31 | ZENBIO | CAT#347526 | N/A | |
| In vivo Mab anti-mouse PD-1(CD279) | Bio X Cel | CAT#BE0273 | RRID: AB_2687796 | |
| Rabbit polyclonal anti-Fibronectin 1 | Proteintech | CAT#15613-1-AP | RRID: AB_2105691 | |
| Mouse monoclonal anti-SERPINE2 | Proteintech | CAT#66203-1-Ig | RRID: AB_2881594 | |
| Rabbit IgG | Beyotime | CAT#A7016 | RRID: AB_2905533 | |
| Mouse IgG | Beyotime | CAT#A7028 | RRID: AB_2909433 | |
| Goat Anti-Rabbit IgG (H+L) HRP | Affinity | CAT#S0001 | RRID: AB_2839429 | |
| Goat Anti-Mouse IgG (H+L) HRP | Affinity | CAT#S0002 | RRID: AB_2839430 | |
| CoraLite 488-conjugated Goat Anti-Mouse IgG(H+L) | Proteintech | CAT#SA00013-1 | RRID: AB_2810983 | |
| YF 633-Phalloidin | US Everbright | CAT#YP0053S | N/A | |
| Plasmids | Company | Vector backbone | ||
| GC_OHu14110D_pcDNA3.1+/C-(K)-DYK | Genscript | pcDNA3.1(+) | ||
| ko GC_eSpCas9-2A- Puro (PX459) V2.0 | Genscript | pX459 | ||
| PGL3-Basic-GC-promoter | TsingkeBiotechnology | PGL3-Basic | ||
| PGL3-Basic-VE-cadherin-promoter | TsingkeBiotechnology | PGL3-Basic | ||
| pRL-TK | TsingkeBiotechnology | PRL-TK | ||
| GC-ΔTbd_pcDNA3.1+/C-(K)-DYK | TsingkeBiotechnology | pcDNA3.1(+) | ||
| VDR_pcDNA3.1+/C-(K)-DYK | Genscript | pcDNA3.1(+) | ||
| Ko VDR_eSpCas9-2A-Puro (PX459) V2.0 | Genscript | pX459 | ||
| Twist1_pcDNA3.1+/C-(K)-DYK | TsingkeBiotechnology | pcDNA3.1(+) | ||
| YY1_pcDNA3.1+/C-(K)-DYK | TsingkeBiotechnology | pcDNA3.1(+) | ||
| ko YY1_eSpCas9-2A- Puro (PX459) V2.0 | Genscript | pX459 | ||
| CRISPR/Cas9-based knock out | ||||
| sgRNA | Targeting sgRNA Sequence (5'-3') | Vector backbone | ||
| Ko VDR_eSpCas9-2A-Puro (PX459) V2.0 | ACTTTGACCGGAACGTGCCC | PX459 | ||
| Ko GC_eSpCas9-2A- Puro (PX459) V2.0 | ACCCTGACTGCTATGACACC | PX459 | ||
| ko YY1_eSpCas9-2A- Puro (PX459) V2.0 | GATGTAGAGGGTGTCGCCCG | PX459 | ||
| Oligonucleotides | Company | |||
| Primers for GAPDH Forward: ACAACTTTGGTATCGTGGAAGG Reverse: GCCATCACGCCACAGTTTC | TsingkeBiotechnology | |||
| Primers for CDH1Forward: ATTTTTCCCTCGACACCCGATReverse: TCCCAGGCGTAGACCAAGA | TsingkeBiotechnology | |||
| Primers for CDH5Forward: AAGCGTGAGTCGCAAGAATG Reverse: TCTCCAGGTTTTCGCCAGTG | TsingkeBiotechnology | |||
| Primers for MMP2Forward: TACAGGATCATTGGCTACACACCReverse: GGTCACATCGCTCCAGACT | TsingkeBiotechnology | |||
| Primers for MMP9Forward: TGTACCGCTATGGTTACACTCGReverse: GGCAGGGACAGTTGCTTCT | TsingkeBiotechnology | |||
| Primers for GC promoterForward: CCCAGTGGCACGTTTGAAC Reverse: CTGGTGTCATAGCAGTCAGGG | TsingkeBiotechnology | |||
| Biological samples | Source | |||
| HCC samples for patient-derived xenografts | Tianjin Medical University Cancer Institute and Hospital | |||
| Experimental models: Cell lines | Source | CAT# | ||
| SK-HEP-1 | Keygen Biotech | CAT#KG064 | ||
| Huh-7 | Keygen Biotech | CAT#KG435 | ||
| SNU-387 | CELLCOOK | CAT#CC0112 | ||
| PLC-PRF-5 | Keygen Biotech | CAT#KG068 | ||
| MHCC-97H | ZQXZbio | CAT#ZQ0020 | ||
| MHCC-97H-LUC | ZQXZbio | CAT#LZQ0018 | ||
| SNU-387-LUC | UBIGENE | CAT#YC-B001-Luc-P | ||
| Experimental models: Organisms/strains | Source | RRID | ||
| BALB/c-nude mice | Beijing Vital River Laboratory Animal Technology | |||
| NOD/SCID mice | Beijing Vital River Laboratory Animal Technology | |||
| C57BL/6 GC flox/+ mice | Shanghai Model Organisms Center | RRID: IMSR_NMCKO-2117028 | ||
| C57BL/6 Alb-Cre mice | Shanghai Model Organisms Center | |||
| Software and algorithms | Source | RRID | ||
| ZEN | Zeiss | |||
| IGV | IGV | |||
| R 4.1.3 | R Foundation | RRID:SCR_001905 | ||
| ImageJ | Open-source processing software | RRID:SCR_003070 | ||
| GraphPad Prism 9.0.0 | GraphPad | RRID:SCR_002798 | ||
| Pymol | Schrödinger, LLC | RRID:SCR_000305 | ||
| ClusPro 2.0 | SciCrunchRegistry | RRID:SCR_018248 | ||
| Living Imaging 4.5.5 | Perkinelmer | RRID:SCR_014247 | ||
| Other | ||||
| FigDraw for Graphical abstract | ID: TUWOT188d8 | |||
| Zeiss LSM800 with Airyscan | Zeiss | |||
VD potentiates the anti-tumor effect of anti-PD-1 in HCC
To evaluate the anti-tumor effect of VD, we established a liver orthotopic transplantation tumor model in BALb/c-nude mice. The imaging results demonstrated a significant reduction in tumor volume in mice supplemented with VD3 (Figure 7A-B).
VD potentiates the antitumor effect of anti-PD-1 in HCC. (A and B) Representative in vivo images (A) of MHCC-97H-luc-tumor-bearing-BALB/c-nude mice with indicated treatments and quantified values (B) are shown as relative luciferase activity (photons/area). n = 6, biological replicates. Statistics were calculated on biological replicates with two-tailed unpaired t-tests, **P < 0.01. Error bars show mean with SD. (C) Representative images of CD31-PAS double staining, HE staining, IHC staining of VDBP, VE-cadherin, E-cadherin, MMP2 and MMP9 and PLA assays in liver tissues of MHCC-97H-luc-tumor-bearing-BALB/c-nude mice. Scale bar, 40 µm. (D-F) Quantification of number of VM (D), pathological score of IHC staining (E) and PLA signal per cell (F). n = 6, biological replicates. Statistics were calculated on biological replicates with two-tailed unpaired t-tests, **P < 0.01, ***P < 0.001. Error bars show mean with SD. (G) Flowchart on the construction of PDX model and antitumor test of anti-PD-1 or anti-PD-1/VD combination therapy in vivo. (H) The tumor volume was monitored every 3 days after implantation. n = 6, biological replicates. Statistics were calculated on biological replicates with two-tailed unpaired t-tests, ***P < 0.001, compared with Control, ###P < 0.001, compared with anti-PD-1. Error bars show mean with SD. (I) Kaplan-Meier curves showing percentage of survival of PDX model SCID mice after indicated treatments. n = 6, biological replicates. *P < 0.05, compared with Control, #P < 0.05, compared with anti-PD-1. (J) Representative images of CD31-PAS double staining, HE staining and IHC staining of VE-cadherin, E-cadherin, MMP2 and MMP9 in liver tissues of PDX model SCID mice. Scale bar, 40 µm. (K and L) Quantification of number of VM (K) and pathological score of IHC staining (L) in (J). n = 6, biological replicates. Statistics were calculated on biological replicates with two-tailed unpaired t-tests, *P < 0.05, **P < 0.01, compared with Control, #P < 0.05, ##P < 0.01, ###P < 0.001, compared with anti-PD-1. Error bars show mean with SD.
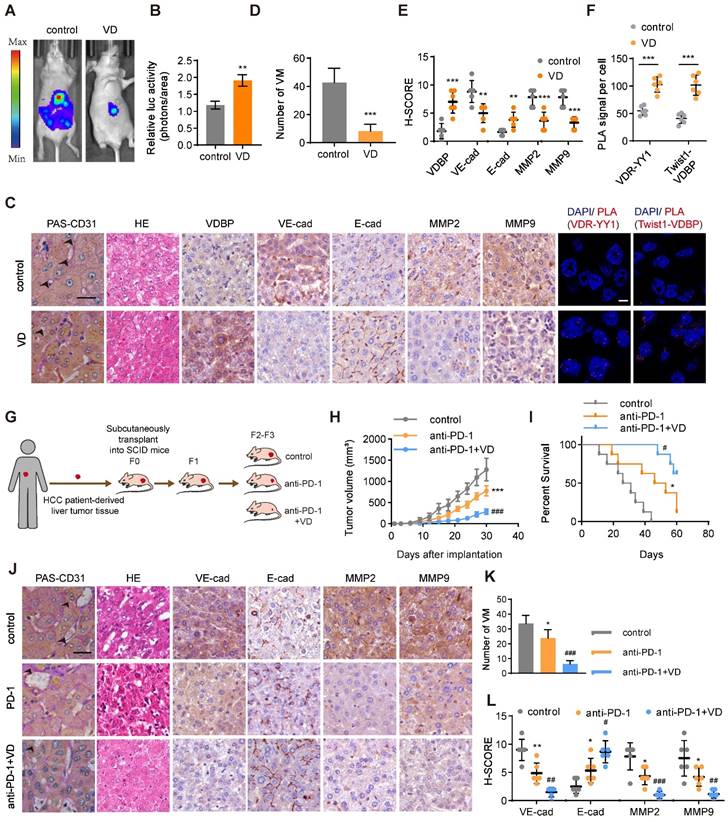
We performed PAS-CD31 dual staining on tumor tissues from mice and subsequently counted the number of VMs; it was found that mice supplemented with VD3 had a significantly reduced number of VMs in their tumor tissues (Figure 7C-D). The results of HE staining demonstrated that mice receiving VD3 supplementation exhibited tumor cells characterized by uniform size, which suggested reduced heterogeneity (Figure 7C). Additionally, IHC staining suggested that VD3 supplementation suppressed the expression of VM-related markers while promoting the expression of E-cadherin (Figure 7C, E). PLA results on tumor tissue illustrated that the supplementation of VD3 promotes the interaction between YY1 and VDR at the tumor site, with a significant increase also observed in the interaction between VDBP and Twist1 (Figure 7C, F). The field of tumor therapeutics is increasingly focusing on immunotherapy, with anti-PD-1 being classical immune checkpoint inhibitors that are considered a promising strategy for tumor treatment. In this study, we evaluated the therapeutic effect of VD3 in combination with anti-PD-1 on tumors by establishing a PDX model (Figure 7G). We found that the combination therapy of VD and anti-PD-1 significantly reduced tumor volume, slowed tumor growth rate (Figure 7H), and prolonged survival of tumor-bearing mice (Figure 7I) compared with anti-PD-1 alone. Pathological analysis of tumor tissue sections showed that the number of VMs and VM-related marker expression was significantly reduced, while the expression of E-cadherin was increased in the drug combination treatment group (Figure 7J-L). These findings suggest that VD can enhance the anti-tumor effect and improve the efficacy of PD-1 inhibitors.
Discussion
VDBP is a multifunctional protein whose primary functions, as indicated by current research, involve the binding and transport of vitamin D metabolites. The protein plays a crucial role in both physiological and pathological contexts, including immune and inflammatory regulation [33, 34], as well as serving as a biomarker for clinical diagnosis [35]. Related studies have shown that there exists a significant correlation between the genetic polymorphism of VDBP and malignant tumors [2]. However, the research on the mechanism for the role of VDBP in tumors is still not sufficiently comprehensive. Our findings have identified that VDBP expression plays a critical role in HCC; we identified that VDBP possesses the ability to suppress VM, consequently inhibiting the malignant progression of HCC. Since no prior work has shown the correlation of VDBP and VM, PAS-CD31 co-staining and IHC analysis of 75 patients with HCC were conducted. It was revealed that the expression of VDBP was negatively correlated with the quantity of VM and the expression levels of VM-related markers in HCC tumor tissues. Regarding the mechanism by which VDBP regulates VM, we discovered that VDBP can interact with the transcription factor Twist1 to obstruct recognition of Twist1 on the bHLH domain of genes, thereby preventing Twist1 from binding to the promoter region of VE-cad and thus inhibiting the expression of VE-cad, finally leading to the suppression of VM. Given that Twist1 is a key transcription factor in EMT, the interaction between VDBP and Twist1 can also inhibit classic EMT phenotypes such as migration and invasion. The study reported the initial instance of VDBP potentially modulating epigenetics through direct interaction with the transcription factor, thereby revealing a hitherto unexplored function of VDBP.
Numerous clinical studies have demonstrated the potential of VD as a treatment option for tumors [29, 36, 37]. In this study, we deepened our understanding of VD regulating HCC progression and enhancing the effectiveness of immune therapy in HCC, by elucidating the specific molecular mechanism by which VD exerts its anti-tumor effect in HCC; VD promotes nuclear translocation of VDR-YY1 interaction, leading to transcriptional activation of VDBP. Animal studies revealed promising therapeutic results in the treatment of HCC through the upregulation of VDBP induced by VD, and a combination of VD and anti-PD-1 achieved remarkable results in the treatment of HCC.
Supplementary Material
Supplementary figures and methods.
Acknowledgements
Funding
This study was supported by the National Natural Science Foundation of China (grant no. 82073205, 82272934), Shenzhen Science and Technology Program (Grant JCYJ20210324122006017), the Natural Science Foundation of Tianjin (21JCZDJC00930), the National Youth Talent Support Program (2020), the Fundamental Research Funds for the Central Universities, Nankai University (735-63233164, 735-ZB23003405), The 111 Project (Grant B20016) and Tianjin Applied basic Research project (No. 21JCYBJC00130).
Author contributions
Lu-ning Qin carried out experiments, analyzed data, drafted the manuscript and edited figures. Qing-qing Li and Ting Wu carried out experiments and analyzed data. Shan-bin Cheng, Kai-wen Wang, Yue Shi and Hao-ran Ren provided technical support. Heng Zhang conceived experiments and edited the manuscript. Xue-wu Xing provided tissues of HCC patients for PDX mouse model. Cheng Yang secured funding. Tao Sun conceived experiments, edited the manuscript, and secured funding. All authors had final approval of the submitted and published versions of the manuscript.
Data and materials availability
All data are available in the main text or the supplementary materials.
Competing Interests
The authors have declared that no competing interest exists.
References
1. Hill A, Starchl C, Dresen E, Stoppe C, Amrein K. An update of the effects of vitamins D and C in critical illness. Front Med (Lausanne). 2022;9:1083760
2. Rozmus D, Ciesielska A, Płomiński J, Grzybowski R, Fiedorowicz E, Kordulewska N. et al. Vitamin D Binding Protein (VDBP) and Its Gene Polymorphisms-The Risk of Malignant Tumors and Other Diseases. International journal of molecular sciences. 2020;21:7822
3. McLeod JF, Cooke NE. The vitamin D-binding protein, alpha-fetoprotein, albumin multigene family: detection of transcripts in multiple tissues. J Biol Chem. 1989;264:21760-9
4. Mirsafian H, Mat Ripen A, Singh A, Teo PH, Merican AF, Mohamad SB. A comparative analysis of synonymous codon usage bias pattern in human albumin superfamily. ScientificWorldJournal. 2014;2014:639682
5. Rozmus D, Płomiński J, Augustyn K, Cieślińska A. rs7041 and rs4588 Polymorphisms in Vitamin D Binding Protein Gene (VDBP) and the Risk of Diseases. International journal of molecular sciences. 2022;23:933
6. Chishimba L, Thickett DR, Stockley RA, Wood AM. The vitamin D axis in the lung: a key role for vitamin D-binding protein. Thorax. 2010;65:456-62
7. Yin J, Liu H, Yi X, Wu W, Amos CI, Fang S. et al. Genetic variants in the vitamin D pathway genes VDBP and RXRA modulate cutaneous melanoma disease-specific survival. Pigment Cell Melanoma Res. 2016;29:176-85
8. Chun RF. New perspectives on the vitamin D binding protein. Cell Biochem Funct. 2012;30:445-56
9. Treps L, Faure S, Clere N. Vasculogenic mimicry, a complex and devious process favoring tumorigenesis - Interest in making it a therapeutic target. Pharmacology & therapeutics. 2021;223:107805
10. Yang JP, Liao YD, Mai DM, Xie P, Qiang YY, Zheng LS. et al. Tumor vasculogenic mimicry predicts poor prognosis in cancer patients: a meta-analysis. Angiogenesis. 2016;19:191-200
11. Maniotis AJ, Folberg R, Hess A, Seftor EA, Gardner LM, Pe'er J. et al. Vascular channel formation by human melanoma cells in vivo and in vitro: vasculogenic mimicry. Am J Pathol. 1999;155:739-52
12. Xiang T, Lin YX, Ma W, Zhang HJ, Chen KM, He GP. et al. Vasculogenic mimicry formation in EBV-associated epithelial malignancies. Nat Commun. 2018;9:5009
13. Chen YS, Chen ZP. Vasculogenic mimicry: a novel target for glioma therapy. Chin J Cancer. 2014;33:74-9
14. Delgado-Bellido D, Serrano-Saenz S, Fernández-Cortés M, Oliver FJ. Vasculogenic mimicry signaling revisited: focus on non-vascular VE-cadherin. Molecular cancer. 2017;16:65
15. Wei X, Chen Y, Jiang X, Peng M, Liu Y, Mo Y. et al. Mechanisms of vasculogenic mimicry in hypoxic tumor microenvironments. Molecular cancer. 2021;20:7
16. Qie S, Sun BC, Zhao XL, Zhang SW, Sun T, Gao SY. et al. [Correlation between expressions of matrix metalloproteinase-2 & 9 and vasculogenic mimicry in gastrointestinal stromal tumors]. Zhonghua yi xue za zhi. 2009;89:1106-9
17. Sun T, Zhao N, Zhao XL, Gu Q, Zhang SW, Che N. et al. Expression and functional significance of Twist1 in hepatocellular carcinoma: its role in vasculogenic mimicry. Hepatology (Baltimore, Md). 2010;51:545-56
18. Kuznia S, Zhu A, Akutsu T, Buring JE, Camargo CA Jr, Cook NR. et al. Efficacy of vitamin D(3) supplementation on cancer mortality: Systematic review and individual patient data meta-analysis of randomised controlled trials. Ageing Res Rev. 2023;87:101923
19. Keum N, Lee DH, Greenwood DC, Manson JE, Giovannucci E. Vitamin D supplementation and total cancer incidence and mortality: a meta-analysis of randomized controlled trials. Ann Oncol. 2019;30:733-43
20. Carlberg C, Campbell MJ. Vitamin D receptor signaling mechanisms: integrated actions of a well-defined transcription factor. Steroids. 2013;78:127-36
21. Triantos C, Aggeletopoulou I, Thomopoulos K, Mouzaki A. Vitamin D-Liver Disease Association: Biological Basis and Mechanisms of Action. Hepatology (Baltimore, Md). 2021;74:1065-73
22. Udomsinprasert W, Jittikoon J. Vitamin D and liver fibrosis: Molecular mechanisms and clinical studies. Biomed Pharmacother. 2019;109:1351-60
23. Wu M, Huang Q, Xie Y, Wu X, Ma H, Zhang Y. et al. Improvement of the anticancer efficacy of PD-1/PD-L1 blockade via combination therapy and PD-L1 regulation. Journal of hematology & oncology. 2022;15:24
24. Sharma P, Allison JP. The future of immune checkpoint therapy. Science. 2015;348:56-61
25. Zhou X, Yao Z, Bai H, Duan J, Wang Z, Wang X. et al. Treatment-related adverse events of PD-1 and PD-L1 inhibitor-based combination therapies in clinical trials: a systematic review and meta-analysis. Lancet Oncol. 2021;22:1265-74
26. Li Z, Zhang H, Sun Y, Feng Z, Cui B, Han J. et al. Live-cell imaging-based dynamic vascular formation assay for antivascular drug evaluation and screening. iScience. 2023;26:106721
27. Luo Q, Wang J, Zhao W, Peng Z, Liu X, Li B. et al. Vasculogenic mimicry in carcinogenesis and clinical applications. Journal of hematology & oncology. 2020;13:19
28. Qin Q, Xu Y, He T, Qin C, Xu J. Normal and disease-related biological functions of Twist1 and underlying molecular mechanisms. Cell Res. 2012;22:90-106
29. Carlberg C, Muñoz A. An update on vitamin D signaling and cancer. Seminars in cancer biology. 2022;79:217-30
30. Umesono K, Murakami KK, Thompson CC, Evans RM. Direct repeats as selective response elements for the thyroid hormone, retinoic acid, and vitamin D3 receptors. Cell. 1991;65:1255-66
31. Li M, Wei J, Xue C, Zhou X, Chen S, Zheng L. et al. Dissecting the roles and clinical potential of YY1 in the tumor microenvironment. Frontiers in oncology. 2023;13:1122110
32. Wang W, Li D, Sui G. YY1 Is an Inducer of Cancer Metastasis. Critical reviews in oncogenesis. 2017;22:1-11
33. Bouillon R, Schuit F, Antonio L, Rastinejad F. Vitamin D Binding Protein: A Historic Overview. Frontiers in endocrinology. 2019;10:910
34. Del Pinto R, Ferri C, Cominelli F. Vitamin D Axis in Inflammatory Bowel Diseases: Role, Current Uses and Future Perspectives. International journal of molecular sciences. 2017;18:2360
35. Lisowska-Myjak B, Jóźwiak-Kisielewska A, Łukaszkiewicz J, Skarżyńska E. Vitamin D-binding protein as a biomarker to confirm specific clinical diagnoses. Expert Rev Mol Diagn. 2020;20:49-56
36. Budhathoki S, Hidaka A, Yamaji T, Sawada N, Tanaka-Mizuno S, Kuchiba A. et al. Plasma 25-hydroxyvitamin D concentration and subsequent risk of total and site specific cancers in Japanese population: large case-cohort study within Japan Public Health Center-based Prospective Study cohort. BMJ (Clinical research ed). 2018;360:k671
37. Chandler PD, Chen WY, Ajala ON, Hazra A, Cook N, Bubes V. et al. Effect of Vitamin D3 Supplements on Development of Advanced Cancer: A Secondary Analysis of the VITAL Randomized Clinical Trial. JAMA network open. 2020;3:e2025850
Author contact
![]() Corresponding authors: Tao Sun, email: tao.sunedu.cn; Cheng Yang, email: cheng.yangedu.cn; Xue-wu Xing, email: xuewuxingedu.cn; Heng Zhang, email: zhangheng043nankai.edu.cn.
Corresponding authors: Tao Sun, email: tao.sunedu.cn; Cheng Yang, email: cheng.yangedu.cn; Xue-wu Xing, email: xuewuxingedu.cn; Heng Zhang, email: zhangheng043nankai.edu.cn.