Impact Factor
 Global reach, higher impact
Theranostics 2025; 15(13):6444-6453. doi:10.7150/thno.112588 This issue Cite
Research Paper
Association of integrated biomarkers and progression-free survival prediction in patients with gastroenteropancreatic neuroendocrine tumors undergoing [177Lu]Lu-DOTA-TATE therapy
Felix L. Herr1 ![]() , Christian Dascalescu1, Ricarda Ebner1, Moritz L. Schnitzer1, Matthias P. Fabritius1, Christine Schmid-Tannwald1, Mathias J. Zacherl2, Vera Wenter2, Lena M. Unterrainer2,3, Matthias Brendel2,4,5,6, Adrien Holzgreve2, Rudolf A. Werner2,7, Christoph J. Auernhammer8,9, Christine Spitzweg8,9, Thomas Knösel10, Tanja Burkard1, Jens Ricke1, Maurice M. Heimer1, Gabriel T. Sheikh2*, Clemens C. Cyran1*
, Christian Dascalescu1, Ricarda Ebner1, Moritz L. Schnitzer1, Matthias P. Fabritius1, Christine Schmid-Tannwald1, Mathias J. Zacherl2, Vera Wenter2, Lena M. Unterrainer2,3, Matthias Brendel2,4,5,6, Adrien Holzgreve2, Rudolf A. Werner2,7, Christoph J. Auernhammer8,9, Christine Spitzweg8,9, Thomas Knösel10, Tanja Burkard1, Jens Ricke1, Maurice M. Heimer1, Gabriel T. Sheikh2*, Clemens C. Cyran1*
1. Department of Radiology, LMU University Hospital, LMU Munich, Munich, Germany
2. Department of Nuclear Medicine, LMU University Hospital, LMU Munich, Munich, Germany
3. Bayerisches Zentrum für Krebsforschung (BZKF), partner site Munich, Germany
4. DZNE - German Center for Neurodegenerative Diseases, Munich, Germany
5. Munich Cluster for Systems Neurology (SyNergy), University of Munich, Munich, Germany
6. German Cancer Consortium (DKTK), partner site Munich, a partnership between DKFZ and LMU, Germany
7. The Russell H. Morgan Department of Radiology and Radiological Sciences, Division of Nuclear Medicine and Molecular Imaging, Johns Hopkins University School of Medicine, Baltimore, Maryland
8. Interdisciplinary Center of Neuroendocrine Tumors of the GastroEnteroPancreatic System (GEPNET-KUM, ENETS certified Center of Excellence), LMU University Hospital, LMU Munich, Munich, Germany
9. Department of Medicine IV, LMU University Hospital, LMU Munich, Munich, Germany
10. Department of Pathology, LMU University Hospital, LMU Munich, Munich, Germany.
* These authors equally contributed.
Received 2025-2-21; Accepted 2025-4-19; Published 2025-5-25
Abstract

Integrated biomarkers that predict survival in patients with gastroenteropancreatic neuroendocrine tumors (GEP-NET) receiving peptide receptor radionuclide therapy (PRRT) are still limited. This study aims to identify predictors of progression-free survival (PFS) in patients with GEP-NET undergoing two cycles of PRRT.
Methods: This single-center retrospective study included 178 patients with GEP-NET (G1 and G2) who received at least two consecutive cycles of PRRT with [177Lu]Lu-DOTA-TATE and underwent somatostatin receptor (SSTR)-PET/CT before and after therapy. At baseline, Krenning score (KS) > 2, clinical, pathological and laboratory parameters were collected and correlated to PFS. Survival predictors were analyzed using univariate and multivariate models. For goodness-of-fit analysis, the Akaike information criterion and Harrell concordance index were determined. To determine the impact on the regression model the Wald-Test was performed.
Results: In univariate analysis, KS 3 (vs. KS 4; HR, 2.02; 95% CI, 1.27-3.22; p = 0.012), Ki-67 > 5 % (HR, 2.00; 95% CI, 1.31-3.04; p = 0.008), CgA > 200 ng/mL (HR, 1.77; 95% CI, 1.14-2.76; p = 0.027) and NSE > 35 ng/mL (HR, 2.37; 95% CI, 1.44-3.89; p < 0.008) were significantly associated with shorter PFS, with CgA providing the highest C-index (0.6). In multivariate analysis , KS 3 (vs. KS 4; HR, 1.94; 95% CI, 1.17-3.21; p = 0.01), CgA > 200 ng/mL (HR, 1.76; CI, 1.08-2.87; p = 0.024), NSE > 35 ng/mL (HR, 1.98; 95% CI, 1.17-3.36; p = 0.011), and Ki-67 > 5 % (HR, 1.89; 95% CI, 1.18-3.02; p = 0.008) were significantly associated with reduced PFS. Including KS into multivariate analysis significantly improved the Cox regression model performance, as shown by a reduction in Akaike Information Criterion (592/596) and an increase in concordance index (0.66/0.65). The Wald test for individual variables supported the significance of both Ki-67 (7.1) and KS (6.7) as independent predictors of PFS.
Conclusions: NSE, CgA, KS and Ki-67 emerged as independent predictors of PFS in GEP-NET patients scheduled for two cycles of PRRT, thereby emphasizing the importance of integrated diagnostics including in- and ex-vivo biomarkers to identify high-risk individuals prone to disease progression.
Keywords: GEP-NET, PRRT, histopathology, Ki-67, proliferation index, Krenning score, somatostatin receptor
Introduction
Somatostatin receptors, most frequently subtype 2 (SSTR2), are overexpressed on the surface of gastroenteropancreatic neuroendocrine tumor (GEP-NET) [1,2], and can be exploited for SSTR-directed PET [3]. In this regard, several radiotracers are currently available, including Gallium-68 labeled, and more recently, fluorine radiotracers, such as [18F] silicon fluoride acceptor tagged Tyr(3)octreotate ([18F]SiTATE) [4-9]. In a theranostic setting, peptide receptor radionuclide therapy (PRRT) takes advantage of SSTR overexpression in GEP-NET patients by using ß-emitting Lutetium-177 labeled therapeutic equivalents [10]. Of note, sufficient uptake on PET in sites of disease is a prerequisite [11,12] and the PET-based modified Krenning score (KS) investigating uptake in unaffected healthy parenchyma can identify patients eligible for such a systemic therapeutic approach [6,13].
Effective management of NET requires a precise diagnostic process due to the heterogeneity of these tumors. [14]. According to the North American Neuroendocrine Tumor Society (NANETS) and European Neuroendocrine Tumor Society (ENETS) guidelines histopathologic biopsy should provide information regarding the histologic classification, the degree of differentiation, and the proliferation-based grading with indication of the Ki-67 index [15,16]. Moreover, in accordance with the NANETS and ENETS Guidelines, circulating biomarkers, specifically chromogranin A (CgA) and neuron-specific enolase (NSE), should be collected at baseline for all NET [16,17].
The integration of imaging, pathology, clinical and laboratory testing data for cancer patients is referred to as integrated diagnostics [18]. Using integrated diagnostics has the potential to improve the diagnosis and therapeutic management of numerous diseases, including cancer and it has been demonstrated that the combination of variables from multiple diagnostic disciplines is a more effective approach [18]. It can be used to evaluate prognosis and facilitate therapy guidance for patients with prostate and breast cancers [19,20].
Integrated biomarkers of survival for patients with GEP-NET receiving PRRT remain limited and thus, we hypothesize that integrated biomarkers combing imaging, pathological, clinical and laboratory parameters at baseline are associated with progression-free survival (PFS) in patients with GEP-NET undergoing two cycles of PRRT. This study aims to evaluate integrated diagnostics and to identify independent potential predictors of PFS in patients with GEP-NET under two cycles of PRRT at baseline.
Methods
Study design
This single-center retrospective study was approved by the local ethics committee (approval number 19-027). Informed consent was waived due to the retrospective study design. All patients with histologically proven GEP-NET who underwent PRRT at an ENETS-certified center for GEP-NET at a tertiary university medical center between 2012 and 2023 were reviewed. The decision to perform PRRT was made by a multidisciplinary tumor board (MDT). The MDT defined clinical progression through a semi-quantitative and visual determination of clinically relevant tumor dynamics, reminiscent of RECIST 1.1, yet without its concrete application. The decision-making process of the MDT was based on a comprehensive evaluation of clinical and laboratory parameters, including CgA and NSE levels, CT-derived assessments of tumor size, and PET-based evaluation of SSTR expression. Key factors influencing the recommendation for PRRT included the extent of SSTR expression, primary tumor site, Ki-67 proliferation index, overall tumor burden, and observed tumor dynamics. The MDT operates as a dedicated GEP-NET tumor board within the interdisciplinary Center of Excellence for GEPNET at our tertiary care institution, officially certified by ENETS. The board meets weekly and reviews approximately 800 cases annually. It brings together experts from multiple disciplines, including endocrinology, gastroenterology, oncology, surgery, nuclear medicine, radiology, radiation oncology, and pathology, ensuring access to the most current diagnostic and therapeutic strategies.
The study included patients with differentiated NET G1 and G2, imaged with [68Ga]Ga-DOTA(0)-Phe(1)-Tyr(3))octreotate ([68Ga]Ga-DOTA-TATE), [68Ga]Ga-DOTA(0)-Phe(1)-Tyr(3))octreotide ([68Ga]Ga-DOTA-TOC), [68Ga]Ga-DOTA,1-Nal(3)]-octreotide ([68Ga]Ga-DOTA-NOC) and [18F]SiTATE PET/CT at baseline and at follow-up, and treated with at least two consecutive cycles and a maximum of six cycles of [177Lu]177Lu-DOTA-Tyr3-octreotate ([177Lu]Lu-DOTA-TATE) PRRT. The interval between initial diagnosis and first administration of PRRT was designated as the time since diagnosis. N = 20 patients underwent two cycles of PRRT only and did not receive any further PRRT cycles. The median time between baseline and the first cycle was 1.6 ± 1.2 months, whereas the interval between the initial two cycles had a median duration of 2.3 ± 0.7 months. The median time from baseline to follow-up after 2 cycles was 6.2 ± 1.5 months. During the follow-up period, n = 93 (52%) patients exhibited progressive disease (PD) according to the GEP-NET MDT. In total n = 178 patients were enrolled in this study.
Clinical and laboratory parameters
Multiple demographic parameters such as age, initial diagnosis, primary tumor location and previous oncological therapies before PRRT were collected from electronic health archives. At baseline and follow-up, a comprehensive set of clinical, pathological and laboratory data was collected. This included body mass index (BMI), Ki-67, C-reactive protein (CRP), albumin, leukocytes, erythrocytes, hemoglobin, thrombocytes, NSE and CgA.
Outcome measures
PFS was defined as the time between baseline and progression, as reported by a GEP-NET MDT assessment or reported death. The follow-up time was defined as the time from baseline to the loss of follow-up.
Imaging protocol and analysis
At baseline, patients underwent SSTR-PET/CT on three different PET/CT systems (Siemens Biograph mCT, baseline n = 110; Siemens Biograph 64, baseline n = 58; GE Discovery 690 baseline n = 10). PET examinations within the data set were acquired with 4 different SSTR-targeting radiotracers: [68Ga]Ga-DOTA-TATE (baseline n = 71), [68Ga]Ga-DOTA-TOC (baseline n = 70), [68Ga]Ga-DOTA-NOC (baseline n = 1) and [18F]SiTATE (baseline n = 36). Mean applied activity of 68Ga- and 18F-tracer was respectively 215 ± 44 MBq and 232 ± 32 MBq at baseline. PET was acquired 60-90 minutes following the injection of the radiotracer. PET/CT scans were performed with a diagnostic CT scan of the neck, thorax, abdomen and pelvis (100-190 mAs, 120 kV, collimation 2 × 5mm, pitch of 1.5). Images from the Biograph mCT20 (Siemens Healthineers, Erlangen, Germany) were reconstructed using the reconstruction algorithm TrueX with 2 iterations (21 subsets) and time of flight (TOF) on a 200 x 200 matrix, resulting in a voxel size of 2mm x 4mm x 4mm. A Gaussian filter with a 3mm Full width at half maximum (FWHM) was applied to the reconstructed images from the Biograph mCT20. Images from the Biograph 64 TruePoint (Siemens Healthineers, Erlangen, Germany) were reconstructed using the reconstruction algorithm TrueX with 3 iterations (21 subsets) on a 168 x 168 matrix, resulting in a voxel size of 3mm x 4mm x 4mm. A Gaussian filter with a 3mm FWHM was applied to the reconstructed images from the Biograph 64 TruePoint. Images from Discovery 690 (GE Healthcare, Chicago, Illinois, USA) were reconstructed using the reconstruction algorithm VPFX with 3 iterations (21 subsets) on a 256 x 256 matrix, resulting in a voxel size of 3mm x 4mm x 4mm. A Gaussian filter with a 6.5mm FWHM was applied to the reconstructed images from Discovery 690.
PET/CT studies were assessed independently by two board-certified hybrid imaging experts (CCC, MPF) with 20- and 5-years' experience in hybrid imaging. SSTR expression of tumor lesions was visually assessed by the KS based on the lesion with the highest uptake in each patient [21]. Patients exhibiting a KS > 2 received PRRT [22].
Statistical analysis
The statistical programming tool R (version 4.3.0, R Foundation for Statistical Computing, Vienna, Austria) was used for data analysis. The threshold for statistical significance was set at p < 0.05. To evaluate data distribution Kolmogorov-Smirnov tests were performed, and parametric or non-parametric tests were performed accordingly. To address missing data, multiple imputations were performed using the R package mice. Assuming missing at random, five imputed datasets were generated using predictive mean matching, which is suitable for continuous variables such as CRP. Each imputed dataset was analyzed separately, and the pooled results were calculated using Rubin's rules. Sensitivity analyses were conducted to compare outcomes based on imputed versus non-imputed data. As the results remained consistent across approaches, the final regression models were based on the original non-imputed dataset, excluding cases with missing values in the respective variables. Survival predictors were analyzed using both univariate and multivariate models. To identify optimal prognostic thresholds, we performed a data-driven cut-point analysis using the survminer package in R. This method applies maximally selected rank statistics to determine the cut-off value that best separates PFS outcomes, based on the log-rank test. The resulting cut-off values were chosen as they yielded the greatest discriminatory power in our cohort. These values were subsequently used for both univariate and multivariate survival analyses. To account for multiple comparisons in the univariate survival analyses, p-values were adjusted using the Benjamini-Hochberg procedure for false discovery rate control, as implemented in the stats package in R. This method is appropriate for settings where multiple independent hypotheses are tested, as in univariate models evaluating several variables separately. No p-value adjustment was applied to the multivariate Cox regression models, as all covariates are analyzed simultaneously within a single model, and multiple testing correction is generally not standard in this context. Kaplan-Meier survival curves were generated for univariate analysis, and differences in survival between groups were compared using the log-rank test. Multivariate analysis was conducted using Cox proportional hazards regression to identify independent predictors of PFS by the stepwise model with backward elimination. The variables included in the multivariate analysis were those found to be significant in the univariate analysis, alongside clinically relevant parameters. For goodness-of-fit analysis, the Akaike Information Criterion and Harrell concordance index were also calculated to compare different Cox regression models with each other and with a null model (without any parameter). In this regard, a lower Akaike information criterion and a higher Harrell concordance value indicate a better-fit model [23,24]. Deviance analysis (ANOVA) was performed to assess model improvement when specific variables were added to the regression model. To assess statistical significance of the variables in the Cox regression model, the Wald test was applied. All statistical analyses were reviewed and validated by the department's statistician, TB, MSc, to ensure methodological accuracy and robustness.
Results
Patient characteristics
The patient cohort flow chart is presented in Table 1. The mean follow-up period was 41 ± 18 months (range, 7 - 124 months) in a cohort with a mean age at baseline of 63.5 ± 10.6 years (range, 35 - 88 months). The primary tumors were located in the small bowel (n = 98/178, 55%), pancreas (n = 37/178, 21%), cancer of unknown primary (n = 21/178, 12%), ileocecal junction (n = 11/178, 6%), large bowel/rectum (n = 9/178, 5%), and other locations (n = 2/178, 1%). According to baseline SSTR-PET/CT, the metastatic sites identified were the liver (n = 144/178, 81%), lymph nodes (n = 108/178, 61%), mesenterial/peritoneal (n = 108/178, 61%), bone (n = 105/178, 59%), and other locations (n = 24/178, 13%). Median progression-free survival of all patients was 37.7 ± 18 months (range, 4 - 105 months). The 1-, 2-, 3- and 5-year progression-free survival of all patients was 92%, 69%, 52% and 31%, respectively. Among all patients, n = 152/178 (85%) patients received the planned maximum of four PRRT cycles. N = 26 patients received only two cycles of PRRT due to tumor progression (n = 8/26, 31%), mixed response (n = 3/26, 11%), reduced SSTR-expression (n = 2/26, 8%), adverse events (n = 13/26, 46%) and patient will (n = 1/26, 4%).
Clinical characteristics of study population
| n = 178 | |
|---|---|
| Male to female | 108 / 70 |
| Mean age at baseline mean (SD) | 63.5 years (10.6) |
| Times mean (SD) | |
| Mean follow-up | 41 months (18) |
| Time since diagnosis to baseline | 47 months (56) |
| Baseline to first cycle PRRT | 1.6 months (1.2) |
| Baseline to follow-up | 2.3 months (0.6) |
| BMI (kg/m2) mean (SD) | 24.9 (4.3) |
| Primary tumor location, n (%) | |
| Small bowel | 98 (55%) |
| Pancreas | 37 (21%) |
| Cancer of Unknown Primary | 21 (12%) |
| Ileocecal junction | 11 (6%) |
| Large bowel / Rectum | 9 (5%) |
| Other | 2 (1%) |
| Tumor grade, n (%) | |
| NET G1 (Ki-67 ≤ 2%) | 54 (30%) |
| NET G2 (2 < Ki-67 ≤ 20%) | 119 (67%) |
| Unknown | 5 (3%) |
| Metastases, n (%) | |
| Liver | 144 (81%) |
| Lymph nodes | 108 (61%) |
| Mesenterium / Peritoneum | 108 (61%) |
| Bone | 105 (59%) |
| Other | 24 (13%) |
| Therapy Approach before PRRT *, n (%) | |
| Surgical resection of primary tumor | 105 (59%) |
| Long-acting somatostatin analogue | 110 (62%) |
| Local ablative liver therapies | 49 (28%) |
| Chemotherapy or everolimus | 30 (17%) |
| Bone-targeted radiotherapy | 6 (3%) |
*some patients received more than one treatment modality before PRRT.
SD = standard deviation; PRRT = peptide receptor radionuclide therapy; BMI = body mass index; NET = neuroendocrine tumor.
Clinical and laboratory parameters
An overview of the clinical and laboratory parameters at baseline and follow-up is presented in Table 2. In less than n = 10 patients CgA has not been evaluated at baseline or follow-up. CRP showed the highest number of missing entries (n = 51 at baseline, n = 38 at follow-up), followed by NSE (n = 30 at baseline and n = 6 at follow-up) and albumin (n = 30 at baseline and n = 1 at follow-up).
Overview of clinical and laboratory parameters at baseline and follow-up and results of the paired one-sided T-test. PRRT led to a significant decrease in blood cells from baseline to follow-up. NSE showed a significant decline from baseline to follow-up, whereas CgA showed a non-significant tendency.
| Variable | Baseline Mean (SD) | Follow-up Mean (SD) | One sided T-Test (P) |
|---|---|---|---|
| Body mass index (kg/m²) | 24.9 (4.2) | 25 (4.2) | t = 1.04 (0.85) |
| CRP (mg/dL) | 1 (2.9) | 0.5 (0.9) | t = 1.52 (0.065) |
| Albumin (g/dL) | 4.3 (0.4) | 4.3 (0.3) | t = 0.32 (0.37) |
| Leukocytes (G/L) | 7 (2.2) | 5.1 (1.5) | t = 15.25 (< 0.001) * |
| Erythrocytes (million/µL) | 4.5 (0.5) | 4.2 (0.5) | t = 9.99 (< 0.001) * |
| Hemoglobin (g/dL) | 13.6 (1.6) | 12.9 (1.4) | t = 7.50 (< 0.001) * |
| Thrombocytes (g/L) | 256.8 (91.4) | 199.3 (64.1) | t = 10.02 (< 0.001) * |
| NSE (ng/mL) | 30.4 (38) | 23 (10.8) | t = 2.18 (0.015) * |
| CgA (ng/mL) | 3896.4 (24084.2) | 1749.2 (8888.1) | t = 1.62 (0.053) |
CRP = C-reactive protein; NSE = neuron specific enolases; CgA = Chromogranin A.
PRRT led to a decrease in leukocytes, erythrocytes, hemoglobin and thrombocytes (p < 0.001) from baseline to follow-up. Including all patients, NSE showed a significant decline from baseline to follow-up (p = 0.015), whereas CgA showed a non-significant decrease (p = 0.053). Patients who did not experience any progression on follow-up showed a significantly lower NSE at baseline and follow-up (p < 0.001), whereas no correlation between CgA at any time point and progression on follow-up could be determined.
PFS Analysis under PRRT
In univariate analysis (log-rank-test), several baseline factors were significantly associated with shorter PFS (Table 3). Patients with KS 3 (vs. KS 4; HR, 2.02; 95% CI, 1.27-3.22; p = 0.012), CgA > 200 ng/mL (HR, 1.77; 95% CI, 1.14-2.76; p = 0.027), NSE > 35 ng/mL (HR, 2.37; 95% CI, 1.44-3.89; p = 0.008) and Ki-67 index > 5 % (HR, 2.00; 95% CI, 1.31-3.04; p = 0.008) had significantly shorter PFS (Figure 1 - 4). Additionally, the following parameters were significantly correlated with shorter PFS: primary tumor in the pancreas (HR, 1.70; 95% CI, 1.04-2.78; p = 0.047), erythrocytes ≤ 4 million/ µl (HR, 1.87; 95% CI, 1.07-3.28; p = 0.043), hemoglobin ≤ 12 g/dl (HR, 2.02; 95% CI, 1.13-3.62; p = 0.033), CRP > 0.5 mg/ dL (HR, 2.15; 95% CI, 1.20-3.83; p = 0.027) and albumin < 4.1 g/ dL (HR, 1.76; 95% CI, 1.1-2.83; p = 0.033). However, BMI, leukocytes and thrombocytes were not significant (p ≥ 0.11).
Univariate and multivariate analyses of factors contributing to PFS. In the univariate analysis (log-rank-test), CgA > 200 ng/mL, NSE > 35 ng/mL, Ki-67 index > 5%, primary tumor located in the pancreas, erythrocytes ≤ 4 million/µL, hemoglobin ≤ 12 g/dl, CRP levels > 1 mg/dL, and albumin < 4.1 g/dL (p < 0.05 for all) were associated with shorter PFS. In the multivariate Cox regression analysis, CgA > 200 ng/mL, NSE > 35 ng/mL and a Ki-67 index > 5% were associated with shorter PFS.
| Variable | Univariate Analysis | Multivariate Analysis | |||
|---|---|---|---|---|---|
| Patients (n) | HR (95 % CI) | P | HR (95% CI) | P | |
| All patients | 178 | ||||
| Body mass index | |||||
| ≤ 18.5 | 10 | 2.05 (0.89 - 4.74) | 0.112 | ||
| > 18.5 | 168 | ||||
| Origin of primary tumor | |||||
| Pancreas | 36 | 1.70 (1.04 - 2.78) | 0,047* | ||
| Other | 137 | ||||
| Ki-67 (%) | |||||
| > 5 | 60 | 2.00 (1.31 - 3.04) | 0.008* | 1.89 (1.18 - 3.02) | 0.008* |
| ≤ 5 | 111 | ||||
| Krenning at baseline | |||||
| 3 | 38 | 2.02 (1.27 - 3.22) | 0.012* | 1.94 (1.17 - 3.21) | 0.01* |
| 4 | 140 | ||||
| CRP (mg/dL) at baseline | |||||
| > 0.5 | 43 | 2.15 (1.20 - 3.83) | 0.027* | ||
| ≤ 0.5 | 81 | ||||
| Albumin (g/dL) at baseline | |||||
| ≥ 4.1 | 103 | 1.76 (1.10 - 2.83) | 0.033* | ||
| < 4.1 | 49 | ||||
| Leukocytes (G/L) at baseline | |||||
| <5 | 24 | 1.1 (0.58 - 2.07) | 0.796 | ||
| ≥ 5 | 154 | ||||
| Erythrocytes (million/µL) at baseline | |||||
| < 4 | 25 | 1.87 (1.07 - 3.28) | 0.043* | ||
| ≥ 4 | 148 | ||||
| Hemoglobin (g/dL) at baseline | |||||
| < 12 | 25 | 2.02 (1.13 - 3.62) | 0.033* | ||
| ≥ 12 | 148 | ||||
| Thrombocytes (g/L) | |||||
| < 200 | 49 | 1.06 (0.67 - 1.69) | 0.796 | ||
| ≥ 200 | 129 | ||||
| NSE at baseline (ng/mL) | |||||
| > 35 | 52 | 2.37 (1.44 - 3.89) | 0.008* | 1.98 (1.17 - 3.36) | 0.011* |
| ≤ 35 | 96 | ||||
| CgA at baseline (ng/mL) | |||||
| > 200 | 100 | 1.77 (1.14 - 2.76) | 0.027* | 1.76 (1.08 - 2.87) | 0.024* |
| ≤ 200 | 68 | ||||
CRP = C-reactive protein; NSE = neuron specific enolases; CgA = Chromogranin A
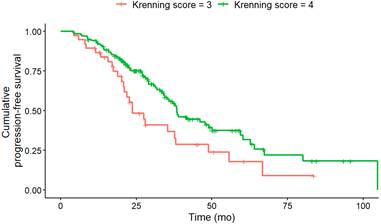
PFS according to KS at baseline. Baseline KS 3 (n = 38) was associated with a significantly (HR, 2.02; 95% CI, 1.27-3.22; p = 0.012) shorter median PFS (KS 3: 23.7; KS 4: 38.4 months) compared to KS 4 (n = 140).
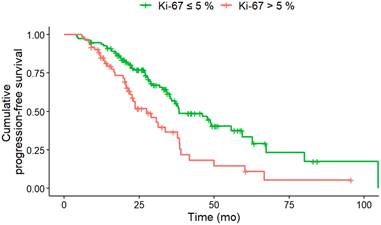
PFS according to Ki-67 at baseline. Baseline Ki-67 index of greater than 5% (n = 60) was associated with a significantly (HR, 2.00; 95% CI, 1.31-3.04; p = 0.008) shorter median PFS (Ki-67 > 5% 27.5 months; Ki-67 ≤ 5%: 38.4 months) compared to Ki-67 index of less than or equal to 5% (n = 111).
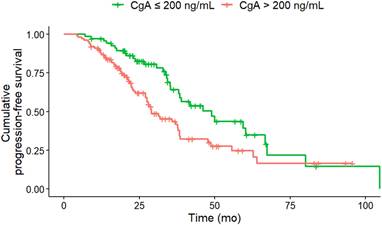
PFS according to CgA at baseline. Baseline CgA of greater than 200 ng/mL (n = 100) was associated with a significantly (HR, 1.77; 95% CI, 1.14-2.76; p = 0.011) shorter median PFS (CgA > 200 ng/ml 29 months; CgA ≤ 200 ng/ml: 46.1 months) compared to CgA of less than or equal to 200 ng/mL (n = 68).
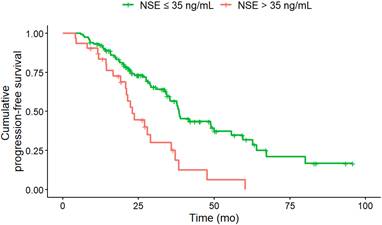
Baseline NSE of greater than 35 ng/mL (n = 52) was associated with a significantly (HR, 2.37; 95% CI, 1.44-3.89; p = 0.008) shorter median PFS (NSE > 35 ng/ml: 23 months; NSE ≤ 35 ng/ml: 38.1 months) compared to NSE of less than or equal to 35 ng/mL (n = 96).
In the multivariate Cox regression analysis at baseline CgA > 200 ng/mL (HR, 1.76; CI, 1.08-2.87; p = 0.024), NSE levels > 35 ng/mL (HR, 1.98; 95% CI, 1.17-3.36; p = 0.011), a Ki-67 index > 5% (HR, 1.89; 95% CI, 1.18-3.02; p = 0.008) and KS 3 (vs. KS 4; HR, 1.94; 95% CI, 1.17-3.21; p = 0.01) were associated with shorter PFS (Table 3). Only the Ki-67 index showed a higher z-score than the KS at baseline, indicative for improved predictive value.
The inclusion of KS into the multivariate analysis model significantly improved the Cox regression model performance, as shown by a reduction in Akaike Information Criterion values (592/596) and an increase in the concordance index (0.66/0.65). Deviance analysis confirmed the value of the KS, with a significant p-value (p = 0.03). The Wald test for individual variables supported the significance of both the Ki-67 index (7.1) and KS (6.7) as independent predictors of PFS.
Discussion
In the present study including 178 GEP-NET patients scheduled for PRRT, we identified in-vivo image-based (KS) and ex-vivo (Ki-67, CgA and NSE) biomarkers as independent predictors to identify patients prone to disease progression, thereby supporting our hypothesis of an integrated imaging, laboratory and histopathological approach for outcome prediction. Of note, we focused on patients scheduled for two cycles of PRRT and thus, the herein identified items may serve as valuable tools to determine high-risk individuals already at an early therapeutic stage.
Clinical and laboratory parameters under PRRT
A significant decrease in NSE levels was evident in patients undergoing two cycles of PRRT between baseline and follow-up. Patients who demonstrated no progress during the follow-up period exhibited significantly lower NSE levels at both time points. This indicates that NSE may serve as a promising circulating serum biomarker for monitoring the response to two cycles of PRRT. The potential of NSE as a predictive biomarker for metastatic GEP-NET following two cycles of PRRT has already been discussed. Ezziddin et al. [25] asserted that a baseline plasma level of NSE > 15 ng/mL was an independent predictor of shorter overall survival. Fuksiewicz et al. [26] demonstrated an association between NSE concentrations and clinical status, confirming the usefulness of NSE in patient monitoring and as a potential predictive indicator for PFS in patients with NENs. In our study CgA exhibited a non-significant decline under two cycles of PRRT, and no correlation could be established between CgA at any time point and progression in follow-up. A number of studies have already demonstrated the predictive role of CgA in monitoring disease progression and in assessing the response to therapy. Sabet et al. [27] reported that an elevated plasma concentration of CgA > 600 ng/mL was associated with an earlier onset of tumor progression. Moreover, patients who presented with carcinoid symptoms exhibited a shorter PFS following two cycles of PRRT [27]. In the NETTER-1 trial focusing on four PRRT cycles, circulating biomarkers such as CgA and NSE were unable to predict response to PRRT or survival [28]. Our results, however, support the use of NSE but not CgA as a serum biomarker of therapy response already after two cycles of PRRT.
Integrated diagnostics for PFS prediction under PRRT
The most common contemporary application of the KS is to assess candidacy for PRRT, typically with a score greater than 2. In our study, a KS 4 was associated with a significantly longer PFS than a KS 3 at baseline in univariate and multivariate analysis. This indicates that patients with an increased in-vivo SSTR expression benefit more from PRRT, which has already been shown on a quantitative assessment [29]. In both univariate and multivariate analysis, CgA levels > 200 ng/dL and NSE levels > 35 ng/dL at baseline were associated with a shorter PFS. This finding has also been reported in phase II study of Everolimus in GEP-NET, as it has been demonstrated that higher baseline levels of CgA are associated with shorter PFS. Patients with the shortest PFS exhibited elevated concentrations of both CgA and NSE at baseline [30]. With regard to OS, a baseline NSE level > 15 ng/mL was identified as a predictor of reduced survival under PRRT in G1/G2 NET [31]. In our study, at uni- and multivariate analysis, a Ki-67 index > 5% at baseline was found to be associated with a shorter PFS after two therapeutic cycles. This finding aligns with the observations reported by Ezziddin et al. [31], who demonstrated that a Ki-67 index greater than 10% was associated with reduced PFS and OS. There is a relevant impact of Ki-67 heterogeneity, especially in NET with high proliferation rates or in cases where imaging and histology show discordant findings, such as mismatches in PET imaging. Ki-67 heterogeneity refers to variations in proliferative activity within different tumor regions, which can significantly affect both prognostic evaluation and therapeutic response [32,33]. These intratumoral differences complicate treatment planning and outcome prediction, particularly in patients considered for targeted therapies like PRRT [34]. Importantly, biopsies often reflect only a small tumor area, potentially under- or overestimating the true proliferative activity. This underlines the importance of recognizing Ki-67 variability when selecting and evaluating patients for PRRT. In univariate analysis, the primary tumor location in the pancreas was associated with higher risk for disease progression, which corroborates the findings of Xu et al. [35]. Patients with GEP-NET of the pancreas exhibited the poorest median OS. In the univariate analysis, an erythrocyte level of ≤ 4 million/µL and hemoglobin ≤ 12 g/dl at baseline were also associated with a shorter PFS. However, Halperin et al. demonstrated that a reduction in red blood cell mass, hemoglobin, and/or hematocrit levels are all associated with an unfavorable prognosis in patients with pancreatic NET [36]. As observed by Komaç et al. [37] elevated CRP, particularly if it was > 20 mg/dL, was associated with disease progression. This finding was corroborated by our study, which demonstrated that CRP levels > 1 mg/dL at baseline were associated with a shorter PFS in univariate analysis.
In the multivariate analysis, the Ki-67 index demonstrated the highest predictive value for PFS followed by the KS. Including the latter metric in the multivariate model significantly improved the Cox regression model performance and deviance analysis confirmed the importance of the KS. The Wald test for individual variables supported the significance of both, the Ki-67 index and KS, as independent predictors of PFS. Tao et al. reported already that the overall prognosis of GEP-NET patients showed a decreasing trend with the increase of Ki-67, which confirmed the significance of Ki-67 index as a prognostic marker for the prognosis of GEP-NET [38]. In addition, our study shows that evaluation of the KS at baseline has similar importance for predicting PFS as the Ki-67 index, CgA and NSE. Therefore, the molecular imaging score of Krenning should be employed in conjunction with histopathological (Ki-67) and biochemical (NSE, CgA) biomarkers at baseline for the integrated diagnosis of PFS prediction in GEP-NET under two cycles of PRRT. Of note, all four parameters are easily obtained and are part of the standard diagnostic work-up in GEP-NET patients. Our multivariate Cox regression model, which integrates biochemical markers (CgA, NSE), histopathological data (Ki-67 index), and molecular imaging (KS), reflects an integrated diagnostic approach to prognostic assessment in PRRT-treated NET patients. The combination of these multimodal parameters improved the overall model performance, as indicated by a reduction in AIC and an increase in the C-index. This finding supports the concept of integrated diagnostics by demonstrating how the inclusion of complementary clinical, molecular, and imaging data can enhance prognostic accuracy beyond single-modality assessments. Moreover, the combination of multiple biomarkers may enhance the prediction of PFS by capturing complementary prognostic signals. Integrative approaches that combine histopathological markers, functional imaging parameters, and circulating biomarkers have shown to provide a more comprehensive prognostic assessment [39]. This allows for improved patient stratification, enabling more personalized and effective selection of candidates for PRRT [40]. Combining biomarkers can help overcome the limitations of each individual marker, especially in cases where one parameter alone offers limited predictive value. For example, combining SSR expression with Ki-67 improves the ability to differentiate between indolent and aggressive disease courses. Finally, the predictive relevance of biomarkers like Ki-67 and KS specifically in the context of PRRT-treated patients highlights their added value beyond general prognostication in NETs. These biomarkers are associated with tumor radiosensitivity and can support the identification of patients most likely to benefit from PRRT [41,42]. Unlike their broader prognostic role, their predictive power in PRRT settings contributes uniquely to guiding clinical decisions aimed at maximizing treatment response and disease control [43]. In this context, high somatostatin receptor expression indicates a higher likelihood of effective radionuclide binding, while lower Ki-67 values are associated with slower tumor progression. The integration of both biomarkers provides a practical framework to tailor PRRT to patients most likely to achieve durable responses.
Our findings are in line with previous studies investigating biomarker-based prediction of PRRT outcomes. Multiple recent studies highlight the Ki-67 proliferation index as a key predictor of PRRT efficacy, showing that patients with lower Ki-67 (e.g. ≤~50%) achieve significantly longer median PFS and OS after PRRT than those with higher proliferative rates [44] Likewise, imaging-based measures of SSR expression such as the KS correlate strongly with treatment response, as higher uptake scores have been associated with greater tumor remission rates and extended PFS compared to lower scores [45]. In terms of circulating biomarkers, baseline CgA has been linked to tumor burden and poorer PRRT outcomes - for example, one analysis identified elevated CgA as an adverse prognostic factor (combined with tumor volume, HR ~2.7 for 5-year OS) and determined a high cutoff (~1250 μg/L) that predicted significantly lower survival [46]. NSE has also emerged as a potential predictor in limited data: in one cohort of 74 PRRT-treated NET patients, a baseline NSE >15 ng/mL independently predicted shorter post-PRRT overall survival (hazard ratio ~2.2, p = 0.035) [45]. Overall, these independent reports are consistent with our findings and support the growing consensus that a low proliferative index, strong somatostatin receptor expression, and favorable biochemical profiles are associated with improved outcomes under PRRT. Furthermore, our retrospective analysis in a detailed-characterized cohort of 178 patients demonstrates that an integrated diagnostic approach—combining imaging, biochemical, and histopathological parameters—can effectively predict PFS in GEP-NET patients undergoing PRRT. Further studies may also evaluate other PET-based metrics, such as standardized uptake value or SSTR-positive tumor volume. Nonetheless, the KS as a visual assessment tool on a four-point scale is easy to implement in clinical practice, thereby avoiding the strenuous process of whole-body PET segmentation.
Limitations
The primary limitations of this study are its retrospective design, limited follow-up time, and single-center assessment. As this study included only patients with GEP-NET (G1 and G2) treated with at least two consecutive cycles of PRRT, it should be noted that some patients underwent even more cycles and thus, future analyses should also assess predictive parameters at baseline after four PRRT cycles. RECIST 1.1 offer a standardized approach for assessing tumor response to therapy based on changes in lesion size and are currently endorsed by the ENETS for evaluating PRRT response [47]. However, given the often indolent course of NETs and the frequent occurrence of metastatic dedifferentiation over time, relying solely on morphological changes may underestimate the actual therapeutic effect [6,48]. Consequently, RECIST 1.1 shows limited sensitivity in capturing treatment response in NETs. In this study, PFS was derived from the MDT decision, which defined clinical progression based on a semi-quantitative and visual assessment of relevant tumor dynamics—conceptually similar to RECIST 1.1, though not applied in a strict or formalized manner. Another limitation of this study is the use of different SSTR-targeting radiotracers for PET imaging, including [⁶⁸Ga]Ga-DOTA-TATE, [⁶⁸Ga]Ga-DOTA-TOC, [⁶⁸Ga]Ga-DOTA-NOC, and [¹⁸F]SiTATE. While these tracers have shown comparable diagnostic accuracy in clinical practice, minor differences in receptor subtype affinity and biodistribution may influence image interpretation. However, these differences are considered minimal and are unlikely to significantly affect the semiquantitative assessment of the KS, which remains comparable across tracers [4,6-9].
Conclusions
Integrated baseline diagnostics including in-vivo PET-based (Krenning) and ex-vivo histopathological (Ki-67) and laboratory (CgA and NSE) metrics in GEP-NET patients scheduled for two cycles of PRRT have been demonstrated to enhance the accuracy of PFS prediction. As such, those routinely assessed clinical parameters may be useful to identify high-risk individuals prone to disease progression already at an early therapeutic stage.
Abbreviations
[18F]FDG: 2-[18F]fluoro-2-deoxy-D-glucose; [18F]SiTATE: [18F] silicon fluoride acceptor tagged Tyr(3)octreotate; [68Ga]Ga-DOTA-TATE: [68Ga]Ga-DOTA(0)-Phe(1)-Tyr(3))octreotate; [68Ga]Ga-DOTA-TOC: [68Ga]Ga-DOTA(0)-Phe(1)-Tyr(3))octreotide; [68Ga]Ga-DOTA-NOC: [68Ga]Ga-DOTA,1-Nal(3)]-octreotide; [177Lu]Lu-DOTA-TATE: [177Lu]177Lu-DOTA-Tyr3-octreotate; CgA: Chromogranin A; CRP: C-reactive protein; CT: Computed tomography; ENETS: European Neuroendocrine Tumor Society; FWHM: Full width at half maximum; GEP-NET: Gastroenteropancreatic neuroendocrine tumor; MDT: Multidisciplinary tumor board; NANETS: North American Neuroendocrine Tumor Society; NSE: Neuron-specific enolase; PET: Positron emission tomography; PFS: Progression-free survival; RECIST: Response Evaluation Criteria In Solid Tumors; PRRT: Peptide Receptor Radionuclide Therapy; SSTR: Somatostatin receptor.
Competing Interests
Funding for this study was provided by Wilhelm Vaillant Stiftung. MB received consulting/speaker honoraria from Life Molecular Imaging, GE Healthcare, MIAC and Roche, and reader honoraria from Life Molecular Imaging. MB was funded by the Deutsche Forschungsgemeinschaft (DFG) under Germany's Excellence Strategy within the framework of the Munich Cluster for Systems Neurology (EXC 2145 SyNergy - ID 390857198). LMU reports funding from Bayerisches Zentrum für Krebsforschung (BZKF) and from the Munich Clinician Scientist Program (MCSP) outside of the submitted work. She reports fees from Novartis (speaker), Telix (consultant) and Astellas Pharma Inc. (speaker) outside of the submitted work. AH reports compensation for scientific consulting by ABX advanced biochemical compounds. He is funded by the Deutsche Forschungsgemeinschaft (DFG, German Research Foundation) - 545058105. RAW reports speaker honoraria from Novartis/AAA and PentixaPharm, reports advisory board work for Novartis/AAA and Bayer.
References
1. Mizutani G, Nakanishi Y, Watanabe N. et al. Expression of Somatostatin Receptor (SSTR) Subtypes (SSTR-1, 2A, 3, 4 and 5) in Neuroendocrine Tumors Using Real-time RT-PCR Method and Immunohistochemistry. Acta Histochem Cytochem. 2012;45:167-76
2. Han G, Hwang E, Lin F. et al. RYZ101 (Ac-225 DOTATATE) Opportunity beyond Gastroenteropancreatic Neuroendocrine Tumors: Preclinical Efficacy in Small-Cell Lung Cancer. Mol Cancer Ther. 2023;22:1434-43
3. Kwekkeboom DJ, Kam BL, van Essen M. et al. Somatostatin-receptor-based imaging and therapy of gastroenteropancreatic neuroendocrine tumors. Endocr Relat Cancer. 2010;17:R53-73
4. Kabasakal L, Demirci E, Ocak M. et al. Comparison of (6)(8)Ga-DOTATATE and (6)(8)Ga-DOTANOC PET/CT imaging in the same patient group with neuroendocrine tumours. Eur J Nucl Med Mol Imaging. 2012;39:1271-7
5. Abbate R, Gori AM, Martini F. et al. Defibrotide reduces monocyte PAI-2 and procoagulant activity. Semin Thromb Hemost. 1995;21:245-50
6. Halfdanarson TR, Mallak N, Paulson S. et al. Monitoring and Surveillance of Patients with Gastroenteropancreatic Neuroendocrine Tumors Undergoing Radioligand Therapy. Cancers (Basel). 2023;15(19):4836
7. Velikyan I, Sundin A, Sorensen J. et al. Quantitative and qualitative intrapatient comparison of 68Ga-DOTATOC and 68Ga-DOTATATE: net uptake rate for accurate quantification. J Nucl Med. 2014;55:204-10
8. Poeppel TD, Binse I, Petersenn S. et al. 68Ga-DOTATOC versus 68Ga-DOTATATE PET/CT in functional imaging of neuroendocrine tumors. J Nucl Med. 2011;52:1864-70
9. Ilhan H, Lindner S, Todica A. et al. Biodistribution and first clinical results of (18)F-SiFAlin-TATE PET: a novel (18)F-labeled somatostatin analog for imaging of neuroendocrine tumors. Eur J Nucl Med Mol Imaging. 2020;47:870-80
10. Hicks RJ, Kwekkeboom DJ, Krenning E. et al. ENETS Consensus Guidelines for the Standards of Care in Neuroendocrine Neoplasia: Peptide Receptor Radionuclide Therapy with Radiolabeled Somatostatin Analogues. Neuroendocrinology. 2017;105:295-309
11. Knigge U, Capdevila J, Bartsch DK. et al. ENETS Consensus Recommendations for the Standards of Care in Neuroendocrine Neoplasms: Follow-Up and Documentation. Neuroendocrinology. 2017;105:310-9
12. Pavel M, Valle JW, Eriksson B. et al. ENETS Consensus Guidelines for the Standards of Care in Neuroendocrine Neoplasms: Systemic Therapy - Biotherapy and Novel Targeted Agents. Neuroendocrinology. 2017;105:266-80
13. Hope TA, Bodei L, Chan JA. et al. NANETS/SNMMI Consensus Statement on Patient Selection and Appropriate Use of (177)Lu-DOTATATE Peptide Receptor Radionuclide Therapy. J Nucl Med. 2020;61:222-7
14. Reccia I, Pai M, Kumar J, Spalding D, Frilling A. Tumour Heterogeneity and the Consequent Practical Challenges in the Management of Gastroenteropancreatic Neuroendocrine Neoplasms. Cancers. 2023;15:1861
15. Perren A, Couvelard A, Scoazec J-Y. et al. ENETS Consensus Guidelines for the Standards of Care in Neuroendocrine Tumors: Pathology: Diagnosis and Prognostic Stratification. Neuroendocrinology. 2017;105:196-200
16. Kunz PL, Reidy-Lagunes D, Anthony LB. et al. Consensus guidelines for the management and treatment of neuroendocrine tumors. Pancreas. 2013;42:557-77
17. Garcia-Carbonero R, Sorbye H, Baudin E. et al. ENETS Consensus Guidelines for High-Grade Gastroenteropancreatic Neuroendocrine Tumors and Neuroendocrine Carcinomas. Neuroendocrinology. 2016;103:186-94
18. Krestin GP, Grenier PA, Hricak H. et al. Integrated diagnostics: proceedings from the 9th biennial symposium of the International Society for Strategic Studies in Radiology. Eur Radiol. 2012;22:2283-94
19. Chu J, Yang D, Wang L, Xia J. Nomograms predicting survival for all four subtypes of breast cancer: a SEER-based population study. Ann Transl Med. 2020;8:544
20. Zhang Z, Cai Q, Wang J. et al. Development and validation of a nomogram to predict cancer-specific survival in nonsurgically treated elderly patients with prostate cancer. Sci Rep. 2023;13:17719
21. Krenning EP, Valkema R, Kooij PP. et al. Scintigraphy and radionuclide therapy with [indium-111-labelled-diethyl triamine penta-acetic acid-D-Phe1]-octreotide. Ital J Gastroenterol Hepatol. 1999;31(Suppl 2):S219-223
22. Bodei L, Mueller-Brand J, Baum RP. et al. The joint IAEA, EANM, and SNMMI practical guidance on peptide receptor radionuclide therapy (PRRNT) in neuroendocrine tumours. Eur J Nucl Med Mol Imaging. 2013;40:800-16
23. Longato E, Vettoretti M, Di Camillo B. A practical perspective on the concordance index for the evaluation and selection of prognostic time-to-event models. J Biomed Inform. 2020;108:103496
24. Cavanaugh JE, Neath AA. The Akaike information criterion: Background, derivation, properties, application, interpretation, and refinements. WIREs Comput Stat. 2019;11:e1460
25. Ezziddin S, Attassi M, Yong-Hing CJ. et al. Predictors of long-term outcome in patients with well-differentiated gastroenteropancreatic neuroendocrine tumors after peptide receptor radionuclide therapy with 177Lu-octreotate. J Nucl Med Off Publ Soc Nucl Med. 2014;55:183-90
26. Fuksiewicz M, Kowalska M, Kolasinska-Cwikla A, Kotowicz B. Serum levels of neuron-specific enolase as a prognostic factor for disease progression in patients with GET/NEN in the pancreas and the small intestine. Endocr Connect. 2022;11:e210647
27. Sabet A, Dautzenberg K, Haslerud T. et al. Specific efficacy of peptide receptor radionuclide therapy with (177)Lu-octreotate in advanced neuroendocrine tumours of the small intestine. Eur J Nucl Med Mol Imaging. 2015;42:1238-46
28. Strosberg JR, Caplin ME, Kunz PL. et al. (177)Lu-Dotatate plus long-acting octreotide versus high-dose long-acting octreotide in patients with midgut neuroendocrine tumours (NETTER-1): final overall survival and long-term safety results from an open-label, randomised, controlled, phase 3 trial. Lancet Oncol. 2021;22:1752-63
29. Ortega C, Wong RKS, Schaefferkoetter J. et al. Quantitative 68Ga-DOTATATE PET/CT Parameters for the Prediction of Therapy Response in Patients with Progressive Metastatic Neuroendocrine Tumors Treated with 177Lu-DOTATATE. J Nucl Med Off Publ Soc Nucl Med. 2021;62:1406-14
30. Yao JC, Pavel M, Phan AT. et al. Chromogranin A and neuron-specific enolase as prognostic markers in patients with advanced pNET treated with everolimus. J Clin Endocrinol Metab. 2011;96:3741-9
31. Ezziddin S, Attassi M, Yong-Hing CJ. et al. Factors predicting outcome of G1/2 GEP NET after PRRT with Lu177-octreotate. J Clin Oncol. 2012;30:e14565-e14565
32. Yang Z, Tang LH, Klimstra DS. Effect of tumor heterogeneity on the assessment of Ki67 labeling index in well-differentiated neuroendocrine tumors metastatic to the liver: implications for prognostic stratification. Am J Surg Pathol. 2011;35:853-60
33. Shi H, Jiang C, Zhang Q, Qi C, Yao H, Lin R. Clinicopathological heterogeneity between primary and metastatic sites of gastroenteropancreatic neuroendocrine neoplasm. Diagn Pathol. 2020;15:108
34. Varghese DG, Del Rivero J, Bergsland E. Grade Progression and Intrapatient Tumor Heterogeneity as Potential Contributors to Resistance in Gastroenteropancreatic Neuroendocrine Tumors. Cancers. 2023;15:3712
35. Xu Z, Wang L, Dai S. et al. Epidemiologic Trends of and Factors Associated With Overall Survival for Patients With Gastroenteropancreatic Neuroendocrine Tumors in the United States. JAMA Netw Open. 2021;4:e2124750
36. Halperin R, Ahron-Hananel G, Badarna M. et al. Plasma Hemoglobin and Red Blood Cell Mass Levels as Dynamic Prognostic Markers for Progression and Survival in Pancreatic Neuroendocrine Tumors. Horm Metab Res Horm Stoffwechselforschung Horm Metab. 2021;53:810-7
37. Komaç Ö, Bengi G, Sağol Ö, Akarsu M. C-reactive protein may be a prognostic factor for the whole gastroenteropancreatic neuroendocrine tumor group. World J Gastrointest Oncol. 2019;11:139-52
38. Tao Z, Xue R, Wei Z. et al. The assessment of Ki-67 for prognosis of gastroenteropancreatic neuroendocrine neoplasm patients: a systematic review and meta-analysis. Transl Cancer Res. 2023;12:1980-91
39. Luley K, Gebauer J, Gebauer N. et al. [Gastroenteropancreatic neuroendocrine neoplasms-Heterogeneity, management and perspectives of treatment and research]. Internist. 2020;61:875-90
40. Bodei L, Raj N, Do RK. et al. Interim Analysis of a Prospective Validation of 2 Blood-Based Genomic Assessments (PPQ and NETest) to Determine the Clinical Efficacy of 177Lu-DOTATATE in Neuroendocrine Tumors. J Nucl Med Off Publ Soc Nucl Med. 2023;64:567-73
41. Iravani A, Parihar AS, Akhurst T, Hicks RJ. Molecular imaging phenotyping for selecting and monitoring radioligand therapy of neuroendocrine neoplasms. Cancer Imaging Off Publ Int Cancer Imaging Soc. 2022;22:25
42. Hope TA, Pavel M, Bergsland EK. Neuroendocrine Tumors and Peptide Receptor Radionuclide Therapy: When Is the Right Time? J Clin Oncol Off J Am Soc Clin Oncol. 2022;40:2818-29
43. Santo G, Di Santo G, Virgolini I. Peptide Receptor Radionuclide Therapy of Neuroendocrine Tumors: Agonist, Antagonist and Alternatives. Semin Nucl Med. 2024;54:557-69
44. Sorbye H, Kong G, Grozinsky-Glasberg S, Strosberg J. PRRT in high-grade digestive neuroendocrine neoplasms (NET G3 and NEC). J Neuroendocrinol. 2025;37:e13443
45. Liberini V, Huellner MW, Grimaldi S. et al. The Challenge of Evaluating Response to Peptide Receptor Radionuclide Therapy in Gastroenteropancreatic Neuroendocrine Tumors: The Present and the Future. Diagn Basel Switz. 2020;10:1083
46. Trautwein NF, Schwenck J, Jacoby J. et al. Long-term prognostic factors for PRRT in neuroendocrine tumors. Front Med. 2023;10:1169970
47. Sundin A, Arnold R, Baudin E. et al. ENETS Consensus Guidelines for the Standards of Care in Neuroendocrine Tumors: Radiological, Nuclear Medicine & Hybrid Imaging. Neuroendocrinology. 2017;105:212-44
48. van Treijen MJC, Schoevers JMH, Heeres BC. et al. Defining disease status in gastroenteropancreatic neuroendocrine tumors: Choi-criteria or RECIST? Abdom Radiol NY. 2022;47:1071-81
49. Herr FL, Dascalescu C, Fabritius MP. et al. PET- and CT-Based Imaging Criteria for Response Assessment of Gastroenteropancreatic Neuroendocrine Tumors Under Radiopharmaceutical Therapy. J Nucl Med Off Publ Soc Nucl Med. 2025;124:268621
Author contact
![]() Corresponding author: Felix L. Herr, LMU University Hospital, Marchioninistr. 15 81377 München; Telephone number: +4989/4400-76620; Email: felix.herruni-muenchen.de.
Corresponding author: Felix L. Herr, LMU University Hospital, Marchioninistr. 15 81377 München; Telephone number: +4989/4400-76620; Email: felix.herruni-muenchen.de.