Impact Factor
- Issue 14; 2026
- Issue 13; 2026
- Issue 12; 2026
- Issue 11; 2026
- Issue 10; 2026
- Volume 16; 2026
- Advance Articles
- Past Issues
- Cover Images
- Cover Suggestion
- Index & Coverage
- Special Issues
Introduction
Results
Discussion
Materials and Methods
Abbreviations
Supplementary Material
Acknowledgements
References
International Journal of Biological Sciences
International Journal of Medical Sciences
 Global reach, higher impact

Theranostics 2025; 15(13):6516-6533. doi:10.7150/thno.114912 This issue Cite
Research Paper
Loss of SLC25A20 in Pancreatic Adenocarcinoma Reversed the Tumor-Promoting Effects of a High-Fat Diet
Sang Myung Woo1,2,3, Ho Lee2,4, Joon Hee Kang2,5, Mingyu Kang4,5, Wonyoung Choi2,4,6, Sung Hoon Sim6, Jung Won Chun1,2,3, Nayoung Han7, Kyung-Hee Kim8, Woojin Ham4,5, Woosol Hong4,5, Chaeyoung Kim4,5, Jeong Hwan Park4, Dawool Han9, Jong In Yook9, Woo Jin Lee1,3, Soo-Youl Kim4,5 ![]()
1. Research Institute, National Cancer Center, Goyang, Republic of Korea
2. Department of Cancer Biomedical Science, National Cancer Center Graduate School of Cancer Science and Policy, Goyang, Republic of Korea
3. Center for Liver and Pancreatobiliary Cancer, National Cancer Center, Goyang, Republic of Korea.
4. Cancer Molecular Biology Branch, Research Institute, National Cancer Center, Goyang, Republic of Korea
5. New Cancer Cure-Bio Co., Goyang, Republic of Korea
6. Therapeutic Resistance Research Branch, Research Institute and Hospital, National Cancer Center, Goyang, Republic of Korea
7. Department of Pathology, Research Institute and Hospital, National Cancer Center, Goyang, Republic of Korea
8. Proteomics Core Facility, Research Core Center, Research Institute, National Cancer Center, Goyang, Republic of Korea
9. Department of Oral Pathology, Yonsei University College of Dentistry, Seoul, Korea
Received 2025-4-2; Accepted 2025-5-7; Published 2025-5-25
Abstract

Rationale: Although it is known that High-fat diet (HFD) promotes the development of pancreatic ductal adenocarcinoma (PDAC), no direct link between HFD and cancer has been identified. Previously, we showed that ATP production by cancer cells depends on fatty acid oxidation (FAO); therefore, we hypothesized that blocking FAO may prevent HFD-induced promotion of PDAC growth.
Methods: To determine whether FAO is increased in PDAC patients, we analyzed a tissue microarray by immunohistochemical staining to detect carnitine palmitoyl transferase I. To block FAO, SLC25A20 (carnitine-acylcarnitine carrier) was knocked down in cancer cells, which was implanted for xenograft in mice and treated with a high-fat diet (HFD, 60% fat). To compare cancer development including survival rates, and histopathological differences were analyzed by crossbreeding of KPC mice (KrasG12D/+; Trp53R172H/+; Pdx1-Cre) with KPC/Slc25a20+/- mice.
Results: SLC25A20 knockdown in cancer cells reduced ATP production and inhibited cell growth. Proteome analysis revealed that SLC25A20 knockdown reduced cancer cell growth significantly due to inactivation of mTOR via decreased ATP production, ultimately leading to cell death. The median survival time of KPC/Slc25a20+/- tumor-bearing mice was 3.1 weeks longer than that of KPC tumor-bearing mice. In mice fed an HFD, the growth of xenografts derived from SLC25A20 knockdown PDAC cells was 65-95% lower than that of xenografts derived from control cells.
Conclusion: Blocking FAO by SLC25A20 knockdown reversed HFD-induced promotion of PDAC growth.
Keywords: PDAC, High-fat diet, Fatty acid oxidation, Pancreatic cancer, SLC25A20
Introduction
Studies have shown that high-fat diet (HFD) affects tumor metabolism, which can promote tumor growth and development in various cancers such as endometrial cancer [1], prostate cancer [2], and colorectal cancer [3]. Although the exact mechanism varies by cancer site, including PDAC, the precise mechanisms underlying these associations between HFD and tumor promotion are still being explored and not fully understood [1-4]. Obesity is a very complex disease, with genetic, environmental, and multifactorial causes, so it is very difficult to establish a link between obesity and cancer with a general mechanism. Therefore, we investigated the link between HFD-induced obesity and tumor promotion using mice models. Leptin-deficient ob/ob mice are obese mice that are suitable models for investigating the indirect causes of cancer and the development process of cancer [5]. Balb/c to high-fat diet (HFD) model of tumor promotion is a good model to investigate tumor promotion directly by obesity signature of the increased BMI [6]. HFD is not only associated with an increased risk of developing cancer [7], but it can also increase the risk of cancer recurrence and mortality [8]. Three significant mechanisms linking to cancer have been proposed to explain how HFD-induced obesity increases the risk of cancer [9]. First, adipose tissue with HFD secretes vast amounts of estrogen, which is linked to an increased risk of breast, ovary, and other types of cancer [10]. Second, an increased body mass index (BMI) causes hyperinsulinemia (elevated serum levels of insulin) and increased levels of insulin-like growth factor-1 (IGF-1) [11]. The level of IGF-1 in cancer patients is often higher than that in those without cancer, and levels correlate with an increased risk of colon, renal, prostate, and endometrial cancer [11, 12]. Third, adipokines such as leptin (which have proinflammatory effects) secreted by adipose tissue may promote cancer development [13]. Increasing levels of leptin correlate with increased body fat percentage, which in turn increases the risk of biliary tract and other types of cancer [14]. However, we still do not understand how HFD-induced obesity drives cancer development directly.
Animals fed a HFD are used as models for obesity, with data being compared with those obtained from animals fed a calorie-balanced no-fat diet (NFD). The diet-induced obesity model is an animal model based on high-fat or high-density diets [15]. Previously, we used an HFD mouse model and a homograft KC (KrasG12D/+; Pdx1-Cre) model to show that a calorie-balanced HFD results in a significant increase in the growth of human PDAC xenograft tumors [16]. Under normal proliferative conditions, fatty acid oxidation (FAO) is a major source of ATP production in cancer cells and operates independently of obesity [17]. FAO is responsible for the production of key energy metabolites such as NADH and ATP, as demonstrated by a series of experiments in which glucose-free culture conditions did not alter ATP levels in cancer cells [16-18]. Therefore, we propose that HFD-induced tumor promotion can be explained directly by overproduction of ATP via FAO. The present study asks the following questions: is FAO increased in pancreatic cancer? Does HFD promote the growth of pancreatic cancer? And does knocking down FAO-related genes in pancreatic cancer cells reverse HFD-induced tumor growth?
Results
Increased expression of FAO is associated with a significant reduction in the survival of PDAC
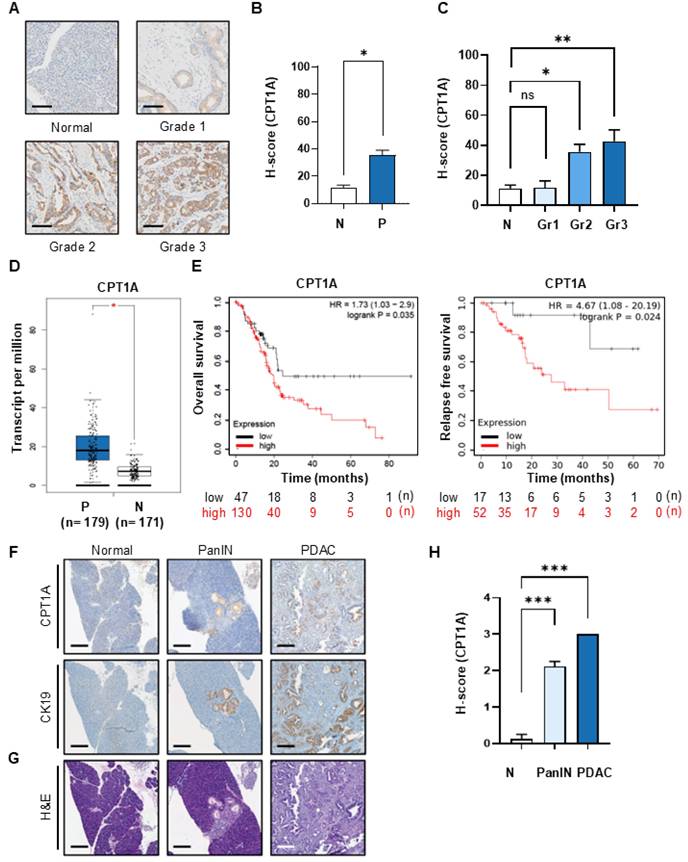
To investigate the impact of FAO on the development of pancreatic cancer, we compared the expression of CPT1A, a key marker of FAO, by performing immunohistochemical analysis of tissues from patients with pancreatic cancer (Figure 1A and Figure S1A). CPT1A is essential for b-oxidation of long-chain fatty acids. This transfer system catalyzes the synthesis of acyl-carnitine, which is necessary for FAO. The average H-score for CPT1A in normal tissue was 11.3, while that in pancreatic cancer tissue was an average of 35.5, i.e., a 3.14-fold increase in expression compared with that in normal tissue (Figure 1B). When assessed against grade, the H-score values for pancreatic cancer tissues were as follows: 11.8 for grade 1, 35.6 for grade 2, and 42.7 for grade 3 (Figure 1C). The increase in CPT1A expressions observed in grade 2 and grade 3 pancreatic cancer was statistically significant; indeed, there was an up to 4-fold increase in the H-score between grade 3 cancer and normal tissue. Expression of CPT1A mRNA also increased in patients with pancreatic cancer, as shown by the TCGA data (Figure 1D). There was an inverse correlation between high CPT1A expression and OS and RFS (Figure 1E). Next, we established a spontaneous pancreatic cancer KPC mouse model (KrasG12D/+; Trp53R172H/+; Pdx1-Cre) and validated the increase in CPT1A expression during cancer progression. Histological analysis of pancreatic tissue from KPC mice was performed by H&E staining to identify normal, PanIN, and PDAC lesions. We then compared CPT1A expression levels between the selected tissues (Figure 1F and Figure S1B). Low CPT1A expression was observed in normal mouse pancreatic tissue; however, PanIN, and PDAC tissues showed higher expression of CPT1A than normal tissue. This increase of CPT1A expression correlated with the increase of CK-19 (Figure 1F & G, Figure S1C), which showed statistically significant (Figure 1H).
Expression of the FAO marker CPT1A increases as the grade of PDAC increases. (A) Immunohistochemical (IHC) staining of CPT1A using tissue microarrays derived from normal (n = 27) controls and patients with grade 1 (n = 18), grade 2 (n = 74), or grade 3 (n = 45) PDAC. Representative images were selected from the TMA (Figure S1A). Scale bar = 100 µm. (B) H-scores for normal (N, n = 27) and tumor tissues (P, n = 137), were calculated using Inform software. The median H-score for CPT1A in normal and pancreatic cancer tissues was 11.30 and 35.50, respectively. (C) H-Scores for normal (N, n = 27), grade 1 (Gr1, n = 18), grade 2 (Gr2, n = 74), and grade 3 (Gr3, n = 45) pancreatic tissue. The median H-score for CPT1A in grade 1, 2, and 3 PDAC tissues was 11.78, 35.64, and 42.71, respectively. (D) CPT1A mRNA levels in PDAC patients (P, n = 179) were compared with those in matched normal (N, n = 171) controls using the GEPIA website (http://gepia.cancer-pku.cn/). (E) Pancreatic adenocarcinoma datasets related to CPT1A expression were analyzed using the Kaplan-Meier Plotter (https://kmplot.com/analysis/). PDAC patients were shown with high expression of CPT1A (red line) and with low expression of CPT1A (black line). (F, G). Representative IHC images of CPT1A and CK-19 expression (F), and H&E (G) staining of the pancreas from normal, low-grade PanIN, high-grade PanIN, and PDAC KPC mice (KrasG12D; Trp53R172H; Pdx1-Cre). (H). H-score scores for normal (n = 8), PanIN (n = 27), and PDAC (n = 5) tissues. Scale bar = 150 µm. The median of CPT1A H-scores in normal, PanIN, and PDAC tissues were 0.125, 2.111, and 3, respectively. *p < 0.05, **p < 0.01, ***p < 0.001.
To evaluate the impact of HFD on cancer growth and development in the KPC mouse model, we fed them either an HFD (60% fat) or an RD (regular diet, 18% fat). The diets were initiated at 12 weeks of age, which is when pancreatic cancer typically develops in this model. Mice in the HFD group exhibited an average weight increase of 24% when compared with the RD group (Figure S2A). Additionally, the average BMI values for the HFD and RD groups were 0.43 and 0.36, respectively (Figure S2B). The median survival time of KPC mice in the HFD group (16 weeks) was 2 weeks shorter than that of mice in the RD group (18 weeks; p = 0.003; Figure S2C). Immunohistochemical staining using IHC (CK19) and H&E staining to identify PanIN stage lesions with similar histological features between groups revealed a 2.2-fold increase in the expression of the FAO marker CPT1A in the HFD group compared to the RD group (Figure S2D, Figure S3A & B).
An increase in fatty acid supplementation promotes PDAC growth directly in vitro
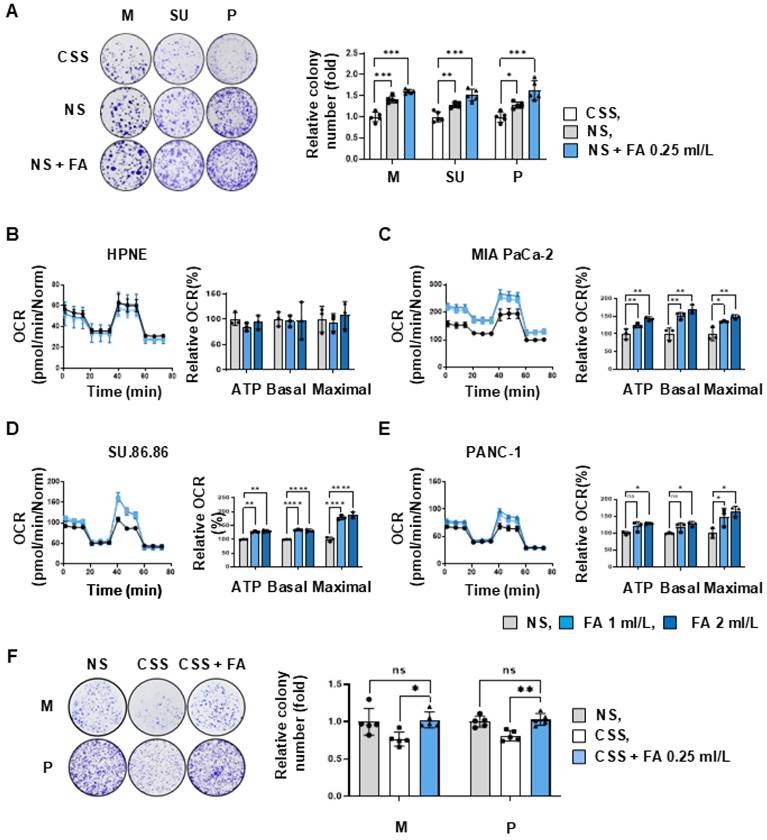
To investigate the effects of fatty acids on pancreatic cancer cells, we cultured representative pancreatic cancer cell lines MIA PaCa-2, SU.86.86, and PANC-1 in a medium supplemented with either normal serum (NS) or charcoal-stripped serum (CSS), which has a 99% reduction in free fatty acid content [19]. Pancreatic cancer cells cultured in CSS medium showed an approximately 28-41% reduction in colony formation compared to the control (NS medium, Figure 2A). When the NS medium was supplemented with fatty acids (0.25 ml/L, NS+FA), colony formation by all cell lines increased by about 22% compared with that observed in the NS medium alone (Figure 2A). Therefore, the increase of colony formation between CSS and NS + FA was about 43-63%. This implies that PDAC cancer cell lines depend on fatty acids to drive proliferation. To determine whether growth promotion by fatty acids is related to ATP production, we conducted oxygen consumption rate (OCR) assays after treating cells with fatty acids at varying concentrations. In normal pancreatic cells (hTERT-HPNE), an increase in fatty acid uptake did not affect intracellular basal respiration or ATP production (Figure 2B). By contrast, treatment of the pancreatic cancer cell line MIA PaCa-2 with fatty acids (2 ml/L) increased basal respiration by 71%, and ATP production by 43%, when compared with NS (Figure 2C). In SU.86.86 cells, fatty acid treatment increased basal respiration by 32 % and ATP production by 30% (Figure 2D). Fatty acid treatment of PANC-1 cells increased basal respiration by 27% and ATP production by 29% (Figure 2E), To demonstrate that fatty acid depletion was the main cause of the inhibition of cancer cell proliferation by CSS, we added fatty acids (0.25 ml/L, CSS+FA) to the CSS medium to test whether cancer cell proliferation was restored (Figure 2F). We observed that FA supplement after CSS treatment restored about 70% or more of the CSS-induced reduction in colony growth (Figure 2F).
Cancer cells rely on fatty acids to produce ATP and promote growth. (A) To test whether growth of pancreatic cancer cells was evaluated in a clonogenic assay after culture for 2 weeks in the presence of charcoal-stripped serum (CSS), or normal serum (NS, 10%), or NS medium supplemented with fatty acids (NS + FA 0.25 ml/L) (n=5). (B-E) The increase in ATP production following FA dose-dependent treatment was measured using a seahorse XFe96 analyzer. (B) In hTERT-HPNE normal cells, additional treatment with FA did not cause changes in ATP synthesis. ATP levels were FA dose-dependently increased in MIA PaCa-2 (C), SU.86.86 (D), and PANC-1 (E). (F) To test whether the reduced growth of pancreatic cancer cells by CSS treatment (A) can be rescued by fatty acid treatment (CSS + FA 0.25 ml/L) (n=5). Data was shown as the mean ± SD of at least three experiments. *p < 0.05, **p < 0.01, ***p < 0.001.
Blocking FAO by knocking down SLC25A20 suppresses ATP production
Intracellular ATP production via FAO occurs predominantly in the mitochondria (Figure 3A). To briefly summarize FAO in the mitochondria: long-chain fatty acids can be activated as a long-chain (LC) acyl-CoA; however, they cannot freely diffuse through the mitochondrial inner membrane. Therefore, they require a shuttle system for transport to the mitochondrial matrix (Figure 3A) [20]. SLC25A20 catalyzes the esterification of hydrophobic carbon chains C2 (acetyl)-C16 (palmitoyl) to the hydroxyl group of carnitine [21]. For this reason, it is thought that blocking the SLC25A20 will effectively disrupt the transport of the various substrates required for the FAO reaction.
SLC25A20 knockdown reduces ATP production in PDAC cells. (A) Summary of fatty acid transportation into mitochondria for FAO. CPTI/II (carnitine palmitoyl transferase I/II), CAT (carnitine acetyltransferase), ETC-OxPhos (electron transfer complex-oxidative phosphorylation). (B) Immunoblot analysis was shown in Figure S4A. ATP levels in PDAC cell lines MIA PaCa-2 and SU.86.86 were then measured by Seahorse XFe96 analysis. All data were normalized by SRB analysis. (C) Immunoblot analysis was shown in Figure S4B. ATP levels in hTERT-HPNE cell line were measured with Seahorse XFe96. All data were normalized by measuring SRB assay. (D, E) The metabolomes of various acyl-carnitines (D) and fatty acids (E) in MIA PaCa-2 cells without (control) and with SLC25A20 knockdown (orange) were analyzed by MS/MS. The y-axis shows the results of the SLC25A20 knockdown, expressed as a relative ratio with the control set to 1.0. (F and G) The metabolomes of various acyl-carnitines (F) and fatty acids (G) in SU.86.86 cells without (control) and with SLC25A20 knockdown (blue) were analyzed by MS/MS. The y-axis shows the results of the SLC25A20 knockdown, expressed as a relative fold ratio, with the control set to 1.0. Data are expressed as the mean ± SD of three independent experiments. *p < 0.05, **p < 0.01, ***p < 0.001.
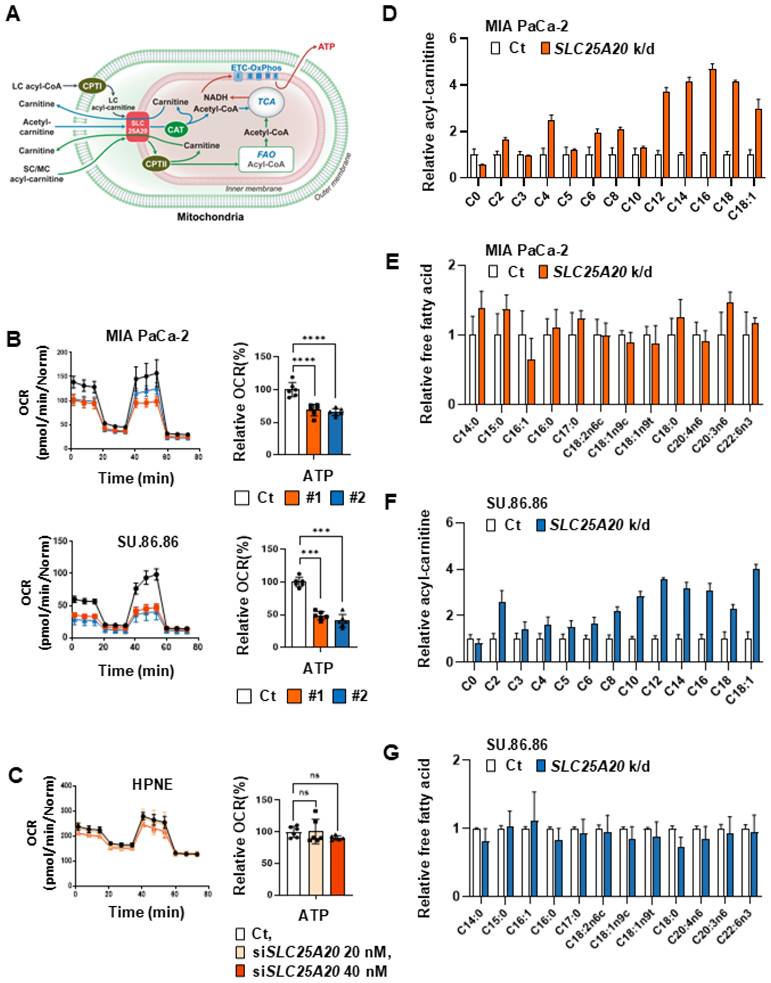
To determine whether inhibiting components involved in FAO reduce intracellular production of ATP, we knocked down SLC25A20 and then conducted OCR assays. The results revealed that shRNA-mediated knockdown of SLC25A20 in the pancreatic cancer cell line MIA PaCa-2 reduced basal respiration by 25-40% and ATP production by 34-43% (Figure 3B, Figure S4A & C). ShRNA-mediated knockdown of SLC25A20 in the pancreatic cancer cell lines SU.86.86 reduced ATP production by 16-60% (Figure 3B, Figure S4A & C); however, there was no change in ATP production in pancreatic normal ductal epithelial cells (hTERT-HPNE) after SLC25A20 knockdown (Figure 3C, Figure S4B & D). This implies that hTERT-HPNE did not utilize FAO to generate ATP (Figure 3C). SLC25A20 knockdown showed that the accumulation of acyl-carnitines in cancer cells (Figure 3D). However, when SLC25A20 was knocked down with siRNA in PDAC cells, ATP dropped by about 40% (Figure 3B and Figure S4E). We knocked down SLC25A20 in cancer cells and added glutamine to test whether the decreased ATP levels were restored (Figure S4F). Therefore, after SLC25A20 knockdown for 48 hours, we added 2.5 mM and 5 mM glutamine in the culture media and observed whether ATP levels were restored after 24 hours (Figure S4F). In the MIA PaCa-2 and Su.86.86 cell lines, SLC25A20 knockdown reduced ATP levels by 35% and 50%, respectively, and glutamine treatment with 2.5 and 5.0 mM did not affect ATP levels at all (Figure S4F). To test whether FAO knockdown induces this pathway, SLC25A20 was knocked down for 48 hours and lactate production was measured (Figure S4G). The experimental results showed that there was no change in lactate production in both MIA PaCa-3 and SU.86.86 cell lines. The same was true for other cancer cell types, including glioblastoma, breast cancer, lung cancer, colon cancer, and liver cancer, where SLC25A20 knockdown reduced ATP production by 26-70% at a 40 nM siRNA concentration (Figure S4H & I). SLC25A20 knockdown in MIA PaCa-2 cells increased the levels of long-chain acyl-carnitines such as C18:1-carnitine, C18-carnitine, C16-carnitine, and C-12-carnitine by 2-3 fold (Figure 3D). In addition, mid-chain acyl-carnitines such as C6-carnitine, and C8-carnitine also increased by more than twofold. This increase appears to reduce the amount of free carnitine C0 that is not recovered (Figure 3D). SLC25A20 knockdown in SU.86.86 cells increased the levels of long-chain acyl-carnitines such as C18-carnitine, C16-carnitine, C14-carnitine, and C-12-carnitine by 2-3 fold (Figure 3F). In addition, short-chain or mid-chain acyl-carnitines such as C2-carnitine, C8-carnitine, and C10-carnitine also increased by more than twofold. This increase appears to reduce the amount of free carnitine C0 in both cell lines that was not recovered from SLC25A20 shuttle (Figure 3F). By contrast, free fatty acid levels did not change in MIA PaCa-2 or SU.86.86 cells following SLC25A20 knockdown (Figure 3E & G). CPT1A knockdown in pancreatic cancer cell lines MIA PaCa-2 and SU.86.86 reduced ATP production by 40-50% (Figure S5A & B). To analyze the changes in intracellular acyl-carnitine and free fatty acid levels induced by SLC25A20 knockdown, we conducted LC-MS/MS analysis.
Mitochondrial inactivation through SLC25A20 knockdown slows PDAC growth significantly
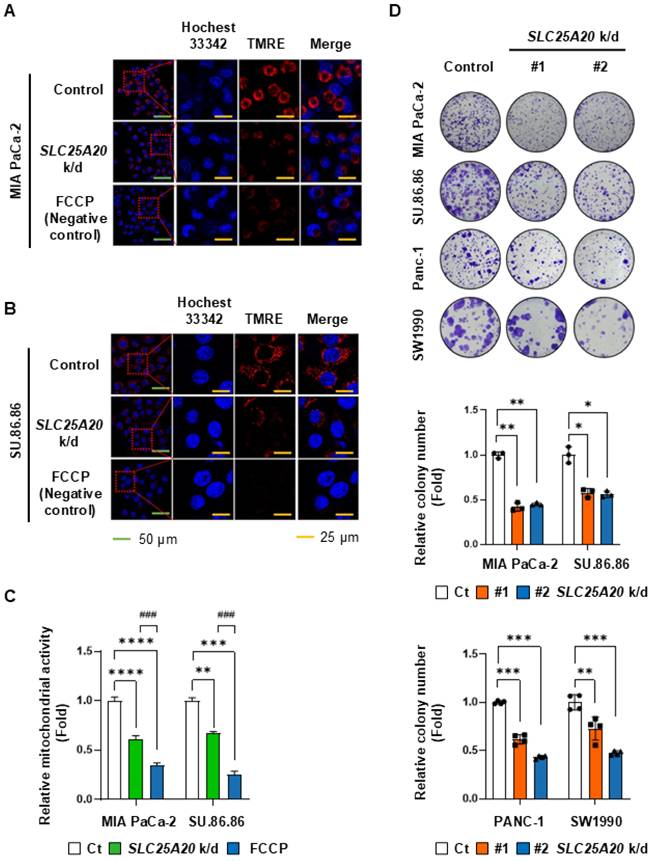
To evaluate whether SLC25A20 knockdown affects mitochondrial membrane potential in pancreatic cancer cell lines, we measured the potential using TMRE (tetramethyl rhodamine ethyl ester), a cell-permeant, cationic, red-orange fluorescent dye that readily accumulates in active mitochondria. TMRE staining showed that SLC25A20 knockdown reduced mitochondrial membrane potential in MIA PaCa-2 and SU.86.86 cells by 39% and 32%, respectively (Figure 4A-C). A colony-forming assay was performed to investigate the relationship between ATP reduction mediated by SLC25A20 knockdown and cell growth. Colony formation by MIA PaCa-2 cells subjected to shRNA-mediated knockdown of SLC25A20 was 55-59% lower than that of the control (Figure 4D). In SU.86.86, Panc-1, and SW1990 SLC25A20 knockdown lines, cell growth was 44%, 48%, and 40%, respectively, lower than that in the control (Figure 4D); however, there was no change in cell proliferation in hTERT-HPNE after SLC25A20 knockdown (Figure S6). This result is consistent with the results of a paper we recently published. We found that when pancreatic cancer cells were grown glucose free, lactate production was reduced by more than 80%, but ATP production did not change at all [14]. However, when cancer cell FAO was inhibited with trimetazidine, we showed that ATP production was absolutely reduced despite the availability of all nutrients [14, 15]. Therefore, the decrease in ATP with SLC25A20 knockdown is consistent with previous results.
SLC25A20 knockdown reduces mitochondrial activity and colony formation by PDAC cells. (A and B) The mitochondrial membrane potential of MIA PaCa-2 (A) and SU.86.86 (B) without (control) and with SLC25A20 knockdown was measured by fluorescence microscopy after TMRE staining (Red). Scale bars: green = 50 μm; yellow = 25 μm. (C) Mitochondrial membrane potential was assessed by measuring the intensity of TMRE fluorescence using ZEN software 3.9. The bars in the graph show TMRE intensity normalized by the number of DAPI positive per unit area. (D) Cancer cell growth was measured in a colony formation assay. MIA PaCa-2, SU.86.86, Panc-1 and SW1990 cells with SLC25A20 knockdown induced by two different shRNAs (#1 and #2) were seeded in a six-well plate and cultured for 14 days. Colonies were stained with crystal violet and counted using ImageJ software. The y-axis shows the number of SLC25A20 knockdown colonies expressed as a relative ratio, with the number of control colonies set to 1.0. Data are presented as the mean ± SD from at least three experiments. *p < 0.05, **p < 0.01, ***p < 0.001.
PDAC cells with SLC25A20 knockdown arrest in the G1/S phase of the cell cycle following the inactivation of mTOR, with a critical impairment of the DNA repair system
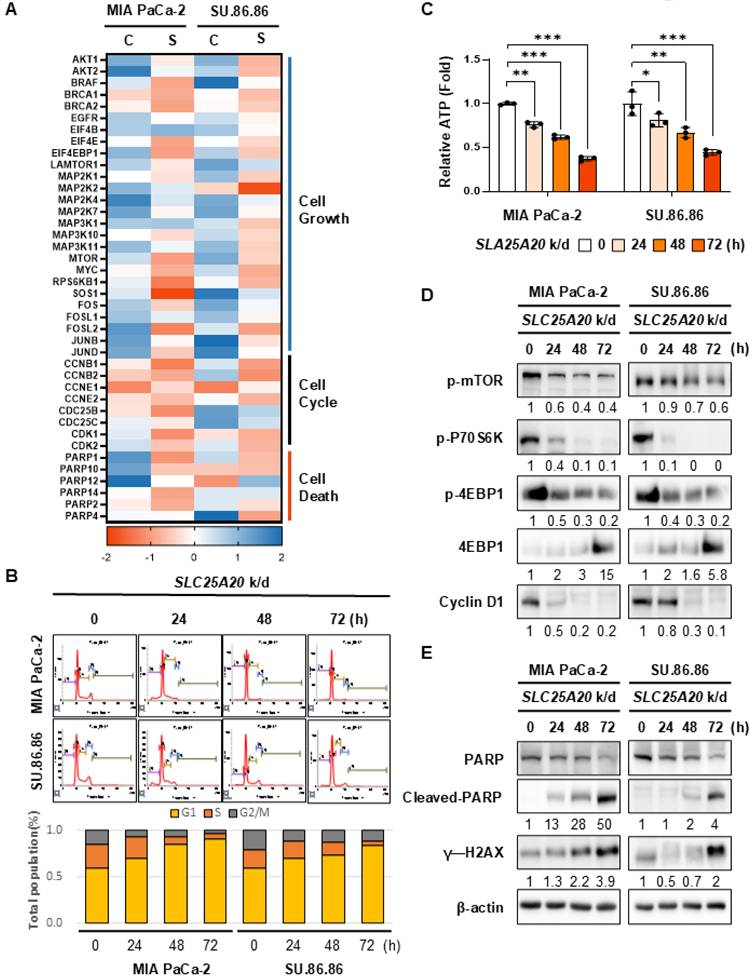
To elucidate how the reduction in intracellular ATP production following SLC25A20 knockdown regulates cancer cell growth, we performed proteomics analysis of SU.86.86 cells using LC-MS/MS at 48 h post-knockdown (Figure 5A, Figure S7A). Phospho-proteomics analysis revealed that siRNA-mediated knockdown of SLC25A20 in SU.86.86 and MIA PaCa-2 cells reduced phosphorylation of key targets involved in cell growth, including mTOR and MAPK, while phosphorylation of targets involved in cell death increased (Figure 5A). To investigate whether SLC25A20 knockdown regulates the cell cycle, we performed cell cycle analysis in MIA PaCa-2 and SU.86.86 cells using flow cytometry (Figure 5B). SLC25A20 knockdown using siRNA increased the G1 population from 60% to 85-90% in a time-dependent manner (from 24 to 72 h; Figure 5B), a finding that correlated inversely with ATP production following siRNA treatment (Figure 5C). ATP levels in SLC25A20 knockdown MIA PaCa-2 and SU.86.86 cells fell by about 60% (Figure 5C). These changes corresponded with a significant decrease in cyclin D1 levels (Figure 5D, Figure S7C), which was related to the downregulation of the cell cycle in the G1/S stage [22]. Blocking FAO by SLC25A20 knockdown reduced ATP production significantly, resulting in preferential inactivation of mTOR (Figure 5D, Figure S8A). Additionally, we analyzed the global proteomic changes in pancreatic cancer cell lines treated with SLC25A20 siRNA for 72 h. Reduced DNA repair enzymes, including excision repair cross-complementary group 1 (ERCC1), DNA mismatch repair protein Mlh1 (MLH1), DNA mismatch repair protein Msh2 (MSH2), and DNA repair protein XP-A (XPA), inactivate DNA mismatch repair, leading to single-strand breaks and increased cytotoxicity (Figure S7B). The expression of proteins in the DNA polymerase and isomerase families was also reduced. SLC25A20 knockdown triggered cell cycle arrest and DNA damage repair, which in turn activated γ-H2AX after 72 hours (Figure 5E, Figure S8B). Regulation of protein synthesis cascades by SLC25A20 knockdown was linked closely to the inactivation of mTOR. This implies that combining cytotoxic therapeutics with FAO inhibition may have a synergistic anti-cancer effect.
SLC25A20 knockdown induces cell cycle arrest and cell death by turning off mTOR signaling via a reduction in ATP levels. (A) MIA PaCa-2 and SU.86.86 were treated with 40 nM of SLC25A20 siRNA for 48 h. LC-MS/MS was used to analyze changes in intracellular phosphor-protein levels. (B) Flow cytometry was used to examine the cell cycle distribution of MIA PaCa-2 and SU.86.86 cells with SLC25A20 knockdown. Cells were synchronized to the same cycle by treatment with thymidine (2 mM) for 24 h, and then treated with siRNA at the indicated times. The cell cycle distribution was measured by staining cells with PI. (C) Changes in ATP production by MIA PaCa-2 and SU.86.86 cells were analyzed following SLC25A20 knockdown. Immunoblotting was performed at different times (0-72 h post-knockdown) to analyze changes in cell growth (D) and cell death induction (E) in MIA PaCa-2 and SU.86.86 cells. The cell cycle distribution was associated with changes in cyclin D1 levels (D). DNA damage was determined by measuring changes in PARP and cleaved PARP levels. Cell death was determined by measuring changes in g-H2AX levels (E). Data are presented as the mean ± SD of at least three experiments. *p < 0.05, **p < 0.01, ***p < 0.001.
Crossbreeding of KPC mice with Slc25a20 knock-out mice yields offspring with increased survival rates
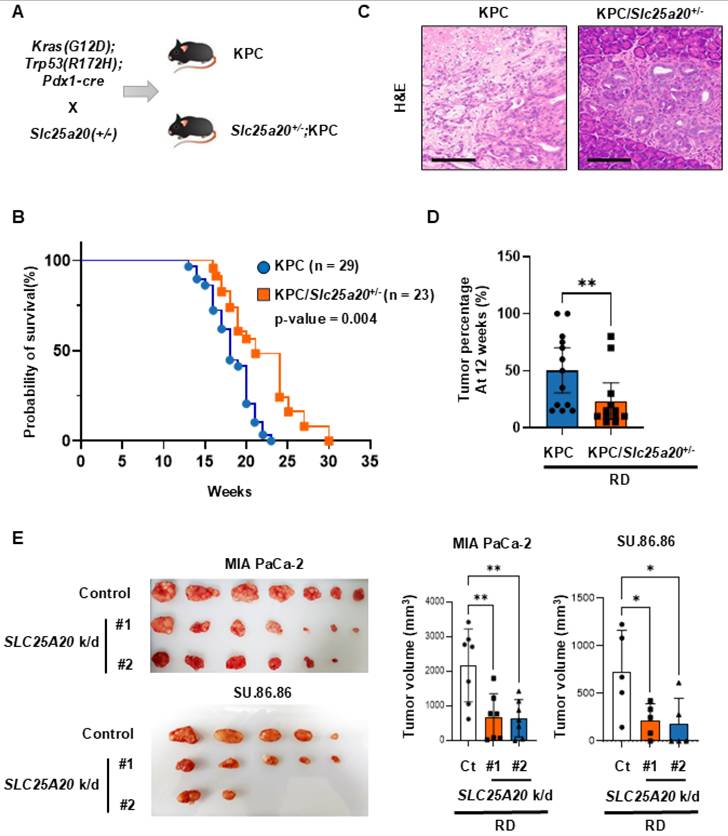
Slc25a20+/- mice were generated using CRISPR/Cas9 gene editing and zygote electroporation. Mutant mice harboring a 7 nt deletion in exon 2 of Slc25a20 causes premature termination of translation, resulting in a 59-amino acid mutant protein (Figure 6A, Figure S9A & B). To investigate the role of Slc25a20 in the development of pancreatic cancer, Slc25a20+/- mice were mated with a Kras-driven pancreatic cancer model (KrasG12D/+; Trp53R172H/+; Pdx1-Cre mouse, KPC mouse) [23]. When fed a RD, the median survival of the control (KPC mice) and experimental (KPC/Slc25a20+/- mice) groups was 18 weeks and 21.1 weeks, respectively. At 20 weeks of age, approximately 60% of KPC/Slc25a20+/- mice survived, compared with an average of 41% of KPC mice (Figure 6B). To determine if this change in survival was due to a block in fatty acid oxidation, we extracted pancreatic tissue from KPC and KPC/Slc25a20+/- mice and measured the levels of acetyl-CoA, the end product of fatty acid oxidation, and the ATP that is produced from acetyl-CoA. The results showed that acetyl-CoA levels were reduced by 32.5% and ATP levels were reduced by 51% in pancreatic tissue from KPC/Slc25a20+/- mice compared to KPC mice (Figure S10A-C). This is consistent with the results we demonstrated in the growth of cancer cells in vitro. These results indicate that blocking FAO through Slc25a20 knockdown increases survival significantly. Pancreatic tissues were extracted from 12-week-old KPC and KPC/Slc25a20+/- mice and subjected to H&E staining (Figure 6C, Figure S11A & B). The PanIN phenotype was predominant in KPC/Slc25a20+/-, whereas progression to PDAC was more common in KPC mice. In addition, the proportion of invasive neoplastic changes associated with PanIN and PDAC among the total pancreas parenchyma was significantly lower for KPC/Slc25a20+/- mice than for KPC mice (Figure 6C). In the KPC group, 7/13 mice formed large tumor masses, with destruction of parenchymal lobules in the pancreas, whereas only 2/12 mice in the KPC/Slc25a20+/- group formed large tumor masses (Figure 6D). Furthermore, immunostaining of pancreatic cancer tissues from each group revealed a 52% decrease in the expression of p-mTOR in tissues from KPC/ Slc25a20+/- mice compared to KPC mice (Figure S11C). Immunostaining could not detect the decreased expression of SLC25A20 in Slc25a20 knockout mice (Figure S11D). However, it clearly shows that SLC25A20 knockdown in KPC significantly reduces the activity of FAO, acetyl-CoA synthesis, and ATP synthesis as well as decreased level of SLC25A20 by immunoblotting (Figure S10). In addition, a more than 2-fold reduction in p-mTOR expression was shawn in the SLC25A20 knockdown tumor tissues (Figure S11C). Thus, the knockdown of SLC25A20 severely reduces the activity of mTOR due to a decrease in FAO-dependent ATP, and these changes are a major contributor to invasive tumor changes and reduced progression to PDAC. We also knocked down SLC25A20 in SU.86.86 and MIA PaCa-2 cancer cells using shRNA and then implanted the cells into mice fed an RD (Figure 6E). Two knockdown cell lines from each group were selected and inoculated into mice, and tumor size was measured over time. MIA PaCa-2 with SLC25A20 knockdown formed tumors that were 70%-80% smaller than those in the control group, and SU.86.86 cells with SLC25A20 knockdown formed tumors that were 70%-75% smaller (Figure 6E).
Crossing Slc25a20 knock-out mice with KPC mice generates offspring showing slower progression of pancreatic cancer. (A) Crossing of KPC and Slc25a20 knock-out mice generated KPC/Slc25a20+/- mice harboring four mutated genes: KrasG12D, Trp53R172H, Pdx1-cre, and Slc25a20+/-. (B) Kaplan-Meier survival curves for KPC/Slc25a20+/- mice (n = 23) and KPC mice (n = 29). The difference between the two groups was significant (p = 0.004). (C) In KPC/Slc25a20+/- mice group, most mice showed sporadic changes to noninvasive, dysplastic PanIN of pancreas parenchyma (right), whereas KPC mice have invasive PDACs (left). Images of representative samples corresponding to the median values in each group (original magnification: x200, scale bar: 200μm) (D) Decreased PanIN and PDAC progression by the haplo-sufficiency of Slc25a20 in the KPC mice model. (E) Mouse xenograft models were tested using MIA PaCa-2 (1 x 10⁷ cells/mouse, n=7) and SU.86.86 (5 x 10⁶ cells/mouse, n =5) cells without (control) and with SLC25A20 knockdown by two sets of shRNA #1 and #2. After 4-5 weeks of tumor growth, tumors were removed and measured in volume. The data was presented as the mean ± SD from at least three experiments. *p < 0.05, **p < 0.01, ***p < 0.001.
A preclinical mouse model reveals that SLC25A20 knockdown suppresses tumor growth promoted by an HFD
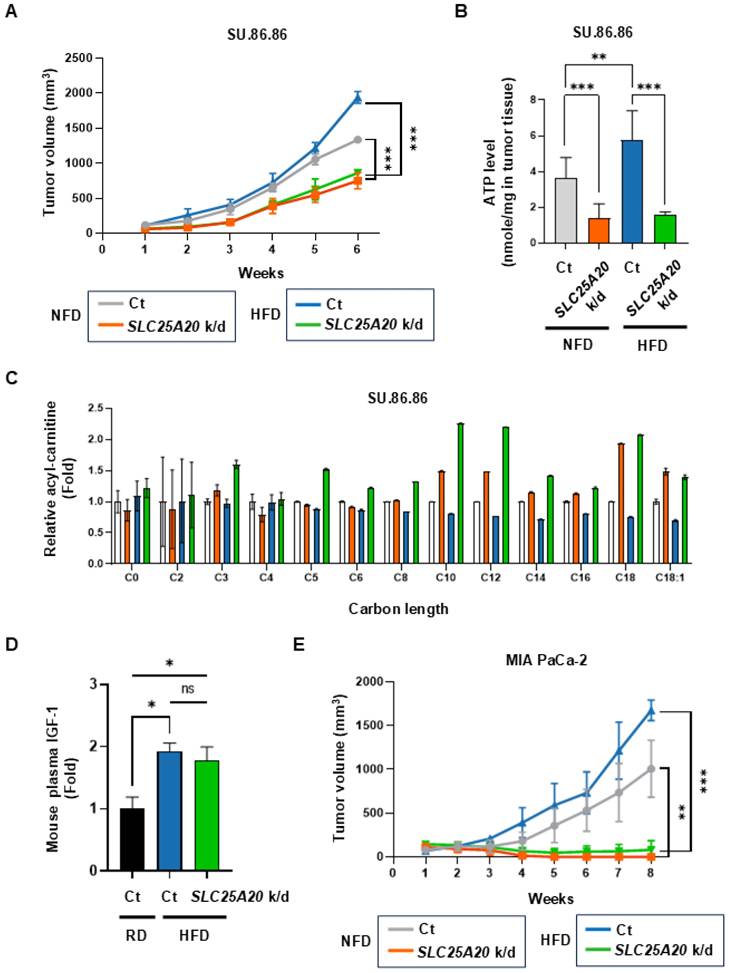
Based on the above results, it seems that the increased supply of ATP via FAO in tumor cells is directly responsible for driving the growth of cancer cells. Therefore, we knocked down SLC25A20 in cancer cells to inhibit FAO and tested whether tumor growth driven by an HFD is inhibited. SU.86.86 and MIA PaCa-2 cells were subjected to SLC25A20 knockdown using shRNA and then implanted into mice fed a caloric-balanced HFD (60% fat) or NFD (0% fat) (Figure 7A & E). Tumor size was measured over time. Tumors in the SLC25A20 knockdown fed were 45% smaller than those in the controls. Also, the tumors in the control HFD group were 30% larger than those in the control NFD group (Figure 7A). In the HFD group, SLC25A20 knockdown reduced tumor size by about 65% compared with the HFD control group (Figure 7A). Tumor growth in the NFD and HFD SLC25A20 knockdown groups was quite similar (Figure 7A), suggesting that HFD-induced tumor promotion is completely dependent on FAO. Next, we collected tumor and blood samples from mice implanted with SU.86.86 cells (Figure 7B-D). The tumors from mice yielded approximately ~100 μg of protein. Therefore, we had to choose one of the two experiments. One is extracting ATP from the tissue and quantifying it, while the other one is metabolite analysis. However, given the importance of the experiment, we decided that ATP measurement was essential and proceeded with that (Figure 7B). ATP levels in the HFD control group increased by 58% compared with the NFD control group, whereas those in the NFD SLC25A/20 knockdown group decreased by 63% compared with the NFD control group, and those in the HFD SLC25A/20 knockdown group decreased by 74% compared with the HFD control group (Figure 7B). Next, we examined acyl-carnitine levels by conducting an M/S analysis of the tumors. The SLC25A20 knockdown group fed an NFD showed an increase in acyl-carnitines C10-C18 levels, while the SLC25A20 knockdown group fed an HFD showed an increase of acyl-carnitines C3-C18 (Figure 7C). The levels of C10 and C12 increased by > 2-fold in the HFD SLC25A20 knockdown group compared with the HFD control (Figure 7C). This implies that cancer cells depend on medium chain (MC) fatty acids for FAO to generate ATP and that MC fatty acids translocate to the mitochondria via SLC25A20. HFD-mediated hyperinsulinemia increases IGF-1 levels [9]. In this context, we found that an HFD increased IGF-1 levels by 1.9-fold when compared with an RD (Figure 7D). The HFD SLC25A20 knockdown group also showed a >2-fold increase in IGF-1 levels when compared with the control group. This implies that HFD-driven tumor growth depends not only on IGF-1 signaling but on FAO pathways. We also examined the effect of SLC25A20 knockdown using MIA PaCa-2 cells transplanted into mice fed an HFD or NFD (Figure 7E). Tumors in the SLC25A20 knockdown group fed an NFD were 99% smaller than those in the control. In the control group they fed an HFD, tumors grew 60% larger than those in the control group which fed an NFD (Figure 7E). Finally, in the HFD group, SLC25A20 knockdown reduced tumor size by 95% compared with that in the HFD control group (Figure 7E). Tumor growth in the SLC25A20 knockdown groups fed an NFD or HFD was almost the same (Figure 7E).
SLC25A20 knockdown slows the growth of HFD-induced pancreatic cancer. (A) The effect of SLC25A20 knockdown in the SU.86.86 xenograft model (5 × 10⁶ cells/mouse; n=10) mice fed a caloric-balanced HFD (60% fat) or NFD (0% fat). Growth of SLC25A20 knockdown (orange) cells was compared with that of control (gray) cells under NFD conditions. Growth of SLC25A20 knockdown (green) cells was compared with the control (blue) under HFD conditions. (B) Intra-tumor ATP levels in SU.86.86 SLC25A20 knockdown tumor and control tissues. (C) Blood acyl-carnitine concentrations were analyzed in the control and SLC25A20 knockdown SU.86.86 groups. (D) The amount of IGF-1 in plasma was measured to investigate the pathways driving tumor growth. (E) The effect of SLC25A20 knockdown in the MIA PaCa-2 xenograft model (5 × 10⁶ cells/mouse; n=6) was also tested in mice fed a calorie-balanced HFD or NFD. Growth of SLC25A20 knockdown (orange) cells compared with the control (gray) under NFD conditions, and growth of SLC25A20 knockdown (green) cells compared with the control (blue) under HFD conditions. Statistical analysis was performed using unpaired two-tailed t-tests to compare differences between groups. Data are presented as the mean ± SD from at least three experiments. *p < 0.05, **p < 0.01, ***p < 0.001.
Discussion
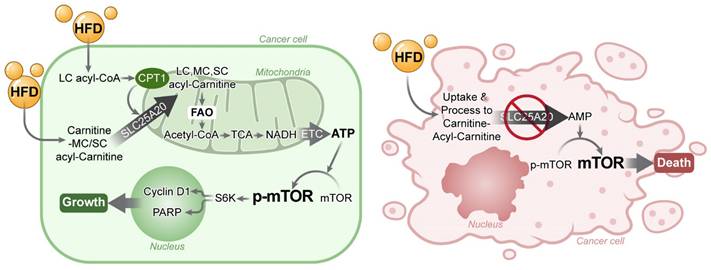
Cancer cells depend on FAO for ATP production; therefore, blocking FAO results in cell growth arrest. Here, we found that mTOR is a very sensitive switch that is turned on or off according to the level of ATP generated by FAO. HFD increases FAO, which in turn increases ATP and, consequently, mTOR activation, this drives cancer growth. Here, we show that knocking down SLC25A20 in PDAC cells prevents HFD-dependent tumor growth in a xenograft model (Figure 8).
Blocking FAO by SLC25A20 knockdown reversed HFD-induced tumor promotion. (A) Cancer cells absorb fatty acids from HFDs and convert them into LC, MC, and SC acyl-carnitine, which they use to produce acetyl-CoA via FAO in the mitochondria. The acetyl-CoA is converted to NADH in the TCA cycle, which is then used to produce ATP via the electron transport chain (ETC). Previously this FAO dependent ATP production in cancer was proposed as “Kim effect” to avoid confusion with the reprogramming theories [17]. Increased ATP levels activate p-mTOR, which in turn increases the expression of cyclin D1, essential for cell growth, and promotes the expression of PARP, which plays an important role in detecting and repairing DNA damage within cells. These survival programmes promote the growth of cancer cells. (B) FAO inhibition by SLC25A20 knockdown caused a decrease in ATP level, which induced mTOR inactivation, and consequently resulted in cell cycle arrest and cell death activation.
A previous report shows that the mTOR pathway is regulated by the intracellular level of ATP, a phenomenon that is independent of the abundance of amino acids; this suggests mTOR itself acts as an ATP sensor [24]. The Km value (Michaelis Constant) of mTOR for ATP is about 1.0 mM, tens to hundreds of times higher than that of other kinases [24-26]. This implies that it is activated at high ATP concentrations and inactivated when the intracellular level of ATP drops even slightly below 1.0 mM. Indeed, mTOR is regulated directly by the intracellular ATP concentration, although mTOR is also known to be regulated by amino acids [24]. The intra-tumor level of ATP measured in the xenograft model showed an approximate 50% decrease in ATP production by PDAC cancer cells in which SLC25A20 was knocked down. mTOR acts as the master regulator of cell metabolism by controlling responses to various metabolic signals.
We observed that knockdown of the FAO gene, or inhibition by high glucose cultures, reduced ATP production by cancer cells significantly, which is consistent with previous observations of increased CPT1A expression in cancers [27]. Furthermore, we found here that HFD-induced cancer cell outgrowth or tumor promotion was abrogated completely by the knockdown of the FAO gene in PDAC cells. Fatty acids are oxidized via FAO to yield TCA intermediates, which then generate intermediates of various amino acids; further oxidation generates ATP through an electron transfer chain using NADH and FADH [28]. This suggests that the TCA-ETC-OxPhos system (tricarboxylic acid cycle-electron transfer complex-oxidative phosphorylation) functions properly in cancer cells [28]. We reported previously that most cancer cells depend on FAO to generate ATP [16, 17]. Recent clinical trials focused on strategies that inhibit fatty acid transporters. One target of fatty acid transport is CPT1A, which transports fatty acids from the cytoplasm to the mitochondria. Although CPT1A is expressed in normal cells, cancer cells show unusually high expression [27, 29]. The reason why research on SLC25A20 and the development of inhibitors have been behind the priority is that FAO of cancer cells was considered to be the same as that of normal cells, leading to CPT1A being targeted as the primary target. To inhibit FAO in normal cells, targeting CPT1A in mitochondria is sufficient because normal cells primarily utilize long chain (LC) acyl-carnitine for FAO. Therefore, CPT1A inhibitors such as etomoxir [30], Perhexiline [31], Teglicar (ST1326) [32] have been extensively studied and are currently undergoing clinical trials, whereas SLC25A20 inhibitors have no known clinical outcomes. However, as demonstrated in this study, cancer cells utilize SC/MC acyl-carnitines extensively, suggesting that these acyl-carnitines bypass CPT1A and directly enter mitochondria via SLC25A20 [20]. Thus, in cancer cells, SLC25A20 has shown potential to inhibit FAO as an independent target of CPT1A, emerging as a promising strategy to inhibit FAO.
In addition to the mechanism by which HFD directly promotes ATP production in tumors, various studies are underway to understand the molecular mechanisms by which HFD promotes tumor growth. Epigenetic and transcriptomic changes associated with tumor growth promotion, including metabolic and immune-related pathways, were observed in the intestines of genetically tumor-prone mice induced by a 3-day HFD, but these changes were found not to affect major cancer signal transduction pathways [33, 34]. However, the dependence of ATP synthesis in cancer cells on FAO may not be due to complex genetic or non-genetic regulation, but rather due to a very simple reason. Cancer cells may have become highly dependent on FAO for ATP production because the Warburg effect blocked common source of energy, glucose, leaving them with no choice but to rely on FAO to compensate, much like a hibernating squirrel [35].
When FAO is inhibited in cancer cells, glucose continues to be converted into lactic acid, and if glutamine is used as an energy source instead of glucose and fatty acids, ATP synthesis should remain unchanged. However, when fatty acid oxidation is inhibited in cancer cells, ATP synthesis is severely reduced. Glutamine conversion into the TCA cycle intermediate α-ketoglutarate via glutamate,2 which is catalyzed by GLS1 and glutamate dehydrogenase, is also essential for Kras-induced anchorage-independent growth [36]. This suggests that the production of α-ketoglutarate (α-KG) catalyzed by GLS1 and glutamate dehydrogenase is further catabolized to citrate, which turns into acetyl-CoA for fatty acid synthesis in glioblastoma cells [37]. Based on previous reports, glucose and glutamine are considered to support cancer cell anabolism instead of energy metabolism [37, 38]. Using [13C]glucose labeling, studies of melanoma and glioblastoma showed 75~93% of glucose was catalyzed to lactate [37, 38]. A study using [13C]glucose labeling showed that small amount of pyruvate from glycolysis produced oxaloacetate by pyruvate carboxylase [36]. Glutamine is a known alternate carbon source for cancer cells. Therefore, metabolite flux study using [13C]glutamine and [13C]glucose showed that glucose was the primary carbon source for glycolytic intermediates as well as source for serine and glycine while glutamine did not contribute to glycolysis at all [38]. However, glutamine was the primary carbon source for TCA cycle intermediates through α-KG as well as source for proline and aspartic acid in melanoma and GBM [37, 38]. Citrate is exported from mitochondria to the cytosol where it is converted to acetyl-CoA which can be a source for fatty acid synthesis. Therefore, 13C-labeling study showed the majority of fatty acids showed 13C-labeling from glucose and glutamine [37, 38]. This suggests that glucose and glutamine are not burned in the mitochondria to produce energy and become CO2. They are used to provide building blocks rather than energy sources in cancer cells.
In summary, when FAO is blocked, ATP production is significantly inhibited in PDAC cells. Targeting FAO will be a novel therapeutic approach and promising particularly due to the metabolic dependence of PDAC cells, but for a rapid therapeutic response in pancreatic cancer, FAO inhibitors are expected to be most effective when used in combination with other anticancer drugs. Continued research is necessary to better understand how to exploit FAO inhibition for therapeutic gain. This is because most anti-cancer therapies target anabolic metabolic pathways, suggesting that a catabolic inhibitor targeting FAO would have a significant synergistic effect when used alongside standard anti-cancer drugs. Another expectation is that inhibitors targeting FAO will increase responsiveness to standard anti-cancer drugs, as resistance to anti-cancer treatment is associated with increased levels of FAO [39].
Materials and Methods
Cell culture
The hTERT-immortalized pancreas epithelial cell line hTERT-HPNE (CRL-4023) was purchased from ATCC (Manassas, VA, USA) and grown in 75% glucose-free DMEM (D-5030, Sigma-Aldrich, St. Louis, MO, USA) supplemented with 2 mM L-glutamine and 1.5 g/L sodium bicarbonate, plus 25% Medium M3 Base (Incell Corp. Texas, USA) containing 5% fetal bovine serum, 5.5 mM D-glucose (G8270, Sigma-Aldrich), and human recombinant EGF (E9644, Sigma-Aldrich). MIA PaCa-2, PANC-1, and SW1990 cells were grown in DMEM high glucose medium (SH30243.01, Cytiva, Logan, UT, USA) containing 10% fetal bovine serum and penicillin/streptomycin. SU.86.86 cells were grown in RPMI 1640 medium containing 10% fetal bovine serum and penicillin/streptomycin. All cells were maintained at 37°C and 5% CO2 humidity.
Animal studies
Balb/c-nu/nu mice (Orient, Seoul, Korea, aged 6-8 weeks) were used for the mouse xenograft study using human PDAC cells. This study was reviewed and approved by the Institutional Animal Care and Use Committee of the National Cancer Center Research Institute (protocols: NCC-21-661, NCC-24-1055). MIA PaCa-2 cells (1 × 10⁷) and SU.86.86 cells (5 × 10⁶) were mixed with Matrigel (BD Biosciences, Franklin Lakes, NJ, USA) at a 1:1 ratio and subcutaneously injected into mice. To analyse the anti-tumour effects targeting FAO, mice injected with pLKO.1-puro_scramble shRNA or pLKO.1-puro_SLC25A20 shRNA (shRNA#1 or #2) were divided into two groups and fed either NFD (D04112303, Research Diets, New Brunswick, NJ, USA) or a high-fat diet (HFD, D12492, Research Diets, New Brunswick, NJ, USA). The anti-cancer effects of suppressing the SLC25A20 gene in combination with the low-fat or high-fat dietary regimens were then evaluated. The size of the primary tumor was measured weekly using calipers. Tumor volume was calculated using the following formula: V = (A × B2)/2, where V is the volume (mm3), A is the long diameter, and B is the short diameter.
Slc25a20 knockout mice were generated using the CRISPR/Cas9 genome editing technology. The target sequences for the single guide RNA (sgRNA) were selected using the CRISPR design tool (crispor.tefor.net). A mixture of Cas9 protein (100 ng/mL) and sgRNA (50 ng/mL) was transferred to mouse embryos through zygote electroporation [40]. The target sequences for CRISPR/Cas9 gene editing were 5'-GGC TGT CCA GAC AAA CTT GG-3', 5'-AAG GTC CCA GAG TAC ATA GG-3'. Indel mutations in F1 mice were identified after TA cloning and sequencing. The Cas9 protein (EnGen Cas9 NLS) was purchased from NEB, and sgRNAs were generated using a T7 in vitro transcription kit (NEB).
The spontaneous pancreatic cancer animal model mouse KrasG12D; Trp53R172H; and Pdx1-Cre (KPC) was used to investigate the impact of Slc25a20 on the development and progression of pancreatic cancer. The KPC mouse model has been reported previously [41], but a brief explanation will be provided here. KrasG12D mice (B6.129-Krastm4Tyj/Nci) and Trp53R172H mice (124S4-Trp53tm2Tyj/Nci) were obtained from the NCI Mouse Repository. Pdx1-Cre mice (B6.FVB-Tg(Pdx1-Cre)6Tuv/J, #014647) were purchased from the Jackson Laboratory. KrasG12D; Pdx1-Cre (KC) mice were generated by crossing KrasG12D mice with Pdx1-Cre mice. KrasG12D; Trp53R172H; Pdx1-Cre (KPC) mice were obtained by crossing KC mice with Trp53R172H mice. Slc25a20 hetero knockout KPC mice were generated by crossing KC mice with Slc25a20 heterozygous mice to obtain KrasG12D; Pdx1-Cre; Slc25a20+/- mice. The Trp53R172H mice were then crossed with Slc25a20+/- mice to obtain Trp53R172H; Slc25a20+/- mice which were then crossed with KC; Slc25a20+/- mice to generate KPC; Slc25a20+/- mice. The study was reviewed and approved by the Institutional Animal Care and Use Committee (IACUC) of the National Cancer Center Research Institute (protocols: NCC-21-574B).
To evaluate the impact of fatty acid intake on the development and progression of pancreatic cancer, KPC mice were divided into two groups: a control group fed a regular diet (1314 IRR, Altromin GmbH, Lage, Germany) and a high-fat diet group (D12492, Research Diets, New Brunswick, NJ, USA). Survival rates were compared. The study was reviewed and approved by the Institutional Animal Care and Use Committee (IACUC) of the National Cancer Center Research Institute (protocols: NCC-24-1051), which is an Association for Assessment and Accreditation of Laboratory Animal Care International (AAALAC International) accredited facility that abides by the Institute of Laboratory Animal Resources guide.
Human subjects
A pancreatic cancer tissue microarray (TMA, PA2072a) was purchased from Tissue Array (Derwood, MD, US). Tissue microarray (TMA) is exempt from review by the National Cancer Center Institutional Review Board (IRB) under the following conditions: TMAs are used for research purposes, and samples are provided in an anonymous or unidentifiable form. The TMAs we analyzed were provided anonymously by a US supplier and are therefore exempt from IRB review. Analysis of data from patients with pancreatic cancer: The expression level of CPT1A in pancreatic adenocarcinoma (PAAD) and matched normal control samples was analyzed using the GEPIA webserver (http://gepia.cancer-pku.cn/). Tumor data were obtained from the TCGA (n = 179), and normal data were obtained from both the TCGA and GTEx (n = 171). The relationship between CPT1A expression levels and survival of PAAD patients was analyzed using the Kaplan-Meier Plotter (https://kmplot.com/analysis). This online tool integrates gene expression data and survival information from publicly available databases (GEO, EGA, and TCGA) to assess the prognostic value of gene expression on patient survival. Kaplan-Meier survival curves were generated to compare the overall survival (OS) and relapse-free survival (RFS) rates between the high and low-expression groups. The hazard ratio with 95% confidence intervals, and the log-rank p-value, were calculated to determine the statistical significance of the differences.
Immunohistochemical staining
Immunohistochemistry (IHC) was performed on formalin-fixed paraffin-embedded (FFPE) pancreas tissues from mice and TMA sections. The primary antibodies used in this experiment, their sources, and dilution ratios were as follows: CPT1A (Cat No. ab234111, 1:500), CK19 (Cat No. ab52625, 600:1) from Abcam (Cambridge, UK) and Phospho-mTOR (Ser2448) (D9C2) (Cat No. 5536S, 1:25) from Cell Signaling Technology (Danvers, MA, US).
Image acquisition and analysis
The stained human pancreatic cancer TMA and tissue sections from the mouse model were scanned in high-resolution mode using the Vectra Polaris multispectral imaging system (Akoya Biosciences, Marlborough, MA, US) and Motic Easy Scan digital slide scanner (Motic, Kowloon Bay, Hong Kong). Protein expression was analyzed based on the pathological evaluation of tissue morphology and staining patterns in pancreatic cancer tissues. The inForm Image Analysis Software (Akoya Biosciences, Marlborough, MA, US) was employed to assess the IHC results quantitatively. H-scores were calculated based on the percentage of positively stained cells and staining intensity. The significance of CPT1A expression across different groups was analyzed using one-way ANOVA in GraphPad Prism version 10.3.1.
In vitro colony formation assay
To evaluate the effects of increased fatty acid supply or inhibition of fatty acid oxidation on pancreatic cancer cell growth, a Colony Formation Assay was performed by the established protocol [42]. Each experiment was performed in triplicate, and the growth of pancreatic cancer cell lines under different experimental conditions was analyzed using one-way ANOVA in GraphPad Prism version 10.3.1.
Oxygen consumption rate analysis
To evaluate changes in cellular oxygen consumption rate and ATP production following increased intracellular fatty acid uptake and inhibition of fatty acid oxidation, an Oxygen Consumption Rate (OCR) analysis was performed by the established protocol [41]. Seahorse XFe96/XF Pro Cell Culture Microplates (Cat No. 103794-100), Seahorse XF Cell Mito Stress Test Kit (Cat No. 103015-100), and Seahorse XF Calibrant Solution (Cat No. 100840-100) were purchased from Agilent (Santa Clara, CA, US). To normalize cell number per well, the Sulforhodamine B (SRB) assay was employed [43, 44]. The experiments were conducted in triplicate, and statistical significance between the control and experimental groups was analyzed using one-way ANOVA with GraphPad Prism version 10.3.1.
Mitochondrial activity staining (TMRE)
Mitochondrial membrane potential was analyzed by measuring tetramethylrhodamine-ethyl ester (TMRE, 87917, Sigma-Aldrich, St Louis, US) staining. The assay method was followed as previously published [41]. Live cell imaging was performed using the LSM780 Laser Scanning Microscope and Axio Observer Z1 (Carl Zeiss, Oberkochen, Germany). The relative intensity of TMRE was normalized by the arithmetic mean intensity (from ZEN software 3.4). The experiments were conducted in triplicate, and statistical significance between the control and experimental groups was analyzed using one-way ANOVA in GraphPad Prism version 10.3.1.
Glutamine treatment effect on ATP level
Cells were transfected with scramble siRNA or SLC25A20 siRNA (final concentration 40 nM) in 60 mm dishes for 48 hours. The transfected cells were seeded into XFe 96 well microplates at a density of 20,000 cells per well, and measured OCR followed by dose-dependent treatment with L-Glutamine (Cat. No. G8540, Sigma-Aldrich, St. Louis, USA) for 24 hours.
Quantitation of metabolites of acyl-carnitine using liquid chromatography-tandem mass spectrometry (LC-MS/MS)
Metabolites were analyzed with LC-MS/MS equipped with a 1290 HPLC (Agilent, Santa Clara, CA, US), Qtrap 5500 (AB Sciex, Vaughan, CA, US), and an LC column as we have published before [16].
Cell cycle analysis
To evaluate the effect of SLC25A20 inhibition on the cell cycle, flow cytometry (FACS) analysis was performed. The assay method followed was as previously published [45]. The experiments were conducted in triplicate, and statistical significance between the control and experimental groups was analyzed using one-way ANOVA in GraphPad Prism version 10.3.1.
Establishment of pancreatic cancer cell lines with stable knockdown of SLC25A20 using lentivirus
Lentiviral transduction was employed to establish pancreatic cancer cell lines with stable knockdown of the SLC25A20 gene by the established protocol [16]. Lentiviral SLC25A20 shRNA plasmids (TRCN0000291448, TRCN0000307710) were purchased from Sigma-Aldrich (St. Louis, Missouri, US). To investigate intracellular signaling and metabolite profile changes induced by SLC25A20 knockdown using siRNA, SLC25A20 siRNA (Cat No. s535090) was purchased from Thermo Fisher Scientific (Waltham, MA, US). Various cancer cell lines, including pancreatic cancer (MIA PaCa-2, SU.86.86, SW1990, PANC-1), glioblastoma (T98G), breast cancer (MDA-MB-231), prostate cancer (PC-3), non-small cell lung cancer (A549), and colorectal cancer (HCT 116), were purchased from the ATCC (Manassas, VA, US). Cells were transfected with either negative control siRNA or SLC25A20 siRNA using Lipofectamine 3000 reagent (Cat No. L3000075; Thermo Fisher Scientific, Waltham, MA, US) according to the manufacturer's instructions.
Immunoblotting
To investigate changes in intracellular signaling pathways following the modulation of fatty acid oxidation targets, immunoblotting was performed by the established protocol [16]. The primary antibodies used in this experiment, their sources, and dilution ratios were as follows: SLC25A20 (Cat No. ab244436, 1:500), CK19 (Cat No. ab52625, 600:1) and CPT1A (Cat No. ab128568, 1:1000) from Abcam (Cambridge, UK); β-actin (Cat No. sc-47778, 1:1000) and Topo I (Cat No. sc-5342, 1:1000) from Santa Cruz Biotechnology (Dallas, TX, US); and various antibodies from Cell Signaling Technology (Danvers, MA, US), including mTOR (Cat No. 2972S, 1:1000), Phospho-mTOR (Ser2448) (Cat No. 2971S, 1:1000), Cyclin D1 (Cat No. 2978S, 1:1000), PARP (Cat No. 9572S, 1:1000), Cleaved PARP (Cat No. 9541S, 1:1000), eIF4E (Cat No. 9742S, 1:1000), p70S6 Kinase (Cat No. 9202S, 1:1000), Phospho-p70 S6 Kinase (Thr389) (Cat No. 9234S, 1:1000), 4E-BP1 (Cat No. 9452S, 1:1000), Phospho-4E-BP1 (Thr37/46) (Cat No. 9459S, 1:1000) and gamma-H2AX (Cat No. A300-081A, 1:1000) from FORTIS Life Sciences (Waltham, MA, US).
Measurement of ATP levels
ATP levels in tumor tissue were measured using an ATP Colorimetric/Fluorometric Assay Kit (ab83355, Abcam, Cambridge, UK). The assay method was followed as previously published [18].
IGF-1 assay
Mouse IGF-1 levels were measured using a Mouse IGF-1 ELISA assay kit (ab100695; Abcam, Cambridge, UK) by the manufacturer's procedures. Blood samples were collected from xenograft mice via intracardiac bleeding. The blood was centrifuged at 2000 rpm for 20 minutes at 4°C to isolate the serum, collected, and stored at -80°C until further use. Serum samples were diluted 1:100 before use in the assay. A paired t-test was conducted for statistical analysis.
Acetyl-CoA assay & lactate assay
The levels of acetyl-CoA were measured using the acetyl-CoA assay kit (Abcam, Cat. No. ab87546) and lactate levels were measured using the L-Lactate assay kit (ab65330, Abcam) according to the manufacturer's instructions.
Statistical analysis
All statistical analyses were performed using the GraphPad Prism 10 software (GraphPad Software Inc., San Diego, CA, USA). Survival rates were calculated using the Kaplan-Meier method and compared using the log-rank test. Differences were analyzed by one-way analysis of variance (ANOVA). P values *< 0.05, **< 0.01, ***< 0.001, and ****< 0.0001 were considered significant.
Abbreviations
PDAC, pancreatic ductal adenocarcinoma; NADH, nicotinamide adenine dinucleotide; ATP, adenosine triphosphate; TCA cycle, tricarboxylic acid cycle (also known as the Krebs cycle); FAO, fatty acid oxidation; KPC mouse, KrasG12D/+; Trp53R172H/+; Pdx1-Cre mouse; SLC25A20, carnitine-acylcarnitine carrier (CAC) or carnitine-acylcarnitine translocase (CACT).
Supplementary Material
Supplementary figures.
Acknowledgements
The authors thank Tae Sik Kim of the Flow Cytometry Core (National Cancer Center) for expert assistance and helpful suggestions.
Funding
This research was mainly supported by the Basic Science Research Program through the National Research Foundation of Korea (NRF), funded by the Ministry of Science and ICT to SK (NRF-2017R1A2B2003428), and substantially supported by grants from the National Cancer Center of Korea to WC (NCC 2410891-1), JWC (NCC 2410892-1), and SHS (NCC 24H1210-1).
Author Contributions
Validation, WHo, MK, WHa, CK, JHP, JHK, and HL; methodology and formal analysis, NH, WHo, MK, WHa, CK, JHP, JHK, and SK; investigation and methodology, HL, KK, WC, SHS, JWC, SMW, and WJL; pathology, NH, DH, and JIY; data curation, HL, JHK, MK, WHo, and SK; writing—original draft preparation, SK; writing—review and editing, SMW, WC, SHS, JWC, HL and WJL; visualization, WHo, JHK, MK, WHa, CK, JHP and SK; supervision, WC, SHS, JWC and SMW; project administration, SK.; funding acquisition, WC, SHS, JWC, and SK. All authors have read and agreed to the published version of the manuscript.
Competing Interests
The authors, except SK, declare no conflicts of interest. SK has filed a patent to develop an anti-cancer drug targeting SLC25A20 and founded an in-house venture company at the National Cancer Center in the Republic of Korea.
References
1. Friedenreich CM, Ryder-Burbidge C, McNeil J. Physical activity, obesity and sedentary behavior in cancer etiology: epidemiologic evidence and biologic mechanisms. Mol Oncol. 2021;15:790-800
2. An C, Pipia I, Ruiz AS, Arguelles I, An M, Wase S. et al. The molecular link between obesity and genomic instability in cancer development. Cancer Lett. 2023;555:216035
3. Rawla P, Thandra KC, Sunkara T. Pancreatic cancer and obesity: epidemiology, mechanism, and preventive strategies. Clin J Gastroenterol. 2019;12:285-91
4. Molina-Montes E, Coscia C, Gomez-Rubio P, Fernandez A, Boenink R, Rava M. et al. Deciphering the complex interplay between pancreatic cancer, diabetes mellitus subtypes and obesity/BMI through causal inference and mediation analyses. Gut. 2021;70:319-29
5. Lindstrom P. The physiology of obese-hyperglycemic mice [ob/ob mice]. ScientificWorldJournal. 2007;7:666-85
6. Li J, Wu H, Liu Y, Yang L. High fat diet induced obesity model using four strainsof mice: Kunming, C57BL/6, BALB/c and ICR. Exp Anim. 2020;69:326-35
7. O'Neill AM, Burrington CM, Gillaspie EA, Lynch DT, Horsman MJ, Greene MW. High-fat Western diet-induced obesity contributes to increased tumor growth in mouse models of human colon cancer. Nutr Res. 2016;36:1325-34
8. van Driel MS, van Neerven SM, Vermeulen L. High-Fat Diet Impacts on Tumor Development in the Gut. Trends Cancer. 2021;7:664-5
9. Tao W, Lagergren J. Clinical management of obese patients with cancer. Nat Rev Clin Oncol. 2013;10:519-33
10. Park J, Morley TS, Kim M, Clegg DJ, Scherer PE. Obesity and cancer-mechanisms underlying tumour progression and recurrence. Nat Rev Endocrinol. 2014;10:455-65
11. Aleman JO, Eusebi LH, Ricciardiello L, Patidar K, Sanyal AJ, Holt PR. Mechanisms of obesity-induced gastrointestinal neoplasia. Gastroenterology. 2014;146:357-73
12. Gallagher EJ, LeRoith D. Obesity and Diabetes: The Increased Risk of Cancer and Cancer-Related Mortality. Physiol Rev. 2015;95:727-48
13. Iyengar NM, Gucalp A, Dannenberg AJ, Hudis CA. Obesity and Cancer Mechanisms: Tumor Microenvironment and Inflammation. J Clin Oncol. 2016;34:4270-6
14. Harrison SA, Diehl AM. Fat and the liver-a molecular overview. Semin Gastrointest Dis. 2002;13:3-16
15. Hariri N, Thibault L. High-fat diet-induced obesity in animal models. Nutr Res Rev. 2010;23:270-99
16. Lee JS, Oh SJ, Choi HJ, Kang JH, Lee SH, Ha JS. et al. ATP Production Relies on Fatty Acid Oxidation Rather than Glycolysis in Pancreatic Ductal Adenocarcinoma. Cancers (Basel). 2020 12
17. Lee H, Woo SM, Jang H, Kang M, Kim SY. Cancer depends on fatty acids for ATP production: A possible link between cancer and obesity. Semin Cancer Biol. 2022;86:347-57
18. Kang M, Kang JH, Sim IA, Seong DY, Han S, Jang H. et al. Glucose Deprivation Induces Cancer Cell Death through Failure of ROS Regulation. Int J Mol Sci. 2023 24
19. Viscardi RM, Ullsperger S, McKenna MC. Carbon stripping extracts serum free fatty acids: implications for media supplementation of cultured type II pneumocytes. Lab Invest. 1991;65:250-7
20. Schrader M, Costello J, Godinho LF, Islinger M. Peroxisome-mitochondria interplay and disease. J Inherit Metab Dis. 2015;38:681-702
21. Tonazzi A, Giangregorio N, Console L, Palmieri F, Indiveri C. The Mitochondrial Carnitine Acyl-carnitine Carrier (SLC25A20): Molecular Mechanisms of Transport, Role in Redox Sensing and Interaction with Drugs. Biomolecules. 2021 11
22. Tchakarska G, Sola B. The double dealing of cyclin D1. Cell Cycle. 2020;19:163-78
23. Niknafs N, Zhong Y, Moral JA, Zhang L, Shao MX, Lo A. et al. Characterization of genetic subclonal evolution in pancreatic cancer mouse models. Nat Commun. 2019;10:5435
24. Dennis PB, Jaeschke A, Saitoh M, Fowler B, Kozma SC, Thomas G. Mammalian TOR: a homeostatic ATP sensor. Science. 2001;294:1102-5
25. Knight ZA, Shokat KM. Features of selective kinase inhibitors. Chem Biol. 2005;12:621-37
26. Edelman AM, Blumenthal DK, Krebs EG. Protein serine/threonine kinases. Annu Rev Biochem. 1987;56:567-613
27. Tan Z, Zou Y, Zhu M, Luo Z, Wu T, Zheng C. et al. Carnitine palmitoyl transferase 1A is a novel diagnostic and predictive biomarker for breast cancer. BMC Cancer. 2021;21:409
28. Carracedo A, Cantley LC, Pandolfi PP. Cancer metabolism: fatty acid oxidation in the limelight. Nat Rev Cancer. 2013;13:227-32
29. Xiong X, Wen YA, Fairchild R, Zaytseva YY, Weiss HL, Evers BM. et al. Upregulation of CPT1A is essential for the tumor-promoting effect of adipocytes in colon cancer. Cell Death Dis. 2020;11:736
30. O'Connor RS, Guo L, Ghassemi S, Snyder NW, Worth AJ, Weng L. et al. The CPT1a inhibitor, etomoxir induces severe oxidative stress at commonly used concentrations. Sci Rep. 2018;8:6289
31. Liu PP, Liu J, Jiang WQ, Carew JS, Ogasawara MA, Pelicano H. et al. Elimination of chronic lymphocytic leukemia cells in stromal microenvironment by targeting CPT with an antiangina drug perhexiline. Oncogene. 2016;35:5663-73
32. Cacciola NA, Sepe F, Fioriniello S, Petillo O, Margarucci S, Scivicco M. et al. The Carnitine Palmitoyltransferase 1A Inhibitor Teglicar Shows Promising Antitumour Activity against Canine Mammary Cancer Cells by Inducing Apoptosis. Pharmaceuticals (Basel). 2023 16
33. Qu DC, Neu D, Khawaja ZQ, Wang R, Bartels CF, Lovrenert K. et al. Epigenetic effects of high-fat diet on intestinal tumorigenesis in C57BL/6J-Apc (Min/+) mice. J Transl Genet Genom. 2023;7:3-16
34. Hayashi T, Fujita K, Nojima S, Hayashi Y, Nakano K, Ishizuya Y. et al. High-Fat Diet-Induced Inflammation Accelerates Prostate Cancer Growth via IL6 Signaling. Clin Cancer Res. 2018;24:4309-18
35. Olsen L, Thum E, Rohner N. Lipid metabolism in adaptation to extreme nutritional challenges. Dev Cell. 2021;56:1417-29
36. Weinberg F, Hamanaka R, Wheaton WW, Weinberg S, Joseph J, Lopez M. et al. Mitochondrial metabolism and ROS generation are essential for Kras-mediated tumorigenicity. Proc Natl Acad Sci U S A. 2010;107:8788-93
37. DeBerardinis RJ, Mancuso A, Daikhin E, Nissim I, Yudkoff M, Wehrli S. et al. Beyond aerobic glycolysis: transformed cells can engage in glutamine metabolism that exceeds the requirement for protein and nucleotide synthesis. Proc Natl Acad Sci U S A. 2007;104:19345-50
38. Scott DA, Richardson AD, Filipp FV, Knutzen CA, Chiang GG, Ronai ZA. et al. Comparative metabolic flux profiling of melanoma cell lines: beyond the Warburg effect. J Biol Chem. 2011;286:42626-34
39. Yang R, Yi M, Xiang B. Novel Insights on Lipid Metabolism Alterations in Drug Resistance in Cancer. Front Cell Dev Biol. 2022;10:875318
40. Qin W, Dion SL, Kutny PM, Zhang Y, Cheng AW, Jillette NL. et al. Efficient CRISPR/Cas9-Mediated Genome Editing in Mice by Zygote Electroporation of Nuclease. Genetics. 2015;200:423-30
41. Lee JS, Lee H, Woo SM, Jang H, Jeon Y, Kim HY. et al. Overall survival of pancreatic ductal adenocarcinoma is doubled by Aldh7a1 deletion in the KPC mouse. Theranostics. 2021;11:3472-88
42. Franken NA, Rodermond HM, Stap J, Haveman J, van Bree C. Clonogenic assay of cells in vitro. Nat Protoc. 2006;1:2315-9
43. Skehan P, Storeng R, Scudiero D, Monks A, McMahon J, Vistica D. et al. New colorimetric cytotoxicity assay for anticancer-drug screening. J Natl Cancer Inst. 1990;82:1107-12
44. Lee JS, Kang JH, Lee SH, Hong D, Son J, Hong KM. et al. Dual targeting of glutaminase 1 and thymidylate synthase elicits death synergistically in NSCLC. Cell Death Dis. 2016;7:e2511
45. Kang JH, Lee SH, Hong D, Lee JS, Ahn HS, Ahn JH. et al. Aldehyde dehydrogenase is used by cancer cells for energy metabolism. Exp Mol Med. 2016;48:e272
Author contact
![]() Corresponding author: Dr. Soo-Youl Kim, Division of Cancer Biology, Research Institute, National Cancer Center, Goyang 10408, Republic of Korea; Phone: 82-31-920-2221, E-mail: tgasere.kr; kimsooyoulcom.
Corresponding author: Dr. Soo-Youl Kim, Division of Cancer Biology, Research Institute, National Cancer Center, Goyang 10408, Republic of Korea; Phone: 82-31-920-2221, E-mail: tgasere.kr; kimsooyoulcom.