Impact Factor
- Issue 14; 2026
- Issue 13; 2026
- Issue 12; 2026
- Issue 11; 2026
- Issue 10; 2026
- Volume 16; 2026
- Advance Articles
- Past Issues
- Cover Images
- Cover Suggestion
- Index & Coverage
- Special Issues
Introduction
Results
Discussion
Materials and Methods
Abbreviations
Supplementary Material
Acknowledgements
References
International Journal of Biological Sciences
International Journal of Medical Sciences
 Global reach, higher impact

Theranostics 2026; 16(4):1681-1700. doi:10.7150/thno.117745 This issue Cite
Research Paper
Mitochondria-specific targeting of noncanonical EGR1 ntmRNA-coordinated mitophagy receptor BNIP3 homodimerization disrupts mitochondrial metabolism and suppresses hepatocellular carcinoma growth in vitro and in vivo
Yan Li1, Lei Zhou1, Mengmeng Liu1, Hui Li1, Ying Meng1, Xue Wen1, Yijing Zhao1,2, Shanshan Liu1, Zi Yan1,2, Changhao Fu1,2, Shan Zong1, Wei Li1, Andrew R. Hoffman2, Jiuwei Cui1 ![]() , Ji-Fan Hu1,2
, Ji-Fan Hu1,2 ![]()
1. Cancer Center, First Hospital of Jilin University, Changchun, Jilin 130061, China.
2. Stanford University Medical School, Stanford, CA 94305, USA.
Received 2025-5-17; Accepted 2025-10-16; Published 2026-1-1
Abstract

Background: Hypoxia-driven metabolic reprogramming is a hallmark of hepatocellular carcinoma (HCC) and depends critically on mitochondrial signaling. We sought to identify RNA-based molecular factors that orchestrate the hypoxia-mitochondria crosstalk and regulate metabolic adaptation in HCC cells.
Methods: An integrated mtRNA-seq and mitochondria-specific LwaCas13a-BN-MLS RNA targeting approach was employed to profile RNA molecules aberrantly enriched in HCC mitochondria. Mitophagy was assessed via mt-Keima assay, immunofluorescence, transmission electron microscopy, and Western blotting of key autophagic markers. RNA-protein interactions were examined using RNA immunoprecipitation (RIP), electrophoretic mobility shift assays (EMSA), and computational structural modeling. In vitro and in vivo tumorigenicity was evaluated using colony formation, transwell invasion, wound healing, and subcutaneous xenograft models in nude mice.
Results: Nuclear-encoded EGR1 mRNA was aberrantly translocated to mitochondria, where it functions as a non-translating mRNA (ntmRNA) essential for mitophagy. Mitochondria-specific EGR1 targeting disrupted mitochondrial homeostasis by accumulating damaged mitochondria, lowering ATP, increasing ROS, reducing membrane potential, diminishing spare respiratory capacity, and impairing hypoxia-induced mitophagy. Mechanistically, EGR1 ntmRNA promoted mitophagy through the HIF-1α/BNIP3/NIX axis by recruiting BNIP3 to mitochondria and coordinating its homodimerization via a 3′-UTR MRE. A synthetic MRE oligonucleotide rescued BNIP3 dimerization after EGR1 depletion. Finally, we demonstrated that EGR1 loss suppressed malignant phenotypes in vitro and reduced xenograft tumor growth in vivo.
Conclusions: This study reveals a noncanonical role for EGR1 mRNA as an epigenetic regulator of mitophagy in HCC, thus expanding the functional repertoire of mRNA molecules beyond protein coding. Targeting this noncanonical EGR1 ntmRNA-BNIP3 homodimerization mechanism may suggest new therapeutic strategies for treating HCC.
Keywords: mitophagy, EGR1 ntmRNA, BNIP3 dimerization, mitochondria, hypoxia, hepatocellular carcinoma
Introduction
The hypoxic tumor microenvironment plays a critical role in determining malignant aggressiveness, therapeutic resistance to conventional chemotherapeutic drugs, and poor survival in a variety of human malignancies [1-3], including hepatocellular carcinoma [4]. To survive hypoxic stress, cancer cells initiate a comprehensive epigenetic re-writing of many transcriptional and translational programs, enabling cell survival, tumor metastasis and resistance to anti-cancer therapeutics [5]. Hypoxic niches drive genetic instability and create a heterogeneous population of malignant cells, including cancer stem cells [6, 7], exhibiting pro-survival and pro-invasive aggressive characteristics mediated by a HIF-1-coordinated extracellular and intracellular regulatory crosstalk network [8-11].
Extracellularly, hypoxia within the tumor microenvironment modifies the activity of infiltrating cells towards immunosuppressive phenotypes through the interplay of tumor-associated macrophages (TAMs), cancer-associated fibroblasts (CAFs), and infiltrated dendritic cells and T-cells. This modification empowers cancer cells to survive and evade immune attack [12-14]. The accumulation of acidic metabolites, such as the high levels of lactate from enhanced glycolytic flux, diminishes immune cell activity by altering the antigen-presenting capacity, T-cell activation, migration, and cytokine release. Hypoxia also favors the activation of an M2-like phenotype in tumor infiltrating macrophages, promoting an anti-inflammatory response and promoting tumor growth. From this point of view, targeting tumor infiltrating CAFs and TAMs has emerged as a potential therapeutic strategy to unleash the host immune system against the tumor [15, 16]. This emerging concept has currently been tested in clinical trials using small molecules and antibody therapeutics [17, 18].
Intracellularly, hypoxic stress induces metabolic reprogramming through the HIF-1 coordinated gene network [19-21], leading to a shunting of glucose and fatty acid metabolites away from the mitochondria and an increasing glucose and amino acid uptake, glycolytic flux, and lactate production [22-25]. As a result of this metabolic switch, cells exhibit malignant phenotypes involving glutamine metabolism, the tricarboxylic acid cycle, oxidative phosphorylation, as well as fatty acid synthesis and oxidation. In parallel, cells generate high levels of mitochondrial reactive oxygen species. As a critical cell stress sensor, mitochondria play a vital role in this metabolic reprogramming [26-28].
However, the molecular factors that signal hypoxic stress to the mitochondria of HCC cells remain unknown [29]. We utilized mitochondria-specific LwaCas13a-BN-MLS RNA targeting in combination with mitochondrial RNA-seq (mtRNA-seq) to identify key RNA components in the mitochondria of HCC cells that orchestrate the hypoxia-related metabolic switch. Using this approach, we found that in addition to long noncoding RNAs, such as MALAT1 [30, 31], the early growth response protein 1 (EGR1) was listed as a top aberrantly enriched mRNA within the mitochondria of HCC cells. These mitochondria-enriched mRNAs did not translate into EGR1 protein, and thus were named EGR1 non-translating mRNA (ntmRNA). EGR1 is encoded by the nuclear genome, and it plays an important role in mediating the response to hypoxic and ischemic stress. In this communication, we examine the role of EGR1 ntmRNA molecules in mitochondria, focusing on the regulation of mitochondrial metabolic reprogramming. Our data provide the first evidence that, in addition to the canonical coding function of EGR1 peptides to initiate the immediate early response to stress [32-34], the nuclear-encoded EGR1 ntmRNAs aberrantly translocate to HCC mitochondria, where they function as a new class of epigenetic ntmRNA messengers and regulate mitophagy in HCC cells by coordinating the homodimerization of mitophagy receptor BNIP3, a critical event for mitophagy initiation. These studies suggest that mRNAs can act like noncoding RNAs in regulating cell metabolism. Targeting EGR1 ntmRNA-BNIP3 homodimerization may provide new therapeutic strategies for treating HCC.
Results
Mitochondrial Cas13a-mBN-MLS RNA targeting and mtRNA-seq reveal the enriched EGR1 ntmRNA in the mitochondria of hepatoma cells
A mitochondria-specific RNA targeting and sequencing approach identified RNA components critical for hypoxia-related metabolic shifts in HCC mitochondria (Figure 1A). Mitochondrial RNA-seq (mtRNA-seq) first revealed enriched mitochondrial RNAs. Functional roles of these RNAs were explored using a novel mitochondria-targeted Cas13a-mBN-MLS system [35, 36], comprising RNA-targeting Cas13a fused to a mutant RNase Barnase (mBN) and mitochondria localization signal (MLS) from COX8A [37-39] (Figure S1A-B).
The nuclear-encoded EGR1 mRNA is enriched in mitochondria of hepatoma cells. A Identification of the mitochondria-enriched EGR1 ntmRNA using Cas13a-mBN-MLS mitochondria-specific targeting and mitochondrial RNA-seq. Cas13a: LwaCas-13a RNA-excision enzyme; gRNA: Cas13a guiding RNA; mBN: the mutant Barnase carrying D54A and H102A mutations. MLS: mitochondria-localization signal peptide derived from COX8A. The mitochondria-targeting system combines the advantages of RNA targeting specificity of Cas13a-gRNA, the RNase activity of mBN, and the mitochondria localization of MLS. The attachment of MLS facilitates the specific localization of the Cas13a-mBN in the mitochondria. The potent RNase activity of mBN efficiently degrades the RNA target in the mitochondria. This strategy identifies the mitochondria-enriched EGR1 ntmRNA that functions as non-translating epigenetic messengers essential for mitophagy in HCC cells. B Differential mitochondria-enrichment of EGR1 ntmRNA in hepatoma cells. HepG2 and SMMC7721: hepatoma cells; THLE-2, THLE-3 and HHL-5: normal hepatic cells; 293T: normal human embryonic kidney cells. The Ct values were normalized over that of COX2 and then standardized by setting 293T as 1 for comparison. C RNA-FISH of EGR1 in HepG2 cells. Cell nuclei were stained with DAPI (blue). EGR1 mRNA was probed with Dig-labeled single-stranded DNA probes and was detected with FITC-coupled anti-dig antibody (green). Mitochondria were labeled with MitoTracker (red). The overlapping portion of EGR1 mRNA and MitoTracker dye appears in yellow (enlarged windows, white arrows). The nuclear U6 was used as a negative control and the mitochondrial COX2 was used as a positive control. Scale bar: 10μm. D Co-localization of EGR1 mRNA and Mito-Tracker in isolated mitochondria smear. Mitochondria were isolated from HepG2 cells and were smeared on slides. RNA-FISH was performed to detect EGR1 mRNA (green). Mitochondria were tracked by MitoTracker staining (red). The co-localization portion of EGR1 mRNA and mitochondria is displayed in yellow (white arrows). Scale bar: 50umμm. E Scatter plot of EGR1 and Mito-Tracker. Pearson's correlation coefficient (PCC) was calculated for the entire image (Rtotal) and the pixels above thresholds (Rcoloc). 1: perfect correlation; -1: completely excluded; 0: random relationship. Data represents the mean ± SEM of three independent experiments. Significant differences were determined by an unpaired two-tailed t-test. * p < 0.05, **** p < 0.0001.
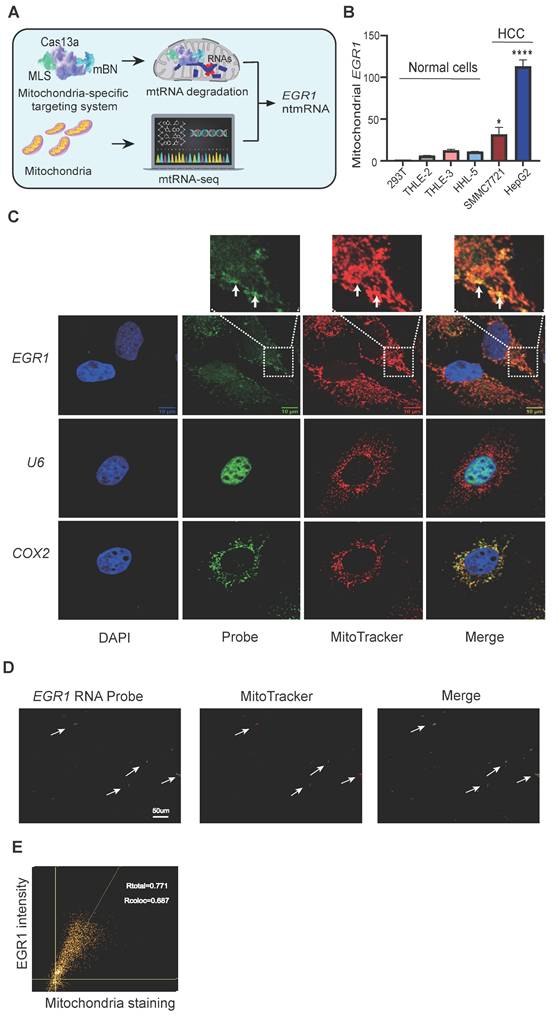
MtRNA-seq identified nuclear-encoded EGR1 mRNA, an immediate-early gene, as notably enriched in hepatoma mitochondria (Figure S1C). Mitochondria-specific depletion of EGR1 via Cas13a-gRNA-mBN-MLS impaired mitochondrial function. EGR1 mRNAs were not translated into peptides in mitochondria but functioned as non-translating mRNAs (ntmRNA) essential for mitophagy in HCC cells. Therefore, we focused on its metabolic role in HCC cells.
We confirmed aberrant mitochondrial localization of EGR1 ntmRNA. Quantitative PCR (Figure S2A) and RT-PCR (Figure S2B) validated enrichment in isolated hepatoma mitochondria, using mitochondria-encoded COX2 as a positive and nuclear U6 as a negative control. EGR1 ntmRNA was abundant in mitochondria from HepG2 and SMMC7721 cells but negligible in normal hepatic (THLE-2, THLE-3, HHL-5) and HEK293T cell mitochondria (Figure 1B).
RNA fluorescence in situ hybridization (RNA-FISH) showed mitochondrial colocalization of EGR1 ntmRNA (green) and MitoTracker (red) in HepG2 cells (Figure 1C, arrows), while U6 RNA was nuclear-localized. Similar results were obtained in SMMC7721 cells (Figure S2C-D). In addition, the abundance of total cellular EGR1 mRNA was also high in HCC cell lines as compared with normal hepatic cells (Figure S2E).
RNA-FISH on RNase A-treated isolated mitochondria further confirmed mitochondrial EGR1 ntmRNA presence (Figure 1D). Quantification using ImageJ demonstrated clear colocalization of EGR1 ntmRNA with mitochondria (Figure 1E).
Together, these findings demonstrate mitochondrial compartment-specific translocation of EGR1 ntmRNA distinct from the cytoplasmic mRNA pool.
Mitochondrial EGR1 ntmRNA does not act as a messenger RNA to encode EGR1 peptides
LncRNAs shuttle between nuclei and mitochondria as epigenetic messengers coordinating cell metabolism [40-43]. Nuclear-encoded mitochondrial lncRNAs (e.g., RNRP, MALAT1) function as anterograde signals, while mitochondrial-encoded nuclear lncRNAs (e.g., lncCytB) act as retrograde signals. EGR1 mRNA encodes a transcription factor mediating immediate-early stress responses; however, whether mitochondrial EGR1 mRNA acts as an anterograde signal or encodes peptides remains unclear (Figure S3A).
Thus, we first examined if EGR1 mRNAs, when shuttled to the mitochondria, could function as messenger RNA to encode an EGR1 peptide using the mitochondrial translation machinery. As an immediate-early response gene, EGR1 is activated when the cell is exposed to hypoxic stress. We first determined whether mitochondrial EGR1 mRNA translates into EGR1 protein. HepG2 cells were exposed to hypoxia, and mitochondrial fractions were isolated. Western blot analysis showed increased EGR1 protein in whole-cell extracts following hypoxia (Figure S3B, lanes 5-6), but no EGR1 protein was detected in mitochondrial fractions under normoxic or hypoxic conditions (Figure S3B, lanes 1-3). Thus, mitochondrial EGR1 mRNA does not serve as a canonical messenger RNA.
We confirmed these findings by immunofluorescence staining for EGR1 protein, observing nuclear but no mitochondrial localization under both normoxic and hypoxic conditions (Figure S3C). Collectively, these results exclude mitochondrial translation of EGR1 mRNA. Instead, EGR1 exhibits dual roles under hypoxia: canonical nuclear-ribosomal translation into peptides mediating stress responses, and non-canonical mitochondrial ntmRNA functions contributing to nucleus-mitochondria crosstalk (Figure S3A).
EGR1 ntmRNA maintains mitochondrial function in HCC cells
We next explored the non-canonical role of mitochondrial EGR1 ntmRNA in HCC cells using Cas13a-mBN-MLS targeting (Figure 2A). This approach specifically depleted mitochondrial EGR1 ntmRNA without significantly affecting cytoplasmic EGR1 levels (Figure 2B). Targeted mitochondrial EGR1 depletion significantly reduced ATP production (Figure 2C) and mitochondrial membrane potential in HepG2 cells, both under basal and CCCP-induced oxidative phosphorylation uncoupling conditions (Figure 2D).
Mitochondria-specific Cas13a-mBN-MLS targeting EGR1 ntmRNA disrupts mitochondrial functions in HCC cells. A Schematic diagram of the Cas13a-mBN-MLS targeting system. Cas13a: LwaCas-13a RNA-excision enzyme; gRNA: Cas13a guiding RNA; mBN: the mutant Barnase carrying D54A and H102A mutations. MLS: mitochondria-localization signal peptide derived from COX8A. The mitochondria-targeting system combines the advantages of RNA targeting specificity of Cas13a-gRNA, the RNase activity of mBN, and the mitochondria localization of MLS. The attachment of MLS facilitates the specific localization of the Cas13a-mBN in the mitochondria. B Quantitative PCR of EGR1 mRNAs in the mitochondria using the LwaCas13a-mtBN-MLS system. Cas13a-gCT: random Cas13a gRNA; Cas13a-gEGR1: EGR1-specific Cas13a gRNA. Note the specific knockdown of EGR1 in the mitochondria of HepG2 cells (left panel), while the level of EGR1 mRNA in the whole cell was not significantly affected (right panel). C Reduction of ATP production in Cas13a-mBN-MLS-treated HepG2 cells. Two Cas13a gRNAs, Cas13a-gEGR1-1, Cas13a-gEGR1-2, were used to target mitochondria EGR1 mRNAs. D Mitochondrial membrane potential in Cas13a-mBN-MLS-treated HepG2 cells. With or without the CCCP treatment, mitochondria were isolated from HCC cells for the measurement of mitochondrial membrane potential using fluorescent microplate reader. E The oxygen consumption rate (OCR) of EGR1-knockdown (Cas13a-gEGR1#1-3) and control (Cas13a-gCT) HepG2 cells were measured by the Seahorse. Specific knockdown of EGR1 in the mitochondria of HepG2 cells reduces the OCR. Basal respiration, spare respiratory capacity, and ATP production were measured by Seahorse. F The extracellular cellular acidification rate (ECAR) of HepG2 cells were measured by the Seahorse. No difference in ECAR was observed between Cas13a-gCT group and Cas13a-gEGR1#1-3 group. Glycolysis, glycolytic capacity and glycolytic reserve were also measured by Seahorse. G The key enzyme of mitochondrial respiration HK2, ENO1, PKM1, PGK1 and PDK1 were measured by qPCR between Cas13a-gCT group and Cas13a-gEGR1 group. H Extracellular lactate assessment was performed in Cas13a-gCT group and mitochondrial EGR1 targeting group (Cas13a-gEGR1-1, Cas13a-gEGR1-2, Cas13a-gEGR1-3). All data are presented as the mean ± S.D. from three independent experiments. Significant differences were determined by an unpaired two-tailed t-test (B-E) or two-way ANOVA with Tukey's multiple comparison test (G and H). * p < 0.05, ** p < 0.01, *** p < 0.001, **** p < 0.0001.
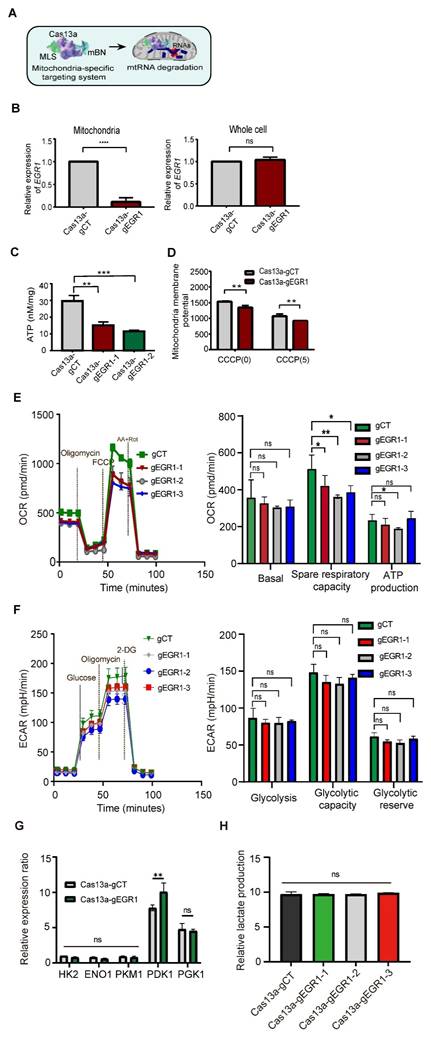
Seahorse XF Cell Mito Stress assays showed that mitochondrial EGR1 depletion reduced the spare respiratory capacity (Figure 2E) without significantly affecting glycolysis, as indicated by unchanged extracellular acidification rates (ECAR) (Figure 2F). Pyruvate dehydrogenase kinase 1 (PDK1), a key regulator linking glycolysis and mitochondrial oxidative phosphorylation, was upregulated upon mitochondrial EGR1 targeting, whereas other glycolysis-related enzymes remain unaffected (Figure 2G). Despite increased PDK1 expression, extracellular lactate levels did not significantly change (Figure 2H). These data suggest that mitochondrial EGR1 depletion may trigger compensatory metabolic adaptations-such as pyruvate flux redistribution or post-translational regulation of glycolytic enzymes to maintain energetic homeostasis without enhancing overall glycolytic output.
We validated these results using lentiviral shRNAs (shEGR1-1 and shEGR1-2) to knock down EGR1 expression (Figure S4A). Effective EGR1 knockdown was confirmed in HepG2 (Figure S4B) and SMMC7721 (Figure S5A) cells, leading to similar reductions in ATP levels and mitochondrial membrane potential (Figure S4C-D, Figure S5B-C). These data collectively highlight mitochondrial EGR1 ntmRNA as critical for maintaining mitochondrial function in HCC cells.
Mitochondria-specific targeting of EGR1 ntmRNA induces the accumulation of reactive oxygen species
Mitochondrial dysfunction often leads to increased reactive oxygen species (ROS) generation. To investigate whether mitochondrial EGR1 ntmRNA influences ROS production, we exposed HepG2 cells to hypoxia and used mitochondria-specific Cas13a-mBN-MLS targeting. Targeting mitochondrial EGR1 significantly elevated mitochondrial ROS levels (Figure 3A, right bottom panel).
Accumulation of reactive oxygen species in EGR1 knockdown HepG2 cells. A Reactive oxygen species (ROS) production in mitochondria was stained by MitoSOX™ (Molecular Probes). Cas13a-mBN-MLS-treated HepG2 cells and random Cas13a gRNA HepG2 cells were incubated under normoxic and hypoxic conditions for 24h and were then used for staining of ROS (red). B The rescue assay. SiCtrl control cells, siEGR1-treated cells and EGR1-rescue cells were cultured under hypoxic conditions for 12h and then used for ROS fluorescence staining using the ROS probe DCFDA/H2DCFDA (green), and MitoTracker Deep Red (MTDR). The yellow color indicates ROS within the mitochondria. Quantitative changes in the ROS green fluorescence intensity were analyzed by Image J. Scale bar: 20um. C Cellular ROS in HepG2 cells. ROS was examined using DCFDA probe followed by flow cytometry in the siCtrl (yellow), siEGR1 (blue) and siEGR1-rescue (pink) Groups.
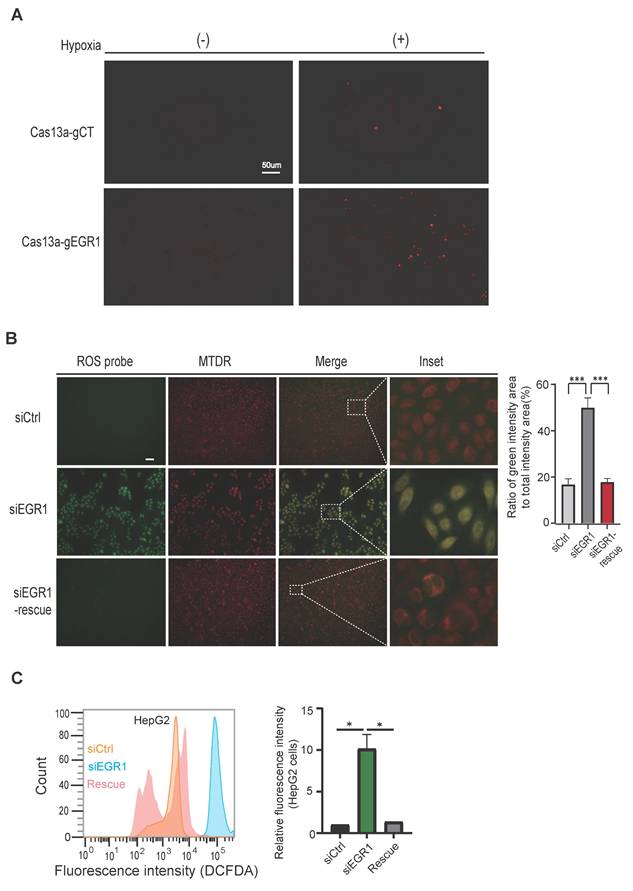
We confirmed this finding using siRNA-mediated EGR1 knockdown in live HepG2 cells. Mitochondria were labeled with Mito-Tracker Deep Red (MTDR, red) and ROS were stained with DCFH-DA (green). The merged images (yellow) indicated mitochondrial ROS accumulation, which was significantly increased in EGR1-knockdown cells (Figure 3B, middle panel). Partial rescue of ROS accumulation was achieved by transfecting an EGR1 expression plasmid (Figure 3B, bottom panel). Similar results were obtained in SMMC7721 hepatoma cells (Figure S5D, bottom panel).
Flow cytometry with the ROS-sensitive probe DCFDA further confirmed elevated ROS levels in EGR1-knockdown HepG2 and SMMC7721 cells, which returned to near-control levels upon EGR1 rescue (Figure 3C, Figure S5E). These findings demonstrate that mitochondrial EGR1 ntmRNA plays an essential role in maintaining mitochondrial function and controlling ROS production under hypoxic stress in HCC cells.
EGR1 ntmRNA is essential for hypoxia-mediated mitophagy
We next investigated the mechanism by which mitochondrial EGR1 ntmRNA regulates mitochondrial function. Mitophagy is critical for removing dysfunctional mitochondria, maintaining mitochondrial integrity, and supporting metabolic reprogramming in cancer cells. Given that targeting mitochondrial EGR1 impaired mitochondrial function and increased ROS production, we examined its impact on mitophagy in HCC.
First, we induced mitophagy by exposing HepG2 cells to hypoxia and assessed mitochondrial mass via immunofluorescence staining of TOM20, a mitochondrial import receptor subunit. Hypoxia reduced mitochondrial mass in control cells (Cas13a-gCT), whereas mitochondria-specific targeting of EGR1 significantly inhibited this reduction (Figure S6A, Figure S6C). Western blot analysis confirmed these findings, showing reduced COX4 protein levels in hypoxia-treated control cells, which was blocked by mitochondria-specific EGR1 depletion (Figure S6B, Figure S6D). Similarly, lentiviral shRNA-mediated EGR1 knockdown also reduced hypoxia-induced TOM20 and COX4 degradation (Figure S7A-D), which was restored upon EGR1 re-expression (Figure S7C-D). Thus, EGR1 ntmRNA is essential for hypoxia-induced mitophagy.
Second, immunofluorescence staining revealed that colocalization of the autophagosome marker LC3 (green) with mitochondrial TOM20 (red) decreased significantly upon EGR1 knockdown in HepG2 cells (Figure 4A-B), suggesting impaired mitophagy.
EGR1 is essential for mitophagy. A Colocalization of TOM20 and LC3 by immunofluorescent staining in siCtrl and siEGR1-treated HepG2 cells. Nuclei were stained with DPAI (blue), LC3 was immunostained in green, and TOM20 was immunostained in red. The overlapping portion of TOM20 and LC3 dye appears in yellow. Scale bar: 10μm. B Pearson's coefficient is shown as the quantification of LC3 puncta colocalized with TOM20 per cell in (A) (20 fields counted per group). C Mitophagy activity in HepG2 cells by the mt-Keima assay. Green dots represent the initial state of mitochondria, and red dots indicate mitochondria in lysosomes. A relatively increased ratio of red intensity area to total intensity area (red and green) suggests enhanced mitophagy. Scale bar: 50 μm. D Ratio of red intensity area to total intensity area (red and green) of mt-Keima from figure C (n = 4). E Changes in autophagic flux were observed in siCtrl and siEGR1 HepG2 cells under normoxic conditions and after 24-hour hypoxia treatment using confocal microscopy. The GFP signal (green) is quenched in the lysosomal environment, while the RFP signal (red) remains stable under acidic conditions. Therefore, autophagosomes (GFP⁺RFP⁺LC3 puncta) appear yellow (merged from green and red signals), and autolysosomes (GFP⁻RFP⁺LC3 puncta) appear red. By detecting and analyzing these distinct fluorescent signals, autophagic flux can be monitored. Scale bar: 10μm. F The manual counting method was used to quantify the number of red puncta and green puncta per HepG2 cell(n=3). G Transmission electron microscope (TEM) assay. HepG2 cells were exposed to hypoxia for 24 hours and were collected for the detection of autophagy-lysosomes under TEM. The hypoxia exposure induced the formation of autophagy-lysosomes engulfed with damaged mitochondria in shCtrl cells. Note the small and few autophagy-lysosomes in the shEGR1-treated group as compared with the shCtrl group. Data represents the mean ± SEM of three independent experiments. Significant differences were determined by an unpaired two-tailed t-test (B,D) or two-way ANOVA with Tukey's multiple comparison test (F). *p < 0.05, **p < 0.01, *** p < 0.001, **** p < 0.0001.
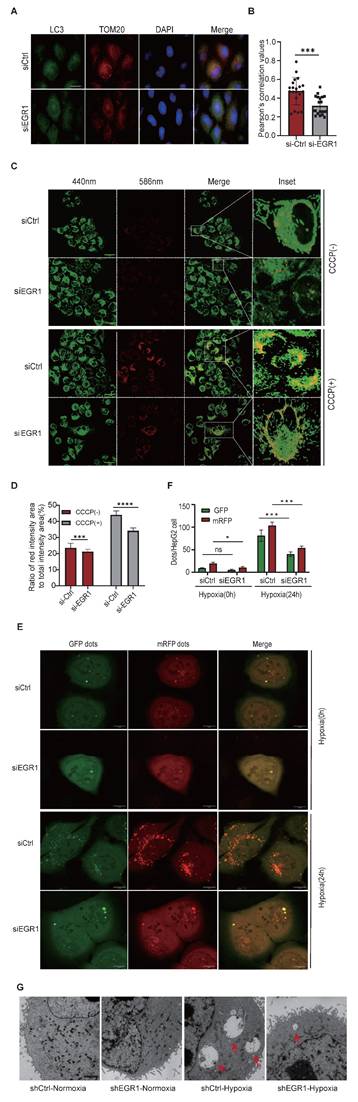
Third, using mt-Keima assays, we measured mitophagic flux following CCCP induction. CCCP treatment elevated mitophagy in control cells (siCtrl), as shown by increased red fluorescence. This enhanced mitophagic flux was significantly diminished in EGR1 knockdown cells (Figure 4C-D). Additionally, HepG2 cells expressing mRFP-GFP-LC3 exhibited increased autolysosome formation (red puncta) under hypoxia, whereas EGR1 knockdown markedly suppressed this process (Figure 4E-F), indicating reduced autophagic flux.
Finally, transmission electron microscopy (TEM) confirmed fewer autophagy-lysosome structures encapsulating damaged mitochondria in hypoxia-exposed EGR1-knockdown cells compared to control cells (Figure 4G). Notably, EGR1 ntmRNA had minimal effects under normoxia, consistent with low basal mitophagy levels in hepatoma cells.
Together, these findings demonstrate that mitochondrial EGR1 ntmRNA is critical for regulating hypoxia-induced mitophagy in hepatoma cells.
EGR1 is essential for autophagosome formation during mitophagy
Under mitochondrial stress, autophagosomes selectively recruit cargo receptors, such as SQSTM1/p62, Optineurin, and NDP52, to target ubiquitinated mitochondrial proteins via LC3 interaction. To clarify the role of EGR1 in autophagosome formation, we assessed LC3B-I/II, p62, Optineurin, and NDP52 protein levels following hypoxia. EGR1 knockdown prevented hypoxia-induced p62 degradation and blocked accumulation of lipidated LC3B-II, Optineurin, and NDP52 (Figure 5A; quantified in Figure 5B-C), indicating impaired autophagic flux.
EGR1 is essential for autophagosome formation during mitophagy. A Western blot of autophagosome formation proteins after 12h and 24h hypoxia. β-Actin was used as the control. B Quantitation of LC3B-II, normalized by the β-Actin level (n = 3 per group). C Quantitation of P62, NDP52, and Optineurin, normalized by β-Actin level (n = 3 per group). D Western blot of LC3B-II in the absence or presence of CCCP, BafilomycinA1, and E64+pepstatinA. E Quantitation of LC3B-II from figure D, normalized over the β-Actin level (n = 3 per group).
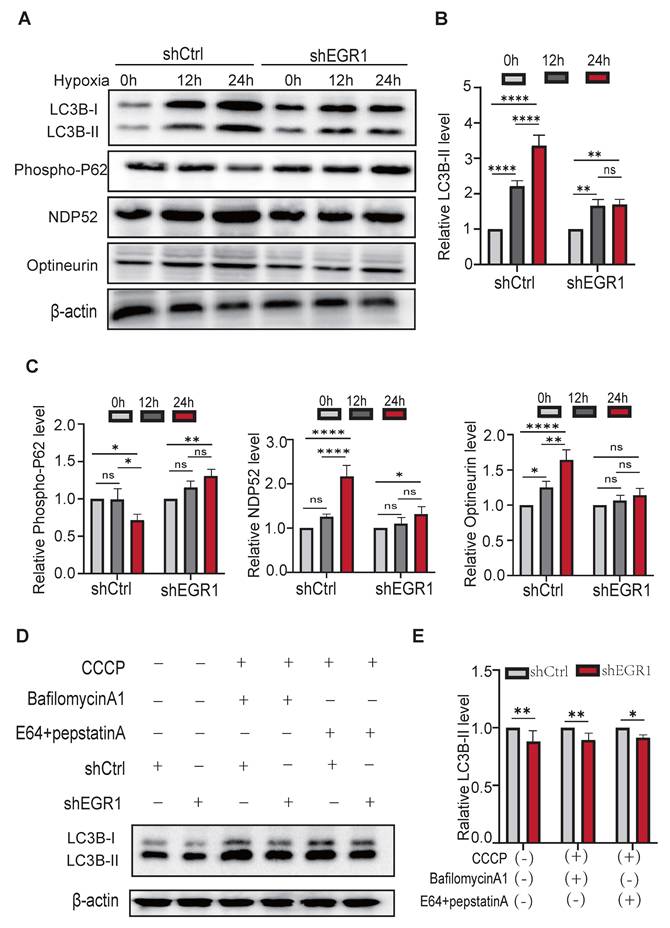
We further validated these results by inhibiting lysosomal degradation with bafilomycin A1 and pepstatin A + E64d (aloxistatin) (Figure 5D). Autophagic flux, assessed by LC3B-II accumulation, was significantly lower in EGR1-knockdown cells compared to controls, regardless of lysosomal inhibition (Figure 5E). Thus, reduced mitophagy in EGR1-deficient cells results primarily from impaired autophagosome formation rather than altered autophagolysosomal degradation.
EGR1 regulates mitophagy through the HIF-1α/BNIP3/NIX pathway
Under hypoxia, cells activate hypoxia-inducible factor 1α (HIF-1α), triggering mitophagy via BNIP3/NIX signaling. We assessed the role of EGR1 in this pathway by analyzing HIF-1α and downstream components in EGR1-knockdown HepG2 cells. Western blot confirmed effective EGR1 knockdown (Figure 6A-B), reducing HIF-1α, BNIP3, and NIX protein levels, which were restored upon EGR1 re-expression (Figure 6C, Figure 6E). Similarly, mitochondrial BNIP3/NIX proteins decreased significantly after EGR1 knockdown but recovered upon EGR1 rescue (Figure 6D, Figure 6F). Non-hypoxia-induced mitophagy regulators PINK1 and Parkin were unaffected (Figure 6D, Figure 6F).
EGR1 knockdown inhibits mitophagy through HIF-1α/BNIP3/BNIP3L pathway. A Western blot analysis was conducted to validate EGR1 protein knockdown efficiency and subsequent rescue. B Quantitation of Western blot results from A, normalized over the β-Actin level (n = 3 per group). C Western blot of HIF-1α protein and mitophagy pathway proteins in total cells. After 24h of hypoxic exposure, HepG2 cells, shCtrl cells, and EGR1 knockdown combined with HIF-1α overexpression cells were collected for the measurement of mitophagy pathway proteins. β-Actin was used as the control. D Western blot of mitophagy pathway proteins from the isolated mitochondria. Tom20 was used as the control. E Quantitation of Western blot results from Figure C, normalized over the β-Actin level (n = 3 per group). F Quantitation of Western blot results from Figure D, normalized over the TOM20 level (n = 3 per group). G Western blot of BNIP3/NIX in total cells and isolated mitochondria. H Quantitation of Western blot results from Figure G, normalized over the β-Actin or TOM20 level (n = 3 per group). I Quantitation of BNIP3 dimer and monomer in Cas13a-mtBN-MLS targeted HepG2 cells, normalized over the β-Actin or TOM20 level (n = 5 per group). Data represents the mean ± SEM of three independent experiments. Significant differences were determined by two-way ANOVA with Tukey's multiple comparison test (E and F) or an unpaired two-tailed t-test (H) * p < 0.05, ** p < 0.01, *** p < 0.001, **** p < 0.0001.
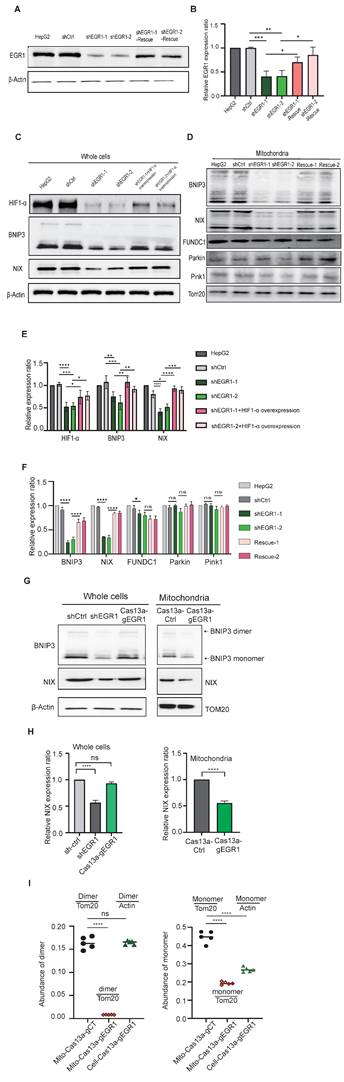
Using Cas13a-mBN-MLS for mitochondria-specific targeting of EGR1 ntmRNA, we found mitochondrial BNIP3/NIX expression was reduced without affecting cytoplasmic levels (Figure 6G-H). Additionally, mitochondrial EGR1 depletion inhibited BNIP3 dimerization (Figure 6G, Figure 6I), a critical step for mitophagy initiation. It is known that BNIP3 dimerization within the ER membrane is essential for lysosomal trafficking in mitophagy initiation and progression [44-46]. Thus, mitochondrial EGR1 ntmRNA promotes mitophagy primarily by regulating BNIP3 dimerization through the HIF-1α/BNIP3/NIX pathway.
EGR1 coordinates hypoxia-induced mitochondrial fission and fusion
Mitochondrial quality is regulated by balanced fission and fusion. During fission, phosphorylation of DRP1 at Ser616 and recruitment by mitochondrial fission factor (MFF) induce mitochondrial division, facilitating mitophagy. Conversely, phosphorylation at Ser637 inhibits DRP1-mediated fission, promoting mitochondrial fusion through MFN1/MFN2 and OPA1 [47-49]. Western blot analyses showed hypoxia-induced DRP1 (Ser616) and MFF upregulation were reduced by EGR1 knockdown, while fusion markers DRP1 (Ser637), MFN1/MFN2, and OPA1 increased significantly (Figure S8A, quantified in Figure S8B). Thus, EGR1 promotes mitophagy by enhancing mitochondrial fission and inhibiting fusion under hypoxia.
EGR1 interacts with mitochondrial BNIP3 and NIX under hypoxic stimulation
To clarify how mitochondrial EGR1 ntmRNA regulates mitophagy, we performed RNA immunoprecipitation (RIP), confirming direct interactions between mitochondrial EGR1 ntmRNA and mitophagy receptors BNIP3 (Figure 7A) and NIX (Figure S9A) in HepG2 and SMMC7721 cells. RNA-FISH and immunofluorescence assays further validated mitochondrial colocalization of EGR1 ntmRNA (green) with BNIP3/NIX proteins (red), significantly reduced upon EGR1 knockdown (Figure 7B-C, Figure S9B-E, Figure S10). These data suggest that mitochondrial EGR1 ntmRNA regulates mitophagy by interacting with BNIP3/NIX and recruiting them to the mitochondria.
EGR1 ntmRNA interacts with the mitophagy receptor BNIP3 in mitochondria. A EGR1 ntmRNA-BNIP3 interaction by the RIP assay. After exposure to hypoxia for 0h and 24h, HepG2 and SMMC7721 cells were collected, and the RIP assay was used to detect the interaction of EGR1 mRNA with the mitophagy receptor BNIP3. *** p<0.001 as compared with the IgG control group. B Colocalization of EGR1 mRNA with mitochondrial BNIP3 in HepG2 cells by RNA-FISH and immunofluorescent staining. The nuclei were stained with DAPI (blue) and mitochondria were labeled with MitoTracker (yellow). EGR1 mRNA was probed with Dig-labeled single-stranded DNA probes and was detected with FITC-coupled anti-dig antibody (green). Anti-BNIP3 antibodies were used to label BNIP3 proteins (Red). The overlapping portion of EGR1 mRNA with BNIP3 and NIX proteins appeared in yellow (enlarged windows). Scale bar: 10µm. C Quantitation of EGR1 ntmRNA-BNIP3 interaction yellow puncta numbers in HepG2 cells (fluorescent scanning of Figure B) (n = 4). D Identification of the BNIP3 binding element by RIP mapping. The BNIP3 interacting EGR1 RNA fragments were mapped by q-PCR using overlapping primers (bottom panel). For comparison, the value of the IgG control was set as 1. The F19 fragment contains a mitophagy receptor-binding element (MRE) to recruit BNIP3. E Synthetic EGR1 MRE (sMRE) bound to BNIP3 in vitro by Electrophoretic Mobility Shift Assay (EMSA). Red arrow: the EGR1 MRE-BNIP3 complex formed in the assay. F Synthetic MRE RNA oligonucleotide rescues the EGR1 depletion-induced loss of BNIP3 and its homo-dimerization in vitro. After EGR1 knockdown, the Western assay was performed to detect the abundance of BNIP3 protein and its dimmer. A synthetic RNA oligonucleotide derived from the 3'-end of EGR1 ntmRNA (SCTL) was used as the control, SP3 group, sMRE group and positive control group (shCTL). Quantitation of relative BNIP3 level was shown in the right panel. Data represents the mean ± SEM of three independent experiments. Significant differences were determined by an unpaired two-tailed t-test. ***p < 0.001, ****p < 0.0001.
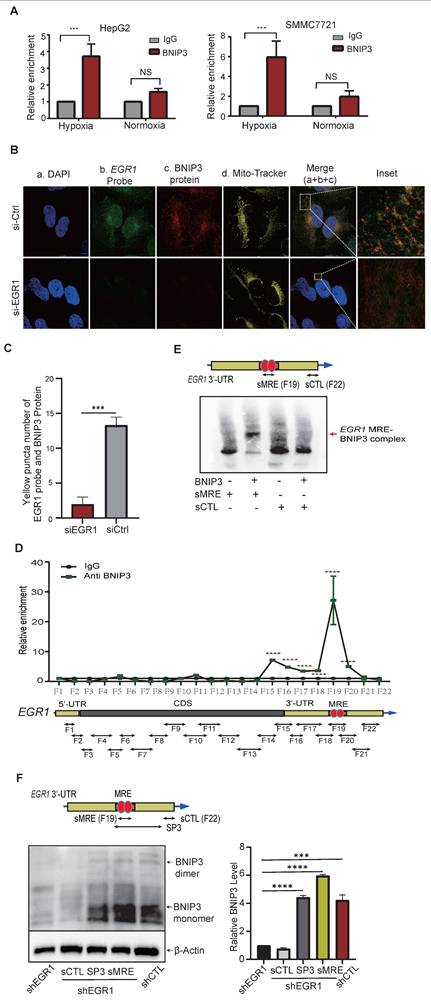
We further used a RIP in situ mapping assay [50] to identify the specific fragment of EGR1 ntmRNA that interacts with BNIP3. After crosslinking, HepG2 cells were lysed and were subjected to a longer sonication to break unbound RNAs. The BNIP3-binding RNAs were immunoprecipitated and were reverse transcribed. The BNIP3-interacting regions were mapped by 21 overlapping PCR reactions (Figure 7D, bottom panel). Using this approach, we identified a short 3'-UTR fragment (F19) that showed enriched BNIP3 binding signals (Figure 7D, top panel) as compared with the IgG control.
EGR1 ntmRNA utilizes its 3'-UTR MRE to enhance BNIP3 dimerization
We employed electrophoretic mobility shift assays (EMSA) to confirm that fragment F19 in the EGR1 3'-UTR contains a mitophagy receptor-binding element (MRE). A synthetic short MRE oligonucleotide (sMRE) specifically bound BNIP3 protein, forming a distinct complex not seen with a control sequence (sCTL) (Figure 7E, Figure S11A).
We further validated the functional role of sMRE in HepG2 cells. EGR1 knockdown reduced BNIP3 expression and dimerization, while sMRE transfection effectively rescued BNIP3 dimerization, comparable to controls. The control oligonucleotide (sCTL) had no rescuing effect (Figure 7F).
Three-dimensional structure modeling of EGR1 MRE-BNIP3 interaction
To further explore the mechanisms by which EGR1 ntmRNA regulates BNIP3 dimerization, we utilized automated computational frameworks to predict three-dimensional (3D) structures of EGR1 MRE and BNIP3 monomer interaction (Figure S11A-12B). Notably, with docking analyses to generate models of interactions between the EGR1 MRE and BNIP3 protein, we demonstrated a high binding affinity model with a docking score of -372.36 (Figure S11C). Interaction analyses using PyMOL revealed notable hydrogen bonds between EGR1 nucleotides A69, C71, and G150 and BNIP3 amino acid residues Ser173, Lys177, Lys176, and Gln139 with hydrogen bonds ranging from 2.2 to 3.3 Å (Figure S11D), indicating a strong and specific interaction. Additional simulations assessed the dynamic stability of the interactions, confirming that the identified binding conformation was dynamically stable throughout extended simulation periods, thereby further validating the docking results.
In addition, we also predicted the interaction between the EGR1 MRE and BNIP3 protein dimer (Figure S12A-B). Interestingly, we noted an even stronger binding affinity with a docking score of -423.95 (Figure S12C), suggesting a stronger interaction between EGR1 MRE and BNIP3 dimer. Interaction analysis using PyMOL identified crucial hydrogen bonds between EGR1 nucleotides A155, G154, A109, and T110 and amino acids Lys130, Lys135, and Arg139 on the chain A of BNIP3 dimeric protein, with distances ranging from 2.4 to 3.5 Å. Hydrogen bonds were also observed between EGR1 nucleotides C115, T60, and A56 and residues Lys130, Lys135, and Thr140 on the chain B of BNIP3 dimer, spanning 2.4 to 3.3 Å (Figure S13A). These findings indicate a tight binding interaction between EGR1 ntmRNA and BNIP3 dimer protein.
Finally, we performed an in vitro dimerization assay to verify the role of EGR1 ntmRNA in BNIP3 dimerization (Figure S13B). In this assay, mitochondria were isolated from hypoxic HepG2 cells and were incubated with recombinant BNIP3 protein in the presence of EGR1 ntmRNA. A random RNA (CtRNA) was synthesized as RNA control. BNIP3 dimerization was detected by the Western Blot. Using this in vitro system, we verified that EGR1 ntmRNA enhanced the BNIP3 dimerization in isolated mitochondria (Figure S13B, lane 4) as compared with the RNA control (lane 5).
Collectively, these data suggest that EGR1 ntmRNA may regulate mitophagy initiation and progression in part by coordinating the recruitment and dimerization of BNIP3 mitophagy receptors to the mitochondria.
EGR1 knockdown affects biological behaviors of hepatoma cells in vitro
Mitochondrial dysfunction is closely linked to tumor progression and metastasis. Given the essential role of mitochondrial EGR1 ntmRNA in mitophagy and mitochondrial function, we assessed the impact of EGR1 knockdown on malignant behaviors of hepatoma cells. Using HepG2 and SMMC7721 cells, EGR1 knockdown significantly suppressed cell proliferation, migration, invasion, and colony formation in vitro (Figure S14A-G). Consistent results were obtained with mitochondria-specific EGR1 depletion (Figure S15A-G). However, transfection with the EGR1 ntmRNA MRE fragment (sMRE) did not significantly reverse these impaired malignant phenotypes (Figure S15A-G). Moreover, EGR1 knockdown synergistically enhanced the anti-proliferative effect of lenvatinib in HCC cells (Figure S15G). However, under the current experimental conditions, this synergy did not translate into significant effects in colony formation or migration/invasion assays. This divergence likely reflects the distinct biological processes assessed: proliferation assays capture acute responses to metabolic stress and cell cycle perturbation, which are more immediately impacted by mitochondrial dysfunction or drug action, whereas colony formation and migration/invasion depend on long-term survival and cytoskeletal remodeling, requiring sustained genetic or epigenetic reprogramming.
Additionally, apoptotic pathway analysis revealed increased expression of apoptotic markers (Cytochrome C, PARP, cleaved PARP, Caspase-3, cleaved Caspase-3, Bax) and decreased anti-apoptotic protein BCL-2 in EGR1-knockdown cells (Figure S14H-I), indicating that EGR1 depletion promotes apoptosis in hepatoma cells.
Knockdown of EGR1 inhibits xenograft tumor growth in vivo
To further confirm the role of EGR1 in tumor growth, we established nude mouse subcutaneous xenograft models using Cas13a-mBN-MLS-mediated mitochondria-specific EGR1 targeting and shRNA-mediated cellular EGR1 knockdown. Both approaches significantly inhibited tumor growth rate and reduced tumor volume compared to controls (Figure 8A-C), aligning well with the in vitro results.
The role of EGR1 in xenograft tumor growth in nude mice. A Photography of subcutaneous xenograft tumors. B Tumor growth curves of subcutaneous tumors in nude mice. C Tumor weights of subcutaneous tumors after mice were sacrificed at the end of the study. D Expression of LC3B/P62 in subcutaneous tumor mitochondria by Western blot. TOM20 was used as the control. E Quantitation of mitochondria LC3B/P62. F The model of EGR1 ntmRNA in the regulation of mitophagy in HCC cells. Hypoxia induces the expression of EGR1 and HIF-1α. In addition to translating into EGR1 protein to mediate the response to stress, however, some EGR1 mRNA molecules are aberrantly translocated to mitochondria, where they function as ntmRNA and harness a noncanonical noncoding mechanism to regulate mitophagy in HCC cells. EGR1 ntmRNA promotes mitophagy through the HIF-1α/BNIP3/NIX pathway. Mechanistically, mitochondrial EGR1 ntmRNA recruits mitophagy receptor BNIP3 to the mitochondria membrane and coordinate the formation of BNIP3 homo-dimerization. Ubiquitinated proteins are recognized by selective cargo receptors, including p62, Optineurin, and NDP52. Autophagy cargo receptors containing an LC3-interacting region (LIR) bind to LC3 family members and target the autophagosome. Finally, the autophagosome fuses with the lysosome to form mitophagosome-lysosome, which degrades mitochondria. Thus, EGR1 ntmRNA may regulate hypoxia-induced metabolic reprograming directly in HCC mitochondria via a noncanonical noncoding pathway, in addition to the canonical coding function of EGR1 peptides in ribosomes to initiate the immediate early response to stress. Significant differences were determined by an unpaired two-tailed t-test (C) or two-way ANOVA with Tukey's multiple comparison test (B, E). ***P < 0.001, ****P < 0.0001.
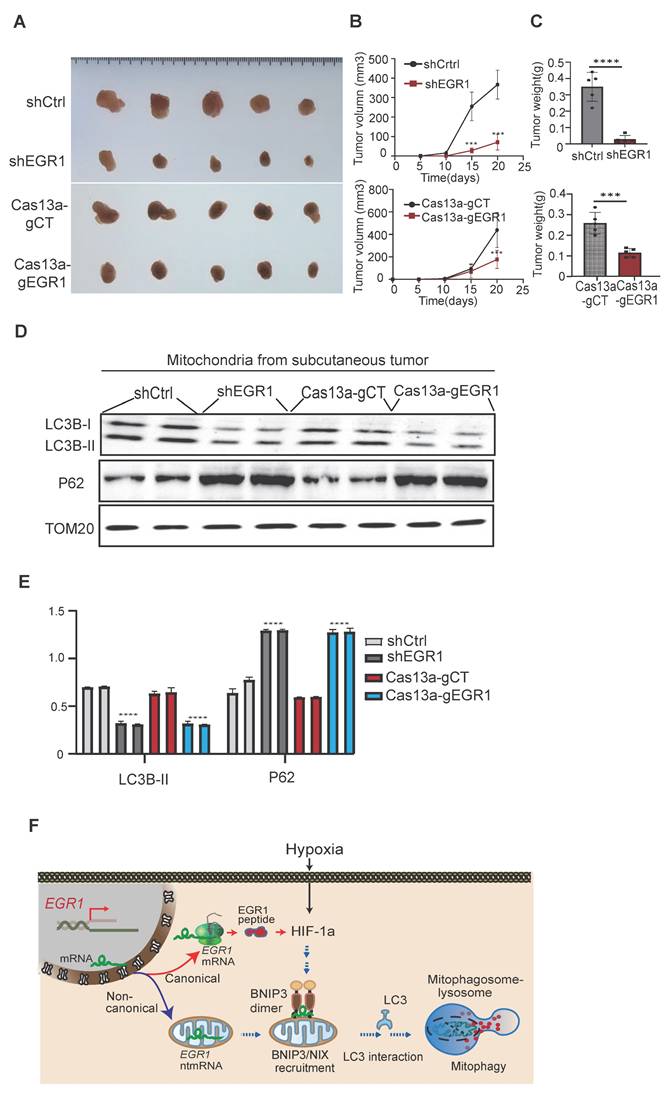
Western blot analysis of tumor tissues revealed decreased LC3B and increased p62 protein levels in EGR1 knockdown groups (Cas13a-gEGR1 and shEGR1), confirming that EGR1 regulates tumor growth via the mitophagy pathway (Figure 8D-E). Future studies are needed to compare the synergistic effects of shEGR1 or Cas13a gEGR1 with targeted drugs in HCC.
Discussion
Little is known about the regulation of mitophagy adaptive response to the hypoxic stress as encountered in the tumor microenvironment. For the first time, we have identified EGR1 ntmRNA as a non-canonical RNA factor that bridges the hypoxia-mitophagy pathway by coordinating the nucleus-mitochondria-ribosome crosstalk in HCC cells (Figure 8F). In the canonical ribosome pathway, EGR1 mRNA encodes a vital protein factor that is transported back to the nucleus and initiates an immediate early response to the hypoxia stress through the HIF-1α pathway. However, under hypoxic stress, some EGR1 ntmRNA molecules are translocated to the mitochondria of HCC cells. These translocated mRNA molecules are not translated using mitochondrial translation machinery. Instead, they function as essential non-translating mRNAs to regulate the mitophagy pathway in HCC cells. Mitochondrial knockdown of EGR1, whether using LwaCas13a-BN-MLS mitochondrial RNA targeting or shRNA, significantly inhibits mitophagy in HCC cells. Depletion of EGR1 leads to the accumulation of damaged mitochondria, in parallel with mitochondrial dysfunction, including decreased ATP production, increased ROS production, and decreased mitochondrial membrane potential. Similarly, loss of EGR1, either specifically in mitochondria or at the cellular level, inhibits tumor growth both in vitro and in nude mice. Importantly, we show that EGR1 noncoding mRNA molecules utilize their 3'-UTR MRE to recruit mitophagy receptors BNIP3 as well as NIX to mitochondria under hypoxia stimulation. Particularly, EGR1 ntmRNA coordinates the dimerization of BNIP3 mitophagy receptors on mitochondria, regulating mitophagy initiation and progression (Figure 8F). This study provides the first evidence that in addition to its canonical protein coding function, the nuclear genome encoded EGR1 mRNA may play a non-canonical role in regulating mitophagy through an epigenetic pathway, acting like a long noncoding RNA.
As mitophagy receptors, BNIP3 and NIX function to recruit key autophagy proteins LC3 to the surface of targeted mitochondria for autophagosomal degradation. The N-terminal soluble portion of BNIP3 contains a canonical LC3-interacting region (LIR) motif required for mitophagy. In addition, its C-terminal also contains the transmembrane domain that is essential for the membrane localization and BNIP3 homodimerization required for lysosomal delivery in mitophagy activation [44, 46]. Interestingly, we found that mitochondria-specific targeting of EGR1 ntmRNA inhibited the dimerization of BNIP3. Using RIP-RNase-seq mapping and EMSA assays, we showed that EGR1 ntmRNA interacted with BNIP3 through a mitophagy receptor-binding element (MRE) in its 3'-UTR. Knockdown of EGR1 ntmRNA affected mitophagy by reducing BNIP3 and its dimerization in HepG2 cells. However, transfection of a synthetic MRE nucleotide was able to rescue the BNIP3 dimerization. Thus, our data suggests that EGR1 ntmRNA may use its 3'-UTR MRE to regulate mitophagy by coordinating the recruitment and dimerization of BNIP3 mitophagy receptors to the mitochondria.
Mitophagy is an important biological process by which eukaryotic cells degrade long-lived proteins, misfolded proteins and damaged organelles. Mitophagy consists of several steps, in the early stage, permeability transition occurs after mitochondrial damage, which leads to mitochondrial depolarization and induces mitophagy-related protein activation; and then, autophagosomes wrap around damaged mitochondria, forming mitophagosomes. In the middle stage, mitophagosomes fuse with lysosomes.
Mitophagy flow is a dynamic process, in which these steps appear continuously in the cell. If any step of mitophagy flow is interrupted, mitophagy will not be able to complete its biological function. The activation or inhibition of mitophagy flow can often lead to distinct biological effects. Mitophagy flow blocking in different tissues and organs often leads to disease, including tumors, neurodegenerative diseases, muscle disease [47-49]. There are some difficulties in the detection of mitophagic flow. At present, the most widely used method for the detection of mitophagy flow is the detection of LC3BI/II protein by Western blot. However, if there are no drugs that prevent the fusion of the autophagosome to the lysosome and their subsequent degradation, the observed changes in LC3BI/II cannot truly reflect the intracellular mitophagy flow status. For example, we are not sure whether the decrease in LC3B-II expression was caused by either a reduced engulfment of mitochondrial fragments by autolysosomes or an enhanced degradation of mitolysosomes. The detection methods of mitophagy flow are relatively complex, and the single application of a certain method often cannot achieve systematic detection of mitophagy flow, so it is necessary to choose a variety of different experimental methods. In this study, we used the lysosomal degradation inhibitors bafilomycinA1 and pepstatinA+E64d (aloxistatin) which prevents the fusion of the autophagosome to the lysosome and their subsequent degradation, the amount of LC3B-II in the EGR1 knockdown group was still less than that in the control group, indicating that EGR1 knock down regulates mitophagy by reducing the formation of autophagosomes rather than increasing the degradation of autophagolysosome. We also analyzed the colocalization of LC3 and the marker of mitochondria (TOM20) by immunofluorescence. Mitochondrial targeted and pH-sensitive fluorescent protein (mito-Kemia) are also used in this study to prove that damaged mitochondria were engulfed by autophaosomes and lysosomes. We demonstrate that EGR1 mRNA molecules are an essential component in the regulation of mitophagy. Following exposure to hypoxia, HepG2 cells activate the mitophagy pathway to reduce mitochondrial mass thereby limiting ROS generation and maximizing the efficient use of available oxygen. After EGR1 knockdown, HepG2 cells demonstrate a dramatic accumulation of reactive oxygen species. In the absence of EGR1, mitophagy becomes dysregulated in HepG2 cells.
Mitophagy is highly regulated through the tight coordination of multiple signaling pathways [51-54]. It is initiated by mitochondrial priming through the Pink1-Parkin signaling pathway or through the mitophagic receptors NIX and BNIP3. A portion of the response can be mediated by receptors that possess C-terminal transmembrane domains localized at the OMM, including BNIP3, NIX and FUNDC1. BNIP3 and NIX are induced by HIF-1 following exposure to hypoxia and are activated by the Foxo3 transcription factor during starvation. Both BNIP3 and NIX contain a typical LC3-interacting region (LIR) motif that interacts directly with LC3/GABARAP and recruits the autophagy machinery to the primed damaged mitochondria [55, 56]. FUNDC1 also has an essential role in hypoxia-induced mitophagy via ATG5, but not Beclin 1. Functioning as a mitophagy receptor in mammalian cells, FUNDC1 directly interacts with LC3 and LC3 homologs via its LIR domain [57]. In the Pink1-Parkin pathway, Pink1 encodes the PTEN-induced kinase, a serine/threonine kinase with a mitochondrial targeting sequence, whereas Parkin is an E3 ubiquitin ligase [56, 58]. A subset of outer mitochondrial membrane proteins including VDAC and Mfn 1 and 2 can be ubiquitinated in a Parkin-dependent manner. p62 is recruited to the ubiquitinated mitochondria in CCCP-treated Parkin-positive cells, most likely due to its C-terminal ubiquitin binding domain. Upon mitochondrial membrane depolarization, proteasomes can be recruited to the mitochondria in a Parkin-dependent manner, which leads to the degradation of the mitochondrial outer membrane and the intermembrane space proteins, but not the inner-membrane and matrix proteins. In this study, we showed that EGR1 regulates mitophagy primarily through the BNIP3/NIX pathway. In this pathway, EGR1 noncoding mRNA molecules interact with both BNIP3 and NIX to help coordinate the recruitment of these mitophagy receptors to the mitochondria membrane under hypoxia stimulation. Notably, we found that the overexpression of BNIP3 or NIX in EGR1 knockdown cell lines could not revert the repression of mitophagy. Therefore, the mitophagy promoting effect of EGR1 may not depend entirely on BNIP3 or NIX. The other regulatory pathways only account for a small portion of mitophagy activity in EGR1-knockdown cells.
EGR1 encodes a nuclear transcriptional regulatory protein belonging to the C2H2-type zinc finger-containing EGR family. This zinc-finger transcription factor binds to the conserved DNA motif sequence GCG(T/G)GGGCG in the promoters of target genes and coordinates the response to a variety of stress stimuli [59, 60]. Like other coding mRNAs, EGR1 mRNAs are present in the cytoplasm where they are translated into EGR1 peptides on ribosomes. However, using ribosome RNA sequencing and quantitative PCR as well as RNA-FISH confirmation, we now show that EGR1 mRNA can be translocated into the mitochondria of HepG2 cells where it may play a non-canonical role in regulating the function of mitochondria through a heretofore unknown “non-translating mRNA” (ntmRNA) pathway. This function represents an entirely new role for an mRNA molecule and suggests that cancer cells can hijack RNAs for novel functions. Interestingly, the transfection of synthetic EGR1 ntmRNA MRE fragments (sMRE) did not significantly rescue the impaired malignant phenotypes observed after mitochondrial EGR1 knockdown (Figure S15A-G). This limited functional recovery might be due to technical challenges in efficiently delivering sMRE fragments specifically to mitochondria, rather than an indication of their biological insignificance.
It should be noted that EGR1 has been reported to exhibit both tumor-suppressive and pro-oncogenic properties in HCC, a duality largely shaped by the cellular signaling context, including microenvironmental cues such as hypoxia. In our study, we observed a marked upregulation of EGR1 mRNA under hypoxic conditions in HCC cells, supporting its context-dependent regulatory function during tumor adaptation to stress.
In summary, EGR1 is an essential coordinator in response to a variety of stress stimuli, including hypoxia, oxidative stress, DNA damage, ischemia, physical forces, growth factors, cytokines, and tissue injury. The specific role of EGR1 in tumors, including HCC, remains elusive [34, 61-67]. The findings from this study suggest that EGR1 may play an oncogenic role in HCC cells by coordinating the nucleus-mitochondria-ribosome crosstalk. Upon exposure to hypoxia, the EGR1 gene is activated in the nucleus and encodes EGR1 mRNA molecules. Through the canonical ribosome pathway, EGR1 mRNAs are translated into EGR1 peptides that initiate mitophagy through HIF-1α in the nucleus. However, some ntmRNA are translocated into mitochondria, where they epigenetically regulate mitophagy through the BNIP3/NIX pathway. Mechanistically, the mitochondria-localized EGR1 ntmRNA utilizes a 3'-UTR MRE element to coordinate the recruitment and dimerization process of mitophagy receptor BNIP3 to mitochondria. Our study thus suggests a novel non-canonical genetic pathway where EGR1 ntmRNA has a noncoding function in mitochondria. Hence, EGR1 plays an essential role in maintaining a healthy mitochondrial network through the tight coordination of the genetic messages within the nucleus-ribosome-mitochondria axis.
Materials and Methods
Cell culture
HepG2, SMMC7721, THLE-2, THLE-3, HHL-5, and 293T cells were obtained from ATCC or BLUEBIO. Cells were cultured in Dulbecco's Modified Eagle Medium (DMEM, Thermo Fisher) containing 10% FBS and 1% penicillin/streptomycin at 37°C with 5% CO2. HL7702 cells were maintained similarly in RPMI-1640.
Animal studies
Animal procedures were approved by The First Hospital of Jilin University ethics committee. Twenty 5-week-old female BALB/c nude mice were divided into four groups (n=5/group): Cas13a-gCT control, Cas13a-gEGR1, shCtrl, and shEGR1. HepG2 cells (5 × 10^5 in 100 μl PBS) were subcutaneously injected. Tumor volumes were measured every 5 days (volume = length × width²/2). Mice were sacrificed on day 21 for tumor analysis.
Hypoxia treatment
Cells were incubated in a modular hypoxia chamber (Billups-Rothenberg) flushed with hypoxic gas (1% O2, 5% CO2, 94% N2) at 5 L/min.
Mitochondrial isolation and RNA sequencing
Mitochondria were isolated using a modified Qproteome Mitochondria Isolation Kit (QIAGEN). RNase A treatment eliminated cytoplasmic RNAs. RNA extraction from mitochondria and whole cells was performed using TRIzol (Invitrogen). cDNA synthesis followed DNase I digestion using M-MLV reverse transcriptase. Mitochondrial purity was confirmed by qPCR (COX2 positive, U6 negative). RNA sequencing used HiSeq4000 (Illumina), selecting genes with fold-change >2, p<0.05, and FPKM>50.
Quantitative real-time PCR (qPCR)
Real-time PCR utilized FastStart SYBR Green Master Mix (Sigma) on an ABI Prism 7900HT system. Gene expression was normalized against mitochondrial COX2 or cellular β-actin. Primer sequences are listed in Table S1.
RNA-FISH assay
RNA-FISH utilized antisense DNA probes labeled with digoxigenin. RNAs in mitochondria were detected with anti-digoxigenin-fluorescein and visualized with MitoTracker Red CMXRos.
Immunofluorescence (IF)
Cells were fixed (4% paraformaldehyde), permeabilized (0.5% Triton X-100), and blocked (1% BSA). Samples were incubated with primary antibodies (EGR1, TOM20) and Alexa Fluor-conjugated secondary antibodies. Hoechst 33258 stained nuclei, and images were acquired with a Zeiss AxioCam.
RNA immunoprecipitation (RIP)
RIP assays used the Magna RIP Kit (EMD Millipore). Lysates from HepG2 and SMMC7721 cells were immunoprecipitated with anti-BNIP3/NIX antibodies. RNA was isolated and detected by RT-qPCR. Rabbit IgG was the negative control.
Mitochondria-specific RNA knockdown
Cas13a-mBN-MLS system targeted mitochondrial EGR1 ntmRNA. Lentiviruses carried mitochondria-localized Cas13a fused with mutant Barnase (mBN) and MLS from COX8A. EGR1-targeting gRNAs and negative controls were cloned into lentiviral vectors. Transfected cells underwent puromycin selection.
Cell transfection
Lentiviral shRNAs, siRNAs, and plasmids for EGR1, BNIP3, NIX, and HIF-1α were transfected using Lipofectamine 2000 (Invitrogen). shRNAs targeted EGR1, with random sequences as controls. Selection was by puromycin.
Mitochondrial function assays
ATP, mitochondrial superoxide, mitochondrial membrane potential (JC-1), ROS (DCFDA, MitoSOX), OCR, and ECAR assays followed manufacturers' protocols (Beyotime, Abcam, Agilent Seahorse XF24e).
Mitophagy and autophagic flux assays
Mitophagy was assessed using mt-Keima and mRFP-GFP-LC3 lentiviruses. Cells were treated with CCCP or hypoxia, and fluorescence signals were analyzed via confocal microscopy.
Electrophoretic mobility shift assay (EMSA)
EMSA utilized the LightShift RNA EMSA Kit (Thermo Scientific). RNA-protein binding was detected with chemiluminescence.
In vitro BNIP3 dimerization
Isolated mitochondria were incubated with EGR1 ntmRNA or control RNA and recombinant BNIP3 protein. BNIP3 dimerization was assessed by Western blot.
Structural prediction of RNA-protein interactions
Computational modeling used 3dRNA/DNA, 3dRPC, ASPDock, and HDOCK. Models were refined with DISCOVERY STUDIO 2019, and interactions were visualized using PyMOL.
Western blot analysis
Protein lysates were resolved by SDS-PAGE, transferred to PVDF membranes, blocked, and incubated with primary/secondary antibodies. Chemiluminescence detection was quantified with ImageJ. Antibodies are listed in Table S2.
Transmission electron microscopy
Cells were fixed (4% glutaraldehyde), post-fixed (2% osmium tetroxide), dehydrated, embedded in Spurr resin, sectioned, stained (uranyl acetate/lead citrate), and observed by TEM (HITACHI H-7650).
Cell proliferation, colony formation, migration, and invasion
Proliferation (CCK-8), colony formation, Transwell invasion, and wound-healing assays were performed as described, quantifying cell growth, clonogenicity, invasion, and migration abilities.
Statistical analysis
Data presented as mean ± SD. Differences assessed by Student's t-test or ANOVA (Bonferroni correction). Significance set at p<0.05, analyzed using GraphPad Prism 7.
Abbreviations
EGR1: early growth response 1; HCC: hepatocellular carcinoma; LwaCas13a-BN-MLS: the LwaCas13a-Barnase mutant-mitochondrial localization signal peptide mitochondrial RNA targeting system; ROS: reactive oxygen species; BLIP3: BCL2/adenovirus E1B 19 kDa protein-interacting protein 3; FISH: fluorescence in situ hybridization; TEM: transmission electron microscope; FUNDC1: FUN14 domain containing 1; RIP: RNA chromatin immunoprecipitation; OMM: outer mitochondrial membrane; Q-PCR: quantitative real-time PCR; IF: immunofluorescence; OCR: oxygen consumption rate; ECAR: extracellular acidification rate; EMSA: electrophoretic mobility shift assay; MRE: mitophagy receptor-binding element.
Supplementary Material
Supplementary figures and tables.
Acknowledgements
Funding
This work was supported by the National Key R&D Program of China (2018YFA0106902), National Natural Science Foundation of China (82303211, 8220110637, 82100168, 82050003, 31430021, 81874052, 31871297, 81670143, 81900701, 32000431, 82203312), the Key Project of Chinese Ministry of Education grant (311015), the National Basic Research Program of China (973 Program)(2015CB943303), Nation Key Research and Development Program of China grant (2016YFC13038000), Department of Science and Technology of Jilin Province (20250205033GH), California Institute of Regenerative Medicine (CIRM) grant (RT2-01942) and the Biomedical Research Service of the Department of Veterans Affairs (BX002905).
Availability of data and material
All data generated during this study are included in this published article and its supplementary files. The Raw FASTQ sequencing files comprised of three cell mitochondrial RNA datasets have been deposited to the NCBI Gene Expression Omnibus under accession numbers GSE119946.
Author contributions
J.F.H, A.R.H, W.L., and J.C. designed the research and supervised the project; Y.L. executed all experiments; Y.M. and M.L. performed statistical analysis of data; M.L. developed the Cas13a-mBN-MLS RNA targeting system; Y.Z, L.Z, S.L, L.J, Z.Y, C.F, S.Z. provided experimental technical support. Y.L. and J.F.H. wrote the manuscript. All authors read and approved the final manuscript.
Competing Interests
The authors have declared that no competing interest exists.
References
1. Roy S, Kumaravel S, Sharma A, Duran CL, Bayless KJ, Chakraborty S. Hypoxic tumor microenvironment: Implications for cancer therapy. Exp Biol Med (Maywood). 2020;245:1073-86
2. McAleese CE, Choudhury C, Butcher NJ, Minchin RF. Hypoxia-mediated drug resistance in breast cancers. Cancer Lett. 2021;502:189-199
3. Nagl L, Horvath L, Pircher A, Wolf D. Tumor Endothelial Cells (TECs) as potential immune directors of the tumor microenvironment - new findings and future perspectives. Front Cell Dev Biol. 2020;8:766
4. Muppala S. Significance of the tumor microenvironment in liver cancer progression. Crit Rev Oncog. 2020;25:1-9
5. Al Tameemi W, Dale TP, Al-Jumaily RMK, Forsyth NR. Hypoxia-modified cancer cell metabolism. Front Cell Dev Biol. 2019;7:4
6. Sun X, Lv X, Yan Y, Zhao Y, Ma R, He M. et al. Hypoxia-mediated cancer stem cell resistance and targeted therapy. Biomed Pharmacother. 2020;130:110623
7. Dzobo K, Senthebane DA, Ganz C, Thomford NE, Wonkam A, Dandara C. Advances in therapeutic targeting of cancer stem cells within the tumor microenvironment: an updated review. Cells. 2020;9(8):1896
8. Wei R, Liu S, Zhang S, Min L, Zhu S. Cellular and extracellular components in tumor microenvironment and their application in early diagnosis of cancers. Anal Cell Pathol (Amst). 2020;2020:6283796
9. Tirpe AA, Gulei D, Ciortea SM, Crivii C, Berindan-Neagoe I. Hypoxia: overview on hypoxia-mediated mechanisms with a focus on the role of hif genes. Int J Mol Sci. 2019;20(24):6140
10. Soni S, Padwad YS. HIF-1 in cancer therapy: two decade long story of a transcription factor. Acta Oncol. 2017;56:503-15
11. Pezzuto A, Carico E. Role of HIF-1 in cancer progression: novel insights. a review. Curr Mol Med. 2018;18:343-51
12. Bader JE, Voss K, Rathmell JC. Targeting metabolism to improve the tumor microenvironment for cancer immunotherapy. Mol Cell. 2020;78:1019-33
13. Santos N, Pereira-Nunes A, Baltazar F, Granja S. Lactate as a regulator of cancer inflammation and immunity. Immunometabolism. 2019;1:e190015
14. Kierans SJ, Taylor CT. Regulation of glycolysis by the hypoxia-inducible factor (HIF): implications for cellular physiology. J Physiol. 2021;599(1):23-37
15. Wang J, Ilyas S. Targeting the tumor microenvironment in cholangiocarcinoma: implications for therapy. Expert Opin Investig Drugs. 2021;30(4):429-438
16. Nguyen M, De Ninno A, Mencattini A, Mermet-Meillon F, Fornabaio G, Evans SS. et al. Dissecting effects of anti-cancer drugs and cancer-associated fibroblasts by on-chip reconstitution of immunocompetent tumor microenvironments. Cell Rep. 2018;25:3884-93 e3
17. Sahai E, Astsaturov I, Cukierman E, DeNardo DG, Egeblad M, Evans RM. et al. A framework for advancing our understanding of cancer-associated fibroblasts. Nat Rev Cancer. 2020;20:174-86
18. Pandey V, Storz P. Targeting the tumor microenvironment in pancreatic ductal adenocarcinoma. Expert Rev Anticancer Ther. 2019;19:473-82
19. Luo W, Wang Y. Hypoxia mediates tumor malignancy and therapy resistance. Adv Exp Med Biol. 2019;1136:1-18
20. Nagao A, Kobayashi M, Koyasu S, Chow CCT, Harada H. HIF-1-dependent reprogramming of glucose metabolic pathway of cancer cells and its therapeutic significance. Int Mol Sci. 2019;20(2):238
21. Iommarini L, Porcelli AM, Gasparre G, Kurelac I. Non-canonical mechanisms regulating hypoxia-inducible factor 1 alpha in cancer. Front Oncol. 2017;7:286
22. Grasso D, Zampieri LX, Capeloa T, Van de Velde JA, Sonveaux P. Mitochondria in cancer. Cell Stress. 2020;4:114-46
23. Gundamaraju R, Lu W, Manikam R. Revisiting mitochondria scored cancer progression and metastasis. Cancers (Basel). 2021;13(3):432
24. Lebelo MT, Joubert AM, Visagie MH. Warburg effect and its role in tumourigenesis. Arch Pharm Res. 2019;42:833-47
25. Kuang H, Lyu JH, Li T. Cholesterol metabolism and tumor radiotherapy. J Nutr Oncol. 2023;8:121-8
26. Lukyanova LD, Kirova YI. Mitochondria-controlled signaling mechanisms of brain protection in hypoxia. Front Neurosci. 2015;9:320
27. Majmundar AJ, Wong WJ, Simon MC. Hypoxia-inducible factors and the response to hypoxic stress. Mol Cell. 2010;40:294-309
28. Zhang K, Jiang MY, Liu KC, Dai YH, Bo ZD. Mitochondrial dysfunction and programmed cell death in osteosarcoma. J Nutr Oncol. 2024;9(2):37-45
29. Zhao Y, Sun L, Wang RR, Hu JF, Cui J. The effects of mitochondria-associated long noncoding RNAs in cancer mitochondria: New players in an old arena. Crit Rev Oncol Hematol. 2018;131:76-82
30. Zhao Y, Zhou L, Li X, Meng Y, Li Y, Liu M. et al. Nuclear-encoded lncRNA MALAT1 epigenetically controls metabolic reprogramming in hepatocellular carcinoma cells through the mitophagy pathway. Mol Ther Nucleic Acids. 2021;23:264-76
31. Zhao Y, Liu S, Li X, Zhou L, Meng Y, Li Y. et al. Aberrant shuttling of long noncoding RNAs during the mitochondria-nuclear crosstalk in hepatocellular carcinoma cells. Am J Cancer Res. 2019;9:999-1008
32. Sun L, Liu Y, Lin S, Shang J, Liu J, Li J. et al. Early growth response gene-1 and hypoxia-inducible factor-1alpha affect tumor metastasis via regulation of tissue factor. Acta Oncol. 2013;52:842-51
33. Sperandio S, Fortin J, Sasik R, Robitaille L, Corbeil J, de Belle I. The transcription factor Egr1 regulates the HIF-1alpha gene during hypoxia. Mol Carcinog. 2009;48:38-44
34. Peng WX, Xiong EM, Ge L, Wan YY, Zhang CL, Du FY. et al. Egr-1 promotes hypoxia-induced autophagy to enhance chemo-resistance of hepatocellular carcinoma cells. Exp Cell Res. 2016;340:62-70
35. Abudayyeh OO, Gootenberg JS, Essletzbichler P, Han S, Joung J, Belanto JJ. et al. RNA targeting with CRISPR-Cas13. Nature. 2017;550:280-4
36. Gootenberg JS, Abudayyeh OO, Lee JW, Essletzbichler P, Dy AJ, Joung J. et al. Nucleic acid detection with CRISPR-Cas13a/C2c2. Science. 2017;356:438-42
37. Fort A, Yamada D, Hashimoto K, Koseki H, Carninci P. Nuclear transcriptome profiling of induced pluripotent stem cells and embryonic stem cells identify non-coding loci resistant to reprogramming. Cell Cycle. 2015;14:1148-55
38. Ahmad S, Mu X, Yang F, Greenwald E, Park JW, Jacob E. et al. Breaching self-tolerance to alu duplex RNA underlies MDA5-mediated inflammation. Cell. 2018;172:797-810.e13
39. Sun J, Li W, Sun Y, Yu D, Wen X, Wang H. et al. A novel antisense long noncoding RNA within the IGF1R gene locus is imprinted in hematopoietic malignancies. Nucleic Acids Res. 2014;42:9588-601
40. Vendramin R, Marine JC, Leucci E. Non-coding RNAs: the dark side of nuclear-mitochondrial communication. Embo j. 2017;36:1123-33
41. Leucci E, Vendramin R, Spinazzi M, Laurette P, Fiers M, Wouters J. et al. Melanoma addiction to the long non-coding RNA SAMMSON. Nature. 2016;531:518-22
42. Dong Y, Yoshitomi T, Hu JF, Cui J. Long noncoding RNAs coordinate functions between mitochondria and the nucleus. Epigenetics Chromatin. 2017;10:41
43. Liu S, Jiao B, Zhao H, Liang X, Jin F, Liu X. et al. LncRNAs-circRNAs as rising epigenetic binary superstars in regulating lipid metabolic reprogramming of cancers. Adv Sci (Weinh). 2024;11:e2303570
44. Delgado JM, Shepard LW, Lamson SW, Liu SL, Shoemaker CJ. The ER membrane protein complex restricts mitophagy by controlling BNIP3 turnover. EMBO J. 2024;43:32-60
45. Delgado JM, Wallace Shepard L, Lamson SW, Liu SL, Shoemaker CJ. The ER membrane protein complex governs lysosomal turnover of a mitochondrial tail-anchored protein, BNIP3, to restrict mitophagy. bioRxiv. 2023. 2023 03.22.533681
46. Marinkovic M, Sprung M, Novak I. Dimerization of mitophagy receptor BNIP3L/NIX is essential for recruitment of autophagic machinery. Autophagy. 2021;17:1232-43
47. Vara-Perez M, Felipe-Abrio B, Agostinis P. Mitophagy in cancer: a tale of adaptation. Cells. 2019;8(5):493
48. Long M, McWilliams TG. Monitoring autophagy in cancer: From bench to bedside. Semin Cancer Biol. 2020;66:12-21
49. Ferro F, Servais S, Besson P, Roger S, Dumas JF, Brisson L. Autophagy and mitophagy in cancer metabolic remodelling. Semin Cell Dev Biol. 2020;98:129-38
50. Du Z, Wen X, Wang Y, Jia L, Zhang S, Liu Y. et al. Chromatin lncRNA Platr10 controls stem cell pluripotency by coordinating an intrachromosomal regulatory network. Genome Biol. 2021;22:272
51. Xie Y, Liu J, Kang R, Tang D. Mitophagy receptors in tumor biology. Front Cell Dev Biol. 2020;8:594203
52. Poole LP, Macleod KF. Mitophagy in tumorigenesis and metastasis. Cell Mol Life Sci. 2021;78(8):3817-3851
53. Drake LE, Springer MZ, Poole LP, Kim CJ, Macleod KF. Expanding perspectives on the significance of mitophagy in cancer. Semin Cancer Biol. 2017;47:110-24
54. Shi YH, Du J, Pan W, Zhang HY, Ba Y. Crosstalk between the tumor microenvironment and tumor cells through exosomes:Roles in tumor metabolism and progression. J Nutr Oncol. 2023;8(01):1-9
55. Xu Y, Shen J, Ran Z. Emerging views of mitophagy in immunity and autoimmune diseases. Autophagy. 2020;16:3-17
56. Yang X, Pan W, Xu G, Chen L. Mitophagy: A crucial modulator in the pathogenesis of chronic diseases. Clin Chim Acta. 2020;502:245-54
57. Qiu YH, Zhang TS, Wang XW, Wang MY, Zhao WX, Zhou HM. et al. Mitochondria autophagy: a potential target for cancer therapy. J Drug Target. 2021:1-16
58. Tanaka K. The PINK1-Parkin axis: An Overview. Neurosci Res. 2020;159:9-15
59. Duclot F, Kabbaj M. The Role of Early Growth Response 1 (EGR1) in brain plasticity and neuropsychiatric disorders. Front Behav Neurosci. 2017;11:35
60. Havis E, Duprez D. EGR1 transcription factor is a multifaceted regulator of matrix production in tendons and other connective tissues. Int J Mol Sci. 2020;21(5):1664
61. Li TT, Liu MR, Pei DS. Friend or foe, the role of EGR-1 in cancer. Med Oncol. 2019;37:7
62. Magee N, Zhang Y. Role of early growth response 1 in liver metabolism and liver cancer. Hepatoma Res. 2017;3:268-77
63. Ma Y, Han CC, Huang Q, Sun WY, Wei W. GRK2 overexpression inhibits IGF1-induced proliferation and migration of human hepatocellular carcinoma cells by downregulating EGR1. Oncol Rep. 2016;35:3068-74
64. Bi JG, Zheng JF, Li Q, Bao SY, Yu XF, Xu P. et al. MicroRNA-181a-5p suppresses cell proliferation by targeting Egr1 and inhibiting Egr1/TGF-β/Smad pathway in hepatocellular carcinoma. Int J Biochem Cell Biol. 2019;106:107-16
65. Pan M, Luo M, Liu L, Chen Y, Cheng Z, Wang K. et al. EGR1 suppresses HCC growth and aerobic glycolysis by transcriptionally downregulating PFKL. J Exp Clin Cancer Res. 2024;43:35
66. Li W, Li K, Wang Z, Fa Z. MicroRNA-377-3p promotes cell proliferation and inhibits cell cycle arrest and cell apoptosis in hepatocellular carcinoma by affecting EGR1-mediated p53 activation. Pathol Res Pract. 2022;234:153855
67. Min X, Lin F, Zhao X, Yu J, Ge C, Zhang S. et al. TENT5A mediates the cancer-inhibiting effects of EGR1 by suppressing the protein stability of RPL35 in hepatocellular carcinoma. Cell Oncol (Dordr). 2024;47:2247-64
Author contact
![]() Corresponding authors: Ji-Fan Hu, M.D., Ph.D., e-mail: hujifanedu.cn; jifanedu, or Jiuwei Cui, M.D., Ph.D., e-mail: cuijwedu.cn.
Corresponding authors: Ji-Fan Hu, M.D., Ph.D., e-mail: hujifanedu.cn; jifanedu, or Jiuwei Cui, M.D., Ph.D., e-mail: cuijwedu.cn.